23
Radford and Park 1 and Park Area Committee Report Unofficial December 2013 Data
Radford
and Park
1
and Park
Area Committee
Report
Unofficial December 2013
Data
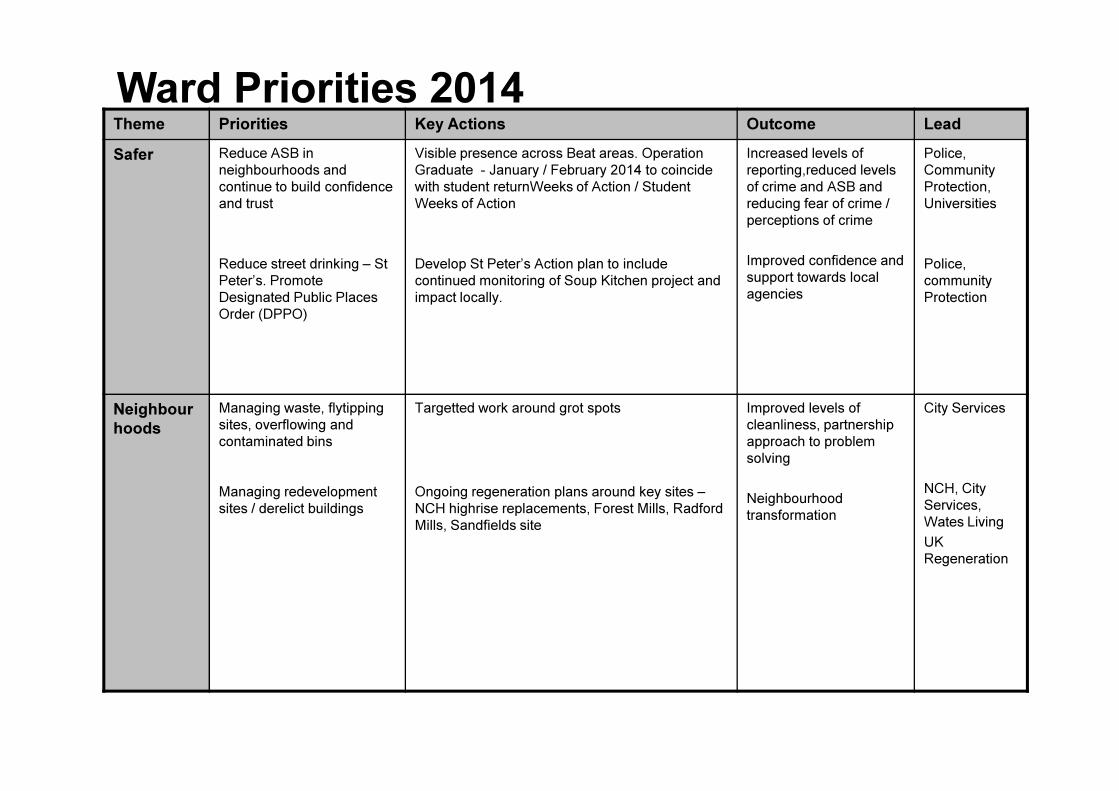
Ward Priorities 2014Theme Priorities Key Actions Outcome Lead
Safer Reduce ASB in
neighbourhoods and
continue to build confidence
and trust
Reduce street drinking – St
Peter’s. Promote
Designated Public Places
Order (DPPO)
Visible presence across Beat areas. Operation
Graduate - January / February 2014 to coincide
with student returnWeeks of Action / Student
Weeks of Action
Develop St Peter’s Action plan to include
continued monitoring of Soup Kitchen project and
impact locally.
Increased levels of
reporting,reduced levels
of crime and ASB and
reducing fear of crime /
perceptions of crime
Improved confidence and
support towards local
agencies
Police,
Community
Protection,
Universities
Police,
community
Protection
Neighbour
hoods
Managing waste, flytipping
sites, overflowing and
contaminated bins
Managing redevelopment
sites / derelict buildings
Targetted work around grot spots
Ongoing regeneration plans around key sites –
NCH highrise replacements, Forest Mills, Radford
Mills, Sandfields site
Improved levels of
cleanliness, partnership
approach to problem
solving
Neighbourhood
transformation
City Services
NCH, City
Services,
Wates Living
UK
Regeneration
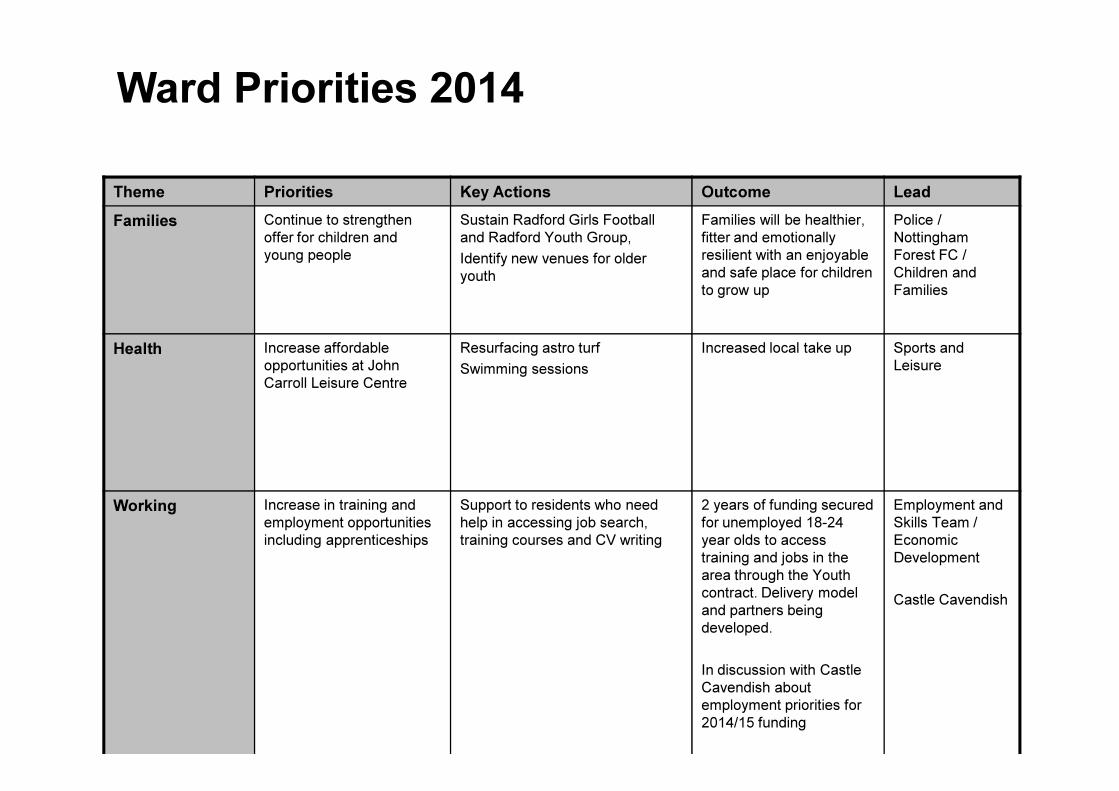
Ward Priorities 2014
Theme Priorities Key Actions Outcome Lead
Families Continue to strengthen
offer for children and
young people
Sustain Radford Girls Football
and Radford Youth Group,
Identify new venues for older
youth
Families will be healthier,
fitter and emotionally
resilient with an enjoyable
and safe place for children
to grow up
Police /
Nottingham
Forest FC /
Children and
Families
Health Increase affordable
opportunities at John
Carroll Leisure Centre
Resurfacing astro turf
Swimming sessions
Increased local take up Sports and
Leisure
Working Increase in training and
employment opportunities
including apprenticeships
Support to residents who need
help in accessing job search,
training courses and CV writing
2 years of funding secured
for unemployed 18-24
year olds to access
training and jobs in the
area through the Youth
contract. Delivery model
and partners being
developed.
In discussion with Castle
Cavendish about
employment priorities for
2014/15 funding
Employment and
Skills Team /
Economic
Development
Castle Cavendish

Area/Estate Date/Time Meeting Point
Radford West (meet Garfield
Court residents)
13 February 2014 (2.30pm) Hartley Road / Addington Street
Leen 13 March 2014 (2.30pm) Hartley Road / Forster Street
Park 10 April 2014 (2.30pm) Tunnel entrance
Lenton Triangle 8 May 2014 (2.30pm) Derby Road / Kimbolton Avenue
Community Engagement
Ward Walks
Community Meetings
Group Date Venue
Radford and Leen Tenants and
Residents Association
18 February (6.45pm) 18 March, 15 April St Peter’s Church, Hartley Road /
Churchfield Lane, Radford
BRAMTRA (Bramcote Estate
Tenants Group)
13 March (6.00pm) Community Room, Affinity Sutton
Housing Centre, Redoubt Street
Radford West Residents Group 11 February, 11 March, 8 April Pine View Community Room (Ground
Floor), The Woodlands, Radford
Lenton Triangle Residents Forum To be confirmed PRIMARY, 33 Seely Road,
Community Meetings
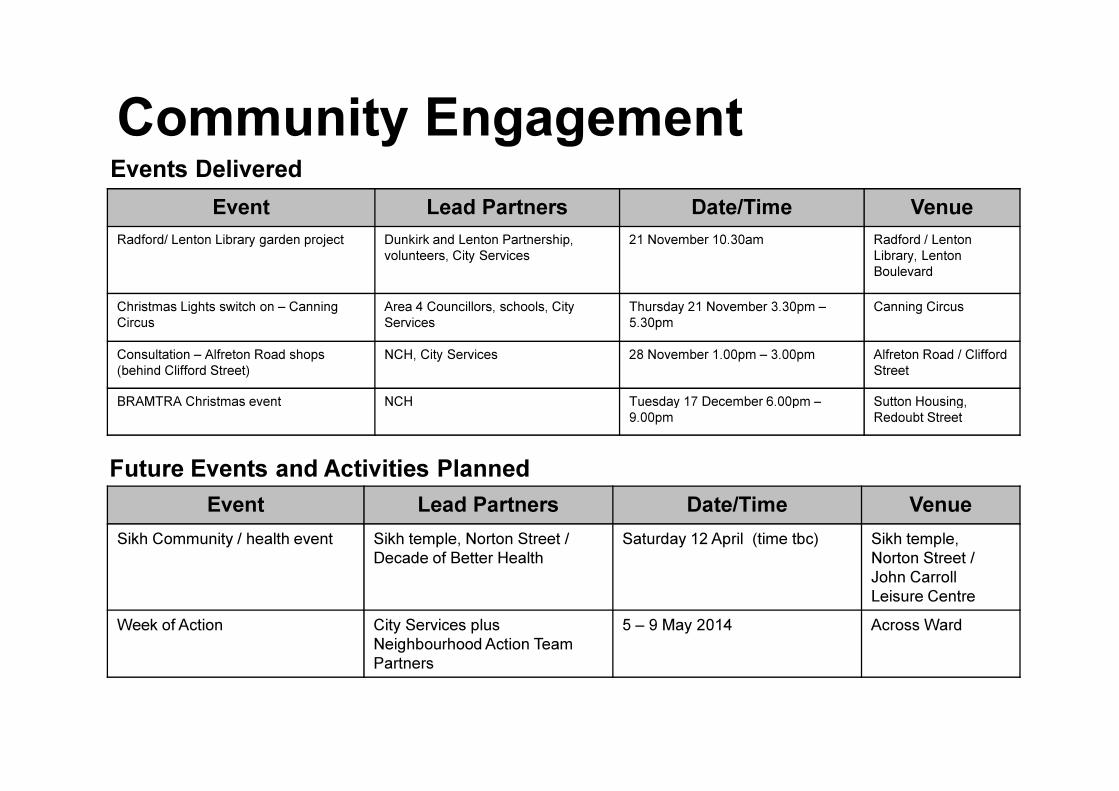
Event Lead Partners Date/Time Venue
Radford/ Lenton Library garden project Dunkirk and Lenton Partnership,
volunteers, City Services
21 November 10.30am Radford / Lenton
Library, Lenton
Boulevard
Christmas Lights switch on – Canning
Circus
Area 4 Councillors, schools, City
Services
Thursday 21 November 3.30pm –
5.30pm
Canning Circus
Consultation – Alfreton Road shops
(behind Clifford Street)
NCH, City Services 28 November 1.00pm – 3.00pm Alfreton Road / Clifford
Street
BRAMTRA Christmas event NCH Tuesday 17 December 6.00pm – Sutton Housing,
Community EngagementEvents Delivered
BRAMTRA Christmas event NCH Tuesday 17 December 6.00pm –
9.00pm
Sutton Housing,
Redoubt Street
Event Lead Partners Date/Time Venue
Sikh Community / health event Sikh temple, Norton Street /
Decade of Better Health
Saturday 12 April (time tbc) Sikh temple,
Norton Street /
John Carroll
Leisure Centre
Week of Action City Services plus
Neighbourhood Action Team
Partners
5 – 9 May 2014 Across Ward
Future Events and Activities Planned

Finance
Ward Councillor Budgets:
Total Amount allocated this period £4,860
Budget Remaining Unallocated £18,084
Area Capital Fund 2013/15:
Total Amount allocated this period £50,000
Budget Remaining Unallocated £106,001 (inclusive of 2013-14 allocation)Budget Remaining Unallocated £106,001 (inclusive of 2013-14 allocation)
Other funding:
NCH: Environment Budget 2013/14 £49,511
Section 106 / other: to be confirmed
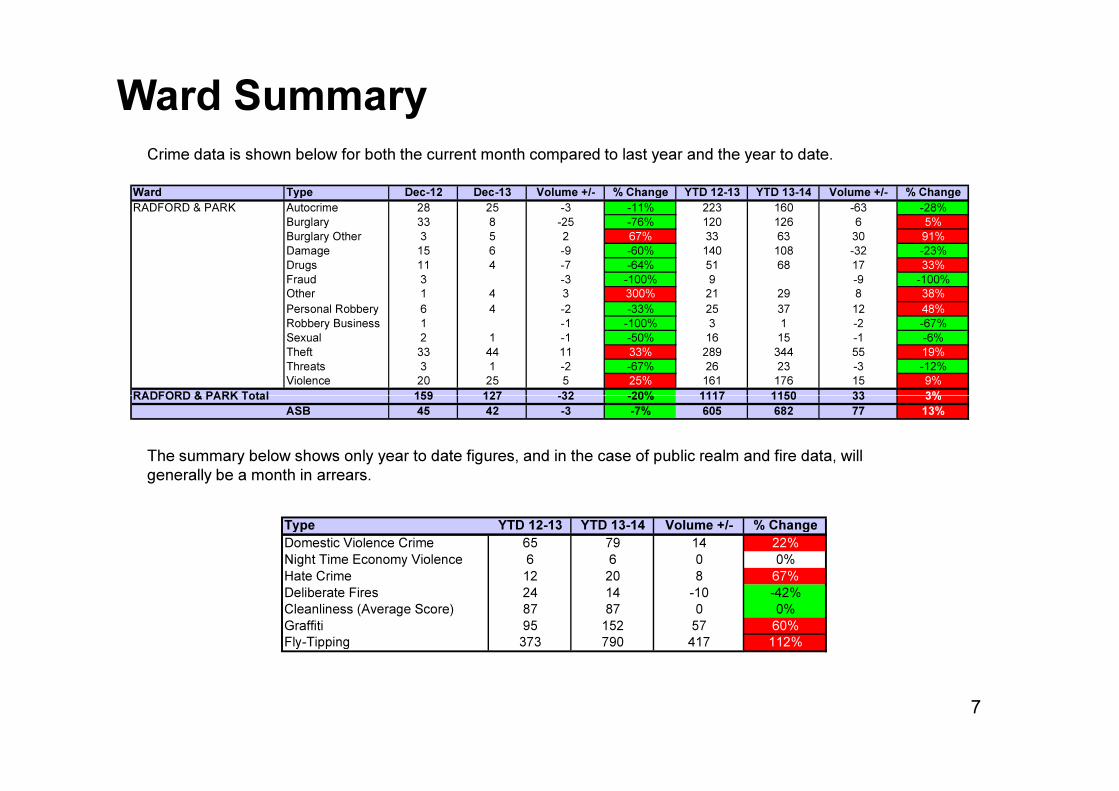
Ward SummaryCrime data is shown below for both the current month compared to last year and the year to date.
Ward Type Dec-12 Dec-13 Volume +/- % Change YTD 12-13 YTD 13-14 Volume +/- % Change
RADFORD & PARK Autocrime 28 25 -3 -11% 223 160 -63 -28%
Burglary 33 8 -25 -76% 120 126 6 5%
Burglary Other 3 5 2 67% 33 63 30 91%
Damage 15 6 -9 -60% 140 108 -32 -23%
Drugs 11 4 -7 -64% 51 68 17 33%
Fraud 3 -3 -100% 9 -9 -100%
Other 1 4 3 300% 21 29 8 38%
Personal Robbery 6 4 -2 -33% 25 37 12 48%
Robbery Business 1 -1 -100% 3 1 -2 -67%
Sexual 2 1 -1 -50% 16 15 -1 -6%
Theft 33 44 11 33% 289 344 55 19%
Threats 3 1 -2 -67% 26 23 -3 -12%
Violence 20 25 5 25% 161 176 15 9%
RADFORD & PARK Total 159 127 -32 -20% 1117 1150 33 3%
7
The summary below shows only year to date figures, and in the case of public realm and fire data, will
generally be a month in arrears.
RADFORD & PARK Total 159 127 -32 -20% 1117 1150 33 3%
ASB 45 42 -3 -7% 605 682 77 13%
Type YTD 12-13 YTD 13-14 Volume +/- % Change
Domestic Violence Crime 65 79 14 22%
Night Time Economy Violence 6 6 0 0%
Hate Crime 12 20 8 67%
Deliberate Fires 24 14 -10 -42%
Cleanliness (Average Score) 87 87 0 0%
Graffiti 95 152 57 60%
Fly-Tipping 373 790 417 112%

Priorities & TargetsThe Central Locality has targets to reduce Dwelling Burglary, Shop Theft and Violence. The Locality’s performance
against Targets is set out below. This shows that the target is being met for Dwelling Burglary, but not for Shop Theft
or Violent Crime.
Locality Crime Type Apr-13 May-13 Jun-13 Jul-13 Aug-13 Sep-13 Oct-13 Nov-13 Dec-13 Jan-14 Feb-14 Mar-14 YTD
Proposed
year end
Position
+/- Target
Position
Dwelling Burglary 96 77 71 65 56 59 55 79 69 75 75 75 627 890 -38
Shop Theft 88 71 96 55 54 27 54 52 57 40 40 40 554 644 30
Violence 96 114 115 130 130 110 145 109 113 84 84 84 1062 1173 141
Central
Locality Target Summary
8
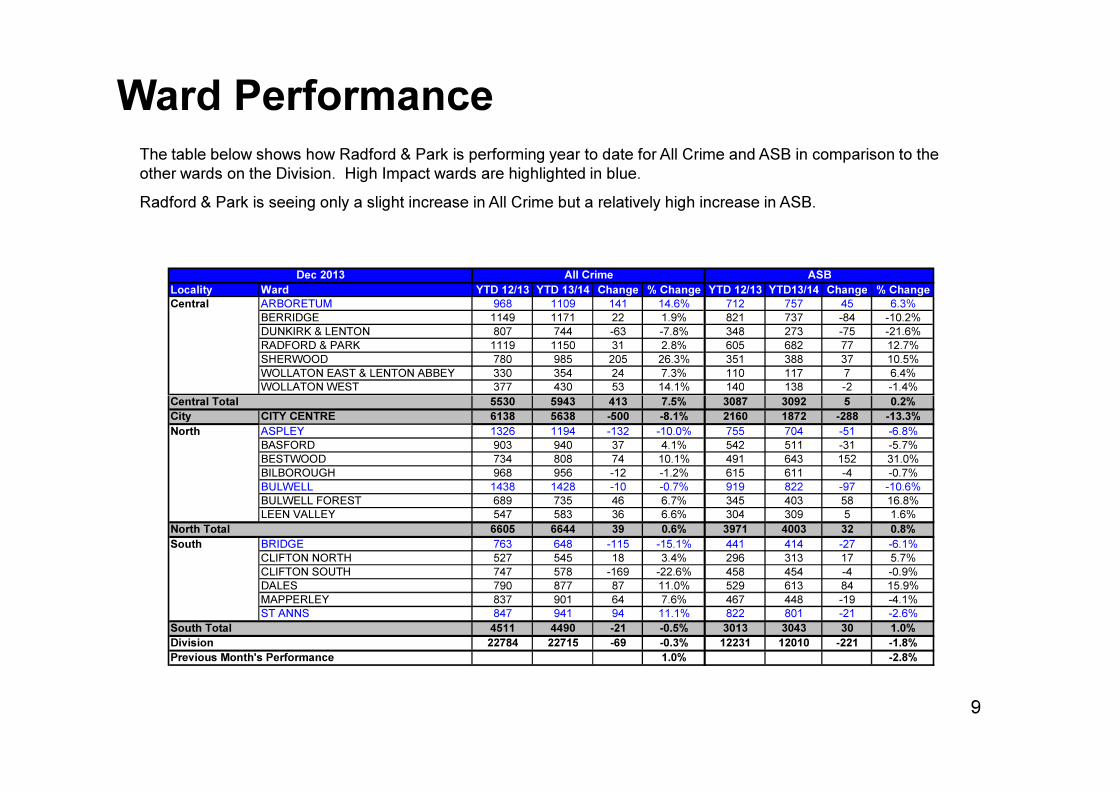
Ward PerformanceThe table below shows how Radford & Park is performing year to date for All Crime and ASB in comparison to the
other wards on the Division. High Impact wards are highlighted in blue.
Radford & Park is seeing only a slight increase in All Crime but a relatively high increase in ASB.
Locality Ward YTD 12/13 YTD 13/14 Change % Change YTD 12/13 YTD13/14 Change % Change
Central ARBORETUM 968 1109 141 14.6% 712 757 45 6.3%
BERRIDGE 1149 1171 22 1.9% 821 737 -84 -10.2%
DUNKIRK & LENTON 807 744 -63 -7.8% 348 273 -75 -21.6%
RADFORD & PARK 1119 1150 31 2.8% 605 682 77 12.7%
SHERWOOD 780 985 205 26.3% 351 388 37 10.5%
WOLLATON EAST & LENTON ABBEY 330 354 24 7.3% 110 117 7 6.4%
WOLLATON WEST 377 430 53 14.1% 140 138 -2 -1.4%
Central Total 5530 5943 413 7.5% 3087 3092 5 0.2%
Dec 2013 All Crime ASB
9
Central Total 5530 5943 413 7.5% 3087 3092 5 0.2%
City CITY CENTRE 6138 5638 -500 -8.1% 2160 1872 -288 -13.3%
North ASPLEY 1326 1194 -132 -10.0% 755 704 -51 -6.8%
BASFORD 903 940 37 4.1% 542 511 -31 -5.7%
BESTWOOD 734 808 74 10.1% 491 643 152 31.0%
BILBOROUGH 968 956 -12 -1.2% 615 611 -4 -0.7%
BULWELL 1438 1428 -10 -0.7% 919 822 -97 -10.6%
BULWELL FOREST 689 735 46 6.7% 345 403 58 16.8%
LEEN VALLEY 547 583 36 6.6% 304 309 5 1.6%
North Total 6605 6644 39 0.6% 3971 4003 32 0.8%
South BRIDGE 763 648 -115 -15.1% 441 414 -27 -6.1%
CLIFTON NORTH 527 545 18 3.4% 296 313 17 5.7%
CLIFTON SOUTH 747 578 -169 -22.6% 458 454 -4 -0.9%
DALES 790 877 87 11.0% 529 613 84 15.9%
MAPPERLEY 837 901 64 7.6% 467 448 -19 -4.1%
ST ANNS 847 941 94 11.1% 822 801 -21 -2.6%
South Total 4511 4490 -21 -0.5% 3013 3043 30 1.0%
Division 22784 22715 -69 -0.3% 12231 12010 -221 -1.8%
Previous Month's Performance 1.0% -2.8%

Exception Reporting
Dwelling Burglary is showing a considerable reduction compared to the same month last year, but is still showing an
increase for the year to date.
Dwelling Burglary
Theft
Theft is the main volume crime category on this ward, accounting for 35% of All Crime on the ward in December.
The theft category is also showing an increase this month compared to last year and for the year to date. The table
below shows the individual crime categories within this group on a month basis. This shows that Shop Theft is
generally the highest category but there was an equal amount of Theft Other during December. Also shown on the
table is the percentage of offences where mobile phones are targeted. The percentage rose in December. The shop
10
table is the percentage of offences where mobile phones are targeted. The percentage rose in December. The shop
theft offences were spread across Lidl, Aldi, B & M and Maplin. The Theft Other offences were quite wide spread
and involved theft of phones, purses and money from purses.
Offence Apr May Jun Jul Aug Sep Oct Nov Dec Total
THEFT FROM SHOP 31 21 22 20 16 6 14 12 18 160
THEFT OTHER 6 8 10 11 8 7 11 3 18 82
THEFT OR UNAUTHORISED TAKING OF PEDAL CYCLE 4 7 3 8 5 7 10 5 49
THEFT IN DWELLING OTHER THAN AUTO MACHINE OR METER 4 1 9 5 5 2 2 3 1 32
THEFT FROM PERSON 4 3 1 3 2 2 2 17
THEFT FROM AUTO MACHINE OR METER 1 2 3
THEFT BY EMPLOYEE 1 1
Total 49 40 45 47 37 15 37 30 44 344
% Mobile Phone Theft 6% 13% 9% 13% 16% 20% 14% 7% 20% 13%
Exception Reporting (continued)
Violence
Violence has seen an increase both for the month and year to date. 44% of the offences were domestic related
during December and the same proportion applies for the year to date.
11
All Crime
Radford & Park has only a slightly higher than average crime rate for All Crime but ranks high in respect of Autocrime
and Dwelling Burglary. A full breakdown can be found on page 7. ASB levels however are below average, as shown
on page 8.
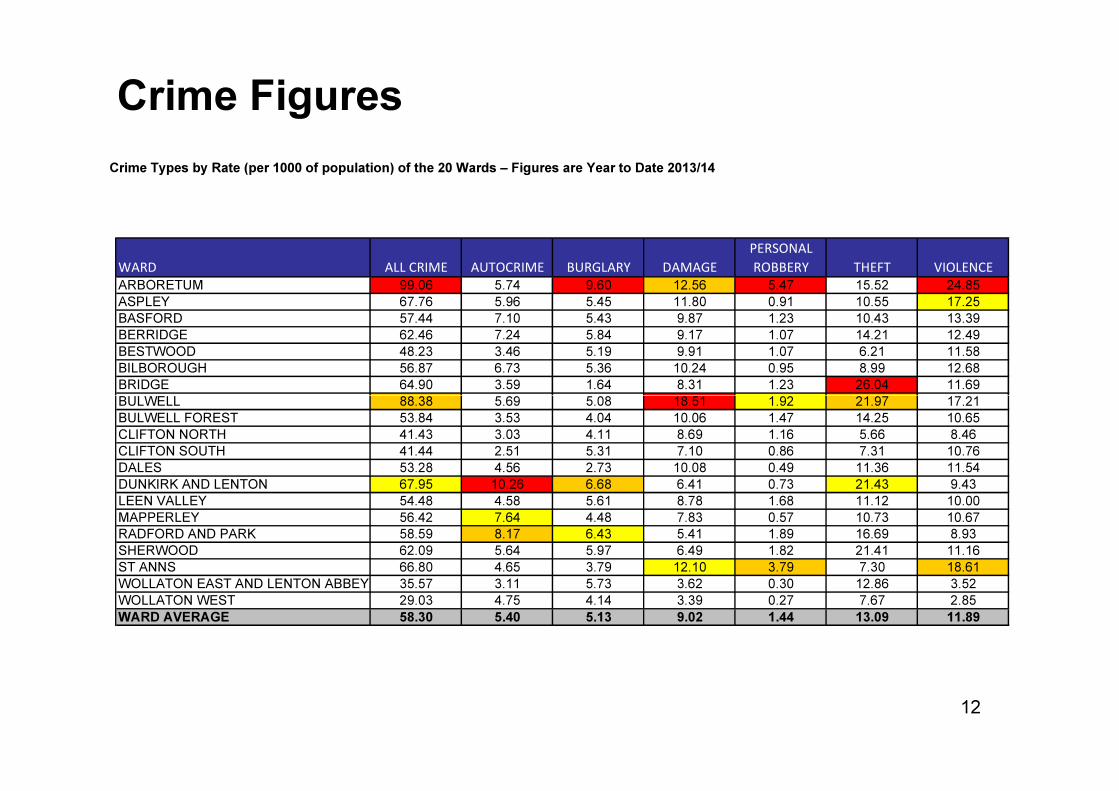
Crime Figures
Crime Types by Rate (per 1000 of population) of the 20 Wards – Figures are Year to Date 2013/14
WARD ALL CRIME AUTOCRIME BURGLARY DAMAGE
PERSONAL
ROBBERY THEFT VIOLENCE
ARBORETUM 99.06 5.74 9.60 12.56 5.47 15.52 24.85
ASPLEY 67.76 5.96 5.45 11.80 0.91 10.55 17.25
BASFORD 57.44 7.10 5.43 9.87 1.23 10.43 13.39
BERRIDGE 62.46 7.24 5.84 9.17 1.07 14.21 12.49
BESTWOOD 48.23 3.46 5.19 9.91 1.07 6.21 11.58
BILBOROUGH 56.87 6.73 5.36 10.24 0.95 8.99 12.68
BRIDGE 64.90 3.59 1.64 8.31 1.23 26.04 11.69
BULWELL 88.38 5.69 5.08 18.51 1.92 21.97 17.21
12
BULWELL 88.38 5.69 5.08 18.51 1.92 21.97 17.21
BULWELL FOREST 53.84 3.53 4.04 10.06 1.47 14.25 10.65
CLIFTON NORTH 41.43 3.03 4.11 8.69 1.16 5.66 8.46
CLIFTON SOUTH 41.44 2.51 5.31 7.10 0.86 7.31 10.76
DALES 53.28 4.56 2.73 10.08 0.49 11.36 11.54
DUNKIRK AND LENTON 67.95 10.26 6.68 6.41 0.73 21.43 9.43
LEEN VALLEY 54.48 4.58 5.61 8.78 1.68 11.12 10.00
MAPPERLEY 56.42 7.64 4.48 7.83 0.57 10.73 10.67
RADFORD AND PARK 58.59 8.17 6.43 5.41 1.89 16.69 8.93
SHERWOOD 62.09 5.64 5.97 6.49 1.82 21.41 11.16
ST ANNS 66.80 4.65 3.79 12.10 3.79 7.30 18.61
WOLLATON EAST AND LENTON ABBEY 35.57 3.11 5.73 3.62 0.30 12.86 3.52
WOLLATON WEST 29.03 4.75 4.14 3.39 0.27 7.67 2.85
WARD AVERAGE 58.30 5.40 5.13 9.02 1.44 13.09 11.89

All ASB FiguresAll ASB by Rate (per 1000 of population) of the 20 Wards)
WARD
RATE (PER 1000
OF POP.) Dec 2013
ARBORETUM 6.82
ASPLEY 3.40
BASFORD 3.64
BERRIDGE 2.36
BESTWOOD 3.64
BILBOROUGH 3.22
BRIDGE 3.08
BULWELL 3.65
BULWELL FOREST 2.79
13
BULWELL FOREST 2.79
CLIFTON NORTH 2.25
CLIFTON SOUTH 2.01
DALES 3.95
DUNKIRK & LENTON 1.47
LEEN VALLEY 3.92
MAPPERLEY 2.02
RADFORD & PARK 2.14
SHERWOOD 1.62
ST ANNS 5.23
WOLLATON EAST & LENTON ABBEY 0.80
WOLLATON WEST 0.47
WARD AVERAGE 2.92
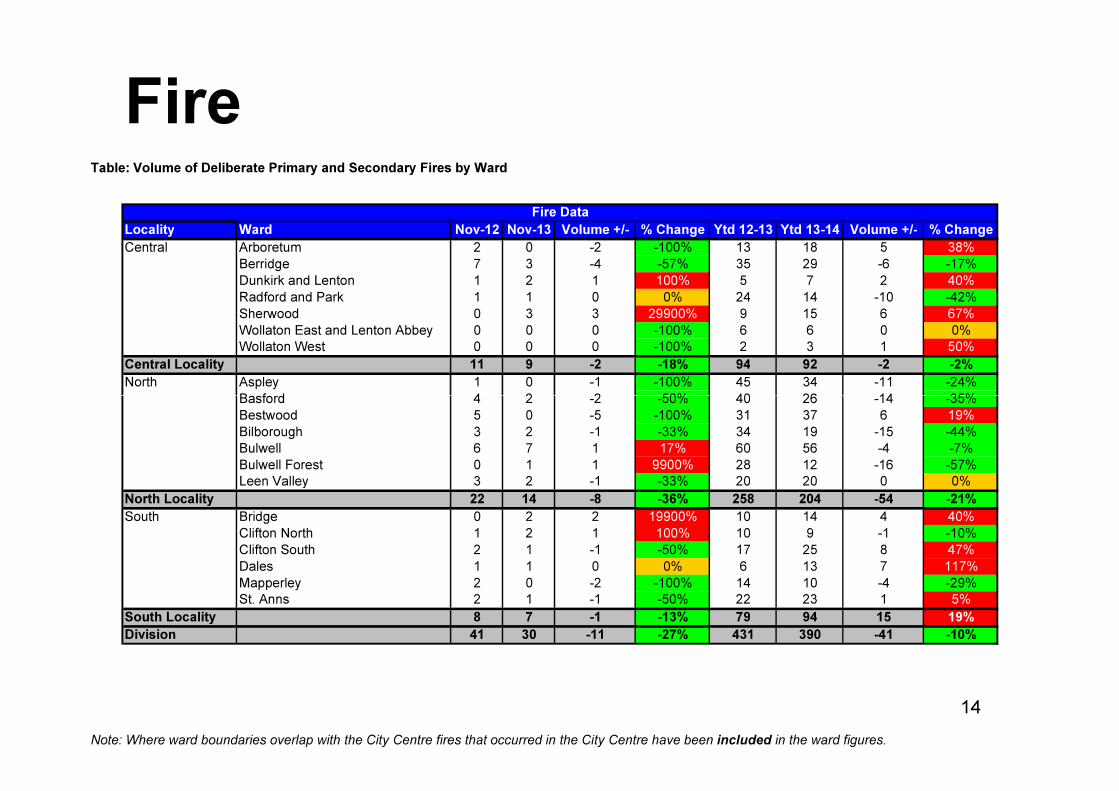
FireTable: Volume of Deliberate Primary and Secondary Fires by Ward
Locality Ward Nov-12 Nov-13 Volume +/- % Change Ytd 12-13 Ytd 13-14 Volume +/- % Change
Central Arboretum 2 0 -2 -100% 13 18 5 38%
Berridge 7 3 -4 -57% 35 29 -6 -17%
Dunkirk and Lenton 1 2 1 100% 5 7 2 40%
Radford and Park 1 1 0 0% 24 14 -10 -42%
Sherwood 0 3 3 29900% 9 15 6 67%
Wollaton East and Lenton Abbey 0 0 0 -100% 6 6 0 0%
Wollaton West 0 0 0 -100% 2 3 1 50%
Central Locality 11 9 -2 -18% 94 92 -2 -2%
North Aspley 1 0 -1 -100% 45 34 -11 -24%
Basford 4 2 -2 -50% 40 26 -14 -35%
Fire Data
14
Note: Where ward boundaries overlap with the City Centre fires that occurred in the City Centre have been included in the ward figures.
Basford 4 2 -2 -50% 40 26 -14 -35%
Bestwood 5 0 -5 -100% 31 37 6 19%
Bilborough 3 2 -1 -33% 34 19 -15 -44%
Bulwell 6 7 1 17% 60 56 -4 -7%
Bulwell Forest 0 1 1 9900% 28 12 -16 -57%
Leen Valley 3 2 -1 -33% 20 20 0 0%
North Locality 22 14 -8 -36% 258 204 -54 -21%
South Bridge 0 2 2 19900% 10 14 4 40%
Clifton North 1 2 1 100% 10 9 -1 -10%
Clifton South 2 1 -1 -50% 17 25 8 47%
Dales 1 1 0 0% 6 13 7 117%
Mapperley 2 0 -2 -100% 14 10 -4 -29%
St. Anns 2 1 -1 -50% 22 23 1 5%
South Locality 8 7 -1 -13% 79 94 15 19%
Division 41 30 -11 -27% 431 390 -41 -10%
Community Protection
Data has been received from Community Protection and where postcodes have been listed these have been geo-coded and mapped to determine
the Ward. All addresses relate to the address of the Perpetrator.
FPNs are not currently available at ward level.
In December 2013 the following orders were issued:
• 5 Statutory Notices for the Environment
• 1 Outright Possession Order (Eviction) for ASB
For enquiries regarding Community Protection court outcomes please contact the Operational Manager for the locality.
15

Cleanliness Index
•All data refers to a comparison with the previous
year’s month
•It is proposed that performance over time graphs
be used for each indicator
•Historic data for comparison is not available for
dog fouling
Cleanliness Index
Score 90
Performance compared to
previous year îîîîPerformance compared to
neighbourhoods target
of 86 ììììCleanliness Index - Radford & Park
70
75
80
85
90
95
100
April May June July August September October November December January February March
Month
Cle
anliness S
core
2011-12
2012-13
2013-14
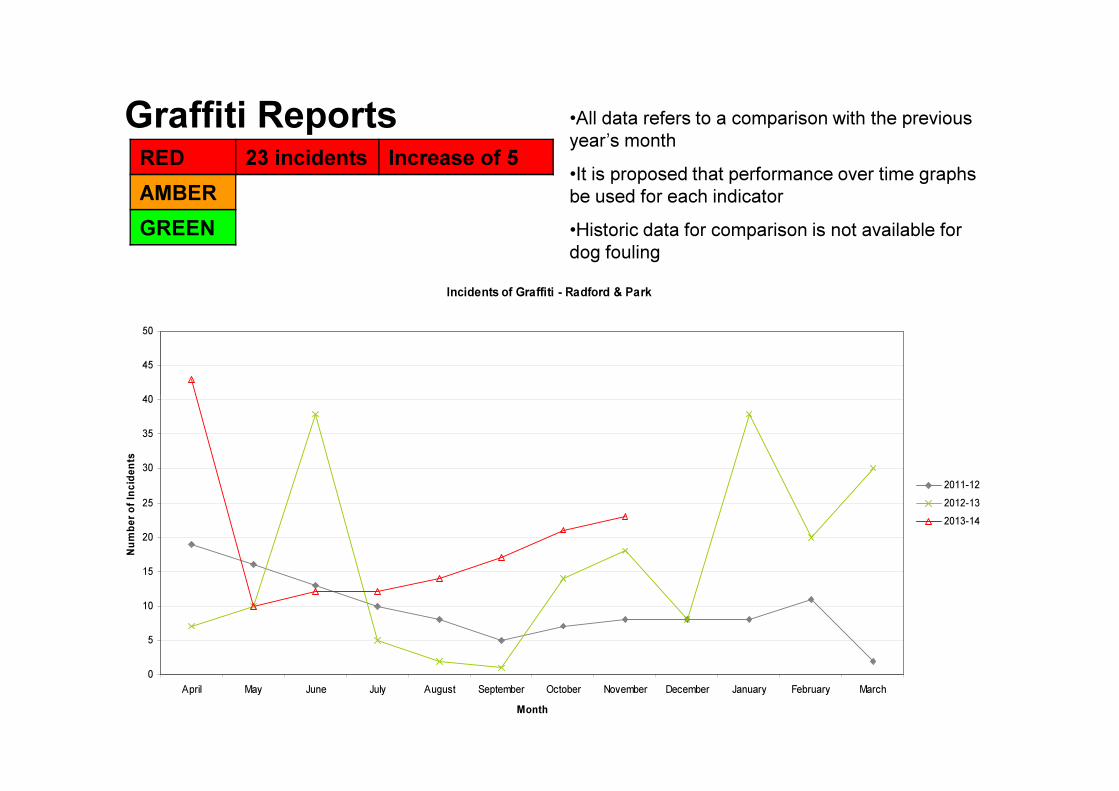
Graffiti Reports •All data refers to a comparison with the previous
year’s month
•It is proposed that performance over time graphs
be used for each indicator
•Historic data for comparison is not available for
dog fouling
RED 23 incidents Increase of 5
AMBER
GREEN
Incidents of Graffiti - Radford & Park
40
45
50
0
5
10
15
20
25
30
35
40
April May June July August September October November December January February March
Month
Nu
mb
er
of
Inc
ide
nts
2011-12
2012-13
2013-14
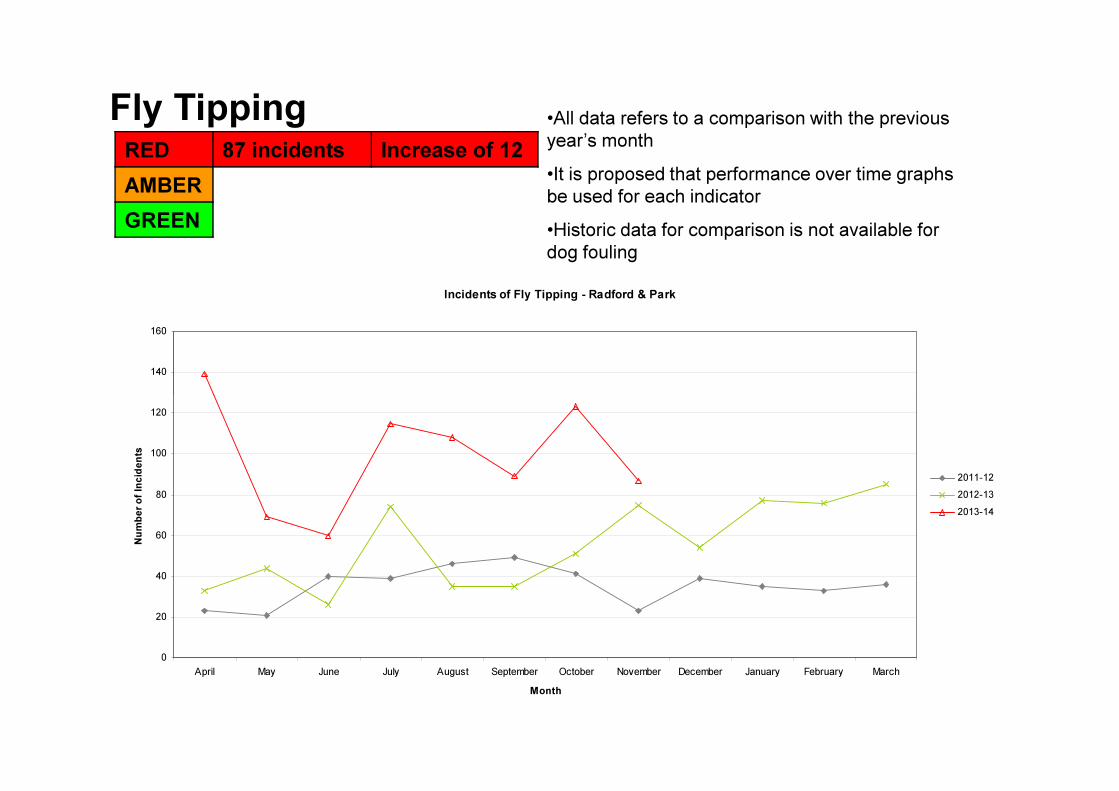
Fly Tipping •All data refers to a comparison with the previous
year’s month
•It is proposed that performance over time graphs
be used for each indicator
•Historic data for comparison is not available for
dog fouling
RED 87 incidents Increase of 12
AMBER
GREEN
Incidents of Fly Tipping - Radford & Park
140
160
0
20
40
60
80
100
120
April May June July August September October November December January February March
Month
Nu
mb
er
of
Inc
ide
nts
2011-12
2012-13
2013-14
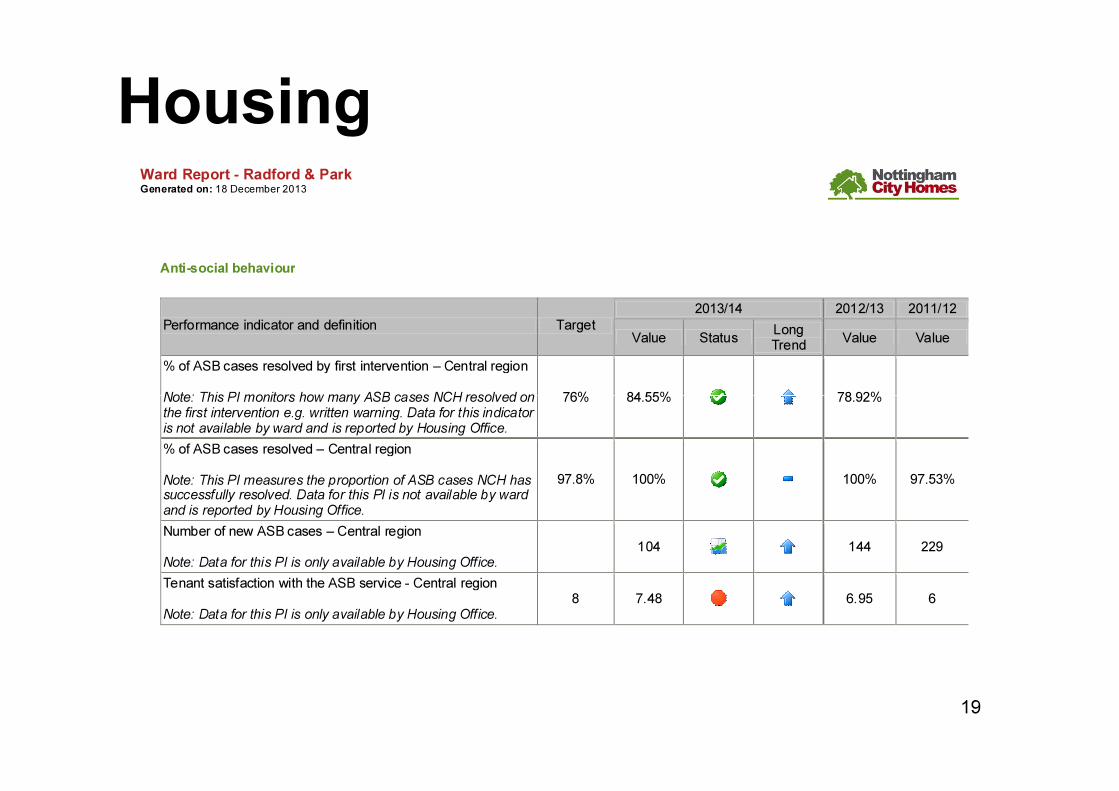
Housing
Anti-social behaviour
Ward Report - Radford & Park Generated on: 18 December 2013
2013/14 2012/13 2011/12
Performance indicator and definition Target Value Status
Long Trend
Value Value
% of ASB cases resolved by first intervention – Central region Note: This PI monitors how many ASB cases NCH resolved on 76% 84.55% 78.92%
19
Note: This PI monitors how many ASB cases NCH resolved on the first intervention e.g. written warning. Data for this indicator is not available by ward and is reported by Housing Office.
76% 84.55% 78.92%
% of ASB cases resolved – Central region Note: This PI measures the proportion of ASB cases NCH has successfully resolved. Data for this PI is not available by ward and is reported by Housing Office.
97.8% 100% 100% 97.53%
Number of new ASB cases – Central region Note: Data for this PI is only available by Housing Office.
104 144 229
Tenant satisfaction with the ASB service - Central region Note: Data for this PI is only available by Housing Office.
8 7.48 6.95 6
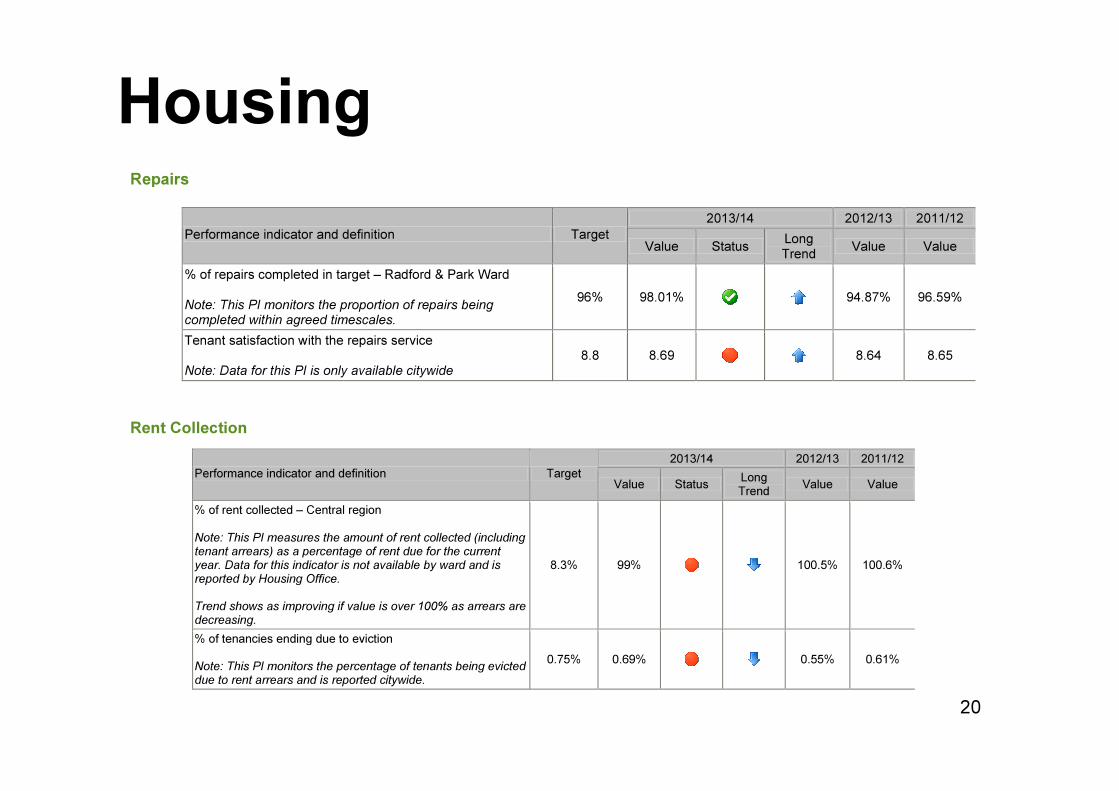
Housing Repairs
2013/14 2012/13 2011/12
Performance indicator and definition Target Value Status
Long Trend
Value Value
% of repairs completed in target – Radford & Park Ward Note: This PI monitors the proportion of repairs being completed within agreed timescales.
96% 98.01% 94.87% 96.59%
Tenant satisfaction with the repairs service Note: Data for this PI is only available citywide
8.8 8.69 8.64 8.65
20
Rent Collection
2013/14 2012/13 2011/12
Performance indicator and definition Target Value Status
Long Trend
Value Value
% of rent collected – Central region Note: This PI measures the amount of rent collected (including tenant arrears) as a percentage of rent due for the current year. Data for this indicator is not available by ward and is reported by Housing Office. Trend shows as improving if value is over 100% as arrears are decreasing.
8.3% 99% 100.5% 100.6%
% of tenancies ending due to eviction Note: This PI monitors the percentage of tenants being evicted due to rent arrears and is reported citywide.
0.75% 0.69% 0.55% 0.61%
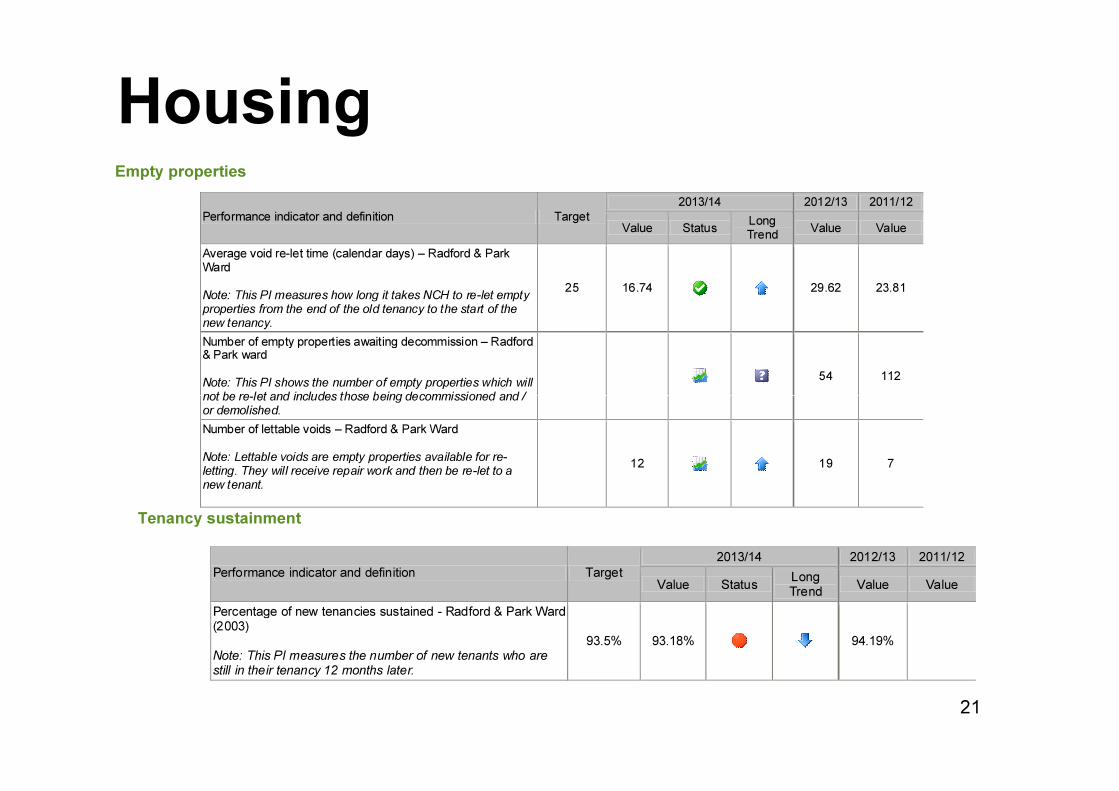
Housing Empty properties
2013/14 2012/13 2011/12
Performance indicator and definition Target Value Status
Long Trend
Value Value
Average void re-let time (calendar days) – Radford & Park Ward Note: This PI measures how long it takes NCH to re-let empty properties from the end of the old tenancy to the start of the new tenancy.
25 16.74 29.62 23.81
Number of empty properties awaiting decommission – Radford & Park ward Note: This PI shows the number of empty properties which will not be re-let and includes those being decommissioned and /
54 112
21
Tenancy sustainment
not be re-let and includes those being decommissioned and / or demolished.
Number of lettable voids – Radford & Park Ward Note: Lettable voids are empty properties available for re-letting. They will receive repair work and then be re-let to a new tenant.
12 19 7
2013/14 2012/13 2011/12
Performance indicator and definition Target Value Status
Long Trend
Value Value
Percentage of new tenancies sustained - Radford & Park Ward (2003) Note: This PI measures the number of new tenants who are still in their tenancy 12 months later.
93.5% 93.18% 94.19%
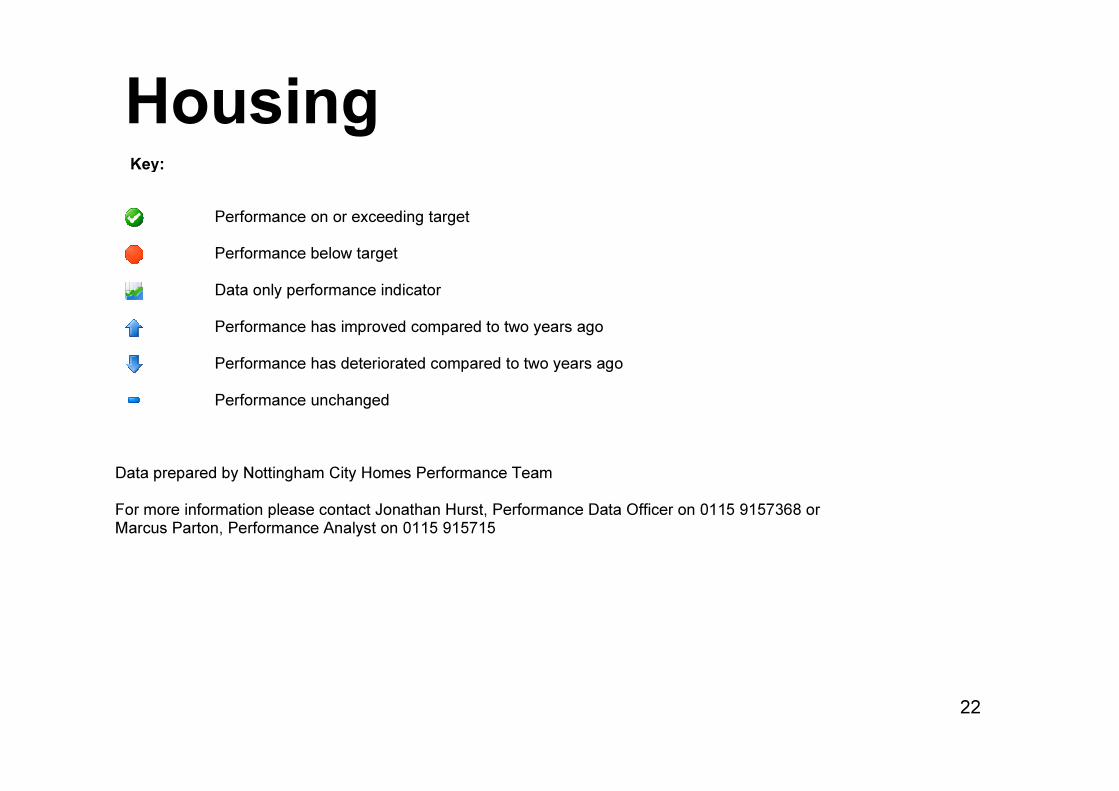
Housing Key:
Performance on or exceeding target
Performance below target
Data only performance indicator
Performance has improved compared to two years ago
Performance has deteriorated compared to two years ago Performance unchanged
22
Performance unchanged
Data prepared by Nottingham City Homes Performance Team For more information please contact Jonathan Hurst, Performance Data Officer on 0115 9157368 or Marcus Parton, Performance Analyst on 0115 915715
Methodology
Data has not been audited or verified and therefore must only be used as a
reflection of crime.
Crime data and ASB calls have been extracted from the Police systems and
mapped to ascertain which Ward they occurred in.
Where a ward boundary overlaps with the City Centre, crime data and ASB calls
23
Where a ward boundary overlaps with the City Centre, crime data and ASB calls
relating to the City Centre have been removed.
Where possible the most recent data is used, although for some areas this may be
a month further in arrears.
Discussions continue with other agencies regarding what further data can be
included.


