Page 1
RESEARCH ARTICLE
Radial profile detection of multiple spherical
particles in contact with interacting surfaces
Johannes WaschkeID1*, Tilo Pompe2, David Rettke2, Stephan Schmidt3,
Mario Hlawitschka4
1 Max Planck Institute for Human Cognitive and Brain Sciences, Stephanstr. 1a, Leipzig, Germany, 2 Institute
of Biochemistry, Leipzig University, Johannisallee 21-23, Leipzig, Germany, 3 Department of Chemistry,
Heinrich Heine University Dusseldorf, Dusseldorf, Germany, 4 Faculty of Computer Science, Mathematics
and Natural Sciences, Leipzig University of Applied Sciences, Leipzig, Germany
* [email protected]
Abstract
Adhesive interactions of soft materials play an important role in nature and technology. Inter-
action energies can be quantified by determining contact areas of deformable microparticles
with the help of reflection interference contrast microscopy (RICM). For high throughput
screening of adhesive interactions, a method to automatically evaluate large amounts of
interacting microparticles was developed. An image is taken which contains circular interfer-
ence patterns with visual characteristics that depend on the probe’s shape due to its surface
interaction. We propose to automatically detect radial profiles in images, and to measure the
contact radius and size of the spherical probe, allowing the determination of particle-surface
interaction energy in a simple and fast imaging and image analysis setup. To achieve this,
we analyze the image gradient and we perform template matching that utilizes the physical
foundations of reflection interference contrast microscopy.
1 Introduction
Adhesive interactions between deformable materials play an important role in technology as
well as in biological processes, e.g. when cells interact with surfaces. In order to shed light on
the underlying principles, adhesion phenomena need to be precisely quantified.
Direct quantification of adhesion by means of a surface force apparatus or atomic force
microscopy has provided valuable insights into the field of mechanobiology, bioadhesives and
colloid science, to name just a few. While offering precise quantitative information on adhesive
interactions down to the molecular level, these force-based techniques require considerable
experimental effort. As a facile alternative, adhesion assays with soft polymer particles as
probes (soft colloidal probes, SCPs) have been introduced to directly quantify adhesive interac-
tions [1–3]. The method is based on determining the mechanical deformation of the SCP par-
ticles on a planar substrate by means of reflection interference contrast microscopy (RICM,
see Fig 1). RICM as an imaging technique has long been successfully used to study the
adhesion phenomena of cells, vesicles, and hard colloidal particles [4], since the underlying
contacts can be visualized with nanometer-precision in the vertical direction using an optical
PLOS ONE | https://doi.org/10.1371/journal.pone.0214815 April 2, 2019 1 / 16
a1111111111
a1111111111
a1111111111
a1111111111
a1111111111
OPEN ACCESS
Citation: Waschke J, Pompe T, Rettke D, Schmidt
S, Hlawitschka M (2019) Radial profile detection of
multiple spherical particles in contact with
interacting surfaces. PLoS ONE 14(4): e0214815.
https://doi.org/10.1371/journal.pone.0214815
Editor: Victor M Ugaz, Texas A&M University
College Station, UNITED STATES
Received: November 15, 2018
Accepted: March 20, 2019
Published: April 2, 2019
Copyright: © 2019 Waschke et al. This is an open
access article distributed under the terms of the
Creative Commons Attribution License, which
permits unrestricted use, distribution, and
reproduction in any medium, provided the original
author and source are credited.
Data Availability Statement: All relevant data are
within the manuscript and Supporting Information
files. The presented software is available from our
repository: https://gitlab.imn.htwk-leipzig.de/
jwaschke/particle-detector.
Funding: J.W. received funding from the
International Max Planck Research School on
Neuroscience of Communication: Function,
Structure, and Plasticity (Leipzig, Germany; https://
imprs-neurocom.mpg.de). T.P. and D.R.
acknowledge the support by a grant from Federal
Ministry for Education and Research (BMBF) within
Page 2
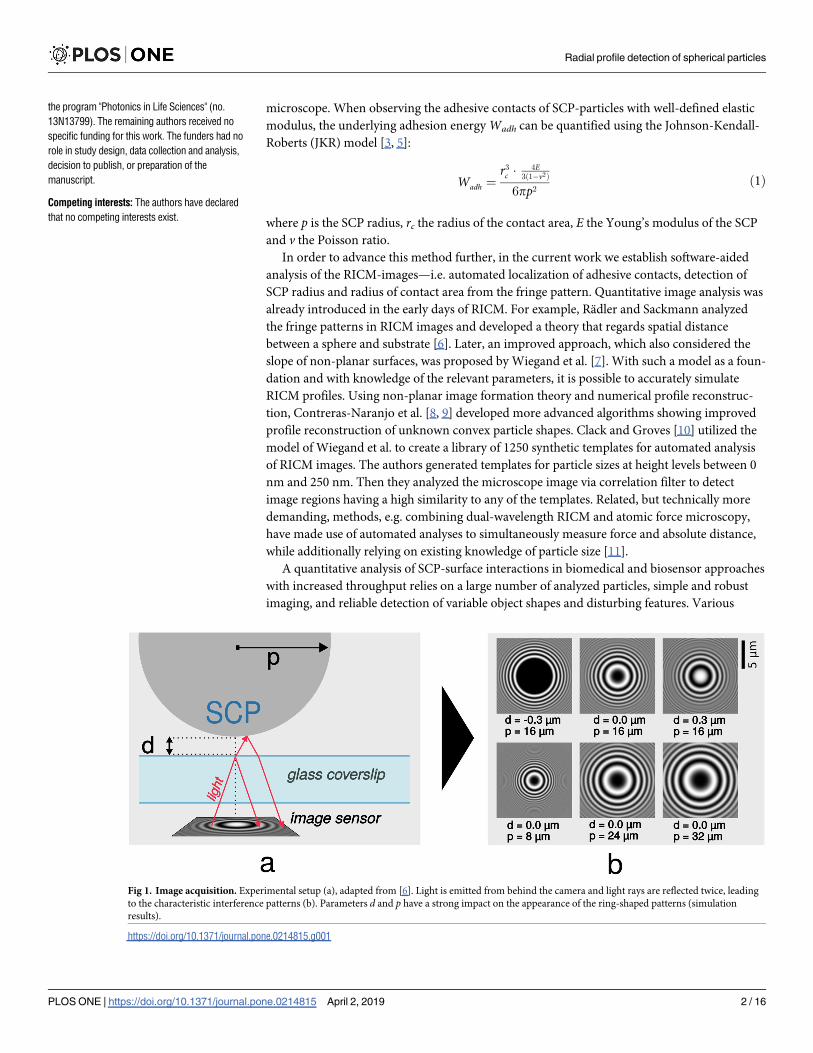
microscope. When observing the adhesive contacts of SCP-particles with well-defined elastic
modulus, the underlying adhesion energy Wadh can be quantified using the Johnson-Kendall-
Roberts (JKR) model [3, 5]:
Wadh ¼r3c �
4E3ð1� v2Þ
6pp2ð1Þ
where p is the SCP radius, rc the radius of the contact area, E the Young’s modulus of the SCP
and v the Poisson ratio.
In order to advance this method further, in the current work we establish software-aided
analysis of the RICM-images—i.e. automated localization of adhesive contacts, detection of
SCP radius and radius of contact area from the fringe pattern. Quantitative image analysis was
already introduced in the early days of RICM. For example, Radler and Sackmann analyzed
the fringe patterns in RICM images and developed a theory that regards spatial distance
between a sphere and substrate [6]. Later, an improved approach, which also considered the
slope of non-planar surfaces, was proposed by Wiegand et al. [7]. With such a model as a foun-
dation and with knowledge of the relevant parameters, it is possible to accurately simulate
RICM profiles. Using non-planar image formation theory and numerical profile reconstruc-
tion, Contreras-Naranjo et al. [8, 9] developed more advanced algorithms showing improved
profile reconstruction of unknown convex particle shapes. Clack and Groves [10] utilized the
model of Wiegand et al. to create a library of 1250 synthetic templates for automated analysis
of RICM images. The authors generated templates for particle sizes at height levels between 0
nm and 250 nm. Then they analyzed the microscope image via correlation filter to detect
image regions having a high similarity to any of the templates. Related, but technically more
demanding, methods, e.g. combining dual-wavelength RICM and atomic force microscopy,
have made use of automated analyses to simultaneously measure force and absolute distance,
while additionally relying on existing knowledge of particle size [11].
A quantitative analysis of SCP-surface interactions in biomedical and biosensor approaches
with increased throughput relies on a large number of analyzed particles, simple and robust
imaging, and reliable detection of variable object shapes and disturbing features. Various
Fig 1. Image acquisition. Experimental setup (a), adapted from [6]. Light is emitted from behind the camera and light rays are reflected twice, leading
to the characteristic interference patterns (b). Parameters d and p have a strong impact on the appearance of the ring-shaped patterns (simulation
results).
https://doi.org/10.1371/journal.pone.0214815.g001
Radial profile detection of spherical particles
PLOS ONE | https://doi.org/10.1371/journal.pone.0214815 April 2, 2019 2 / 16
the program "Photonics in Life Sciences" (no.
13N13799). The remaining authors received no
specific funding for this work. The funders had no
role in study design, data collection and analysis,
decision to publish, or preparation of the
manuscript.
Competing interests: The authors have declared
that no competing interests exist.
Page 3
efficient image analysis algorithms have been developed for automated pattern detection in
computer-aided image analysis. One such method is circle detection, which can be performed
with the Circle Hough Transform [12]. More generally, many approaches exist to detect vari-
ous kinds of objects in images. Common techniques include thresholding, edge-detection,
watershed transformation, or region growing [13]. One quickly growing field is convolutional
neural networks, which can be used for image classification and segmentation [14]. While the
above-mentioned methods can detect the location of a profile, an analysis based on physical
parameters (like radius, or spacing and number of peaks) is lacking. In addition, another
major obstacle for automated profile detection is the variety of expressions of radial profiles,
like in SCP-surface analysis. The shape of the profile depends on object size, object deforma-
tion, image scale, microscope setup, as well as the distance between probe and surface (Fig 1).
In this work, we aimed to develop a quick and efficient way to automatically process a high
number of RICM images which should enable sampling of a large number of adhesive con-
tacts, providing reliable quantification of adhesion energies by means of the JKR method. We
considered the physical principles of the RICM image within the theory of Radler and Sack-
mann [4] to reconstruct theoretical images and use them in an automated pattern matching
algorithm. The experimental setup involves a glass coverslip with the adhered SCP placed on
an inverted microscope setup, which can be functionalized in various ways for physiochemical,
biomedical, or biosensing analysis [1, 15–18]. For high throughput, we use automated detec-
tion and profile analysis. Previous work demonstrated template matching as a means to detect
the interaction of hard microparticles from RICM images [10]. Our method uses template
matching as well, but we introduced a preliminary processing step that reduces the search
space and thus vastly decreases the calculation time. Furthermore, we use a higher number of
templates, which allows us to search for more heterogeneous expressions of fringe patterns
(caused by varying SCP sizes and different contact radii due to deformation of the soft micro-
particles). Accordingly, our approach is able to detect SCPs and to intrinsically determine their
size and contact radius in a highly efficient way involving GPU-accelerated calculation.
2 Materials and methods
2.1 Glass surface preparation
Sample interference patterns were obtained on hard glass surfaces. For the preparation of elec-
trostatically repulsive and attractive model surfaces, glass coverslips (ϕ32 mm, Thermo Scien-
tific, Germany) were placed in a Teflon rack and cleaned by sonication in double deionized
water and ethanol (AppliChem, Germany) for 30 min each. Afterwards, chemical cleaning was
performed to remove organic as well as particle contaminants from the surfaces. Therefore a
mixture of 50 ml H2O2, 35% (Grussing, Germany), 50 ml 25% NH3 aqueous solution (Merck,
Germany) and 250 ml double deionized water was heated to 60˚C on a hot plate and coverslips
were left in the solution for 10 min. After rinsing twice with double deionized water, the cover-
slips were dried in a nitrogen stream and used as negatively charged (repulsive) surfaces.
Positively charged (attractive) surfaces were prepared by coating the clean glass slides with
branched polyethylene imine (PEI) (average Mw *800 by LS, Merck, Germany). Here, a 20
mM solution of 3-aminopropyl-triethoxysilane (VWR, Germany) in a 1% (v/v) double deion-
ized water / isopropanol mixture (AppliChem, Germany) was used for the introduction of
amino groups to the glass surfaces. After a reaction time of 10 min, surfaces were washed thor-
oughly with isopropanol, dried in a nitrogen stream and annealed in a pre-heated oven for 60
min at 120˚C. Subsequently, the glass slides were hydrolyzed for 2 h in double deionized water
to remove excess and loosely bound silane. For further functionalization and stabilization of
the silane layer, the amine coated slides were placed in a 240 mM succinic anhydride solution
Radial profile detection of spherical particles
PLOS ONE | https://doi.org/10.1371/journal.pone.0214815 April 2, 2019 3 / 16
Page 4
in THF (Grussing, Germany) and allowed to react for 1 h. Following 2 washing steps, 1.5 ml of
a 20 mM 1-Ethyl-3-(3-dimethylaminopropyl)carbodiimide (EDC) / 50 mM N-Hydroxysuccini-
mide (NHS) solution (Carbolution Chemicals, Germany; Merck, Germany) in HEPES buffer
(Carl Roth, Germany) 100 mM, pH = 7.0 was pipetted on top of each glass slide. After 15 min
of activation, 1.5 ml of a 4 mM PEI solution in the same buffer was added to the slides and the
reaction was allowed to proceed for 1 h. Finally, the coated surfaces were rinsed three times in
HEPES buffer.
2.2 Particle preparation
SCP particles were synthesized as described previously [17]. Briefly, 50 mg poly(ethylene gly-
col) diacrylate (Mn 6000 Da, Sigma Aldrich, Germany) and 1 mg of the photoinitiator Irgacure
2959 (Sigma Aldrich, Germany) were added to 10 ml 1M sodium sulfate and vortexed until
microscopic droplets were formed. The dispersion was photopolymerized using a Heraeus
HiLite UV curing unit (Heraeus Kulzer, Germany) for 90 s. Next, the PEG SCPs were grafted
with crotonic acid (Sigma Aldrich, Germany) as described earlier [15]. In short, water was
exchanged by 10 ml ethanol, then 250 mg benzophenone and 1.5 g crotonic acid were added.
Subsequently, the mixture was flushed with nitrogen for 30 s before irradiating with UV light
for 900 s. The resulting SCP particles were then washed with ethanol and PBS three times
each. This synthesis resulted in SCPs with a Young’s elastic modulus of approximately 40 kPa
as characterized by scanning probe spectroscopy, for details see [17].
2.3 Reflection interference contrast microscopy and bright-field imaging
Cleaned or PEI-coated cover glasses were placed in a sealed PTFE-ring and each surface was
covered with 1 ml of a 10% ethanol (AppliChem, Germany) HEPES-buffer mixture pH = 7.0.
100 μl of a suspension containing COOH-functionalized particles (section 2.2) was added
dropwise afterwards. After a period of 15 min, sedimentation of the particles was completed
and the probes and their corresponding radial profiles were imaged using an inverted micro-
scope (Olympus IX73, Germany) with an integrated halogen lamp for bright-field microscopy.
To obtain the respective interference reflection patterns, samples were illuminated by a mono-
chromatic 530 nm collimated LED (M530L2-C1, Thorlabs, Germany). An Olympus 60x, NA
(numerical aperture) 1.35 oil-immersion objective (UPlanSApo 60x 1.35 oil, Olympus, Ger-
many) was used in concert with a quarter waveplate (WPMQ05M-532, Thorlabs GmbH,
Germany), placed on the microscope’s breadboard between objective and sample, as well as
additional polarizers to avoid internal reflections [19]. Images were captured with a mono-
chrome CCD camera (DMK 23U274, ImagingSource, Germany) using μManager microscopy
software. All datasets were recorded applying an exposure time of 50 ms and stored in tagged
image file format (tiff). Besides the methods explained in the following sections, no image pro-
cessing was performed.
2.4 RICM model
Reflection interference contrast microscopy (RICM) is suitable to measure nanoscale distances
between a planar transparent surface and another object, like the aforementioned SCPs. The
main idea is based on the fact that a light ray is reflected (at least) twice—once from the planar
transparent glass surface, once from the particle—and the phase difference between the two
interfering rays translates into increased or decreased intensity on the image sensor (Fig 1).
The phase difference is basically a geometrical problem and a basic model concerning this
experimental situation was established by [6], see also details to other model extensions and
approaches in the introduction. The intensity along a profile’s radius r of a spherical hydrogel
Radial profile detection of spherical particles
PLOS ONE | https://doi.org/10.1371/journal.pone.0214815 April 2, 2019 4 / 16
Page 5
particle in an aqueous solution (with parameters from Table 1 and h(r) from Eq 5) can be cal-
culated by
ptemplateðrÞ ¼sin yy� cos 2khðrÞ � 1 � sin 2 a
2
� �þ y
� �
ð2Þ
with a ¼ sin � 1INAn
and k ¼2pnl
and y ¼ 2khðrÞ � sin 2 a
2: ð3Þ
The applied basic RICM theory is known to exhibit certain deviations in exactly describing
the intensity distribution, but, as we will show later in the validation section, is appropriate to
provide a simple and fast approach to analyze SCP-surface interaction. Intensity deviations for
outer peaks can be handled using an empirical exponential decay, as suggested in previous
work [4]:
ptemplateðrÞ0¼ e
� dec�r2rmax � ptemplateðrÞ : ð4Þ
2.5 Implementation details
We implemented the algorithms as a standalone software tool with the Qt framework (C++).
The calculation of the template correlation is pixel-wise independent and it involves many
numerical computations, which is the reason why we utilized OpenCL for a GPU-driven paral-
lel calculation. The evaluation was performed on a desktop computer (Intel Core i7 4770,
AMD R9 280X Graphics Card, 16GB RAM).
Table 1. Overview of parameters.
Template Profile Parameters Value
u Pixel length [μm] 0.067
λ Wavelength [μm] 0.53
INA Numerical aperture of illumination 0.67
rmax Radius of generated templates [pixel] 100
n Refraction index 1.332
θ Phase shift πdec Decay [0, 1, . . ., 10]
d Particle height [μm] [-0.45, -0.44, . . ., 0]
p Particle radius [μm] [10, 11, . . ., 30]
Sampling and Detection Parameters Value
m Number of radial samples per position 90
c Percentage of pixels to remain after pre-processing (in%) 1
a Minimum amplitude of the local profile pmean 0.05
t1 Minimum correlation of pmean to best template 0.9
t2 Minimum average correlation between pmean and the radial samples pi8i 0.5
The upper part shows parameters for the template generation. Single values are constant for all templates; the values
provided as ranges define the search space. The lower part contains parameters for the search process and the last
three rows define constraints that every detected profile must fulfill.
https://doi.org/10.1371/journal.pone.0214815.t001
Radial profile detection of spherical particles
PLOS ONE | https://doi.org/10.1371/journal.pone.0214815 April 2, 2019 5 / 16
Page 6
3 Algorithm development and results
For automated RICM image analysis, the variety of profiles hampers the utilization of most
detection algorithms, but since the profile shape follows physical laws, we can harness the
physically predicted profiles to detect and analyze the shape of adhered objects. These template
profiles are used to perform template matching over promising image regions. As an addi-
tional benefit, we can also derive the probe size and the contact radius from the best-matching
template. However, template matching is a computationally expensive procedure and thus
analyzing the full image would lead to relatively long calculation times. Prior to the template
matching, we exclude image parts from the search space by analyzing their gradient
orientation.
Based on these general considerations we developed an algorithm which follows three main
steps:
• Pre-selection based gradient orientation
• Template matching
• Data extraction and calculation of results
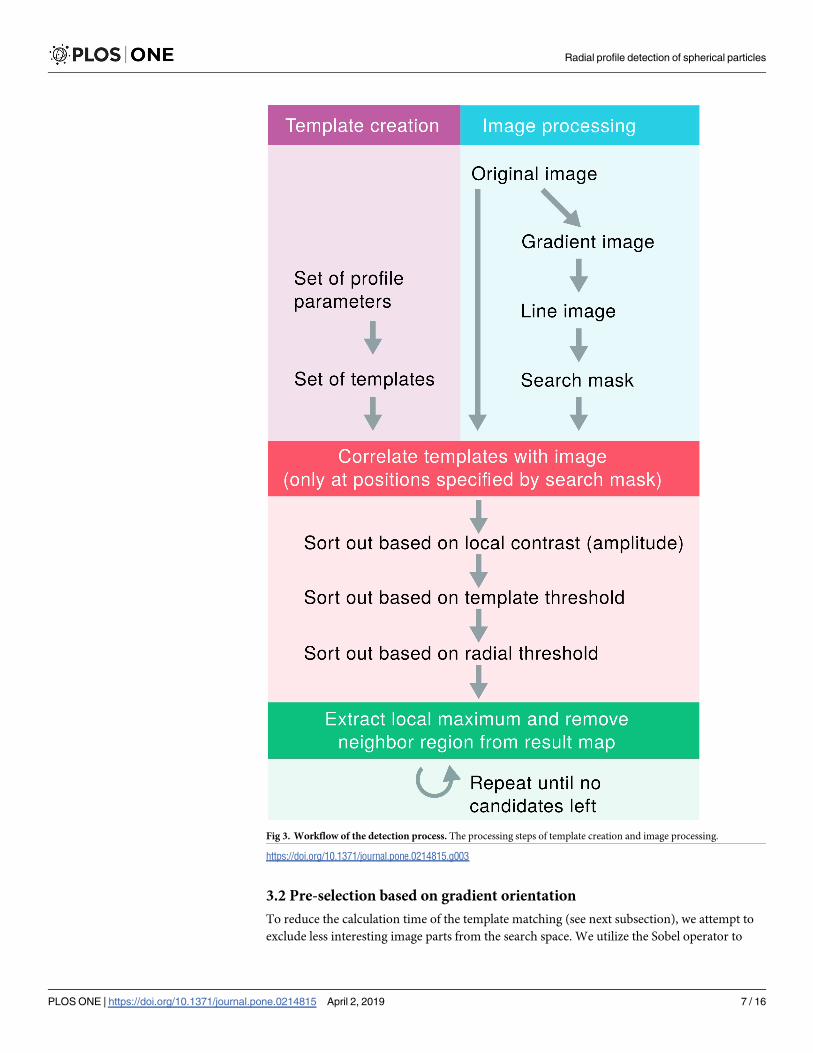
The general workflow of the image analysis algorithm and the detailed workflow of the
detection is additionally illustrated in Figs 2 and 3.
3.1 Object distance and particle size
Eq 2 requires knowledge about the distance between the surface and the SCP object at any
radius position r. Though the particles are in general spheric, recent publications describe
neck-like deformations along the border of the contact zone [20] or suggest a water meniscus
[9] around the particle (Fig 4). These effects depend e.g. on the elasto-capillarity of the surfaces
and result in image artifacts along the contact border. However, since the concrete shape of
the artifacts is hard to predict, and because of their relatively little impact on only minor
regions in the image, we assume the SCPs to be perfectly round and ignore any deformations
of the probe. These assumptions are valid, as seen from the results below and earlier reports
[1]. For touching surfaces (d� 0), we set d≔ 0 which crops the sphere. Thus, with parameters
from Table 1 we calculate the height with
hðrÞ ¼ max ð0; d þ p �ffiffiffiffiffiffiffiffiffiffiffiffiffiffip2 � r2
pÞ : ð5Þ
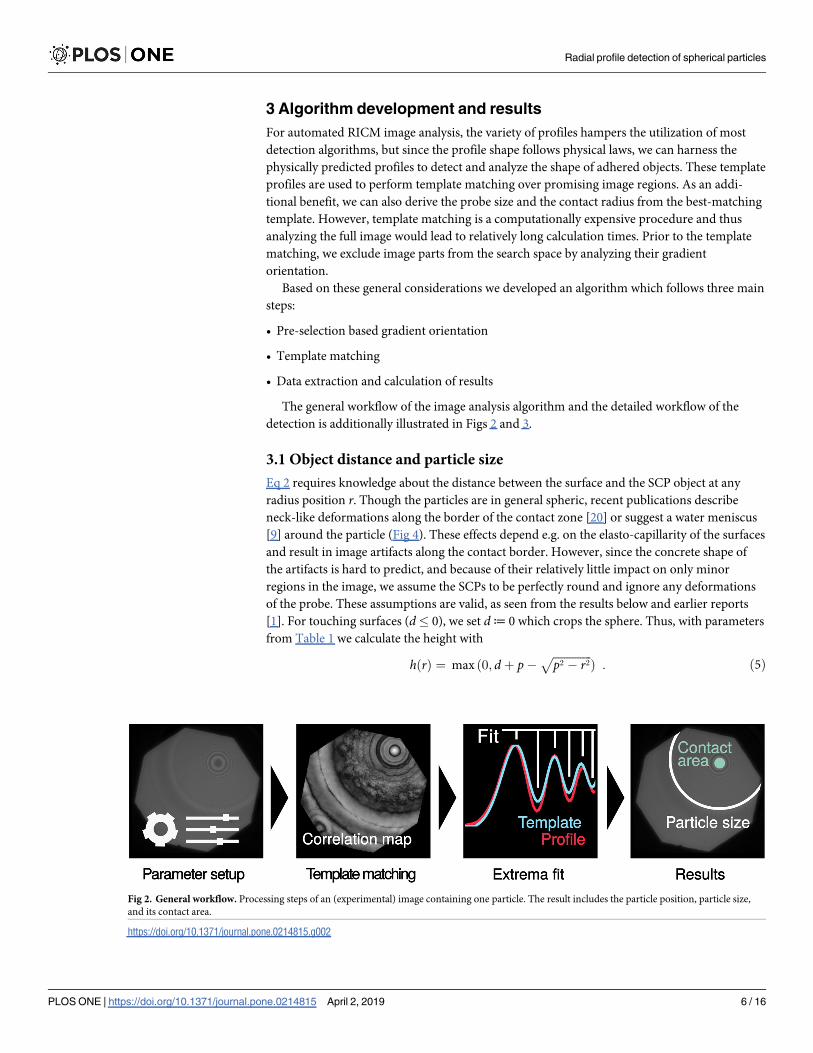
Fig 2. General workflow. Processing steps of an (experimental) image containing one particle. The result includes the particle position, particle size,
and its contact area.
https://doi.org/10.1371/journal.pone.0214815.g002
Radial profile detection of spherical particles
PLOS ONE | https://doi.org/10.1371/journal.pone.0214815 April 2, 2019 6 / 16
Page 7
3.2 Pre-selection based on gradient orientation
To reduce the calculation time of the template matching (see next subsection), we attempt to
exclude less interesting image parts from the search space. We utilize the Sobel operator to
Fig 3. Workflow of the detection process. The processing steps of template creation and image processing.
https://doi.org/10.1371/journal.pone.0214815.g003
Radial profile detection of spherical particles
PLOS ONE | https://doi.org/10.1371/journal.pone.0214815 April 2, 2019 7 / 16
Page 8
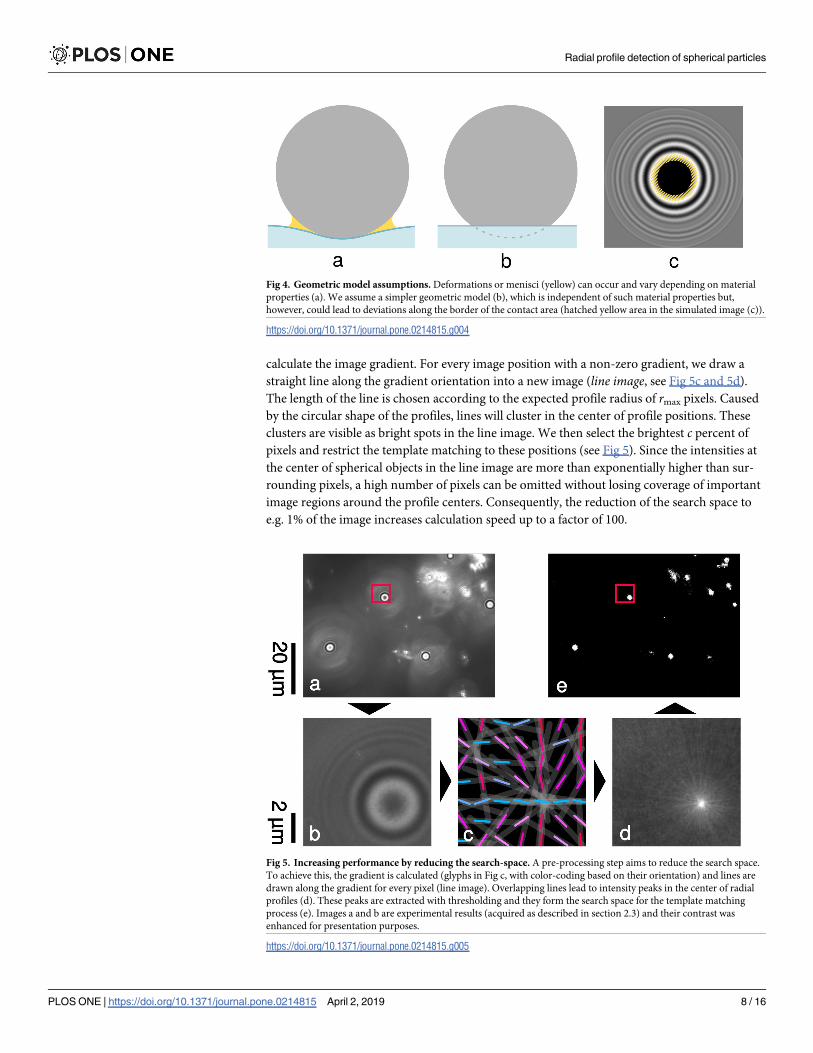
calculate the image gradient. For every image position with a non-zero gradient, we draw a
straight line along the gradient orientation into a new image (line image, see Fig 5c and 5d).
The length of the line is chosen according to the expected profile radius of rmax pixels. Caused
by the circular shape of the profiles, lines will cluster in the center of profile positions. These
clusters are visible as bright spots in the line image. We then select the brightest c percent of
pixels and restrict the template matching to these positions (see Fig 5). Since the intensities at
the center of spherical objects in the line image are more than exponentially higher than sur-
rounding pixels, a high number of pixels can be omitted without losing coverage of important
image regions around the profile centers. Consequently, the reduction of the search space to
e.g. 1% of the image increases calculation speed up to a factor of 100.
Fig 4. Geometric model assumptions. Deformations or menisci (yellow) can occur and vary depending on material
properties (a). We assume a simpler geometric model (b), which is independent of such material properties but,
however, could lead to deviations along the border of the contact area (hatched yellow area in the simulated image (c)).
https://doi.org/10.1371/journal.pone.0214815.g004
Fig 5. Increasing performance by reducing the search-space. A pre-processing step aims to reduce the search space.
To achieve this, the gradient is calculated (glyphs in Fig c, with color-coding based on their orientation) and lines are
drawn along the gradient for every pixel (line image). Overlapping lines lead to intensity peaks in the center of radial
profiles (d). These peaks are extracted with thresholding and they form the search space for the template matching
process (e). Images a and b are experimental results (acquired as described in section 2.3) and their contrast was
enhanced for presentation purposes.
https://doi.org/10.1371/journal.pone.0214815.g005
Radial profile detection of spherical particles
PLOS ONE | https://doi.org/10.1371/journal.pone.0214815 April 2, 2019 8 / 16
Page 9
3.3 Template matching
We create templates on basis of the model from Eq 2 and the distance function from Eq 5. The
parameters are mostly constrained within an experiment and we can use these limits to define
a minimum search space. We pre-calculate the profiles for a number (e.g. * 8 000) of possible
combinations.
For the actual detection process, we consider all candidate pixels provided by the pre-pro-
cessing step. At each such pixel, we sample starting from a center position (x, y) along radius
r = 1 . . . rmax. We calculate the average (pmean) of all profiles pi. With this process, noise is
reduced and image positions with radial symmetry are favored since their amplitude is maxi-
mum. With I(x, y) being the intensity at image coordinates (x, y), the sampling steps are
defined by
piðrÞ ¼ I xþ r � sin2pim
� �
; yþ r � cos2pim
� �� �
ð6Þ
and the average profile is
pmeanðrÞ ¼1
m
Xm
i¼1
piðrÞ : ð7Þ
As the next step, we calculate the Pearson correlation coefficients between pmean and all
pre-calculated templates. We save the index of the template with the highest similarity and we
also note the respective correlation in a map.
We also make use of additional constraints to reduce false positives. One problem is the fact
that correlation as comparison metric ignores the amplitude. Our solution is to define a mini-
mum amplitude a that a certain profile pmean from Eq 7 should contain after it was sampled
from the image (e.g. 5% of the whole intensity range). Profiles with lower contrast are omitted.
To further reduce false positives, we introduce a threshold for circular correlation (t2). We
only consider positions for which all samples pi have at least a certain mean correlation t2 to
pmean and thus we exclude asymmetrical image parts. This step is applicable thanks to the fact
that our objects of interest always have a spherical shape.
3.4 Extraction of matches and contact radius
The result of the previous calculation is a map of correlations and information of the respective
best-matching template. We search for the maximum value in the map. Next, we save the
respective coordinates and we store the parameters of the best-matching template. Finally, we
apply a consecutive template matching step at this position. This time we ignore the amplitude
but we focus on a good matching of the extrema (Fig 6), since they directly relate to particle
size. We define similarity by counting the number of positions with the same slope orientation
as the sampled profile has (both simultaneously falling or rising) and normalize by rmax. This
metric holds the percentage of the template and the measured profile running in synchronism.
After extraction, we set a neighborhood of radius rmax around the current match to zero and
we repeat the search process on the updated map. We stop the extraction when all positions of
the correlation map contain a value less than t1 (and thus no image position shows sufficient
similarity to any of the templates), or when a maximum number of iterations is reached. The
radius rc of the contact area can be derived from the particle radius p and particle height d,
which are associated with the respective best-matching template, by calculating the
Radial profile detection of spherical particles
PLOS ONE | https://doi.org/10.1371/journal.pone.0214815 April 2, 2019 9 / 16
Page 10
intersection of the sphere and the coverslip plane:
rc ¼ 2ffiffiffiffiffiffiffiffiffiffiffiffiffiffiffiffiffiffi2pd � d2
p: ð8Þ
Note, due to the periodicity of the cosine (right term of Eq 2), it is hardly possible to deter-
mine the absolute height of the particle. We can only compute the particle height relative to
the phase of the light
drelative ¼ offset þ il
2n 1 � sin 2 a
2
� � ; ð9Þ
where offset equals the parameter d of the best-matching template and i is an integer. For all
i� 0, the frequency of the rings is identical. The amplitude (left term of Eq 2), however, is
dependent on the absolute height, but its effect on the image is relatively low. This makes it dif-
ficult to determine i (with our simple and cost-efficient experimental setup) and thus leads to
an ambiguous solution for the absolute particle height. We could avoid this problem by an
advanced experimental setup involving dual wavelengths [21]. However, we are only interested
in touching surfaces of interacting functionalized SCPs and surfaces in physiochemical, bio-
medical and biosensing applications, hence we can assume i� 0. For negative heights, the pro-
files additionally show a distinct uniform center (the contact area) and, thus, there is no
ambiguity in the appearance of the profiles.
3.5 Evaluation
We implemented the method in a software tool that allows the user to load a series of images,
define suitable parameters (Table 1) and start batch processing of all images. We support the
user by providing parameter estimations for manually defined sample positions and by provid-
ing presets. The calculation speed grows linearly with the number of templates, the image size,
the radius of a profile, and the number of samples m. In addition, a constant time span is
required to load data and to store results. The calculation speed for a full image—without pre-
processing—is roughly 20s for one image (1 600 × 1 200 pixels) with a number of 8 000
Fig 6. Sampling and fitting of profiles. Fig a shows a RICM image and sampling at an exemplary position (brightness increased for presentation). Fig
b demonstrates the fitting procedure of the obtained profile. Our basic template fit for this example shows good Pearson correlation of 0.91, however,
adding an exponential decay for higher radii improves correlation to 0.99. To determine particle size, we fit the template regarding optimized extrema
overlap (note the better match especially of low peaks for radius positions 5 μm and higher).
https://doi.org/10.1371/journal.pone.0214815.g006
Radial profile detection of spherical particles
PLOS ONE | https://doi.org/10.1371/journal.pone.0214815 April 2, 2019 10 / 16
Page 11
templates and a maximum radius of 100 pixels. However, enabling pre-selection of image
regions (as explained in section 3.2) leads to an overall calculation time of less than 2.5s per
image (570s for a test stack of 265 images).
Starting the calculation with adequate search space usually results in a Pearson correlation
of more than 0.95 at profile positions, which is in most cases notably higher than any other
profile-free image part. For relatively complex profiles (e.g. involving intensity drops at inner
and outer radius positions) the highest correlation might also decrease to 0.8. We used test
data for which we initiated the detection process session-wise. For example, images with a con-
stant microscope setup were analyzed in one batch. For proper sampling of the profiles, it is
vital to know their accurate center position. To verify the localization of profiles, we used a test
data stack of 265 images of SCPs and PEI-coated (attractive) surfaces. All profiles have been
detected and the average distance to the manually defined reference position was 1.08 pixels
(see Fig 7a). However, false positives are occasionally caused by round objects or air bubbles
that are also present in the data. In our test case, 11 false positives have been detected, but they
were never marked as the first choice since their template correlation was comparably low.
Increasing the radial correlation threshold would reduce the number of false positives but also
leads to false negatives. In summary, we prefer to use a tolerant threshold that reliably detects
all present profiles. False positives can be quickly deleted in a manual review step.
To verify the particle size, which we derived from the parameters of the best-matching tem-
plate, we acquired another test data of SCPs on PEI-coated (attractive) surfaces showing 47 parti-
cles. The test data includes bright-field data (as reference) in which we could manually measure
the size of the SCPs. The validation of the particle diameter shows a mean absolute difference to
the reference data of 2.6 μm for particle diameters from 11 μm to 62 μm (see Fig 7b for details).
Evaluation of the contact radius faces the problem of a missing direct measurement as refer-
ence. However, the contact radius can also be estimated from the size of the flat dark area in
the center of a profile: we determined the contact radius in the average profile pmean based on
region growing. We started with the center position of the profile and iteratively selected
neighbor positions that showed similar intensity to the center position. The stopping criterion
for this process was an increase of the intensity by a certain percentage of the profile’s overall
amplitude. The concrete choice of the threshold is a trade-off between sensitivity towards
noise (too strict threshold) and overestimation of the contact radius (too tolerant threshold),
therefore we analyzed the result of 40 uniformely distributed thresholds in the range from 1%
to 40%. We then manually reviewed the results and chose the lowest threshold for which
region growing never failed, which was a value of 30%.
Our test data consists of 205 images containing in total 184 adhering particles (hence, for
these particles the best-matching template implied d� 0). We describe the relationship
between the result cmodel of the model-based approach and the result cintensity of the intensity-
based reference by the linear relationship
cmodel ¼ a � cintensity þ b : ð10Þ
For the threshold of 30%, the function lm (linear model) in R Statistics determined a = 1.0247
and b = −0.2890 μm (adjusted R2 = 0.9856), which shows a strong linear relationship of our
approach to the intensity-based reference data (see section 4.3 and Fig 7c and 7d for details).
4 Discussion
In this section we want to first discuss methodical aspects and explain the merits of the chosen
techniques compared to possible alternatives. Subsequently, we provide justification for the
simplifications and discuss the evaluation presented in section 3.5.
Radial profile detection of spherical particles
PLOS ONE | https://doi.org/10.1371/journal.pone.0214815 April 2, 2019 11 / 16
Page 12
4.1 Methodological considerations
We have developed a method that generates templates based on an established physical model.
We use a pre-processing step to accelerate the calculation and we apply Pearson correlation to
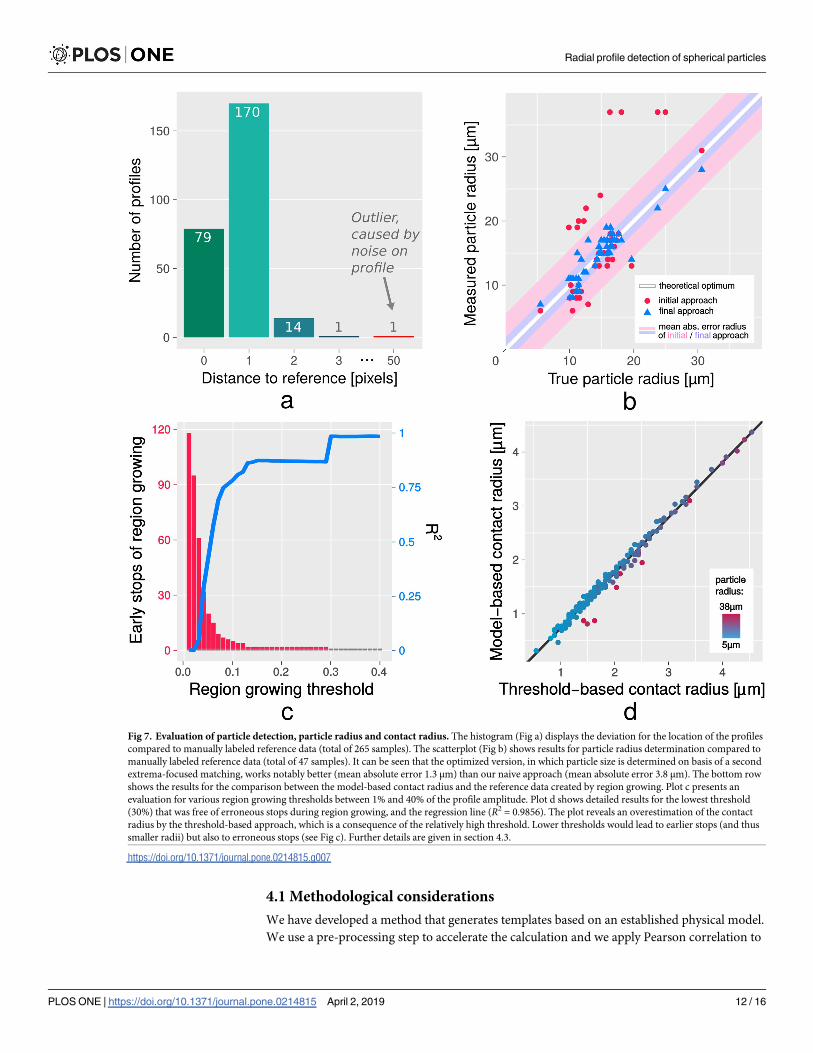
Fig 7. Evaluation of particle detection, particle radius and contact radius. The histogram (Fig a) displays the deviation for the location of the profiles
compared to manually labeled reference data (total of 265 samples). The scatterplot (Fig b) shows results for particle radius determination compared to
manually labeled reference data (total of 47 samples). It can be seen that the optimized version, in which particle size is determined on basis of a second
extrema-focused matching, works notably better (mean absolute error 1.3 μm) than our naive approach (mean absolute error 3.8 μm). The bottom row
shows the results for the comparison between the model-based contact radius and the reference data created by region growing. Plot c presents an
evaluation for various region growing thresholds between 1% and 40% of the profile amplitude. Plot d shows detailed results for the lowest threshold
(30%) that was free of erroneous stops during region growing, and the regression line (R2 = 0.9856). The plot reveals an overestimation of the contact
radius by the threshold-based approach, which is a consequence of the relatively high threshold. Lower thresholds would lead to earlier stops (and thus
smaller radii) but also to erroneous stops (see Fig c). Further details are given in section 4.3.
https://doi.org/10.1371/journal.pone.0214815.g007
Radial profile detection of spherical particles
PLOS ONE | https://doi.org/10.1371/journal.pone.0214815 April 2, 2019 12 / 16
Page 13
compare the templates with the microscope image. A consecutive fit based on the profile slope
improves the estimation of the particle radius considerably.
The method we present relies on knowledge of a very specific use-case, but with a broad
applicability in science and engineering. For example, the method may be applicable to physio-
chemical interactions of soft hydrogel particles and mimics of living cells with interacting
surfaces [22], determination of protein adsorption energies on materials surfaces [23] or bio-
sensing approaches [15, 16, 18]. Naturally, a solution based on a more general and re-usable
approach would be preferred, however many such approaches we examined lead to noisy
results or miss profile occurrences. For example, one technique we designed focused only on
statistical properties of the set of profiles pi (i = 0. . .m) from Eq 6. We searched for positions of
simultaneously low variance between all the sampled profiles pi and high variance inside the
averaged profile pmean. This approach matched positions with high rotational symmetry and
strong contrast. However, this simplified method produced less predictable special cases, and
the problem of profile evaluation remained.
Our images contained brightness shifts (vignetting) and could be noisy or cluttered due to
their application on biofunctionalized surfaces and high-throughput tasks, which impaired
results obtained by thresholding or edge detection. The variety of frequencies of the rings and
thus the strength of the edges made it particularly difficult to detect all rings of an image with a
single edge detection setup. Usually, edge detection would only be able to detect thin or thick
edges separately. Furthermore, we utilized Circle Hough Transform [12] to detect rings
formed by intensity peaks of the profile, but the result was sensitively depending on the chosen
parameters. Even in the best case only a few rings with high contrast could be found, which
might be related to the above-mentioned difficulties in edge detection. This would lead to inac-
curate results since the frequency and thus detection of every single ring is of high importance.
While classical template matching with manually defined templates could be an option, the cir-
cular patterns differ strongly in appearance, and the variance in the frequency of intensity
peaks makes it cumbersome to manually define a profile library. Another popular option has
been machine learning, which we initially considered but we lacked sufficient training data.
The number of parameters which affect the shape of the profile is comparably high and hence
many combinations of training cases would be required. Furthermore, the evaluation of the
detected profile would likely require for a second processing step and thus we rejected that
approach.
Thus, while other promising techniques may exist, we reasoned that a positive outcome was
more likely by trying to advance existing techniques that can already represent the issue with a
physical model. With developing theories on reflection interference contrast microscopy,
future updates of the model could be implemented with little effort.
4.2 Simplifications
The model we use as a basis for template calculation involves simplifications. We consider the
SCP to be perfectly spheric (see Eq 5), even for the case of touching surfaces (d� 0), although
deformations of the SCP have to be present [20]. This leads to minor artifacts on the boundary
between contact area and non-contact area, since the transition is very sharp. These artifacts
could be addressed by a more detailed model in the future, although the effects on the outcome
are considered to be of minor impact, as our validation results show. Furthermore, Eq 2
ignores changes in the angle of the light rays that were reflected from the SCP surface. An ana-
lytical solution seems to be unknown [19].
Radial profile detection of spherical particles
PLOS ONE | https://doi.org/10.1371/journal.pone.0214815 April 2, 2019 13 / 16
Page 14
4.3 Evaluation
An important metric is the correctness of the position of the detected templates. Wrong coor-
dinates would lead to an asynchronous radial sampling. This causes increased variance
between the samples pi and eventually a distorted profile pmean. Consequently, the parameters
derived from this profile would be inaccurate as well. Clack and Groves [10] verified their pre-
cision by checking if their matches were precisely placed in the center of symmetry of the mea-
sured profile, and if they were stable for repeated measurements of immobile particles. We
decided to use manually labeled reference data, since in several cases artifacts (e.g. bubbles)
lead to asymmetric patterns. Our result shows a mean deviation of 1.08 pixels (* 0.07 μm),
which seems to be very accurate.
The particle size is probably the most challenging parameter here (it suffers most from inac-
curate templates), therefore the deviation of 1.3 μm to the reference data is relatively high.
However, other methods only work with already known particle sizes from other analytical
techniques [10], but with our method a separate measurement of the particle size can be omit-
ted. The results for this parameter could probably be improved with models that allow a better
fit to the underlying RICM image.
The contact radius is often visible in the RICM images as a flat dark area in the center of the
profile, which makes it relatively easy to define by basic image processing. A challenge for
region growing are the noisy center positions of pmean. The radial averaging has only little
effect for small radii, and most extreme, at radius position 0 all profiles pi sample from the
same pixel of the image. As expected, the number of failed region growing attempts was high
for low thresholds. Therefore we chose a threshold of 30%, which resulted in valid region
growing for all test samples. Nevertheless, all thresholds of at least 10% indicated a very strong
similarity of our approach compared to the results of region growing. Due to the tolerant
threshold, region growing usually stopped relatively late, which results in an overestimation of
the contact radius (as can be seen in the offset b = −0.2890 μm from the linear regression). An
evaluation based on a lower threshold led to b closer to 0 μm, but more outliers led to a worse
R2. Our reference data contained particles from 5 μm to 38 μm (mean: 13.84 μm). The absolute
error between our results and the reference data (mean: 0.0643 μm) depended moderately on
the particle size (Pearson correlation of 0.5492, which means that deviations were higher for
larger particles) but it was independent from the contact radius (Pearson correlation of
-0.0296).
In summary, we attempted to validate the most important parameters of our approach to
reference data (see further details in S1 Dataset). At this point a direct comparison to alterna-
tive approaches is hard, since previous work made no claims concerning the accuracy towards
separate reference data. Furthermore, previous work neither aimed at determination of parti-
cle size nor at optimization of the calculation speed.
5 Conclusion
We demonstrated an efficient and accurate detection of multiple radial profiles in RICM
images. The focus of the work lies on image analysis algorithm development (and its valida-
tion) using a gradient analysis of the image and template matching. We used theoretical tem-
plates based on basic physical foundations of RICM microscopy with minor adaptation for
known deviations [4]. Our new method always chose the real template position as top match,
but sometimes additional false positives were detected. The position is detected precisely (devi-
ation of 1.08 pixels compared to reference data) and the determination of the particle diameter
delivers results within a mean error of 2.6 μm for particles with an average diameter of 30 μm.
Although template matching is computationally expensive, we achieve relatively quick
Radial profile detection of spherical particles
PLOS ONE | https://doi.org/10.1371/journal.pone.0214815 April 2, 2019 14 / 16
Page 15
processing times (<2.5 s per image) thanks to the pre-processing step. Our approach also
delivers implicit data about the detected objects derived from the best-matching template.
These values include particle radius and contact radius of the SCP and they are of importance
for determining adhesion energies between the SCP and its underlying surface in physico-
chemical, biomedical and biosensing applications.
Supporting information
S1 Dataset. Numerical data from the evaluation of the particle position, particle size, and
contact area.
(ZIP)
Author Contributions
Data curation: Tilo Pompe, David Rettke, Stephan Schmidt.
Methodology: Johannes Waschke, Tilo Pompe.
Project administration: Tilo Pompe, Stephan Schmidt.
Software: Johannes Waschke.
Supervision: Tilo Pompe, Stephan Schmidt, Mario Hlawitschka.
Writing – original draft: Johannes Waschke.
Writing – review & editing: Tilo Pompe, David Rettke, Stephan Schmidt, Mario Hlawitschka.
References
1. Pussak D, Behra M, Schmidt S, Hartmann L. Synthesis and functionalization of poly (ethylene glycol)
microparticles as soft colloidal probes for adhesion energy measurements. Soft Matter. 2012;
8(5):1664–1672. https://doi.org/10.1039/C2SM06911C
2. Erath J, Schmidt S, Fery A. Characterization of adhesion phenomena and contact of surfaces by soft
colloidal probe AFM. Soft Matter. 2010; 6(7):1432–1437. https://doi.org/10.1039/b923540j
3. Moy VT, Jiao Y, Hillmann T, Lehmann H, Sano T. Adhesion energy of receptor-mediated interaction
measured by elastic deformation. Biophys J. 1999; 76(3):1632–1638. https://doi.org/10.1016/S0006-
3495(99)77322-4 PMID: 10049343
4. Radler J, Sackmann E. On the measurement of weak repulsive and frictional colloidal forces by reflec-
tion interference contrast microscopy. Langmuir. 1992; 8(3):848–853. https://doi.org/10.1021/
la00039a019
5. Johnson KL, Kendall K, Roberts A. Surface energy and the contact of elastic solids. Proc R Soc Lond A.
1971; 324(1558):301–313. https://doi.org/10.1098/rspa.1971.0141
6. Radler J, Sackmann E. Imaging optical thicknesses and separation distances of phospholipid vesicles
at solid surfaces. J Phys II. 1993; 3(5):727–748. https://doi.org/10.1051/jp2:1993163
7. Wiegand G, Neumaier KR, Sackmann E. Microinterferometry: three-dimensional reconstruction of sur-
face microtopography for thin-film and wetting studies by reflection interference contrast microscopy
(RICM). Appl Opt. 1998; 37(29):6892–6905. https://doi.org/10.1364/AO.37.006892 PMID: 18301506
8. Contreras-Naranjo JC, Silas JA, Ugaz VM. Reflection interference contrast microscopy of arbitrary con-
vex surfaces. Appl Opt. 2010; 49(19):3701–3712. https://doi.org/10.1364/AO.49.003701 PMID:
20648136
9. Contreras-Naranjo JC, Ugaz VM. A nanometre-scale resolution interference-based probe of interfacial
phenomena between microscopic objects and surfaces. Nat Commun. 2013; 4:1919. https://doi.org/10.
1038/ncomms2865 PMID: 23715278
10. Clack NG, Groves JT. Many-particle tracking with nanometer resolution in three dimensions by reflec-
tion interference contrast microscopy. Langmuir. 2005; 21(14):6430–6435. https://doi.org/10.1021/
la050372r PMID: 15982050
Radial profile detection of spherical particles
PLOS ONE | https://doi.org/10.1371/journal.pone.0214815 April 2, 2019 15 / 16
Page 16
11. Attili S, Richter RP. Combining colloidal probe atomic force and reflection interference contrast micros-
copy to study the compressive mechanics of hyaluronan brushes. Langmuir. 2012; 28(6):3206–3216.
https://doi.org/10.1021/la204602n PMID: 22216832
12. Kimme C, Ballard D, Sklansky J. Finding circles by an array of accumulators. Commun ACM. 1975;
18(2):120–122. https://doi.org/10.1145/360666.360677
13. Raut SA, Raghuwanshi M, Dharaskar R, Raut A. Image segmentation–a state-of-art survey for predic-
tion. In: 2009 International Conference on Advanced Computer Control. IEEE; 2009. p. 420–424.
14. Russakovsky O, Deng J, Su H, Krause J, Satheesh S, Ma S, et al. Imagenet large scale visual recogni-
tion challenge. Int J Comput Vis. 2015; 115(3):211–252. https://doi.org/10.1007/s11263-015-0816-y
15. Schmidt S, Wang H, Pussak D, Mosca S, Hartmann L. Probing multivalency in ligand–receptor-medi-
ated adhesion of soft, biomimetic interfaces. Beilstein J Org Chem. 2015; 11:720–729. https://doi.org/
10.3762/bjoc.11.82 PMID: 26124875
16. Strzelczyk AK, Wang H, Lindhorst A, Waschke J, Pompe T, Kropf C, et al. Hydrogel microparticles as
sensors for specific adhesion: case studies on antibody detection and soil release polymers. Gels.
2017; 3(3):31. https://doi.org/10.3390/gels3030031
17. Wang H, Jacobi F, Waschke J, Hartmann L, Lowen H, Schmidt S. Elastic modulus dependence on the
specific adhesion of hydrogels. Adv Funct Mater. 2017; 27(41):1702040. https://doi.org/10.1002/adfm.
201702040
18. Pussak D, Ponader D, Mosca S, Ruiz SV, Hartmann L, Schmidt S. Mechanical carbohydrate sensors
based on soft hydrogel particles. Angew Chem Int Ed. 2013; 52(23):6084–6087. https://doi.org/10.
1002/anie.201300469
19. Limozin L, Sengupta K. Quantitative reflection interference contrast microscopy (RICM) in soft matter
and cell adhesion. ChemPhysChem. 2009; 10(16):2752–2768. https://doi.org/10.1002/cphc.
200900601 PMID: 19816893
20. Butt HJ, Pham JT, Kappl M. Forces between a stiff and a soft surface. Curr Opin Colloid Interface Sci.
2017; 27:82–90. https://doi.org/10.1016/j.cocis.2016.09.007
21. Schilling J, Sengupta K, Goennenwein S, Bausch AR, Sackmann E. Absolute interfacial distance mea-
surements by dual-wavelength reflection interference contrast microscopy. Phys Rev E. 2004; 69
(2):021901. https://doi.org/10.1103/PhysRevE.69.021901
22. Martin S, Wang H, Rathke T, Anderegg U, Moller S, Schnabelrauch M, et al. Polymer hydrogel particles
as biocompatible AFM probes to study CD44/hyaluronic acid interactions on cells. Polymer. 2016;
102:342–349. https://doi.org/10.1016/j.polymer.2016.02.019
23. Martin S, Wang H, Hartmann L, Pompe T, Schmidt S. Quantification of protein–materials interaction by
soft colloidal probe spectroscopy. Phys Chem Chem Phys. 2015; 17(5):3014–3018. https://doi.org/10.
1039/c4cp05484a PMID: 25560365
Radial profile detection of spherical particles
PLOS ONE | https://doi.org/10.1371/journal.pone.0214815 April 2, 2019 16 / 16