Page 1
1
« Radiation Characterization and Test MethodologyStudy of Optocoupler Devices for Space Applications »Work Order WO01/CO03, ESA/ESTEC contract n°11755/NL/PB
© Astrium2 Novembre 2000
Contents
1 Study objectives
2 Test Plan
3 Current Transfer Ratio (CTR) variation with proton fluence
4 CTR variation with neutron fluence
5 CTR variation with Total Ionizing Dose (TID)
6 Comparison between ionization and displacement damage
7 Comparison between proton energies
8 Comparison between proton and neutron + dose
9 Conclusion
Page 2
2
Study Objectives
1© Astrium3 Novembre 2000
© Astrium4 Novembre 2000
Study objectives
● Establish an industrial methodology for optocoupler radiation testing
✔ validate the calculation of equivalent monoenergetic proton fluence with help of NIEL, whatever proton energy is concerned
✔ quantify the additional degradation due to ionizing dose when proton testing does not allow to reach expected in flight dose level (electron rich orbits)
✔ validate the possibility to perform a combination of [neutron + ionizing dose] testing instead of proton testing
Page 3
3
Test Plan
2© Astrium5 Novembre 2000
© Astrium6 Novembre 2000
Test Plan 1/
● Devices tested
Devicetype
Manuf. Version Proton samplesize
Neutron/TIDsample size
TIDsample size
4N49 Optek Standard 15 x 3 Ep 18 18(HDR)+18(LDR)
4N49 Isolink standard 15 x 3 Ep 18 18(HDR)+18(LDR)
4N49 Micropac standard 15 x 3 Ep 18 18(HDR)+18(LDR)
66099 Micropac Hardened to
displac t damage and
TID
12 x 3 Ep 12 9(HDR)+9(LDR)
66168 Micropac Hardened to
displac t damage
15 x 3 Ep 18 18(HDR)+18(LDR)
66163 Micropac standard 15 x 3 Ep 18 18(HDR)+18(LDR)
OLH249 Isolink Hardened to
displac t damage
12@Ep=60 MeV
9@Ep=200 MeV
9 9(HDR)+9(LDR)
Page 4
4
© Astrium7 Novembre 2000
Test Plan 1/
● Optocoupler description
© Astrium8 Novembre 2000
Test Plan 2/
● Electrical testing conditions for proton, neutron and 60Co experiment
✔ 3 biasing mode during irradiation : Static ON : If = 1 mA, 10 mA or static OFF
Static ON mode Static OFF mode
+
Vcc=5V
R1
R2
Optocoupler
Optocoupler
Page 5
5
© Astrium9 Novembre 2000
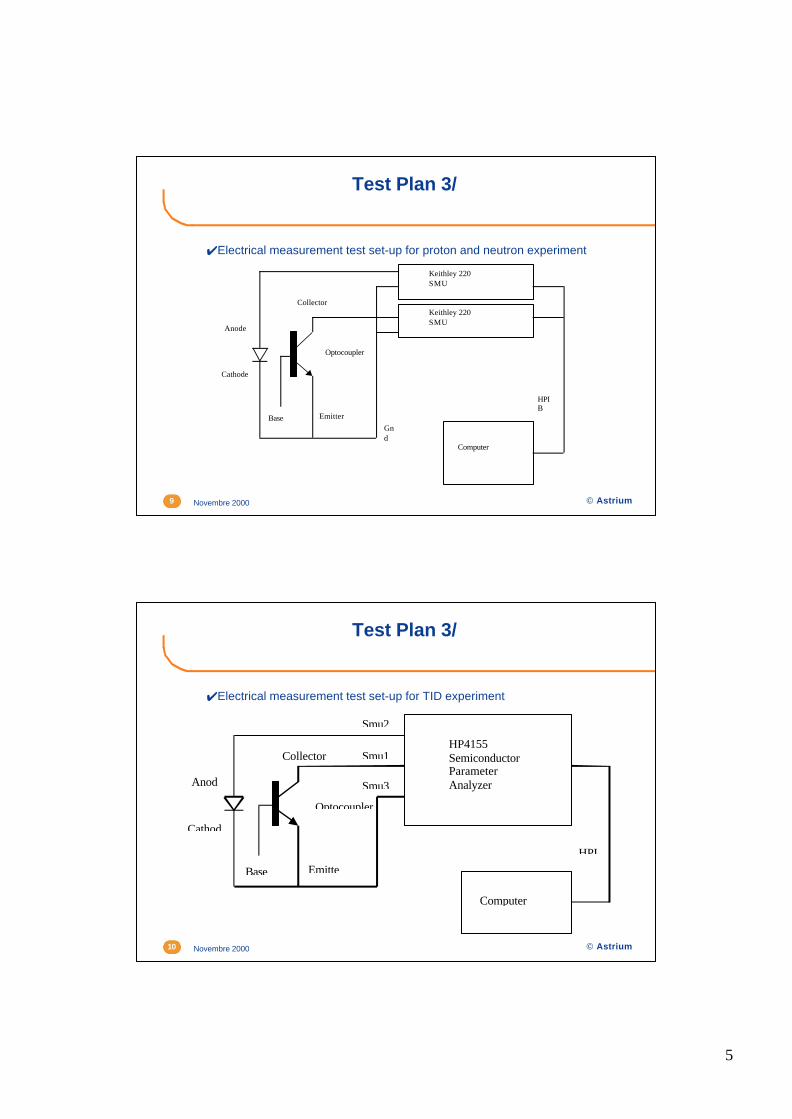
Test Plan 3/
✔Electrical measurement test set-up for proton and neutron experiment
Optocoupler
HPIB
Computer
Keithley 220SMU
Anode
Cathode
Base
Collector
Emitter
Keithley 220SMU
Gnd
© Astrium10 Novembre 2000
Test Plan 3/
✔Electrical measurement test set-up for TID experiment
Optocoupler
HPI
Computer
HP4155SemiconductorParameterAnalyzer
Smu2
Smu1
Smu3Anod
Cathod
Base
Collector
Emitte
Page 6
6
© Astrium11 Novembre 2000
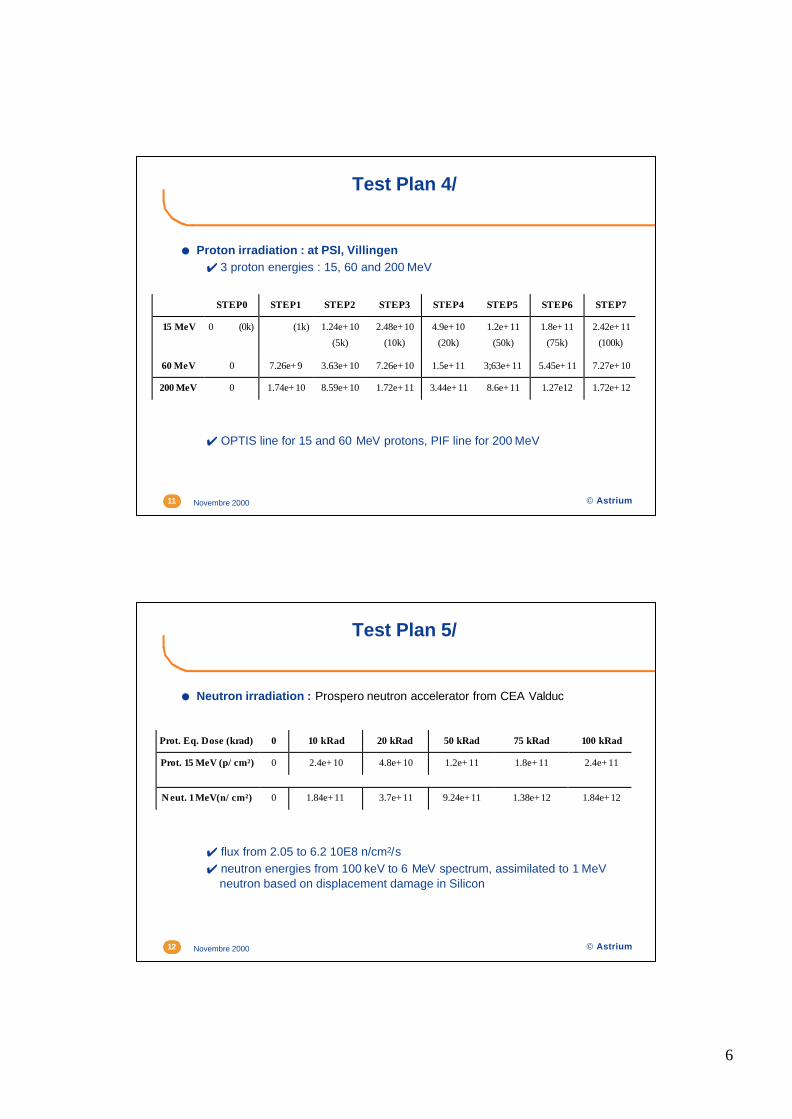
Test Plan 4/
● Proton irradiation : at PSI, Villingen✔ 3 proton energies : 15, 60 and 200 MeV
✔ OPTIS line for 15 and 60 MeV protons, PIF line for 200 MeV
STEP0 STEP1 STEP2 STEP3 STEP4 STEP5 STEP6 STEP7
15 MeV 0 (0k) (1k) 1.24e+10
(5k)
2.48e+10
(10k)
4.9e+10
(20k)
1.2e+11
(50k)
1.8e+11
(75k)
2.42e+11
(100k)
60 MeV 0 7.26e+9 3.63e+10 7.26e+10 1.5e+11 3;63e+11 5.45e+11 7.27e+10
200 MeV 0 1.74e+10 8.59e+10 1.72e+11 3.44e+11 8.6e+11 1.27e12 1.72e+12
© Astrium12 Novembre 2000
Test Plan 5/
● Neutron irradiation : Prospero neutron accelerator from CEA Valduc
✔ flux from 2.05 to 6.2 10E8 n/cm2/s✔ neutron energies from 100 keV to 6 MeV spectrum, assimilated to 1 MeV
neutron based on displacement damage in Silicon
Prot. Eq. Dose (krad) 0 10 kRad 20 kRad 50 kRad 75 kRad 100 kRad
Prot. 15 MeV (p/cm²) 0 2.4e+10 4.8e+10 1.2e+11 1.8e+11 2.4e+11
Neut. 1 MeV(n/cm²) 0 1.84e+11 3.7e+11 9.24e+11 1.38e+12 1.84e+12
Page 7
7
© Astrium13 Novembre 2000
Test Plan 6/
● Cobalt 60 irradiation✔low dose rate (<140 rad/h) : Shepherd 484, ASTRIUM, Velizy
steps for low dose rate experiment
✔high dose rate (50 krad/h) : PAGURE line, CISbio Int., Saclay
steps for high dose rate experiment
0 kRad 10 kRad 22 kRad 39 kRad 56 kRad 66 kRad 75 kRad 102 kRad
0 kRad 20 kRad 50 kRad 100 kRad
CTR degradation with TID
3© Astrium14 Novembre 2000
Page 8
8
© Astrium15 Novembre 2000
CTR degradation with TID 1/
● Example of CTR degradation with TID : standard device
30
40
50
60
70
80
90
100
0 10 20 30 40 50 60 70 80 90 100
dose [krad(Si)]
CT
R1
(%)
If = 0 mA (OFF) If = 1 mA If = 10 mA
4N49 (Micropac)
© Astrium16 Novembre 2000
CTR degradation with TID 2/
● Example of CTR degradation with TID : hardened device
70
80
90
100
0 10 20 30 40 50 60 70 80 90 100
dose [krad(Si)]
CT
R1
(%)
If = 0 mA (OFF)If = 1 mAIf = 10 mA
66168 (Micropac)
Page 9
9
CTR degradation with proton fluence
4© Astrium17 Novembre 2000
© Astrium18 Novembre 2000
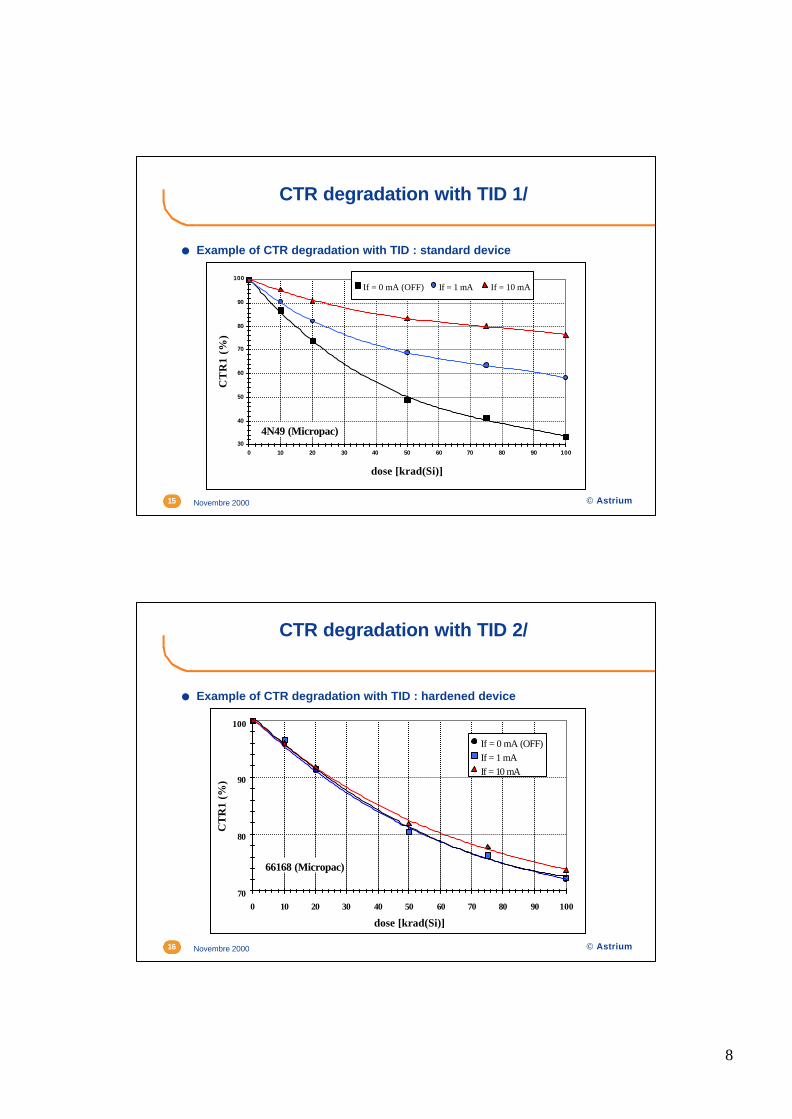
CTR degradation with proton fluence 1/
● Example of CTR degradation with proton fluence : standard device
0
10
20
30
1,E+10 2,E+10 3,E+10 4,E+10 5,E+10 6,E+10 7,E+10 8,E+10 9,E+10 1,E+11
fluence p15 MeV (p/cm2)
CT
R1
(%)
If = 0 mA (OFF)If = 1 mAIf = 10 mA
4N49 (micropac)
Page 10
10
© Astrium19 Novembre 2000
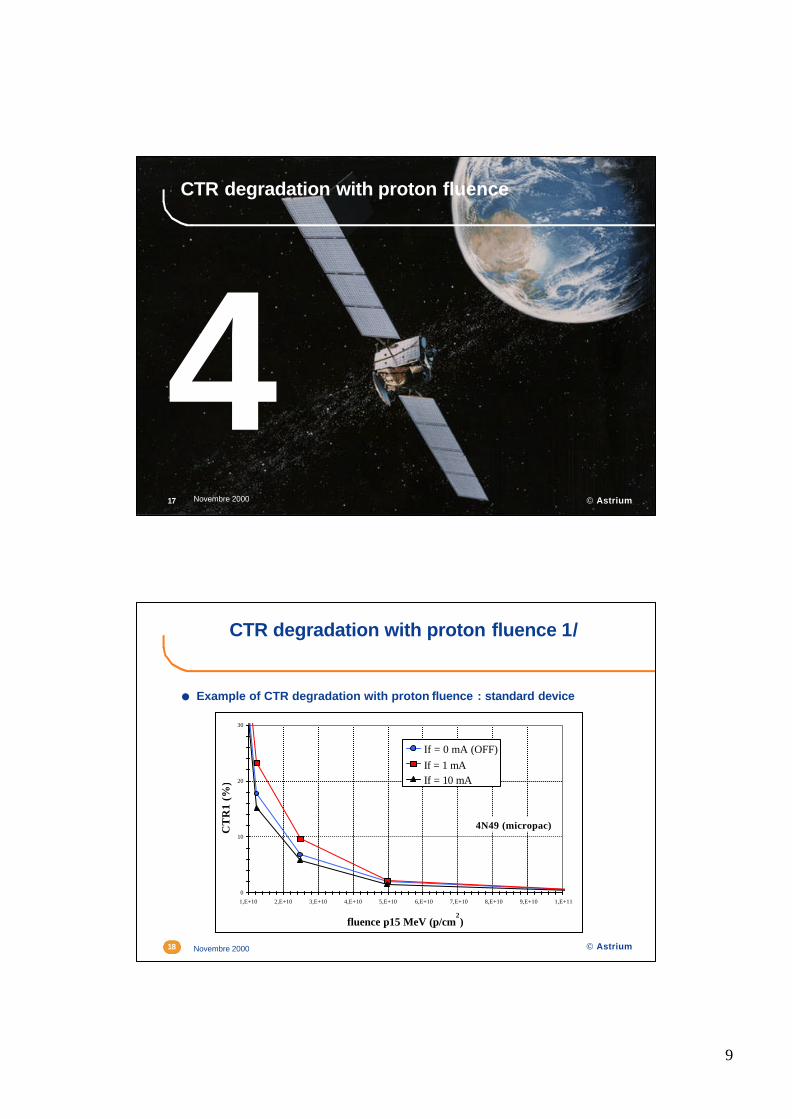
CTR degradation with proton fluence 2/
● Example of CTR degradation with proton fluence : hardened device
0
10
20
30
40
50
60
70
80
90
100
1,E+09 1,E+10 1,E+11 1,E+12
fluence p15 MeV (p/cm 2)
CT
R1
(%)
If = 0 mA (OFF)If = 1 mAIf = 10 mA
66168 (micropac)
CTR degradation with neutron fluence
5© Astrium20 Novembre 2000
Page 11
11
© Astrium21 Novembre 2000
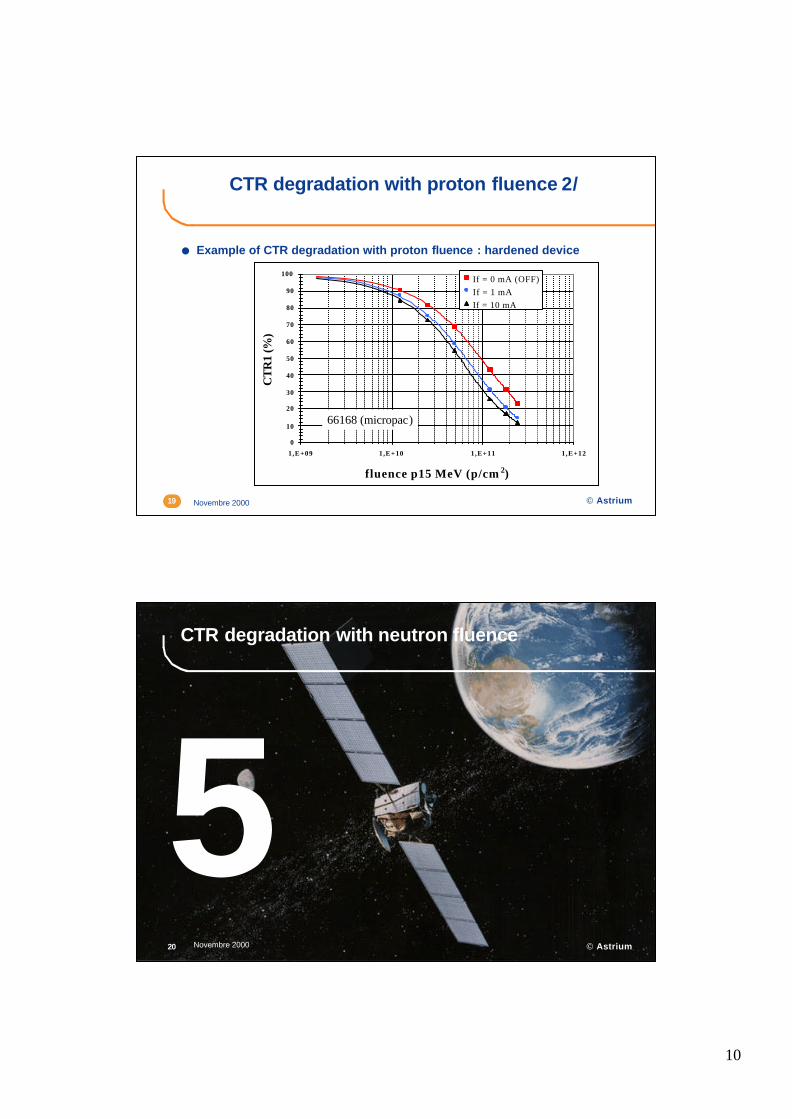
CTR degradation with neutron fluence 1/2
● Example of CTR degradation with neutron fluence : standard device
0,00
10,00
20,00
30,00
0 1 2 3 4 5 6 7 8 9 10 11 12 13 14
Fluence neut. 1 MeV *1011
(n/cm2)
CT
R1
(%)
If = 0 mA (OFF)
If = 1 mAIf = 10 mA
4N49 (Isolink)
© Astrium22 Novembre 2000
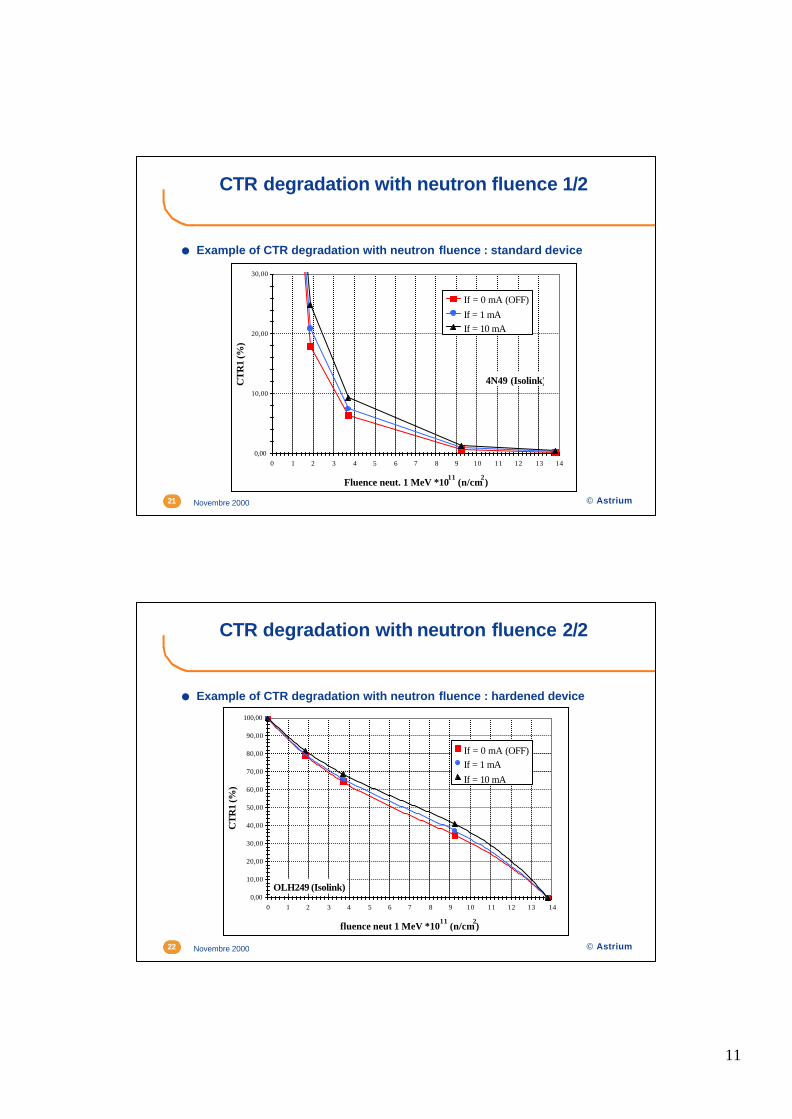
CTR degradation with neutron fluence 2/2
● Example of CTR degradation with neutron fluence : hardened device
0,00
10,00
20,00
30,00
40,00
50,00
60,00
70,00
80,00
90,00
100,00
0 1 2 3 4 5 6 7 8 9 10 11 12 13 14
fluence neut 1 MeV *1011
(n/cm2)
CT
R1
(%)
If = 0 mA (OFF)If = 1 mA
If = 10 mA
OLH249 (Isolink)
Page 12
12
Comparison between ionization anddisplacement damage
6© Astrium23 Novembre 2000
© Astrium24 Novembre 2000
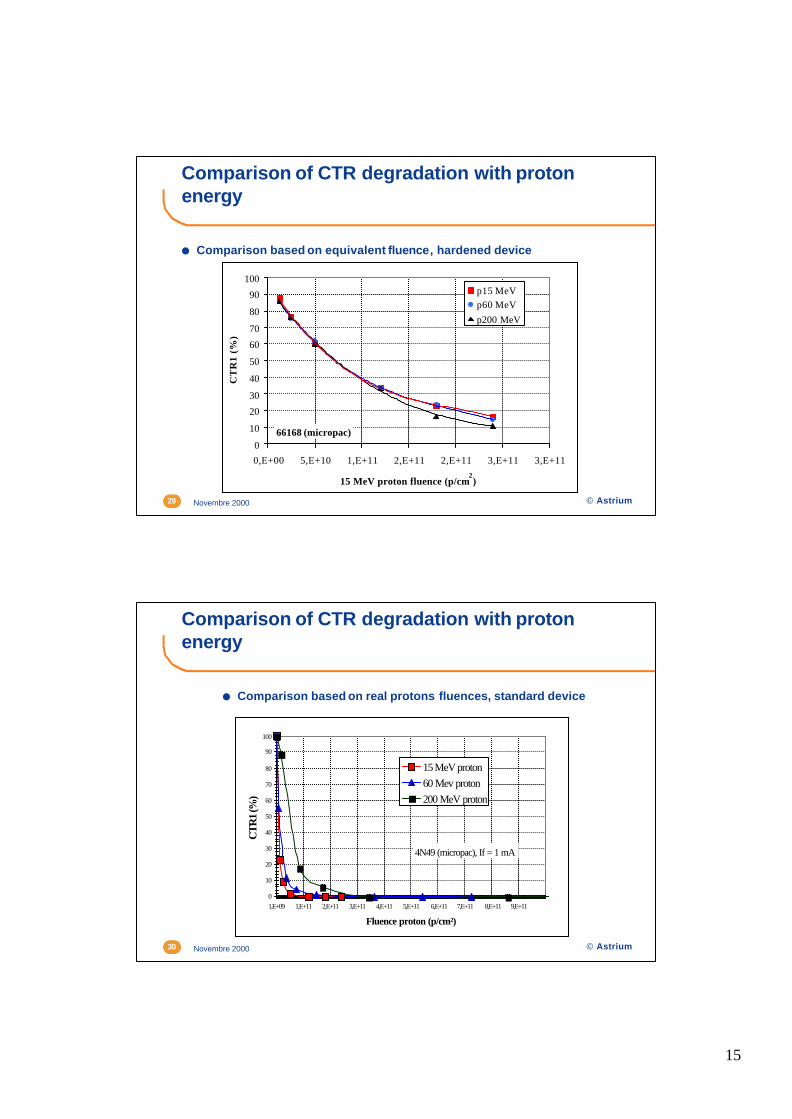
Comparison between ionization and displacementdamage
● Standard device
0
10
20
30
40
50
60
70
80
90
100
0 10 20 30 40 50 60 70 80 90 100
Dose [krad(Si)]
CT
R1
(%)
15 MeV protonCobalt 60
4N49 (micropac), If = 1 mA
Page 13
13
© Astrium25 Novembre 2000
Comparison between ionization and displacementdamage
● Hardened device
0
10
20
30
40
50
60
70
80
90
1 0 0
0 20 40 60 80 1 0 0
Dose [krad(Si)]
CT
R1
(%)
15 MeV protonCobalt 60
66168 (micropac, If = 1 mA
Comparison of CTR degradation with protonenergy
7© Astrium26 Novembre 2000
Page 14
14
© Astrium27 Novembre 2000
Comparison of CTR degradation with protonenergy
● Comparison based on real protons fluences, hardened device
0
10
20
30
40
50
60
70
80
90
100
0,E+00 2,E+11 4,E+11 6,E+11 8,E+11 1,E+12 1,E+12 1,E+12 2,E+12 2,E+12 2,E+12
fluence protons [p/cm2]
CT
R1
(%)
15 MeV proton60 MeV proton200 MeV proton
66168 (Micropac), If = 1 mA
© Astrium28 Novembre 2000
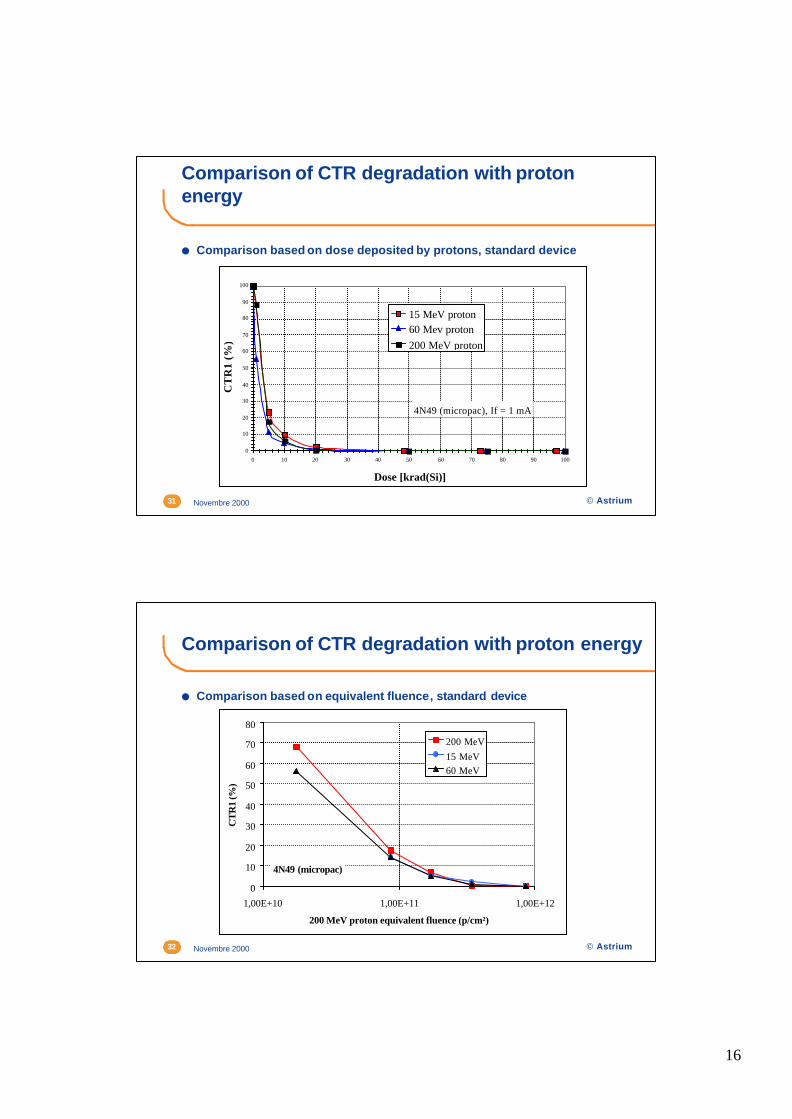
Comparison of CTR degradation with protonenergy
● Comparison based on dose deposited by protons, hardened device
0
10
20
30
40
50
60
70
80
90
1 0 0
0 20 40 60 80 1 0 0
Dose [krad(Si)]
CT
R1
(%)
15 MeV proton60 MeV proton
200 MeV proton
66168 (micropac), If = 1 mA
Page 15
15
© Astrium29 Novembre 2000
Comparison of CTR degradation with protonenergy
● Comparison based on equivalent fluence, hardened device
0
10
20
30
40
50
60
70
80
90
100
0,E+00 5,E+10 1,E+11 2,E+11 2,E+11 3,E+11 3,E+11
15 MeV proton fluence (p/cm2)
CT
R1
(%)
p15 MeVp60 MeV
p200 MeV
66168 (micropac)
© Astrium30 Novembre 2000
Comparison of CTR degradation with protonenergy
● Comparison based on real protons fluences, standard device
0
10
20
30
40
50
60
70
80
90
100
1,E+09 1,E+11 2,E+11 3,E+11 4,E+11 5,E+11 6,E+11 7,E+11 8,E+11 9,E+11
Fluence proton (p/cm²)
CTR
1 (%
)
15 MeV proton60 Mev proton200 MeV proton
4N49 (micropac), If = 1 mA
Page 16
16
© Astrium31 Novembre 2000
Comparison of CTR degradation with protonenergy
● Comparison based on dose deposited by protons, standard device
0
10
20
30
40
50
60
70
80
90
100
0 10 20 30 40 50 60 70 80 90 100
Dose [krad(Si)]
CT
R1
(%)
15 MeV proton60 Mev proton200 MeV proton
4N49 (micropac), If = 1 mA
© Astrium32 Novembre 2000
Comparison of CTR degradation with proton energy
● Comparison based on equivalent fluence, standard device
0
10
20
30
40
50
60
70
80
1,00E+10 1,00E+11 1,00E+12
200 MeV proton equivalent fluence (p/cm²)
CT
R1
(%)
200 MeV
15 MeV60 MeV
4N49 (micropac)
Page 17
17
Comparison of CTR degradation with protonand neutron
8© Astrium33 Novembre 2000
© Astrium34 Novembre 2000
Comparison of CTR degradation with proton andneutron
● Comparison based on equivalent fluence, hardened device
0
20
40
60
80
100
120
0,E+00 5,E+10 1,E+11 2,E+11 2,E+11 3,E+11 3,E+11
15 MeV proton fluence (p/cm2)
CT
R1
(%)
p15 MeV
p60 MeV
p200 MeV
1 MeV neutron
66168 (micropac)
Page 18
18
© Astrium35 Novembre 2000
Comparison of CTR degradation with proton andneutron
● Comparison based on equivalent fluence, standard device
0
10
20
30
40
50
60
70
80
90
100
1,00E+10 1,00E+11 1,00E+12
200 MeV proton equivalent fluence (p/cm²)
CT
R1
(%)
200 MeV15 MeV
60 MeV1 MeV neutron
4N49 (micropac)
Conclusion
9© Astrium36 Novembre 2000
Page 19
19
© Astrium37 Novembre 2000
Conclusion 1/2
● A lot a data to analyse!
● Displacement damage is the main degradation mechanism
● biasing conditions during irradiation have an impact only for standarddevices, for CTR values measured at low If
● NIEL concept works well, when using Barry ’s table
● protons and neutrons results very well correlated for hardened devices,slight differences for unhardened devices
● Test methodology applicable for all optocoupler types
© Astrium38 Novembre 2000
Conclusion 2/2
● Still to perform
✔analysis of dose rate influence for Cobalt 60 results
✔complete tables for 3 remaining types
✔analysis of neutron spectrum in GaAs