Atomic Energy of Canada Limited RADIATION DOSIMETRY IN WR-1 REACTOR PART El. lONIZATION CHAMBERS by K.K. MEHTA and A.M. STADNYK Whiteshell Nucleor Research Establishment Pinawa, Manitoba January 1972 AECL-3796
Transcript
Atomic Energy of Canada Limited
RADIATION DOSIMETRY IN WR-1 REACTOR
PART El. lONIZATION CHAMBERS
by
K.K. MEHTA and A.M. STADNYK
Whiteshell Nucleor Research Establishment
Pinawa, Manitoba
January 1972
AECL-3796
ATOMIC ENERGY OF CANADA LIMITED
RADIATION DOSIMETRY IN WR-1 REACTOR
PART I I . IONIZATION CHAMBERS
by
K.K. Mehta and A.M. Stadnyk
Manuscript prepared August 1971
Whiteshell Nuclear Research Establishment
Pinawa, Manitoba
January, 1972
AECL-3796
RADIATION DOSIMETRY IN WR-1 REACTOR
PART II. IONIZATION CHAMBERS
by
K.K. Mehta and A.M. Stadnyk
ABSTRACT
An ionization chamber for measuring gamma-ray energy deposition
in nuclear reactors has been developed which is capable of continuous
operation at temperatures up to at least 500 C. It is sufficiently small
to be incorporated within in-core experiments with negligible flux
depression. It is rugged, simple in construction and reliable, and
accurate to within 5%.
Gamma-ray dose rates have been measured in the WR-1 reactor.
The values for the centre line of the fuel rod for carbon, magnesium, iron
and Zircaloy-2 are 109, 110, 104 and 114 mW.g'VkW.cm"1, respectively.
The effective value of the gamma-ray mass energy-transfer
coefficient for these materials is calculated for the reactor gamma-ray
spectrum and its relation to the gamma-ray dose rate discussed.
Atomic Energy of Canada Limited
Whiteshell Nuclear Research Establishment
Pinawa, Manitoba
January,1972
AECL-3796
Dosimétrie des radiations dans le réacteur WR-1
II Partie - Chambres d'ionisation
par
K.K. Mehta et A.M. Stadnyk
Résumé
Une chambre d'ionisation permettant de mesurer les
dépôts actifs des rayons gamma dans les réacteurs nucléaires
a été mise au point. Elle peut fonctionner continuellement à
des températures allant au moins jusqu'à 500°C. Elle est assez
petite pour accompagner des expériences faites en réacteur, sans
déprimer notablement le flux. Elle est solide, de construction
simple et sûre et sa précision est inférieure à 5%.
Des débits de dose de rayons gamma ont été mesurés
dans le réacteur WR-1. Les valeurs à la ligne centrale de la
barre de combustible pour le carbone, le magnésium, le fer et
le Zircaloy-2 sont respectivement 109, 110, 104 et 114 mW.g"1/kW.cm"1.
La valeur effective du coefficient de transfert masse-
énergie des rayons gamma correspondant à ces matériaux est
calculée pour le spectre des rayons gamma du réacteur et son
rapport avec le débit de dose des rayons gamma fait l'objet d'un
commentaire.
L'Energie Atomique du Canada, Limitée
Etablissement de Recherches Nucléaires de Whiteshell
Pinawa, Manitoba
AECL-3796
CONTENTS
1. INTRODUCTION 1
2. IONIZATION CHAMBER 2
3. IRRADIATION AND MEASURING EQUIPMENT 6
4. EXPERIMENTAL PROCEDURE 7
5. RESULTS 9
6. DISCUSSION 11
7. CONCLUSION 1 k
8. REFERENCES 15
APPENDIX I Fabrication of the Ionization Chamber 17
APPENDIX II Fricke Dosimetry for the Reference Gamma-RayField 20
APPENDIX III Estimation of Correction to Measured DoseRates 24
FIGURES
Page
1. Dependence of Gamma-Ray Mass Energy-TransferCoefficient and Fast-Neutron Dose Rate on AtomicNumber 26
2. Whiteshtll High Temperature Ionization Chamber, LineDrawing 27
3. Whiteshell High Temperature Ionization Chamber, X-RayPhotograph 28
4. Whiteshell High Temperature Ionization Chamber, Dis-assembled 29
5. Cross Section of the Hollow Hanger Fuel Assembly,
Mark III 30
6. Cross Section of WR-1 Fuel Bundle 31
7. Electrical Circuit for Measuring Ionization Current 32
8. Saturation Curve 33
9. Axial Variation of Ionization Chamber Response alotvgFuel Channel 34
TABLES
Sensitivity of Various lonization Chambers 7
Corrections and Corrected Dose Rates for Carbon,Magnesium, Iron and Zircaloy-2 in WR-1 Reactor 10
Proportionality of Dose Rate to Effective MassEnergy-Transfer Coefficient 12
Comparison of Experimental and Calculated Fast-Neutron Dose Rates 14
1. INTRODUCTION
This is Part II of a three-part series on "Radiation Dosimetry
in WR-1 Reactor". Part I 1 consists of calorimetric measurements in the
WR-1 reactor, while Part III 2 deals with thermal and fast neutron flux
densities at various irradiation positions in WR-1. This report describes
the ionization chamber and measurements taken in WR-1.
There are many types of radiation present in a reactor, e.g.
neutrons, gamma rays, fission products, and charged particles such as
protons and alpha particles. Of these, gamma rays and fast neutrons are
the most important for dosimetry since they are the main contributors to
the absorbed energy. The dose rates due to these two sources should be
known separately because the dependence of chemical or physical effects on
the energy deposition is different for each of them; the ionization densities
for protons (knocked out by fast neutrons) and electrons (generated by
gamma rays) differ markedly.
Calorimeters have been used to measure the total energy
deposited in a material 1 . Ionization chambers measure mainly the gamma-
ray dose rates; then, as the total dose rates from calorimetry are known,
the fast-neutron dose rates can be calculated. Like the calorimeters, the
ionization chambers are operable at 500 C and are smaller than h inch in
diameter. The high temperature requirement is essential for power reactor
dosimetry and for experiments located inside a materials testing reactor.
Small chambers can be accommodated much more easily in in-core experiments
and the small size avoids perturbing the radiation field.
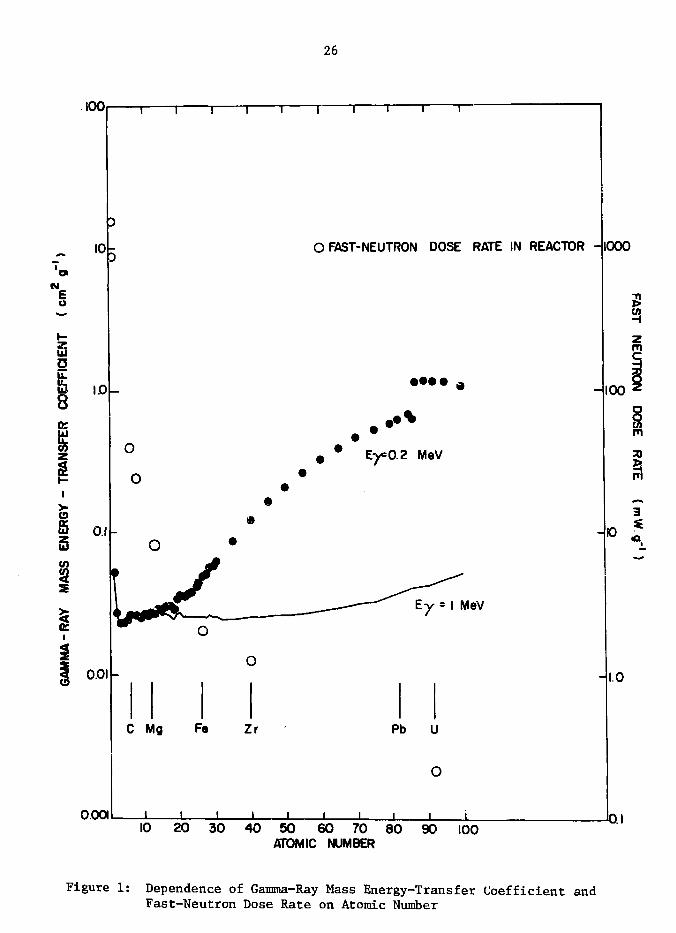
Several chambers were made with walls of different materials
to study the variation of the gamma-ray and the fast-neutron dose rates with
atomic number. Fig. 1 shows the dependence of the gamma-ray mass energy-
transfer coefficient (which is proportional to the gamma-ray dose rate) on
the atomic number for two gamma-ray energies^3 . The computer-calculated
fast-neutron dose rate for a reactor spectrum is also shown in the same
figure for several materials . Four materials, viz., carbon, magnesium
(in alloy form), iron and zirconium in the form Zircaloy-2, were chosen to
study these effects. They are common reactor materials (except, perhaps,
magnesium) because of their low neutron absorption cross sections.
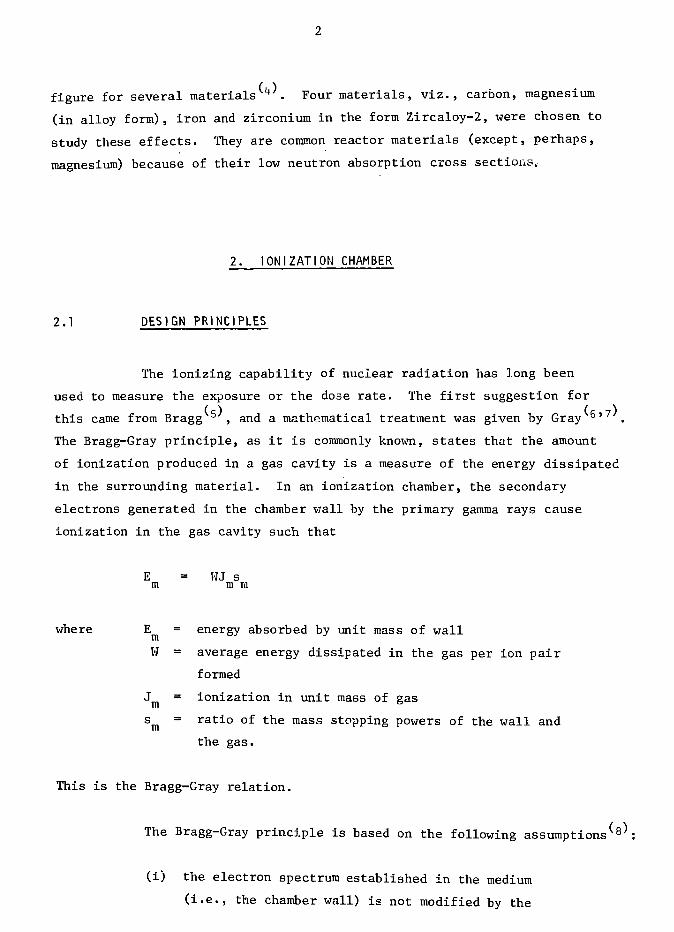
2. IONIZATION CHAMBER
2.1 DESIGN PRINCIPLES
The ionizing capability of nuclear radiation has long been
used to measure the exposure or the dose rate. The first suggestion for
this came from Bragg 5 , and a mathematical treatment was given by Gray 6'7 .
The Bragg-Gray principle, as it is commonly known, states that the amount
of ionization produced in a gas cavity is a measure of the energy dissipated
in the surrounding material. In an ionization chamber, the secondary
electrons generated in the chamber wall by the primary gamma rays cause
ionization in the gas cavity such that
E = WJ sm m rn
where E = energy absorbed by unit mass of wall
W = average energy dissipated in the gas per ion pair
formed
J = ionization in unit mass of gas
s^ = ratio of the mass stopping powers of the wall and
the gas.
This is the Bragg-Gray relation.
The Bragg-Gray principle is based on the following assumptions^
(i) the electron spectrum established in the medium
( i . e . , the chamber wall) is not modified by the
presence of the gas cavity;
(ii) photon interactions generating electrons in the
cavity are negligible.
These conditions are fulfilled if the cavity size is sufficiently small
compared with the range in the gas of the radiation traversing it. The
electron spectrum will remain undisturbed if the atomic composition of the
gas is the same as that of the chamber wall, and in this case the size
limitation can be relaxed. The rigorous proof of this theorem is due to
Fano 9 . Also, since the mass stopping power ratio depends upon the
gamma-ray energy, it is desirable to have a matched ionization chamber,
i.e. s = 1.m
In designing the Whiteshell ionization chambers, some degree of
compromise was necessary between the above principles and practical
considerations of size and the ambient temperature in the reactor*.
2.2 CHAMBER WALL
Since we wanted to measure the dose rate in various materials,
a series of similar ionization chambers with different wall materials,
viz., carbon, magnesium, iron and Zircaloy-2, were made. The carbon wall
was of pyrolytic graphite with isotropic planes to make it impervious to
argon gas**. For use as an absolute dosimeter, the gas should match the
wall in each case. Since this was not practical each chamber was
calibrated in a known gamma-ray field. The chosen wall thickness of
2.5 mm was sufficient for the practical fulfillment of the Bragg-Gray
requirements. It generated an equilibrium spectrum of secondary
electrons and shielded the cavity from practically all externally
generated electrons. Since the wail scatters gamma rays disturbing the
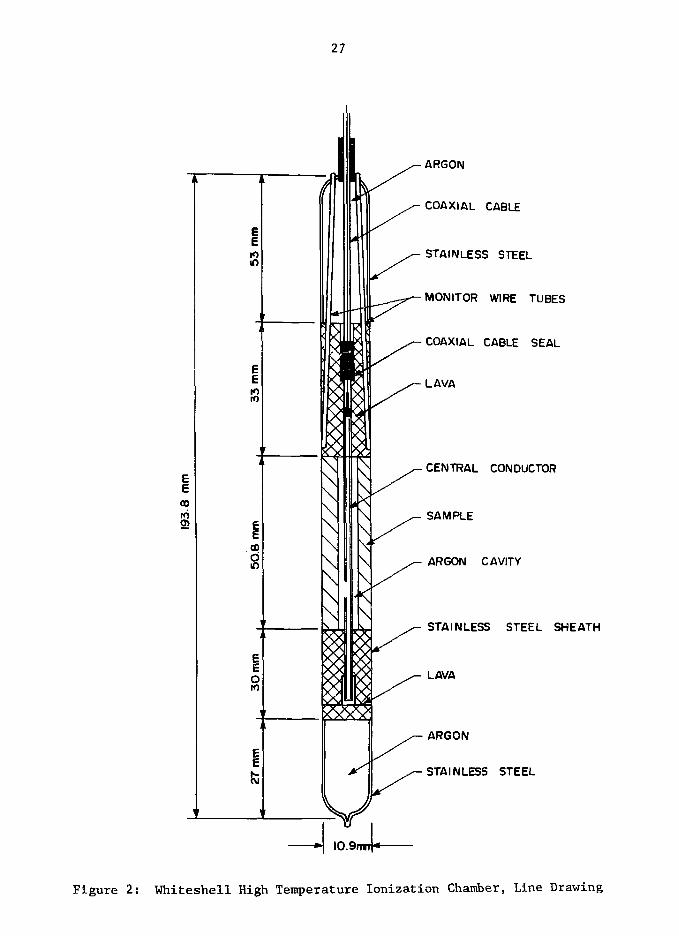
* See Figs. 2, 3, 4** Fabricated by H.R. Lee of Fuel Development Branch, WNRE.
gamma-ray field, it was kept as thin as possible. The inside surface of
the wall was machined smooth and kept clean. The wall was 5.1 cm long,
which defined the ion-collecting region. A 0.15 mm thick stainless steel
sheath formed the outer container for all the chambers.
2,3 GAS CAViTY
If a and b are the outer and the inner radii of the gas
cavity, i t is desirable to have a small a/b ratio to minimize the voltage
needed for efficient collection of the ions. Also there is a danger of
ionization by collision near the central conductor where the field strength
is maximum. For the Whiteshell ionization chamber the ratio a/b was 2.36.
The cavity was 1.06 cm3.
Argon was used as the cavity gas because of i ts chemical
stability, absence of unwanted nuclear reactions and a small response to
fast neutrons.
2.k CENTRAL CONDUCTOR
The central conductor was a stainless s teel tubing of 2.42 mm
OD and 1.27 mm ID. The tubing rather than a solid rod was used to minimize
generation of gamma rays and beta rays inside the chamber.
2.5 INSULATOR
The insulator which separates the two electrodes must be
stable at high temperatures and during irradiation. The insulator used
within the Whiteshell chamber was Lava*, which is mainly aluminum silicate
and is available commercially. It was easy to machine before the heat
* Supplied by American Lava Corporation, Chattanooga, Tenn.
treatment and became very hard after the treatment. Its electrical
resistivity was 2 x 10⁹ ohm.cm at 300°C and 5 x 10⁶ ohm.cm at 500°C.
It was stable under radiation for at least two weeks (longest duration
of our experiment). Once it was treated at high temperature, it was
stable against dimensional changes at high temperatures.
2.6 SIGNAL CABLE
The coaxial cable used for transporting the ionization current
from the chamber must be resistant to radiation and high temperatures.
Because of the length required to reach the reactor core (> 5 m) some
flexibility was desired. The insulator must have a very high resistivity
at the working temperature and radiation intensity. We used a coaxial
cable 12 m long and 1.6 mm in diameter. The outer sheath and central
conductor (dia. = 0.25 mm) were made of stainless steel while the insulator
was MgO. The resistance across the MgO when the cable was connected to
the chamber was greater than 10 ohm at room temperature.
Since MgO is hygroscopic, exposing it to atmosphere would
result in deterioration of the insulation resistance (owing to the absorbed
moisture). The cable, therefore, was always stored with the ends sealed
with epoxy glue. During the fabrication of the ionization chamber, the
time interval during which MgO came in contact with the atmosphere was
kept to a minimum. The chamber end of the coaxial cable was sealed using
a high-temperature seal, while at the other end epoxy glue was used. When,
inadvertently, moisture entered the insulation, heating the cable was
sufficient to drive the moisture out. The condition of the insulation was
judged by the value of its electrical resistance. If necessary, in extreme
cases several inches of cable may be discarded.
A major difficulty encountered when developing our high
temperature chambers was the leakage of the cavity gas into the cable
insulation. This loss of gas would cause a decrease in the sensitivity of
the chamber. To prevent this, the chamber end of the cable had to be
sealed against any gas leakage. This seal at the same time should be a
good electrical insulator. Since we were unable to obtain such a seal
commercially, we developed a seal which has operated successfully for at
least 10 days at 5OJ°C in the reactor*.
Details of the fabrication of the Whiteshell ionization
chamber are given in Appendix I.
3. IRRADIATION AND MEASURING EQUIPMENT
The WR-1 reactor and the irradiation equipment are discussed
in more detail in Ref. (1). All the ionization chamber measurements were
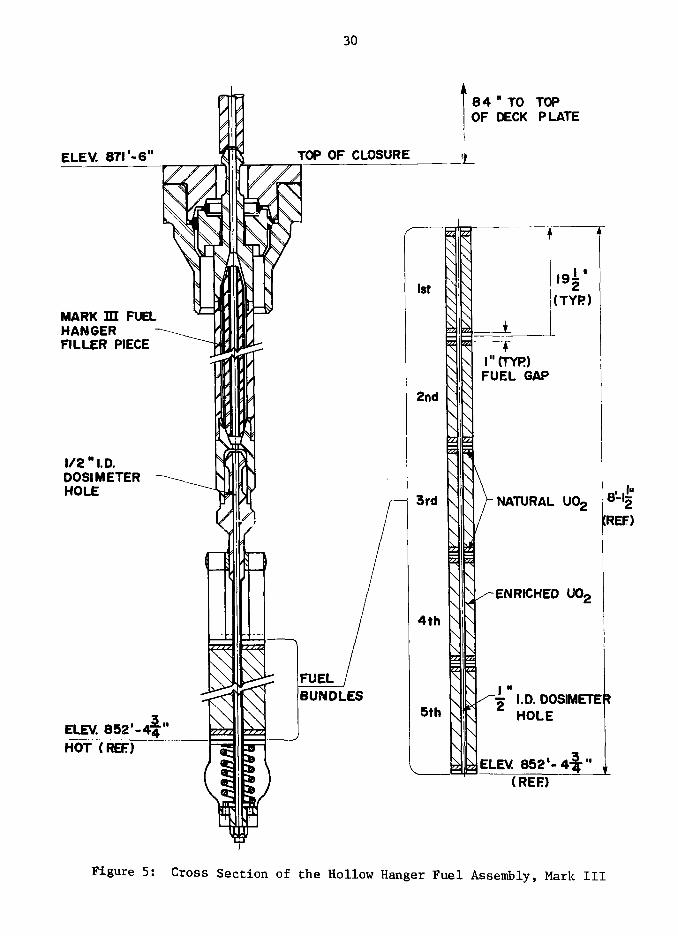
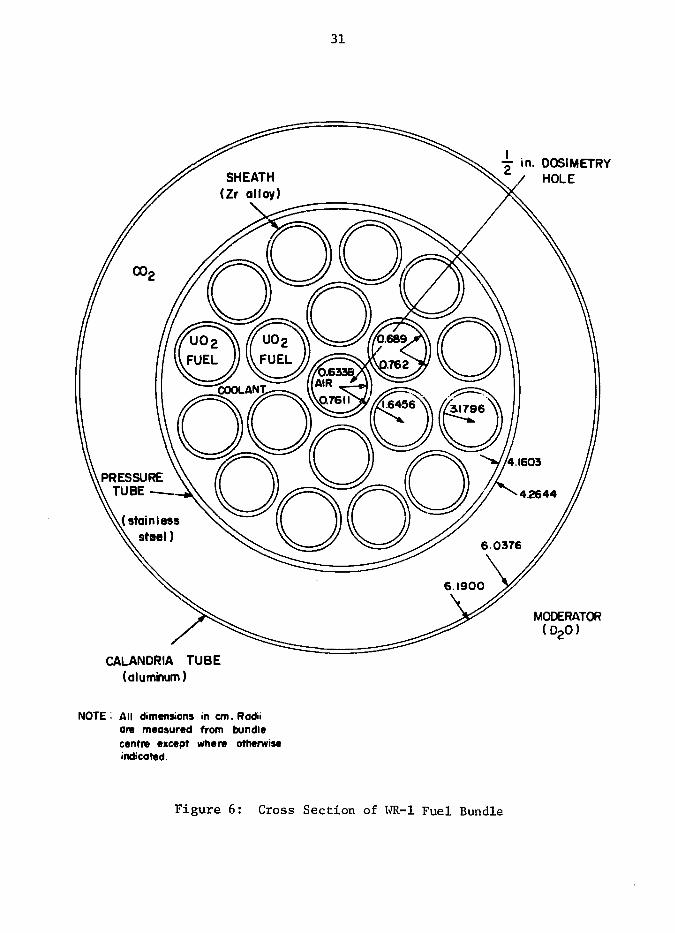
made in the hollow hanger fuel assembly, which is a standard WR-1 18-element
fuel rod with a % inch hole in the centre (see Fig. 5). Figure 6 shows the
cross section of the fuel region. The temperature of the ionization
chamber during the measurements reached 500 C maximum when the coolant
temperature was at 400 C. A special irradiation flask 10 was used to
introduce the ionization chamber into the hollow hanger rod. The vertical
position of the chamber was known within 0.25 in. from the revolution
counter on the flask.
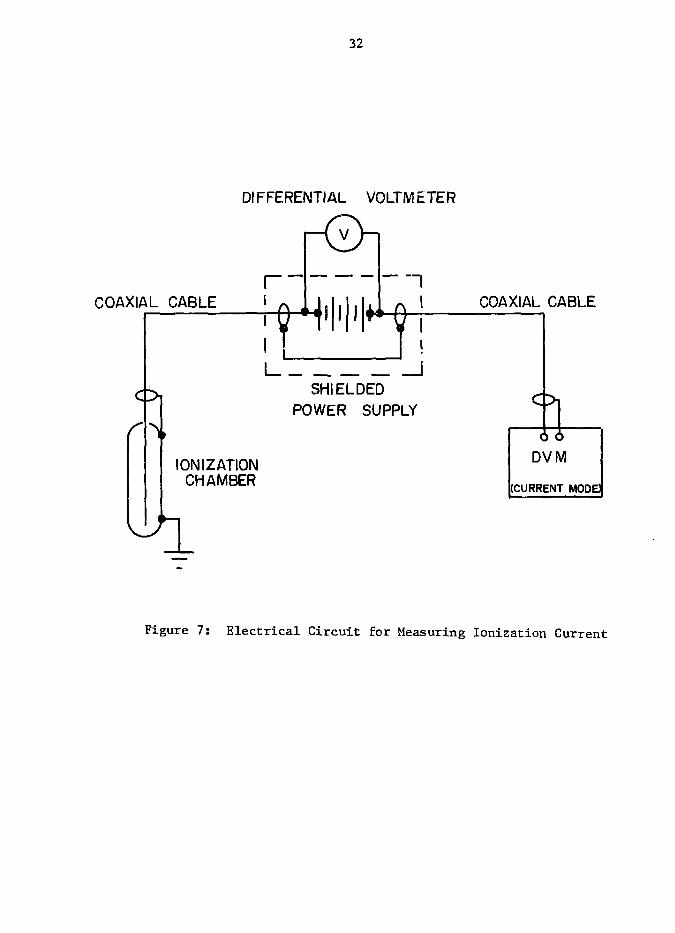
To measure the ionization current generated in the chamber
cavity, the electrical circuit shown in Figure 7 was used. All the
connections (except the one going to the chamber) were low noise polythene-
insulated coaxial cables. A 300 volt dry battery with a voltage dividing
circuit in a shielded metal box was used to apply the electrical field
to the chamber. The voltage was varied smoothly between 0 V and 300 V
and was measured by a differential voltmeter. A digital volt meter, DVM,
measured the ionization current. The entire circuit was floating electri-
cally except for a possible grounding of the ionization chamber wall in
the reactor. The uncertainty associated with the current measurement was
The details of the seal are the subject of patent investigation.
less than one per cent.
h. EXPERIMENTAL PROCEDURE
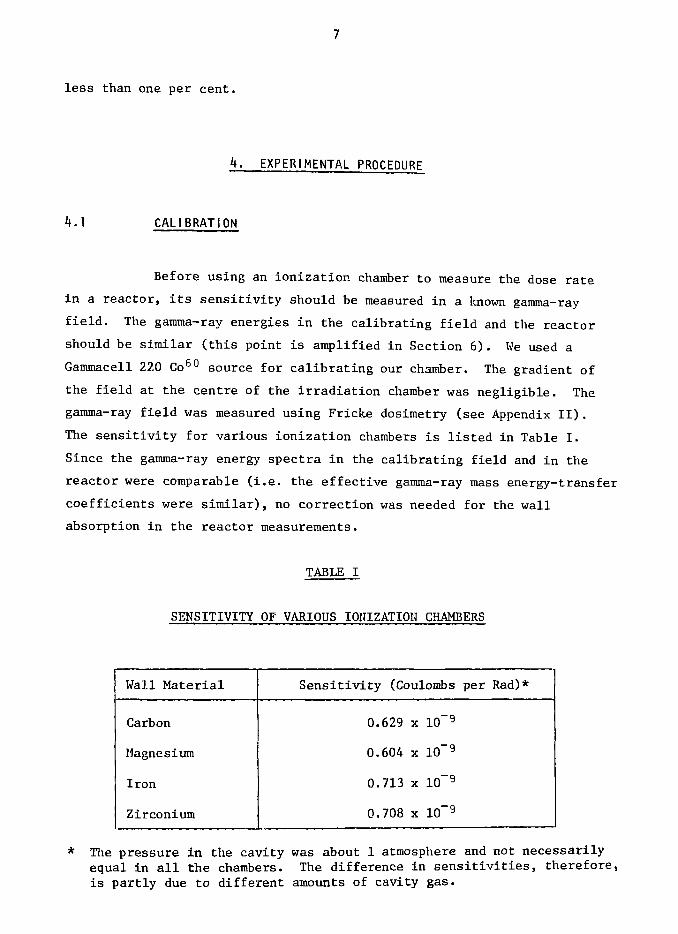
4.1 CALIBRATION
Before using an ionization chamber to measure the dose rate
in a reactor, its sensitivity should be measured in a known gamma-ray
field. The gamma-ray energies in the calibrating field and the reactor
should be similar (this point is amplified in Section 6). We used a
Gammacell 220 Co60 source for calibrating our chamber. The gradient of
the field at the centre of the irradiation chamber was negligible. The
gamma-ray field was measured using Fricke dosimetry (see Appendix II).
The sensitivity for various ionization chambers is listed in Table I.
Since the gamma-ray energy spectra in the calibrating field and in the
reactor were comparable (i.e. the effective gamma-ray mass energy-transfer
coefficients were similar), no correction was needed for the wall
absorption in the reactor measurements.
TABLE I
SENSITIVITY OF VARIOUS IONIZATION CHAMBERS
Wall Material
Carbon
Magnesium
Iron
Zirconium
Sensitivity (Coulombs per Rad)*
0.629 x 10~9
0.604 x 10"9
0.713 x 10"9
0.708 x 10~9
* The pressure in the cavity was about 1 atmosphere and not necessarilyequal in all the chambers. The difference in sensitivities, therefore,is partly due to different amounts of cavity gas.
h.2 REACTOR MEASUREMENT
The ionization chamber, with potential applied, was lowered from
the irradiation flask to a desired position (usually the mid-point of the
third bundle), in the hollow hanger rod. Once the current was steady
(which took about 15 minutes) a current saturation curve was obtained by
varying the applied potential between 0 and 250 volts (see Fig. 8).
Generally, the chamber was then left at the position for several hours to
check that the response was steady. A decreasing signal would indicate
loss of gas either to the atmosphere or into the insulation of the cable.
After ensuring that the chamber was leak-tight, it was moved to various other
positions in the rod to measure the dose rates there, and also to locate
the fuel gaps between the bundles 1 . Some measurements were made at lower
reactor power.
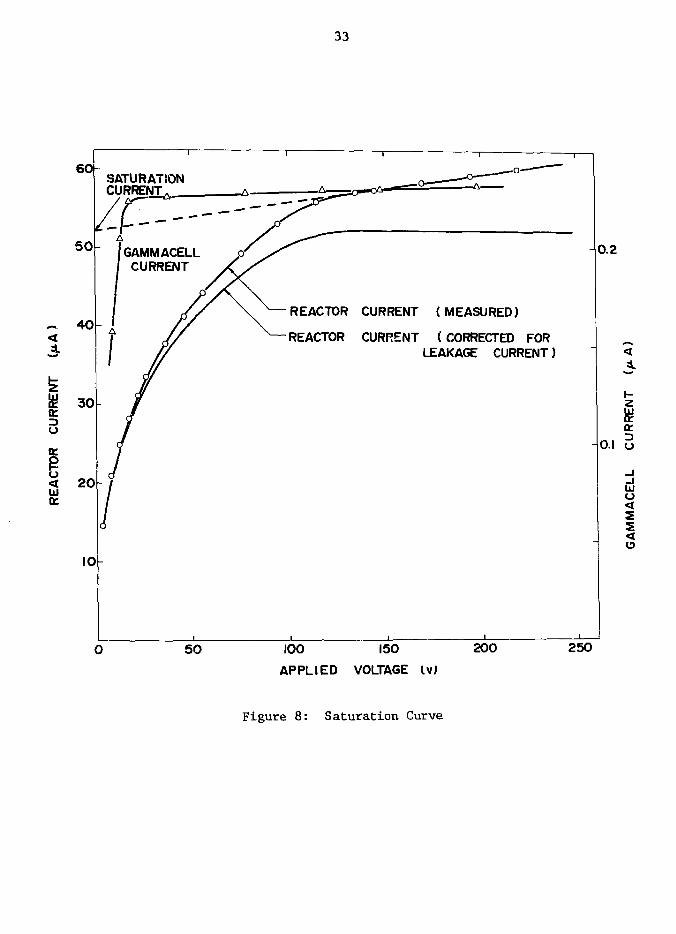
*4.3 SATURATION CURRENT
Since the ionization in the cavity gas is proportional to the
dose rate in the wall material, the saturation current (current when
collection efficiency is unity) must be measured accurately. In the
absence of any extraneous source of current, the measured current would
reach an equilibrium value (saturation current) as the applied voltage is
increased. It can be seen from Fig. 8 that an equilibrium value was
reached at about 150 V. However, the current increased linearly as the
electric field was further increased. From this linear behaviour it was
concluded that the increase was due to leakage current (I = — ) , sinceR
the insulation has some finite resistance, R. The value of R was
determined from the slope of the linear portion of the measured saturation
curve and a corrected saturation curve was plotted Csee Fig. 8).
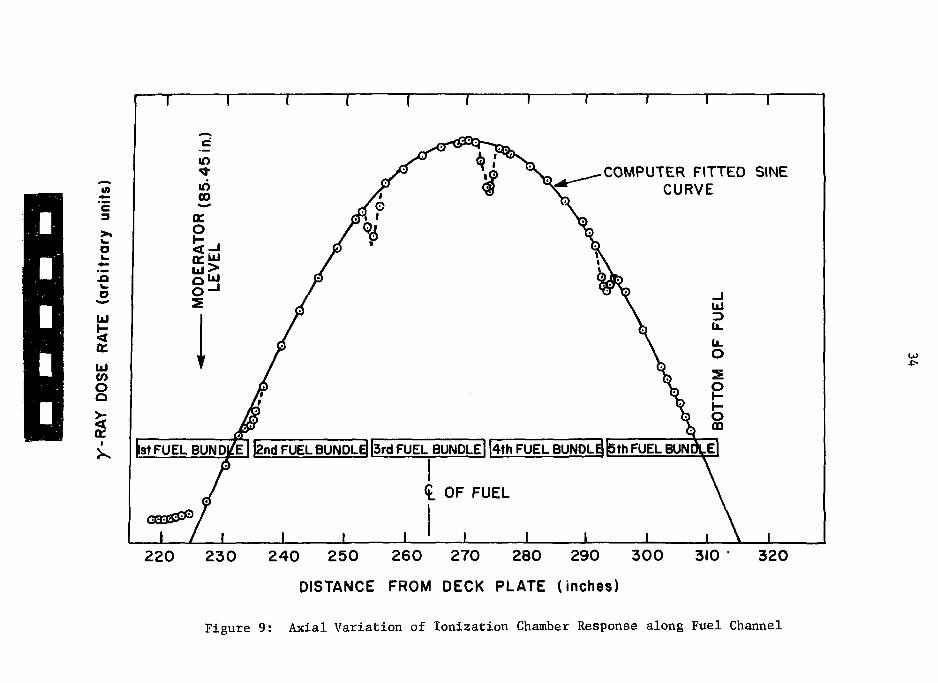
NORMALIZATION
To compare measurements at various positions along the channel,
at various reactor powers, and for different ionization chambers, the
results were normalized using the fission power generated in the fuel
surrounding the chamber. The linear power density at the location of the
chamber was calculated from the measured channel power assuming a sine
distribution for power along the channel. This was an accurate description
of the general shape as can be seen from Fig. 9 in which the ionization
chamber response along the channel is reproduced (see also Ref. 1). The
results were also corrected for changes in power generation in the
neighbouring fuel elements due to changes of the core loadings.
5. RESULTS
The ionization currents measured by the various chambers at
the mid-point of the third fuel bundle in the hollow hanger rod in WR-1
are listed in the second column of Table II. The values of power generated
in the fuel around the chamber are listed in the third column. Various
corrections which are applied to this measured current and to the
corresponding computed dose rates are also given. The following were the
four factors causing extraneous current:
(i) Leakage Current in the Insulation: Since the insulation
had finite resistance, the presence of the electric field generated an
ohmic current. This leakage current was enhanced by high temperature and
by radiation. The magnitude of this current was estimated from the slope
of the saturation curve in the plateau region assuming that the plateau
would have negligible slope in the absence of the ohmic current. The
maximum correction was for the magnesium chamber (about 14% of the
measured current). The effective resistance of insulation in this case
was about 30 x 106 ohms. The difference in the values of the leakage
current for the various chambers (see Table II) was probably due to the
difference in the quality of the cable or the insulating seal.
(ii) Fast Electron Current: The reactor gamma rays generated
fast secondary electrons in the two electrodes. These electrons did not
10
depend on the electric field for their transportation but rather on the
energy they received from the gamma rays. Because of the difference in
material and in the physical shape of the two electrodes, a net electron
current was present between the two electrodes. This current was measured
by removing the applied field, i.e. V = 0^ The maximum correction was
for the magnesium-walled chamber and amounted to about 5% of the measured
current.
(iii) Capture Gamma Rays; Thermal neutrons were absorbed by
the material of the chamber giving capture gamma rays, which caused
ionization current via the secondary electrons. These additional gamma
rays were negligible in all cases except the iron-walled ionization chamber,
where they contributed about 6% of the measured dose rate. The details of
the calculations are given in Appendix III.
(iv) Fast-Neutron Energy Transfer: Fast neutrons transferred
part of their energy to argon atoms in the cavity through scattering
collisions. As calculated by the computer code NEVEMOR , about
5 mW.g 1/kW.cm energy was received by argon from fast neutrons
(0.1 MeV < E < 10 MeV). Appendix III shows that this energy corresponded
to 0.18 \iA ionization current per kW.cm 1 energy produced in the surrounding
fuel. This current amounted to about 2% of the measured current.
Since materials with high neutron absorption cross section
were avoided, no correction was necessary for ionization current due to
beta rays.
Using the sensitivity of the chamber as measured in the
Gammacell (see Table I), dose rates were computed from the saturation
currents. These dose rates are listed in column 8 of Table II and are
in mW.g VkW.cm 1. Corrections were also necessary to account for the
different power generation in the neighbouring rods for the various
measurements. These are listed in column 9. The last column then lists
the corrected normalized dose rates for different wall materials.
11
TABLE II
CORRECTIONS AND CORRECTED DOSE RATES FOR CARBON.
MAGNESIUM, IRON AND ZIRCALOY-2 IN WR-1 REACTOR
WallMaterial
Carbon
Magnesium
Iron
Zircaloy-2
MeasuredSaturationCurrent
41.3
37.0
48.9
50.4
LocalPower
Density(kW.cn"')
4.90
4.88
5.72
5.80
Leakage(a'Current
-5.3
-5.3
-2.7
-2.3
FastCa)
ElectronCurrent
-1.4
+1.9
-0.4
+1.2
Correction'3 '
NeutronCollisions
-0.9
-0.9
-1.0
-1.0
Corrected'"'Saturation
Current
33.7
32.7
44.8
48.3
IonizationDose Rate
109.3
110.9
109.8
117.6
Neighbouring"1'Channels
Correction
-0.5
-0.6
0
-3.3
Cn.,)<b>1,1 Uall
0
0
-6.1
0
Gamma-Ray*10
Dose Ratein Material
108.8
110.3
103.7
114.3
(a) All values are in uA and correspond to the local power density at the time of rhe measurement ( i . e . un-normalized).
(b) All values are in nH.g'VkW.cp"1 •
6. DISCUSSION
The dose rates measured by the ionization chambers are listed
in Table II. The ionization chambers were insensitive to fast neutrons;
hence the entire measured dose rate was due to gamma rays except for the
small (2%) contribution due to ionization by recoil argon atoms.
Calorimeters on the other hand measured the total dose rate including the
entire recoil energy from fast neutron collisions in the sample material.
The four materials, viz., carbon, magnesium, iron and zirconium,
were chosen to study the dependence of gamma-ray dose rate in different
materials on the gamma-ray spectrum. Now the gamma-ray dose rate
\ = / y(E)<KE)EdE
where u(E) is the mass energy-transfer coefficient. An effective coefficient
can be defined for a composite gamma-ray spectrum, as
f U(E)(j)(E)EdE
/ c|>(E">EdEJeff
For materials of low to medium atomic number, u(E) varies slowly with
energy in the range 0.4 to 5 MeV. For gamma-ray fields having energy
predominantly in this range, vi(E) is relatively insensitive to the spectral
distribution. Reactor gamma-ray spectra and many isotopic gamma-ray
12
sources such as Co60 are in this category. On this basis it is possible
to compare different materials or make approximate predictions about
materials or gamma-ray fields for which measurements are not available.
This is the basis for using a Co60 source to measure the sensitivity of
the chambers for reactor measurements. To test the validity of such a
procedure we compare the ionization chamber results with calculated values
for yeff.
Effective values of the mass energy-transfer coefficient, Peff>
were computed in Part I of this series , where it was assumed that the
gamma-ray field incident on the dosimeter was the appropriate mixture of
the prompt fission gamma rays, the fission product gamma rays and the
uranium capture gamma rays. These are listed in column 2 of Table III.
These values agree with values calculated by Unruh and Tomlinson ll for
various measured reactor and other gamma-ray source spectra within a few
percent for Z < 26 (i.e. up to iron). Table III shows that the ratio of the
dose rate to p „ was constant within ± 3%. The constancy of this ratioef r
supports the validity of the y ff values and confirms the accuracy of the
ionization chamber measurements.
TABLE III
PROPORTIONALITY OF DOSE RATE TO EFFECTIVEMASS ENERGY-TRANSFER COEFFICIENT
Material
Carbon
Magnesium
Iron
Zircaloy-2
(cm
0.
0.
0.
0.
eff2g 1)
0261
0259
0253
0262
Dose Rate(mW.g 1/kW.cm
108.8
110.3
103.7
114.3
Dose Rate Q-3
*»eff
4.17
4.26
4.10
4.36
The accuracy of the measured dose rate values was dependent
on the accuracy of the current measurements and the accuracy with which the
13
calibrating gamma-ray field was known. The latter depended on the errors
involved in Fricke dosimetry and was about 2% (see Appendix II). The DVM
used for current measurement was accurate to 1%. The reactor power was
known within 5% and the precision was much better, of the order of 1%.
Thus the accuracy of the dose rates reported as mW.g~1/kW.cm"l was about
6 to 7%, while the precision was about 3 to 4%. The precision and the
accuracy were about the same as for the calorimetry measurements * .
The main purpose of the dosimetry program was to measure the
gamma-ray and the fast-neutron dose rates separately. The calorimeters *
gave the total dose rate and the ionization chambers gave the gamma-ray
dose rate. The difference represented the fast neutron contribution. Table
IV lists all the dose rates including those calculated for fast neutrons by
the NEVEMOR code ^ . The mass numbers of ~ron and zirconium are suffi-
ciently high for the fast-neutron dose rate to be negligible. This was
borne out by the experimental results which also agreed with NEVEMOR
calculations. For magnesium and carbon the fast-neutron dose rates
measured by difference were 10 and 16 mW.g l lower than the computed values,
respectively. The discrepancy is within experimental error for magnesium
but may be significant for carbon. No satisfactory explanation is available
at present.
Calorimetry measurements with samples for which the fast-
neutron dose rate contribution is higher than that of carbon may help to
resolve this discrepancy. Measurements using beryllium and terphenyl
samples in calorimeters are to be attempted.
14
TABLE IV
COMPARISON OF EXPERIMENTAL AMDCALCULATED FAST-NEUTRON DOSE RATES
Material
Carbon
Magnesium
Iron
Zirconium
Gamma-Ray ̂Dose Rate
108.8
110.3
103.7
114.3
Total D o s e ^Rate
131.5
110.1
103.5
115.8
(c)Fast-Neutron
Dose Rate(Experimental)
22.7
- 0.2
- 0.2
1.5
(d)Fast-Neutron
Dose Rate(Calculated)
39.0
10.0
2.1
1.3
Note: All dose rates are in mW.g VkW.cm 1
(a) From ionization chamber measurements, this report.
(b) From calorimeter measurements(l)
(c) Difference between the calorimeter and the
ionization chamber measurements.
(d) Computed by the code NEVEMOR^.
7. CONCLUSION
An ionization chamber has been developed which is capable of
continuous operation at temperatures up to at least 500°C. It is
sufficiently small to be incorporated within in-core experiments with
negligible flux depression. It is rugged, simple in construction and
reliable. It is accurate within 5%.
Gamma-ray dose rates in the dosimetry hole of the Mark III
hollow hanger rod in WR-1 have been measured using these chambers. The
gamma-ray dose rates for carbon, magnesium, iron and Zircaloy-2 at the
15
centre line of the fuel rod are 109, 110, 104 and 114 raW.g VkW.cm 1
fission power, respectively. Dose rates at other locations and in similar
reactor systems can be estimated with the aid of supplementary calculations
or experimental data.
These values compare favourably with the total dose rate
values measured by calorimeters l} for the medium atomic number materials,
viz. iron and Zircaloy-2, in which the fast neutron dose rate is negligible.
For magnesium, the experimental value of the fast-neutron dose rate
(difference between the total and the gamma-ray dose rates) is lower than
that calculated using a computer code, but the discrepancy is within the
experimental error. However, the discrepancy for carbon may be significant.
It is shown that the calculated value of the gamma-ray mass
energy-transfer coefficient for carbon, magnesium and iron for the reactor
gamma-ray spectrum is proportional to the measured gamma-ray dose rate.
8. REFERENCES
1. Mehta, K.K., and Stadnyk, A.M., Radiation Dosimetry in WR-1Reactor. Part I. Calorimetry, AECL-3795, October, 1971.
2. Mehta, K.K.. and Stadnyk, A.M., Radiation Dosimetry in WR-1Reactor. Part III. Neutron Fluence Measurements,AECL-3797,in press.
3. Storm, E. and Israel, H.I., Photon Cross Sections from 0.001to 100 MeV for Elements 1 through 100, LA-3753, Los AlamosScientific Laboratory, 1967.
4. Mehta, K.K.. and Kry, P.R., Calculations of Flux Spectra andEnergy Deposition for Fast Neutrons, AECL-3423, 1969.
5. Bragg, W.H., The Consequences of the Corpuscular Hypothesisof the y and X-Rays and the Range of 3 Rays, Phil. Mag.,20 (1910) 385.
6. Gray, L.H., The Absorption of Penetrating Radiation, Proc.Roy. Soc. (London), A122 (1929) 647.
7. Gray, L.H., An Ionization Method for the Absolute Measurementof y-Ray Energy, Proc. Roy. Soc , A156 (1936) 578.
13. Weiss, J. et al., Use of the Friake Ferrous Sulfate Dosimeterfor Gamma-Ray Doses in the Range 4 to 40 kr, Proc. 1st Int.Conf. PUAE, 14 (1956) 179.
14. International Commission on Radiological Units and Measurements,Rep. 10b: Physical Aspects of Irradiation, Handbook 85,National Bureau of Standards (USA), 1964.
15. Schreiber, R.E.. and Allio, R.J., Gamma Keating in ReactorExperiments, Nucleonics, _22_ (August 1964) 120.
16. Henderson, W.J. and Whittier, A.C., Handbook of Shielding andHeat Production Calculations for the NRU Reactor, AECL-403, 1955.
17. Burlin, T.E.,and Chan, F.K., The Effect of the Wall on theFricke Dosimeter, Int. J. Appl. Radiat. Isotopes, 20 (1969) 767.
18. Stone, J.A., Radiolysis of Cyolohexane in a Xenon Matrix at77 K, Can. J. Chem., 46 (1968) 1267.
19. Primak, W., Gamma-Ray Dosage in Inhomogeneous Nuclear Reactors,J. Appl. Phys., T]_ (1956) 54.
20. Bartholomew, G.A. and Higgs, L.A., Compilation of ThermalNeutron Capture Gamma Rays, AECL-669, July, 1958.
21. Evans, R.D., The Atomic Nucleus, McGraw-Hill Book Company Inc.,1955.
22. Boyd, A.W. (Ed), Ths Determination of Absorbed Dose in Reactors,International Atomic Energy Agency, technical report seriesNo.127, June,1971.
17
APPENDIX I
FABRICATION OF THE I ON IZATI ON CHAMBER
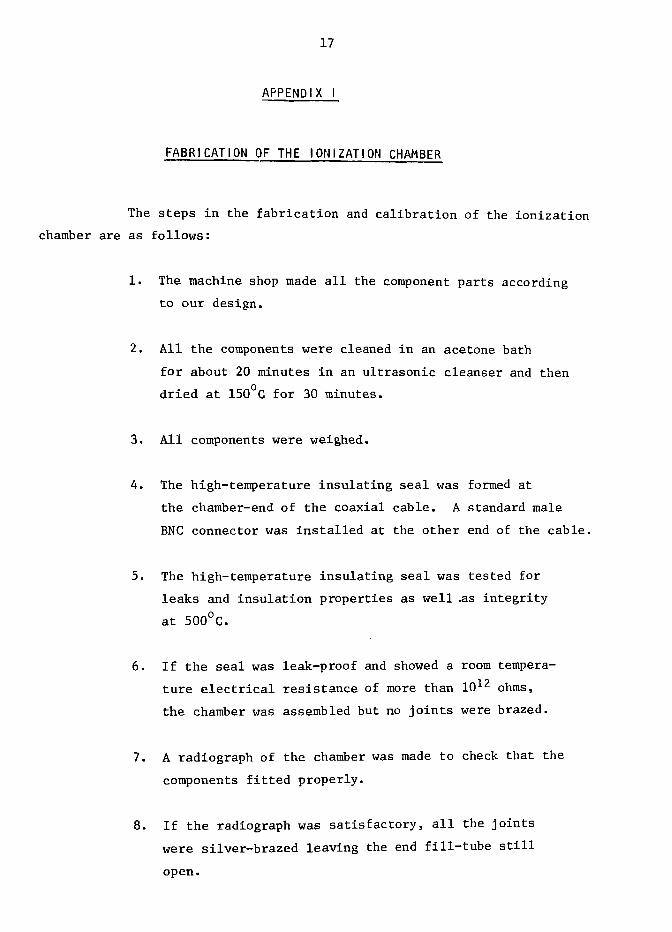
The steps in the fabrication and calibration of the ionization
chamber are as follows:
1. The machine shop made all the component parts according
to our design.
2. All the components were cleaned in an acetone bath
for about 20 minutes in an ultrasonic cleanser and then
dried at 150°G for 30 minutes.
3. All components were weighed.
4. The high-temperature insulating seal was formed at
the chamber-end of the coaxial cable. A standard male
BNC connector was installed at the other end of the cable.
5. The high-temperature insulating seal was tested for
leaks and insulation properties as well .as integrity
at 500°C.
6. If the seal was leak-proof and showed a room tempera-
ture electrical resistance of more than 1012 ohms,
the chamber was assembled but no joints were brazed.
7. A radiograph of the chamber was made to check that the
components fitted properly.
8. If the radiograph was satisfactory, all the joints
were silver-brazed leaving the end fill-tube still
open.
18
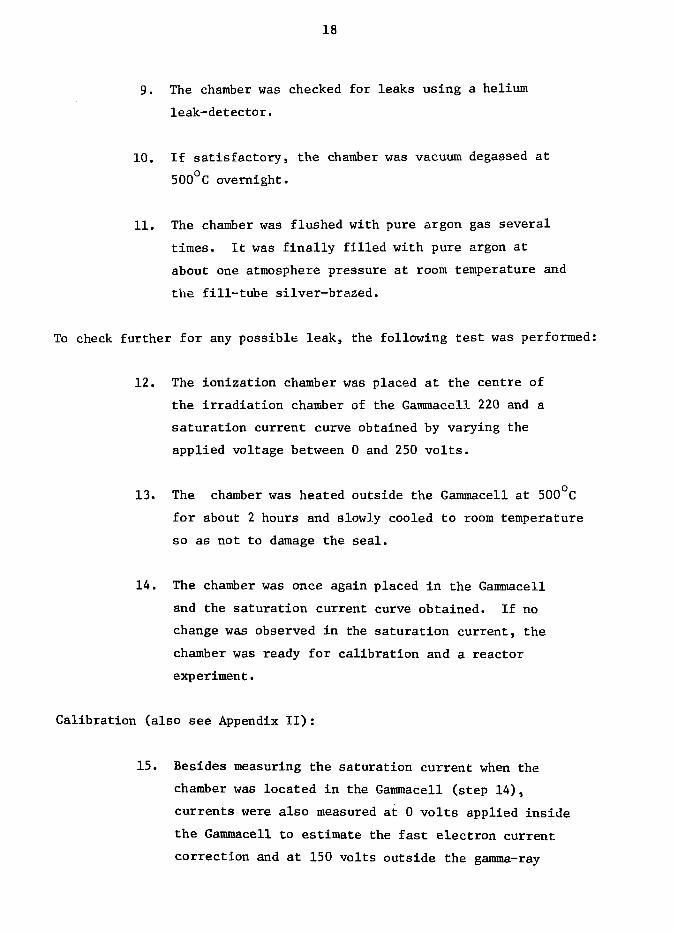
9. The chamber was checked for leaks using a helium
leak-detector.
10. If satisfactory, the chamber was vacuum degassed at
500°C overnight.
11. The chamber was flushed with pure argon gas several
times. It was finally filled with pure argon at
about one atmosphere pressure at room temperature and
the fill-tube silver-brazed.
To check further for any possible leak, the following test was performed:
12. The ionization chamber was placed at the centre of
the irradiation chamber of the Gammacell 220 and a
saturation current curve obtained by varying the
applied voltage between 0 and 250 volts.
13. The chamber was heated outside the Gammacell at 500 C
for about 2 hours and slowly cooled to room temperature
so as not to damage the seal.
14. The chamber was once again placed in the Gammacell
and the saturation current curve obtained. If no
change was observed in the saturation current, the
chamber was ready for calibration and a reactor
experiment.
Calibration (also see Appendix II):
15. Besides measuring the saturation current when the
chamber was located in the Gammacell (step 14),
currents were also measured at 0 volts applied inside
the Gammacell to estimate the fast electron current
correction and at 150 volts outside the gamma-ray
19
field to estimate the leakage current correction.
The ratio between the corrected saturation current
and the gamma-ray field in the irradiation chamber
was the sensitivity of the ionization chamber.
20
APPENDIX I I
FRICKE DOSIMETRY FOR THE REFERENCE GAMMA-RAY FIELD
To measure the sensitivity of an ionization chamber, its
response was measured in the reference gamma-ray field?viz^the irradiation
chamber of a Gammacell 220. The gamma-ray field in the chamber was due
to cobalt pencils situated in a ring around the chamber, which was 8 in.
long and 6 in. in diameter. The field in the centre of the chamber was
nearly uniform. Fricke dosimetry 1 2 was used to measure this gamma-ray
field.
PROCEDURE
The Fricke solution was made according to the formulae
recommended by Weiss, Allen and Schwarz . The irradiation cells were
made from Corning Pyrex #7740 (density = 2.23 g.cm 3) . Pyrex is about
80% silica, the wall material recommended by ICRU^14 . Two cells of
different wall thickness (0.622 cm and 0.282 cm) were used having the
same inside diameter of 0.955 cm, which was nearly equal to the outside
diameter of the ionization chamber wall (1.08 cm). The solution was
irradiated in the centre of the irradiation chamber for time intervals
ranging from 5 seconds to 100 seconds. The amount of the ferric ions
produced was measured by measuring the optical density of the solution for
light of wavelength 3040 X using a spectrophotometer. The dose rate to
Fricke solution was calculated from the slope of the straight line obtained
by plotting the optical density vs time of irradiation.
PRECAUTIONS
Since any error in measuring the reference gamma-ray field
would directly propagate to the dose rate value in the reactor, the
following precautions were taken to minimize any error in the measurements.
21
1. All chemicals were from fresh stock.
2. The temperature of the solution affects the yield
(G value) of the reaction as well as the extinction
coefficient, hence the temperature should be controlled.
The freshly prepared Fricke solution was stored in
the spectrophotometer laboratory for several hours
prior to use so that it was at room temperature, which
was measured with a thermometer. The cell carriage
of the spectrophotometer was stored outside the
spectrophotometer between runs to maintain it at room
temperature to minimize heating of the solution during
measurements. The measurement time in the spectrophoto-
meter was kept to a minimum. The irradiation cells were
handled by their support stem to minimize heating the
solution.
3. To measure the average dose rate at the point of
location in the Gammacell, the irradiated solution
was thoroughly mixed before measuring its optical
density. This was achieved by pouring the solution
between the spectrophotometer quartz cell and the
irradiation cell three times.
4. The design of the irradiation cell was such that its
positioning in the centre of the irradiation chamber
was reproducible.
5. An electronic counter was used to measure the time
of irradiation to one hundredth of a second. The
'start' and 'stop' signals for the counter came from
a specially placed microswitch at the bottom of the
Gammacell.
22
RESULTS
The uncorrected dose rate to Fricke solution was 255 R.sec
and 256 R.sec l for the two cells. The molar extinction coefficient, z ,
which was measured for the i
radiolytic yield, G = 15.6.
which was measured for the spectrophotometer, was 2154 at 22 C. The
Two corrections were applied to these dose rates: first,
the attenuation due to the wall of the cell and second, the self attenuation
of the solution. The wall attenuation A = 2 \it, where y(cm l) = linearw
energy-transfer coefficient of Pyrex for the gamma rays and t (cm) = wall
thickness 1 5 . The self attenuation of the solution A = -? uR, whereS J
y(cm -1) = linear energy-transfer coefficient of Fricke solution for the
gamma rays and R(cm) = inside radius of the cell 16 . Now, the gamma rays
in the irradiation chamber were not only the primary ones emitted by Co°"
(E = 1.17 and 1.33 MeV) but there was a large abundance of the backscattered
gamma rays (E "^0.2 MeV). On the average it was assumed that \i for
Pyrex was 0.0602 cm ^ and for Fricke solution was 0.031 cm *• Using
these values the wall attenuation was 7.5% and 3.4% for the two cells.
The self attenuation for the solution was 1.9%. The correction necessary
to account for the difference in electron stopping power of the Fricke
solution and the Pyrex wall was about %% -1 . Thus the corrected dose rate
to Fricke solution was 279 R.sec"1 and 270 R.sec"1 for the two cells.
Therefore, the corrected dose rate to Fricke solution in the
centre of the irradiation chamber of the Gammacell 220 was 275 R.sec"1 ± 2%
on April 1, 1971.
SENSITIVITY OF I0NIZATI0N CHAMBERS
In measuring the sensitivity of the ionization chamber,
however, the ionization current should be correlated to the dose rate in
the wall material and not in Fricke solution. These two dose rates are
in ratio of their gamma-ray mass energy-transfer coefficient, y, (cm2g~1).
This ratio is calculated in the following manner:
23
y (wall)U (Fricke)
y (wall)y (carbon)
y (carbon)y (Fricke)
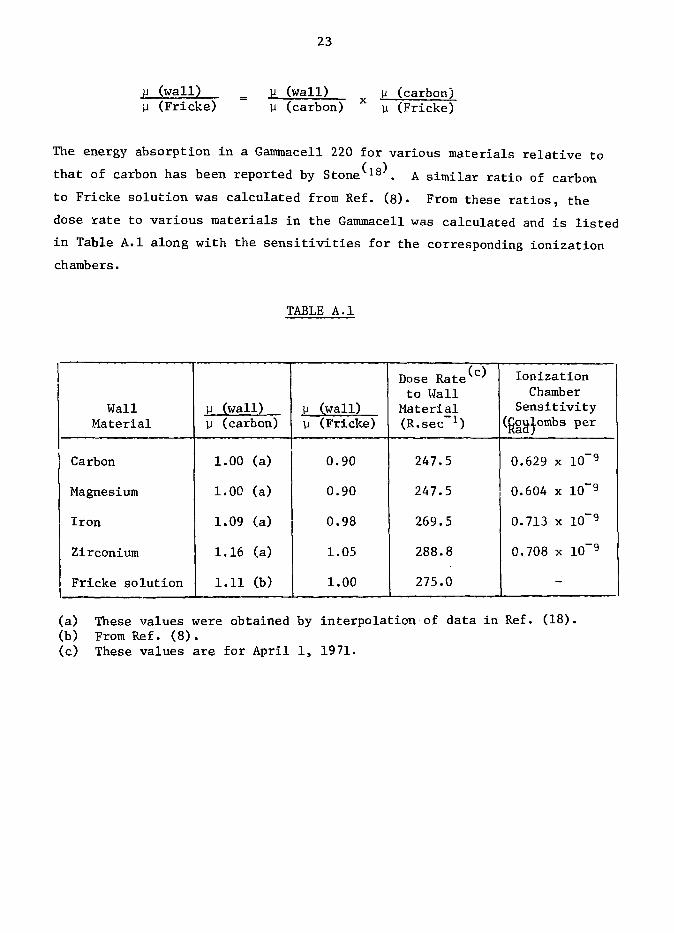
The energy absorption in a Gammacell 220 for various materials relative to
that of carbon has been reported by Stone. 18\ A similar ratio of carbon
to Fricke solution was calculated from Ref. (8). From these ratios, the
dose rate to various materials in the Gammacell was calculated and is listed
in Table A.I along with the sensitivities for the corresponding ionization
chambers.
TABLE A.I
WallMaterial
Carbon
Magnesium
Iron
Zirconium
Fricke solution
y (wall)u (carbon)
1.00 (a)
1.00 (a)
1.09 (a)
1.16 (a)
1.11 (b)
y (wall)y (Fricke)
0.90
0.90
0.98
1.05
1.00
(c)Dose Rateto Wall
Material(R.sec"1)
247.5
247.5
269.5
288.8
275.0
IonizationChamber
Sensitivity(Coulombs peri\.3.Q /
0.629 x 10"9
0.604 x 10~9
0.713 x 10~9
0.708 x 10~9
-
(a) These values were obtained by interpolation of data in Ref. (18).(b) From Ref. (8).(c) These values are for April 1, 1971.
24
APPENDIX III
ESTIMATION OF CORRECTION TO MEASURED DOSE RATES
CONTRIBUTION OF CAPTURE GAMMA RAYS IN THE IRON WALL
Thermal neutron capture gamma rays produced in the iron wall
of the chamber contributed to the gamma-ray dose rate. The source
strength, s, of these gamma rays was given by:
s = No* ,_E = 1.72 x 10⁶ x | , eV.cm~3sec~1th y th
where N = number of iron atoms per unit volume = 8.45 x 10 2 2 cm 3
o = thermal neutron absorption cross section for iron
= 2.62 x 10~2l+ cm2
<j> . = average thermal neutron flux density within the
iron wall
E = binding energy of the last neutron averaged over
all the iron isotopes = 7.78 MeV.
The thermal neutron flux in the wall was obtained from the activity of the
cobalt wire monitors located on the outer surface of the chamber. After
applying a small correction (about 6%) for the attenuation of the thermal
neutron flux in the wall, d> = 2.86 x 10¹²n.cm~2sec~1 per kW.cm"1 fission power
The average gamma-ray flux density, $ , present within the wall due to
these sources was estimated from the two cases (T16 and T17) considered by
Primak(l9):
<f> ^ 1.5 sT where T = thickness of wall = 0.254 cm
^ 1.87 x 10¹⁸ eV.cm~2sec"1
The effective mass energy-transfer coefficient for iron for the capture
gamma-ray spectrum was computed as:
25
V(E).(KE).E
where the gamma-ray spectrum, <f>(E) , was obtained from Ref. (20). The value
of u g f f = 0.0203 cm2g 1. The energy absorbed by iron then was given by
<f>Y x u e f f = 3.8 x 10¹⁶ eV.sec^g"1 per kW.cm"1
= 6.1 mW.g 1 per kW.cm l fission power.
IONIZATION CURRENT DUE TO THE FAST-NEUTRON DOSE RATE IN ARGON
Fast neutrons transfer energy to the struck atoms through
collisions. Thus, in the reactor the argon atoms in the gas cavity
received energy from the fast neutrons. According to the NEVEMOR code ^ ,
the energy transferred to argon was 5 mW.g * per kW.cm 1 fission power.
The struck argon atom received on the average about 50 keV energy during a(„,)
collision with a 1-MeV neutron Z1 . The range of such an argon atom was(,,)
much smaller than the size of the cavity *•*• and hence it lost all its
energy in the cavity in ionization and excitation of the gas atoms.
The mass of the argon gas in the cavity for the Whiteshell Chamber
was about 18 x 10 ^ g and hence received 5.6 x 10¹³ eV.sec ] from fast
neutrons per kW.cm 1 power generation in the surrounding fuel. The energy,
W, expended to create one electron-ion pair in argon gas by a 50 keV argon
ion is between 30 and 100 eV^22 . Assuming W = 50 eV, the ionization
current caused by these argon ions was 0.18 yA per kW.cm 1, i.e. about 2%
of the total current.
26
100
10
CM
O
5
1.0
0.0
i 1 1 1 1 1 r
O FAST-NEUTRON DOSE RATE IN REACTOR -
Ey = I MeV
O
C Mg Fa Zr Pb U
0.0011 1 1 l l I J I i i10 20 30 40 50 60 70 80 90 100
ATOMIC NUMBER
000
39m
00
mTO
3
1.0
01
Figure 1: Dependence of Gamma-Ray Mass Energy-Transfer Coefficient andFast-Neutron Dose Rate on Atomic Number
27
STAINLESS STEEL
MONITOR WIRE TUBES
COAXIAL CABLE SEAL
CENTRAL CONDUCTOR
ARGON CAVITY
STAINLESS STEEL SHEATH
ARGON
STAINLESS STEEL
Figure 2: Whiteshell High Temperature Ionization Chamber, Line Drawing
LAVA
MONITOR WIRE TUBES
COAXIAL CABLE SEAL
COAXIAL CABLE
CENTRAL CONDUCTOR
ARGON CAVITY
WALL'
K500
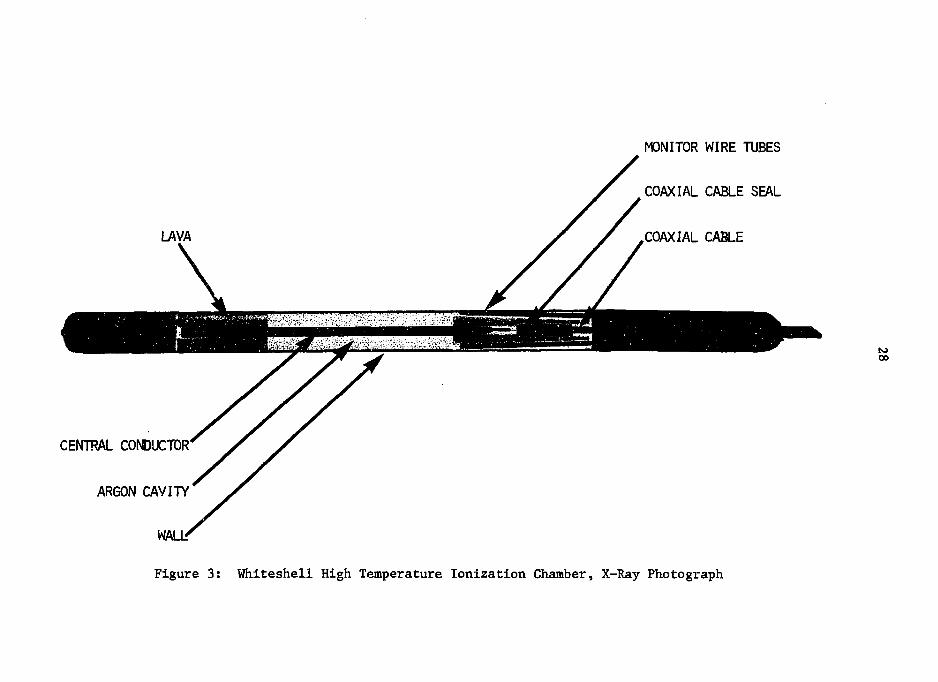
Figure 3: Whiteshell High Temperature Ionization Chamber, X-Ray Photograph
FILL-TUBE STAINLESS STEEL SHEATH
LAVA
CENTRAL CONDUCTORCOAXIAL CABLE
COAXIAL CABLE SEAL
N9
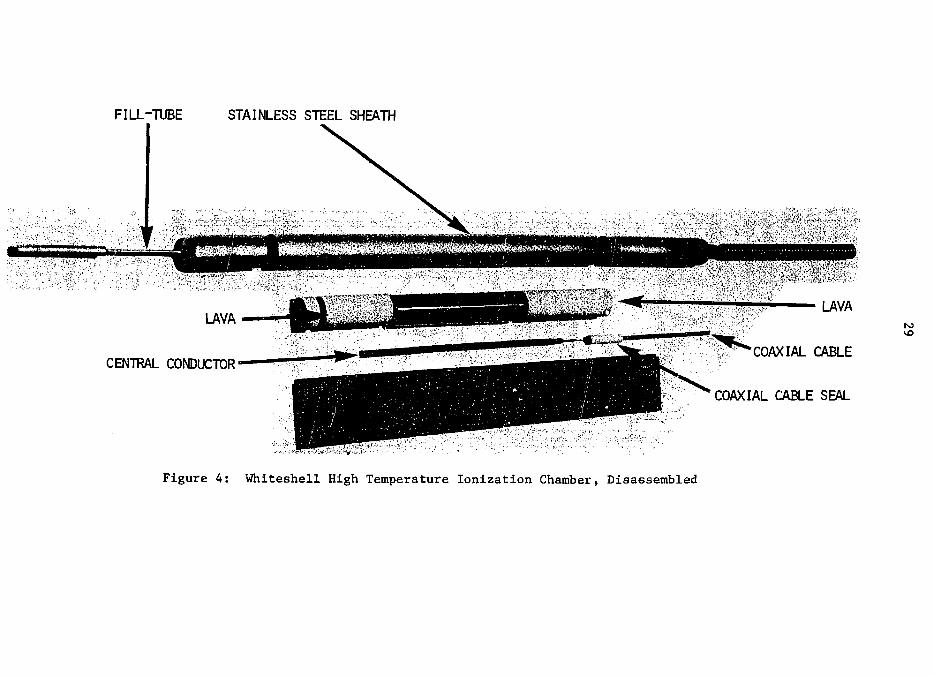
Figure 4: Whiteshell High Temperature Ionization Chamber, Disassembled
30
ELEV. 871'-6"
MARK HI FUELHANGERFILLER PIECE
1/2 " I. D.DOSIMETERHOLE
ELEV. 852'-4fHOT (REF)
8 4 " TO TOPOF DECK PLATE
•j I.D. DOSIMETERHOLE
ELEV. 852 ' -4 - j - '(REF)
Figure 5: Cross Section of the Hollow Hanger Fuel Assembly, Mark III
31
4" in. DOSIMETRYHOLE
MODERATOR(D 2 O)
CALANDRIA TUBE(aluminum)
NOTE '• All dimensions in an . Radiiare measured from bundlecentre except where otherwiseindicated.
Figure 6: Cross Section of WR-1 Fuel Bundle
32
COAXIAL CABLE
DIFFERENTIAL VOLTMETER
V
ISHIELDED
POWER SUPPLY
IONIZATIONCHAMBER
COAXIAL CABLE
Figure 7: Electrical Circuit for Measuring Ionization Current