SRNL-STI-2009-00296 Revision 0 Radiation Stability of Nafion Membranes used for Isotope Separation by Proton Exchange Membrane Electrolysis E.B. Fox S.D. Greenway E.A. Clark May 2009 Materials Sceince & Technology Savannah River National Laboratory Aiken, SC 29808 This document was prepared in conjunction with work accomplished under Contract No. DE-AC09-08SR22470 with the U.S. Department of Energy.
Transcript
SRNL-STI-2009-00296 Revision 0
Radiation Stability of Nafion Membranes used for Isotope Separation by Proton Exchange Membrane Electrolysis
E.B. Fox S.D. Greenway E.A. Clark
May 2009
Materials Sceince & Technology Savannah River National Laboratory Aiken, SC 29808 This document was prepared in conjunction with work accomplished under Contract No. DE-AC09-08SR22470 with the U.S. Department of Energy.
SRNL-STI-2009-00296 Revision 0
DISCLAIMER
This work was prepared under an agreement with and funded by the U.S. Government. Neither the U.S. Government or its employees, nor any of its contractors, subcontractors or their employees, makes any express or implied: 1. warranty or assumes any legal liability for the accuracy, completeness, or for the use or results of such use of any information, product, or process disclosed; or 2. representation that such use or results of such use would not infringe privately owned rights; or 3. endorsement or recommendation of any specifically identified commercial product, process, or service. Any views and opinions of authors expressed in this work do not necessarily state or reflect those of the United States Government, or its contractors, or subcontractors.
Radiation Stability of Nafion Membranes used for Isotope Separation by Proton Exchange Membrane Electrolysis
E.B. Fox S.D. Greenway E.A. Clark
May 2009
Materials Sceince & Technology Savannah River National Laboratory Aiken, SC 29808 This document was prepared in conjunction with work accomplished under Contract No. DE-AC09-08SR22470 with the U.S. Department of Energy.
iii
SRNL-STI-2009-00296 Revision 0
REVIEWS AND APPROVALS AUTHORS: E.B. Fox, Materials Science & Technology Date S.D. Greenway, Energy Security Date E.A. Clark, Materials Science & Technology Date TECHNICAL REVIEWER: T.E. Skidmore, Materials Science & Technology Date APPROVERS: T. Adams, Manager, Materials Component & Welding Technology Date R.L. Rabun, III, PDRD Program Manager, DP Engineering Date N.C. Iyer, Manager, Materials Science & Technology Date
iv
SRNL-STI-2009-00296 Revision 0
EXECUTIVE SUMMARY
Proton Exchange Membrane Electrolyzers have potential interest for use for hydrogen
isotope separation from water. In order for PEME to be fully utilized, more information is
needed on the stability of Nafion when exposed to radiation. This work examines Nafion 117
under varying exposure conditions, including dose rate, total dosage and atmospheric condition.
Analytical tools, such as FT-IR, ion exchange capacity, DMA and TIC-TOC were used to
characterize the exposed membranes. Analysis of the water from saturated membranes can
provide important data on the stability of the membranes during radiation exposure. It was found
that the dose rate of exposure plays an important role in membrane degradation. Potential
mechanisms for membrane degradation include peroxide formation by free radicals.
v
SRNL-STI-2009-00296 Revision 0
TABLE OF CONTENTS LIST OF TABLES............................................................................................................. vi
LIST OF FIGURES ........................................................................................................... vi
LIST OF ABBREVIATIONS........................................................................................... vii
Table 1. Gamma irradiation experimental matrix and bend test results. ..................................... 5
Table 2: TIC-TOC and IC Analysis of Water from Water-Soaked, Irradiated Nafion Samples. One sigma uncertainty is 10% for TIC-TOC and F-, 15% for SO4
2-. ..................................... 11
LIST OF FIGURES
Figure 1. Ion exchange capacity results for 1 Mrad gamma irradiated Nafion 117.................. 6
Figure 2: IEC data from 1-30 Mrad, fast dose, under wet conditions. ............................................ 7
Figure 3: IEC data for atmospheric samples. .................................................................................. 8
Figure 4: FTIR spectra for Nafion 117 as received, with peak designation. ................................... 9
Figure 5: FTIR spectra for Nafion 117 irradiated under atmospheric conditions. ........................ 10
Figure 6: Storage Modulus (MPa) as a function of total radiation dosage, when irradiated at 460 krad/hr in the presence of 25mL DI H2O. .............................................................................. 13
Figure 7. Storage modulus (MPa) as a function of environmental condition and dose rate for as received and 1 Mrad total exposure to Nafion. ...................................................................... 14
vi
SRNL-STI-2009-00296 Revision 0
LIST OF ABBREVIATIONS
IR Infra red PEM Proton exchange membrane TIC-TOC Total inorganic carbon – total organic carbon
vii
SRNL-STI-2009-00296 Revision 0
1.0 Introduction The durability of the polymeric materials during extreme operating conditions is an
important consideration when using a Proton Exchange Membranes (PEM) electrolyzer for the
separation of hydrogen isotopes. One of the main concerns for the adoption of Polymer
Electrolyte Membrane Electrolyzer (PEME) systems for use in tritium isotope separation is the
degradation of the Nafion® (DuPont) polymer due to the beta radiation produced by the decay of
tritium. Tritium decay gives off beta radiation that has a relatively low average decay energy of
5.69 keV.
Testing membranes with tritiated water is difficult because of safety concerns and due to
the amount of time needed for membrane exposure. Therefore, gamma irradiation is often used
as a substitute for beta irradiation for durability testing and comparisons are made at equivalent
radiation dosages. In a previous study, gamma irradiation testing of Nafion® membrane, gasket
materials and electrical insulators was completed up to 530 kGy (53 Mrad), the equivalent of 9
TBq/kg for two years [1]. It was determined that the strength of the Nafion® membrane and
propylene and tetraflouroethylene copolymer gaskets was maintained at doses up to and including
500 kGy (50 Mrad). Two gasket materials, tetraflouroethylene-hexaflouroethylene and
perflouroalkoxyethylene copolymers, decreased in strength at 200 (20 Mrad) and 300 kGy (30
Mrad), respectively. During this work it was determined that the main pathway for polymer
degradation was direct attack of the polymer by gamma rays. The resulting decomposition was
tracked by the quantity of dissolved flouride in the water, as it had a direct correlation to the
tensile strength and ion exchange capacity of the Nafion® membrane.
Separately, a small electrolyzer was tested with tritiated water with an activity of 44.4
GBq/kg [2]. The tensile strength and elongation of the membrane were tested after exposure of
both tritiated water and deionized water for six months of operation. It was determined that there
1
SRNL-STI-2009-00296 Revision 0
was no appreciable difference between the materials that could be attributed to the beta decay of
tritium. The influence of tritium exposure to the separation performance was also negligible.
Previous literature studies have investigated radiation damage to Nafion in PEME
systems by performing life tests with tritiated water feed to the system [2, 3] and accelerated
durability testing using gamma radiation [1, 4]. In order to determine the viability of PEME
electrolyzer systems for tritium isotope separation, additional gamma irradiation studies were
designed to extend current understanding and are documented in this paper. Three factors that
were tested as part of this work are radiation dosage, irradiation conditions, and radiation dose
rate.
2.0 Experimental Procedure 2.1 Gamma Irradiation
Samples of Nafion 117 (1100 Eq. Wt., 180 µm thickness, 100 cm2) were irradiated using
a 60Co source. The samples were irradiated either in air or enclosed in a laminate bag with 25 mL
of deionized water. The radiation dose rate of the membrane was controlled to either 460 krad/hr
(“fast”) or 1 krad/hr (“slow”). The final gamma radiation dosage to the membrane materials were
controlled to 1, 5, 10, 20, 30 or 100 Mrad (Table 1). It is estimated that a liquid water saturated
Nafion membrane would have a maximum annual dosage of 24 Mrad of beta radiation [5]. By
this estimate, the radiation dosages correspond to lifetimes of 2 weeks (1 Mrad), 1.25 years (30
Mrad), and 4 years (100 Mrad). .
2.2 Bend Test
After irradiation samples 4 cm*0.5 cm in size were bent at a 45° angle. Failed samples
broke during the test. The bend test can help indicate enbrittlement of the polymers during
radiation exposure.
2
SRNL-STI-2009-00296 Revision 0
2.3 Ion Exchange Capacity (IEC)
Ion exchange capacity of the membranes was determined by titration with standardized
NaOH. Each sample was weighed and lengths measured prior to treatment. A 0.5 M H2SO4
solution (50 – 60 mL) was used to bathe each membrane for 48 hours to ensure protonation. After
the H2SO4 soaking, each membrane was thoroughly rinsed with deionized water. Samples were
then soaked an additional 24 hours in deionized water. Membranes were then transferred to
beakers containing 50.0 mL of 2 M NaCl ion exchange solution for two hours. The residual salt
solutions were titrated with standardized NaOH (0.02474 M) to the phenolphthalein (1% in
methanol) end point. KHP primary standard was used to standardize the NaOH titrant. The
samples were rinsed with deionized water and bathed in 0.1 M HCl for 2 hours. After thorough
rinsing with deionized water, membranes were gently blotted dry.
2.4 Infrared (IR) Spectroscopy
Infrared spectroscopy studies of the as-received and irradiated membranes were
performed using a Nicolet Nexus 670 with a CsI beamsplitter, TGDS detector, and Golden Gate
accessory which includes a diamond crystal that allows a single bounce of the infrared beam.
Each spectrum was a composite of 128 scans. The resolution of the spectrometer was 4 cm-1.
Scans were performed using triangular apodization.
2.5 Inorganic and Organic Carbon Analysis
Total Inorganic Carbon (TIC) and Total Organic Carbon (TOC) were determined using
an OI Analytical Model 1020A Total Carbon Analyzer. This instrument features a vertical quartz
combustion tube packed with supported platinum catalyst, which receives a continuous flow of
oxygen at 200 cc/minute. The furnace is normally maintained at 680 °C. Organic-containing
samples are introduced into the combustion tube via a fixed volume sampling loop. Through
catalytic oxidation, the sample is completely oxidized to CO2 and H2O. The gas flow sweeps the
3
SRNL-STI-2009-00296 Revision 0
CO2 – containing steam out of the combustion tube, through a condenser, and into a gas/liquid
separator to trap most of the H2O. Final H2O removal is accomplished by a Nafion membrane
dehumidifier with a countercurrent flow of dry oxygen. The dried CO2 containing gas is then
passed through a metallic copper halogen scrubber then to a CO2 – specific Non-Dispersive
InfraRed (NDIR) detector for peak quantification. TIC samples are manually injected into the
TIC reactor, which contains acidic water solution at room temperature. In this acidic
environment, all forms of TIC are purged out of the solution as CO2 by the continuous flow of
gas. The gas then continues on through the dehumidifier, where it is dried and then passes
through the NDIR detector for measurement. TOC is calculated by a difference: TC – TIC =
TOC.
2.6 Ion Chromatography Analysis
Ion Chromatography (IC) studies were performed for the samples irradiated while
enclosed in a laminate bag with DI water. Anion analysis was performed by ion chromatography
using a Dionex Ion Chromatography system with an AS3/AG3 separator and guard column set
and a carbonate/bicarbonate eluent solution.
2.7 Dynamic Mechanical Analysis (DMA)
A TA Instruments model 2980 dynamic mechanical analyzer was used for this study.
This device applies a forced vibration on a sample and detects the resulting deflection. The
quantities reported here are the storage modulus, loss modulus, and tan δ. The DMA was operated
in constant amplitude mode, using the so-called “Force Track” feature. The fiber/film sample
holder was used. Samples were cut to 4cm*0.5cm in size. The film is clamped on both ends and
tension applied. Preliminary experiments with unexposed samples of each polymer were
performed to determine the range of acceptable amplitudes that provide valid DMA data- both
large enough to obtain modulus data that did not vary with amplitude, but also within the limit of
4
SRNL-STI-2009-00296 Revision 0
linear viscoelasticity. Each DMA experiment involved stabilizing the temperature at -60° C for
greater than 10 minutes, then the dynamic mechanical properties were measured while increasing
the sample temperature at 1° C per minute to 100oC. Analysis was completed on a minimum of
three samples at each condition.
3.0 Results and Discussion Samples were subject to a bend test [6] after irradiation as a test for embrittlement. All
samples passed the test, except for the 100 Mrad exposures. All exposed samples appeared
yellow after radiation exposure. Discoloration was the same, regardless of dose rate.
Table 1. Gamma irradiation experimental matrix and bend test results.
Radiation Dosage
Irradiation Conditions Dose Rate Bend Test
N/A N/A N/A pass
1 Mrad Wet 460 krad/hr pass
1 Mrad Wet 1 krad/hr pass
1 Mrad Atmospheric 460 krad/hr pass
1 Mrad Atmospheric 1 krad/hr pass
5 Mrad Wet 460 krad/hr pass
10 Mrad Wet 460 krad/hr pass
20 Mrad Wet 460 krad/hr pass
30 Mrad Wet 460 krad/hr pass
100 Mrad Atmospheric 460 krad/hr fail
Nafion 117 has a nominal equivalent weight of 1100 g/mol and the measured Ion
Exchange Capacity (IEC) for as-received samples ranges between 0.90 and 1.01 meq/g according
to data sheets from the manufacturer (DuPont) [7]. Figure 1 shows the IEC data for the as-
received and irradiated Nafion samples at 1Mrad dosage and under different irradiation
conditions. The as-received sample has an IEC at the lower end of the range expected by the
5
SRNL-STI-2009-00296 Revision 0
manufacturer. The agreement with manufacturing data supports the general accuracy of testing
methodology for IEC studies.
The IEC results for 1 Mrad samples are very similar under both atmospheric (dry) and
wet irradiation conditions and with both fast and slow radiation dose rates. However, at 1 MRad
the overall radiation dosage is relatively low and it may be difficult to see differences in these
results. For radiation doses up to 30 Mrad, there is a decrease in the IEC as the radiation dosage
increased. This decrease in the IEC probably reflects the loss of SO3- groups due to the
irradiation.
0.0
0.2
0.4
0.6
0.8
1.0
1.2
As Received Fast, Wet Fast, Dry Slow, Wet Slow, Dry
Ion
Exch
ange
Cap
acity
(meq
/g) As Received
Minimum Available Acid Capacity
As ReceivedMaximum Total Acid Capacity
Figure 1. Ion exchange capacity results for 1 Mrad gamma irradiated Nafion 117.
During IEC testing on the 30 Mrad and 100 Mrad atmospheric samples, it was noted that
these samples became brittle and fell apart easily. This suggests that the samples may have been
irradiated past the point where they would fail in a PEME. The results in Figure 2 show a slight
6
SRNL-STI-2009-00296 Revision 0
general decay of the IEC with radiation dosage. This is similar to the trend from previous
literature [1] for effect of gamma irradiation on wet membrane. However, the decay in the IEC
for the atmospherically dosed samples shown in Figure 1 is considerably larger than seen in
samples dosed in liquid water [1]. Faster degradation of the mechanical properties for
atmospherically dosed samples compared to water dosed samples was observed in reference [1],
however, the IEC was not tested for the atmospherically dosed membranes in that work. Iwai et
al. [4] hypothesized that more rapid degradation of Nafion in an atmospheric environment was
due to creation of oxygen radicals and their attack on the membrane backbone. The authors also
hypothesized that hydroxide radicals were created in water soaked samples and that the hydroxide
radicals did less damage to the polymer structure. This theory is a possible explanation the faster
degradation in IEC for the samples irradiated in atmospheric conditions. It is also well known
that polymers degrade in air because of the presence of oxygen.
0.0
0.2
0.4
0.6
0.8
1.0
1.2
0 5 10 15 20 25 30 35
Radiation Dosage (Mrad)
Ion
Exch
ange
Cap
acity
(meq
/g)
Figure 2: IEC data from 1-30 Mrad, fast dose, under wet conditions.
7
SRNL-STI-2009-00296 Revision 0
0.0
0.2
0.4
0.6
0.8
1.0
1.2
As Received 1 Mrad 30 Mrad 100 Mrad
Ion
Exch
ange
Cap
acity
(meq
/g) As Received
Minimum Available Acid Capacity
As ReceivedMaximum Total Acid Capacity
Figure 3: IEC data for atmospheric samples.
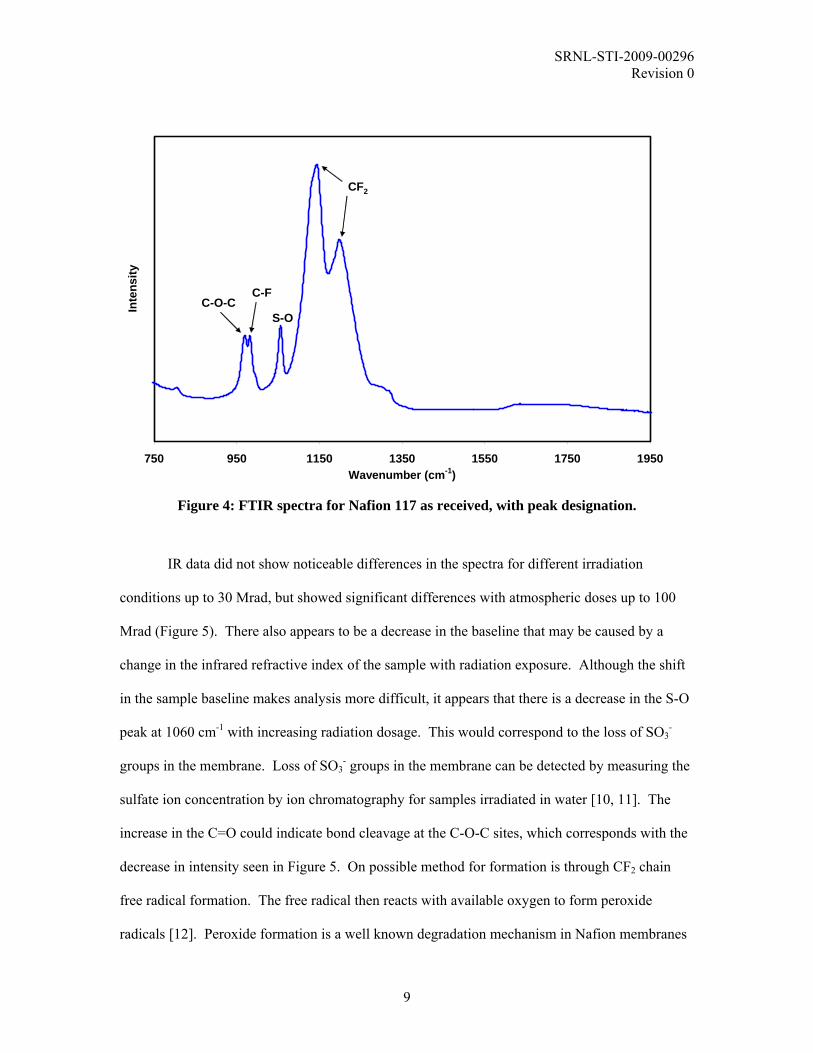
Infrared spectroscopy was performed on irradiated membranes to examine the change in
bonding in the membrane. A representative spectra of as received Nafion 117 is found in Figure
4. The large peaks at 1100 and 1200 cm-1 representing symmetric and asymmetric stretching of
the CF2 bonds show little change with irradiation [8]. The intensity of these peaks changes very
little with increasing gamma radiation dosage. The peak at 1760 cm-1 is due to the formation of
CF=CF bonds in the polymer [9]. Formation of this bond represents defluorination of the
polymer. The growth in this peak with radiation dosage indicates the degradation of the polymer.
Degradation of this bond should be accompanied by fluoride ion emission from the polymer.
Other common peaks that can be identified in this spectrum are: symmetric S-O stretching at
1060 cm-1 with a shoulder at 1310 cm-1, C-F stretching at 980 cm-1, and symmetric C-O-C
stretching at 960 cm-1 [8].
8
SRNL-STI-2009-00296 Revision 0
750 950 1150 1350 1550 1750 1950Wavenumber (cm-1)
Inte
nsity
C-O-CC-F
S-O
CF2
Figure 4: FTIR spectra for Nafion 117 as received, with peak designation.
IR data did not show noticeable differences in the spectra for different irradiation
conditions up to 30 Mrad, but showed significant differences with atmospheric doses up to 100
Mrad (Figure 5). There also appears to be a decrease in the baseline that may be caused by a
change in the infrared refractive index of the sample with radiation exposure. Although the shift
in the sample baseline makes analysis more difficult, it appears that there is a decrease in the S-O
peak at 1060 cm-1 with increasing radiation dosage. This would correspond to the loss of SO3-
groups in the membrane. Loss of SO3- groups in the membrane can be detected by measuring the
sulfate ion concentration by ion chromatography for samples irradiated in water [10, 11]. The
increase in the C=O could indicate bond cleavage at the C-O-C sites, which corresponds with the
decrease in intensity seen in Figure 5. On possible method for formation is through CF2 chain
free radical formation. The free radical then reacts with available oxygen to form peroxide
radicals [12]. Peroxide formation is a well known degradation mechanism in Nafion membranes
9
SRNL-STI-2009-00296 Revision 0
[13, 14]. After exposure at 100 Mrad, the formation of the S=O or S-O-S [14] peak at
approximately 1460 cm-1, could indicate the formation of SO2-O-SO2 or SO2F species from
peroxide radicals [13].
750 950 1150 1350 1550 1750 1950Wavenumber (cm-1)
Inte
nsity
1 Mrad (Fast-Dry)
30 Mrad (Fast-Dry)
100 Mrad (Fast-Dry)
Figure 5: FTIR spectra for Nafion 117 irradiated under atmospheric conditions.
Nafion samples were exposed in water to between 1 to 30 Mrad dose to survey the
byproducts of gamma radiation damage to the membrane. Total Inorganic Carbon-Total Organic
Carbon (TIC-TOC) and Ion Chromatography (IC) testing were used in product determination.
The results from TIC-TOC and IC analysis are presented in Table 2. The analysis below shows
the data from a single IC and TIC-TOC analysis of one Nafion sample at each irradiation
condition.
TIC-TOC measurements of the amount of carbon dissolved in water were used to
quantify the amount of damage to side chains that occurs at locations such as the C-O-C bond.
The total amount of organic carbon was relatively small for the as received and 1Mrad fast dosed
10
SRNL-STI-2009-00296 Revision 0
samples, however, the organic carbon for the 1 Mrad slow dosed sample was significantly higher.
The TOC for dose rates 5 Mrad and above slowly increased, but were lower than those seen at the
1 Mrad slow dose rate. These preliminary results indicate that radiation dose rate may have a
significant effect on the organic carbon content. The inorganic carbon in the water was slightly
higher for the irradiated samples and may indicate the presence of longer fluorinated chain
fragments that may be generated as a result of gamma irradiation. However, the TIC remained
the same for all dose rates. This suggests that initial chain cleavage of the longer fluorinated
chains at low dose rates that is independent of total dosage (up to 30 Mrad).
Table 2: TIC-TOC and IC Analysis of Water from Water-Soaked, Irradiated Nafion Samples. One sigma uncertainty is 10% for TIC-TOC and F-, 15% for SO4
2-.
Irradiation Condition
Total Organic Carbon
(mg/gNafion)
Total Inorganic Carbon
(mg/gNafion)
F- (mg/gNafion)
SO4-
(mg/gNafion)
As Received 0.014 0.014 <0.001 0.01
1 Mrad, Slow 0.81 0.028 1.30 0.47
1 Mrad, Fast <0.007 0.028 0.32 NR 5 Mrad, Fast 0.16 0.028 0.16 0.10
10 Mrad, Fast 0.24 0.028 0.36 0.14
20 Mrad, Fast 0.38 0.028 0.77 0.27 30 Mrad, Fast 0.55 0.028 1.23 0.42
Fluoride emission from the membrane signals degradation of the Nafion fluoropolymer
material [2, 3]. The fluoride emission from the membrane was determined by IC tests and the
results are summarized in Table 2. The 1 Mrad fast dose rate fluoride emission value of 0.32
mg/gNafion is similar to previous studies [1] performed with similar irradiation rates. The emission
values follow a general increasing trend, with the exception of the 5 Mrad sample. Under slow
irradiation conditions, the fluoride analysis showed a four times larger fluoride concentration that
the Nafion sample irradiated under fast conditions, which is closely approached by the 30 Mrad
11
SRNL-STI-2009-00296 Revision 0
sample. This indicates that the rate of irradiation may have a significant affect the amount of
damage to the Nafion. Since differences between the fast and slow irradiation conditions were
not observed in either IEC or IR analysis, further testing is needed to better quantify and
understand this trend.
The sulfate ion concentration indicates damage to the sulfonic acid groups in the
membrane [2, 3]. The conversion of the sulfonic acid sites in the membrane to sulfate ions is
generally attributed to oxygen radical attack on the polymer [10, 11]. A relationship between the
sulfate ion emission rate from the membrane and decrease in the ion exchange capacity may be
useful for characterizing membrane degradation in a PEME during operation. If it is assumed
that the sulfate ion comes from SO3- groups in the membrane [2, 3], then the percentage of
damaged sites can be calculated using the equivalent weight of the membrane. Using the IEC
measured for the as-received membrane, the sulfate emission of 0.47 mg/gNafion translates to 0.5%
of the total SO3- groups in the as-received membrane. The IEC results show a decrease near 6%
between the as-received membrane and the samples irradiated to 1 Mrad. The difference between
these two values indicates that the sulfate ion concentration does not directly correlate to the
decrease in the IEC for the membrane. Currently, the reasons for this difference are unknown,
but may be due to the generation of products such as SO2 during degradation. The sulfate IC
results for 30 Mrad are similar to those of the 1 Mrad slow dose rate, while the sulfate ion
concentration decreases from 30-5 Mrad, supporting previous data that the membrane degradation
may be highly dependant on dose rate.
Irradiated and as received Nafion samples were analyzed by dynamic mechanical
analysis. Samples irradiated at 30 Mrad and above broke during analysis and so could not be
analyzed by DMA. These failures indicate severe net degradation of the molecular structure. As
can be seen from Figure 6 the storage modulus of the irradiated Nafion membranes rapidly
increases up to 5 Mrad, then decreases at -40oC. The storage modulus reflects the time-
independent elastic constant relating the applied stress to the deflection or strain of the sample.
12
SRNL-STI-2009-00296 Revision 0
The increase is interpreted as a net increase of cross-linking in the membrane, and the decrease
occurs when the net amount of chain scission and resulting damage of the polymer at the higher
doses is greater than the net amount of cross linking [15]. At 60oC, the storage modulus
increases upon initial irradiation to 1Mrad, then decreases to values below the unirradiated
samples after this. Although the storage modulus at the two temperatures increased and then
decreased, the maxium at -40 oC occurred at 5 Mrad dose, while that at +60 oC occurred at 1 Mrad
dose. The difference in dose to achieve maximum storage modulus reflects the differing reaction
to applied stress at the different temperatures. The storage modulus also varies with frequency for
most polymers.
0.0
200.0
400.0
600.0
800.0
1000.0
1200.0
1400.0
1600.0
0 5 10 15 20 25
radiation dose/ Mrad
Stor
age
Mod
ulus
/ MPa
-40C60C
Figure 6: Storage Modulus (MPa) as a function of total radiation dosage, when irradiated at 460 krad/hr in the presence of 25mL DI H2O.
The storage modulus is compared for samples irradiated to 1Mrad and unirradiated for
various conditions in Figure 7. The unirradiated fully hydrated Nafion samples have a lower
13
SRNL-STI-2009-00296 Revision 0
storage modulus then the as-received samples. The samples that were fully hydrated during
irradiation, have higher storage modulus than the dry counterpart, regardless of rate of irradiation.
At 60oC the storage modulus for all samples represented in Figure 7 falls within ±7% of the
average, which can be considered within experimental error for the system. Larger differences
can be seen at -40oC. This may be due to the know phase transition in the polymer at ~40oC [16].
1Mrad,fast, dry 1Mrad,
fast, wet 1Mrad,slow, dry 1Mrad,
slow, wet asreceived as
received,wet
0.0
200.0
400.0
600.0
800.0
1000.0
1200.0
Stor
age
Mod
ulus
/ MPa
60C-40C
Figure 7. Storage modulus (MPa) as a function of environmental condition and dose rate
for as received and 1 Mrad total exposure to Nafion.
4.0 Conclusions Nafion membranes were irradiated with gamma rays from a 60Co source to various doses,
dose rates and atmospheric conditions.. The membranes were characterized by IED, IR, fluoride
emission, TIC-TOC, and DMA. Samples irradiated to 1 Mrad under wet and atmospheric
conditions and at fast and slow irradiation rates had nearly identical IECs and IR spectra.
However, the fluoride emission rate for the sample irradiated at a slow rate while soaked in water
was significantly higher than the fluoride emission rate for the sample irradiated at a fast rate
14
SRNL-STI-2009-00296 Revision 0
while soaked in water. The 30 Mrad fast dose rate samples corresponded well to the 1 Mrad slow
sample. IR data showed increasing formation of CF=CF bonds with radiation dosage and also
exhibited a decrease in S-O stretching. The changes in these bonds indicate defluorination of the
polymer and the loss of acid groups, respectively. TOC analysis of the water soaked increases
with total dosage, how ever was found to be dependant on dose rate. A fluoride emission test at 1
Mrad for a high dose rate was similar to previous literature and supported the IR data showing
defluorination of the polymer. DMA revealed the expected increase and then decrease of the
storage modulus with increasing radiation dose. Sulfate analysis showed that loss of active sites
was occurring with increasing dosage. Data suggests that membrane degradation may be highly
dependant on the rate of total dose versus the total dose.
Acknowledgment
Researchers wish to thank Amy Ekechukwu and Bob Rabun, Program Director for
NNSA funded SRS PDRD programs. Addition thanks for analytical analysis assistance goes to
Kathy White, Fernando Fondeur and Tom White; Gregg Creech for membrane irradiation. This
work was supported by SRS PDRD programs. This document was prepared in conjunction with
work accomplished under Contract No. DE-AC09-08SR22470 with the U.S. Department of
Energy.
5.0 References [1] Iwai Y, Yamanishi T, Nishi M, Yagi T, Tamada M. Durability of irradiated polymers in solid-polymer-electrolyte water electrolyzer. J. Nuc. Sci. Tech. 2005; 42(7): 636-642. [2] Cristescu I, Cristescu IR, Dorr L, Glugla M, Murdoch D, Welte S. Long term performances assessment of a water detritiation system components. Fusion Engr. Design 2006; 81(1-7): 839-844. [3] Michling R, Cristescu I, Dorr L, Fanghanel T, Welte S, Wurster W. Behavior of Solid Polymer Membrane Electrolyzers in Use with Highly Tritiated Water. Fusion Sci. Tech. 2008; 54(2): 470-475.
15
SRNL-STI-2009-00296 Revision 0
[4] Iwai Y, Yamanishi T, Isobe K, Nishi M, Yagi T, Tamada M. Distinctive radiation durability of an ion exchange membrane in the SPE water electrolyzer for the ITER water detritiation system. Fusion Engineering and Design 2006; 81(1-7): 815-820. [5] Fox EB, Greenway SD, Ekechukwu AA. Hydrogen isotope recovery using a cathode water vapor PEM electrolyzer. Fusion Sci. Tech. 2008; 54(2): 483-486. [6] Standard test methods for bend testing of material for ductility: Arrangement B for semi-guided bend test of thin specimens- one end held. 2004, ASTM E-290. [7] DuPont. DuPont Nafion PFSA Membranes: N-115, N-117, NE-1110. 2006 [cited 2007]; Available from: http://www.dupont.com/fuelcells/pdf/dfc101.pdf. [8] Liang ZX, Chen WM, Liu JG, Wang SL, Zhou ZH, Li WZ, Sun GQ, Xin Q. FT-IR study of the microstructure of Nafion((R)) membrane. Journal of Membrane Science 2004; 233(1-2): 39-44. [9] Alentiev A, Kostina J, Bondarenko G. Chemical aging of Nafion: FTIR study. Desalination 2006; 200(1-3): 32-33. [10] Chen C, Levitin G, Hess DW, Fuller TF. XPS investigation of Nafion (R) membrane degradation. Journal of Power Sources 2007; 169(2): 288-295. [11] Kinumoto T, Inaba M, Nakayama Y, Ogata K, Umebayashi R, Tasaka A, Iriyama Y, Abe T, Ogumi Z. Durability of perfluorinated ionomer membrane against hydrogen peroxide. Journal of Power Sources 2006; 158(2): 1222-1228. [12] Almeida SH, Kawano Y. Effects of X-ray radiation on Nafion membrane. Poly. Degrad. Stab. 1998; 62(291-297. [13] Kinumoto T, Inaba M, Nakayama Y, Ogata K, Umebayahi R, Tasaka A, Iriyama Y, Abe T, Ogumi Z. Durability of perflourinated ionomer membrane against hydrogen peroxide. J. Power Sources 2006; 158(2): 1222-1228. [14] Qiao J, Saito M, Hayamizu K, Okada T. Degradation of Perflourinated Ionomer Membranes for PEM Fuel Cells during Processing with H2O2. J. Electrochem. Soc. 2006; 153(6): A967-A974. [15] Phillips DC. Effects of Radiation on Polymers. Materials Science and Technology 1988; 4(85-91. [16] Rae PJ, Brown EN. The properties of poly(tetrafluoroehtylene) (PTFE) in tension. Polymer 2005; 46(8128-8140.