27
DOE/SC-ARM/TR-097 Radiatively Important Parameters Best Estimate (RIPBE): An ARM Value-Added Product S McFarlane T Shippert J Mather June 2011

DOE/SC-ARM/TR-097
Radiatively Important Parameters Best Estimate (RIPBE): An ARM Value-Added Product S McFarlane T Shippert J Mather June 2011
DISCLAIMER
This report was prepared as an account of work sponsored by the U.S. Government. Neither the United States nor any agency thereof, nor any of their employees, makes any warranty, express or implied, or assumes any legal liability or responsibility for the accuracy, completeness, or usefulness of any information, apparatus, product, or process disclosed, or represents that its use would not infringe privately owned rights. Reference herein to any specific commercial product, process, or service by trade name, trademark, manufacturer, or otherwise, does not necessarily constitute or imply its endorsement, recommendation, or favoring by the U.S. Government or any agency thereof. The views and opinions of authors expressed herein do not necessarily state or reflect those of the U.S. Government or any agency thereof.

DOE/SC-ARM-TR-097
Radiatively Important Parameters Best Estimate (RIPBE): An ARM Value-Added Product S McFarlane T Shippert J Mather June 2011 Work supported by the U.S. Department of Energy, Office of Science, Office of Biological and Environmental Research

S McFarlane, et al., June 2011, DOE/SC-ARM-TR-097
iii
Acronyms and Abbreviations
AEROSOLBE Aerosol Best Estimate VAP aqc auxiliary quality control ARM Atmospheric Radiation Measurement Climate Research Facility BBHRP Broadband Heating Rate Profile VAP CMBE Climate Modeling Best Estimate VAP IDL Interactive Data Language IRT infrared thermometer iwc ice water content iwp ice water path lwc liquid water content lwp liquid water path MERGESONDE Merged Sounding VAP MFRSR multifilter rotating shadowband radiometer MICROBASE Continuous Baseline Microphysical Retrieval VAP OMI Ozone Monitoring Instrument qc quality control RH relative humidity RIPBE Radiatively Important Parameters Best Estimate VAP RRTM Rapid Radiative Transfer Model SURFSPECALB Surface Spectral Albedo VAP SGP Southern Great Plains SSA single scattering albedo SWFLUXANAL Shortwave Flux Analysis VAP TOMS Total Ozone Mapping Spectrometer VAP value-added product

S McFarlane, et al., June 2011, DOE/SC-ARM-TR-097
iv
Contents
Acronyms and Abbreviations ...................................................................................................................... iii 1.0 Introduction .......................................................................................................................................... 1
2.0 Procedure .............................................................................................................................................. 1
2.1 Gridding and Interpolation ........................................................................................................... 2
2.2 QC Flags ....................................................................................................................................... 3
2.3 Summary QC ................................................................................................................................ 3
2.4 Source Flags ................................................................................................................................. 4
2.5 Quicklooks ................................................................................................................................... 4
3.0 Input Data ............................................................................................................................................. 4
3.1 Cloud Properties ........................................................................................................................... 5
3.2 Temperature and Humidity Variables .......................................................................................... 7
3.3 Aerosol Variables ......................................................................................................................... 9
3.4 Gaseous Properties ....................................................................................................................... 9
3.5 Surface Albedo ........................................................................................................................... 11
3.6 Surface Radiating Temperature .................................................................................................. 11
3.7 Measured Surface Fluxes ........................................................................................................... 11
3.8 Clear Sky Detection Flag ........................................................................................................... 12
3.9 Other ........................................................................................................................................... 12
4.0 Output Data ........................................................................................................................................ 12
5.0 Future Plans ........................................................................................................................................ 12
5.1 Surface Properties ...................................................................................................................... 12
5.2 CMBE–RIPBE Average File ..................................................................................................... 13
5.3 BBHRP–RIPBE ......................................................................................................................... 13
5.4 Extension to Other Sites ............................................................................................................. 13
5.5 Testbed Development ................................................................................................................. 13
6.0 References .......................................................................................................................................... 14
Appendix A – Input Data .......................................................................................................................... A.1
Appendix B – Output Variables .................................................................................................................B.1

S McFarlane, et al., June 2011, DOE/SC-ARM-TR-097
v
Figures
1 Flowchart of RIPBE processing.................................................................................................. 2
2 Example of quicklook plots for cloud variables: cloud ice water path, 2D quality control flags for cloud ice water path, and 1D summary aqc flags for all cloud variables. .................... 6
3 Quicklook figures for atmospheric state variables.. .................................................................... 8
4 Output aerosol extinction field and qc flags on aerosol extinction ........................................... 10
S McFarlane, et al., June 2011, DOE/SC-ARM-TR-097
1
1.0 Introduction
In order to run a radiative transfer model to calculate radiances, fluxes, or heating rates, a large number of parameters describing the radiatively important components of the atmospheric state (water vapor, ozone, and temperature profiles; surface albedo; aerosol properties and cloud properties) are required. These parameters are all measured by Atmospheric Radiation Measurement (ARM) Climate Research Facility instruments and exist in various datastreams or value-added products (VAPs), but there are difficulties in combining them for use by a radiative transfer model: (1) input parameters all have different temporal and spatial scales, (2) multiple versions of input parameters may be available so that a decision on preferred datastream may be needed, (3) input parameters from a preferred datastream may not be available at all times, so methods for filling in gaps in a parameter with other datastreams, interpolation, or climatological data sets need to be developed, and (4) tracking of version and source information is desired.
The Radiatively Important Parameters Best Estimate (RIPBE) VAP was developed to create a complete set of clearly identified set of parameters on a uniform vertical and temporal grid to use as input to a radiative transfer model. One of the main drivers for RIPBE was as input to the Broadband Heating Rate Profile (BBHRP) VAP, but we also envision using RIPBE files for user-run radiative transfer codes, as part of cloud/aerosol retrieval testbeds, and as input to averaged datastreams for model evaluation.
The general idea of the best-estimate product is to produce values for each radiatively important parameter at all times. However, because cloud parameters are so variable and have such a large impact on the radiative fluxes, cloud parameters are designated as critical inputs (missing or bad values are indicated as such and are not interpolated). For all other parameters, climatological or fixed values are used if no good data are available within a given time period. For each variable, flags indicating quality control (qc) and source information are included in the output data set.
2.0 Procedure
The first step in the RIPBE process is to put all of the input variables on the same height and time grid and replace missing or bad data within each field with interpolated values, where appropriate. The next step is to identify periods of time with missing or bad data in the primary variables that could not be corrected in the gridding tool and fill these periods with secondary variables, climatology, or fixed values. The final step is to output the netCDF file and create quicklooks of the variables and their associated qc flags. A flowchart of the general RIPBE procedure is given in Figure 1. More detailed information on each of the processes and how the general process varies for each input variable is given in the following sections.

S McFarlane, et al., June 2011, DOE/SC-ARM-TR-097
2
Figure 1. Flowchart of RIPBE processing. More details of each step are given in the text.
2.1 Gridding and Interpolation
The heart of the RIPBE VAP is the gridding of the input variables onto a common height/time grid. The standard time grid is every minute on the half minute, and the time stamps in the file represent the center of the time bin. The height grid is referenced either by layer or level (layer boundaries), depending on the field, and extends to 68 km. Layers are indexed by the center of the height bin—the midpoint between the two bracketing levels. Currently, layer heights are based on the cloud property Continuous Baseline Microphysical Retrieval (MICROBASE) input files with two additional layers added between the lowest microbase layer and the surface. Above MICROBASE, the layers become coarser and follow the standard BBHRP grid. Currently, layers are hard-coded based on the site and microbase file; for the testbed this will be modified so that the layering is developed automatically given an input cloud file.
Before gridding, each input variable is checked for qc flags and missing or bad data. For input datastreams that include qc flags (currently only SURFSPECALB and MICROBASE), that information is used to identify missing, indeterminate, and bad data. For other variables, we apply internal qc (which at this point primarily consists of valid min/max and missing data checks), giving each variable a value of ‘good’, ‘indeterminate’, or ‘bad’ at each input time and height. To put variables on the regular time and height grid, we first sub-sample or interpolate each profile in time and then interpolate that profile in

S McFarlane, et al., June 2011, DOE/SC-ARM-TR-097
3
height. At this time, the sub-sampling or interpolation also fills in data that had been classified as ‘bad’, if possible. Sub-sampling is used if the input variable has a higher temporal resolution than the common grid; interpolation is used if the input variable has a coarser temporal resolution than the common grid.
Data are only sub-sampled or interpolated if the closest good value is within a fixed time interval from the desired grid point. For cloud variables, this interval is set to 30 seconds, but for all other variables the interval is currently fixed at 30 minutes. Missing and bad data are interpolated in height (except for cloud properties) if good points can be found within 20 km of the target point—which basically puts no limit on the interpolation. The gridding code will extrapolate missing values, but only to the limits of the input datastream heights (it will extrapolate up to half a bin beyond the min/max input height values).
After the gridding, if bad data values still exist, then they are replaced with a secondary datastream, climatological data, or fixed values. Current exceptions to this process are the cloud fields, the measured radiative fluxes, and the surface radiating temperature. Details of secondary datastreams and climatological or fixed values used to replace missing data are given in the descriptions of the individual fields in Section 3.
2.2 QC Flags
For each output variable, RIPBE includes qc information in the form of bit-packed qc values. Each bit in the qc field corresponds to a test; if that test “fails,” then the bit is set, so a qc value of 0 means that the variable did not fail any tests. The tests themselves can be critical or non-critical; if “critical,” then failure indicates that the data are “bad” and should not be used, in which case they are replaced with -9999. Most tests are non-critical, and those qc bits are used to indicate issues that were found in the data gridding process that the user may want to be aware of when using the final data product. For example, if a bad value is interpolated over in the gridding process, then a bit is set in the corresponding qc field so that the user knows the data value at that time and height was interpolated. For cloud variables we do not interpolate over missing data, so data that fail min/max or other qc checks will be flagged as bad.
Because there are many common conditions that can happen during the gridding procedure, the qc bits were designed as global attributes. However, some specific fields have additional qc tests that did not apply globally. For each field, the qc attributes in the netCDF file explain whether the global qc descriptions or field-specific qc descriptions apply to the fields. To reduce confusion, the field-specific qc descriptions include all of the global qc tests, but then have any additional tests added as higher qc bits.
2.3 Summary QC
In general, the standard qc flags have the same dimension as the variables (with the exception of the surface albedo variables). Most of the RIPBE data values are 2D arrays, so the corresponding qc fields are also 2D arrays. To make the qc flags more useful for quickly screening data, we also include a 1D summary qc flag for each variable. Since it is not in bit-packed format, it known as an “auxiliary qc” or “aqc” flag, and is named ‘aqc_summary_VARNAME’ where VARNAME is the name of the variable. This 1D summary qc flags each variable at each point in time as good, indeterminate, or bad, based solely on the worst 2D qc flag for that variable within the column. If any point in the column is flagged as bad in the 2D qc, then the entire column will be flagged bad in the 1D summary qc. Climatological or fill values should exist for all variables except clouds and measured fluxes, so generally these are the only

S McFarlane, et al., June 2011, DOE/SC-ARM-TR-097
4
variables that will ever have summary qc of “bad”. The summary qc flag will also be used as input to BBHRP to determine whether the radiative transfer calculation should be run on a given timestep or not.
2.4 Source Flags
A source flag is also included on each variable to indicate the input datastream (or climatology, model, etc.) from which it was derived. The exact meanings of the source flag vary with each variable; however, common ranges of numbers are used to identify the source of the data as observation, climatology, or model output. For example, if a user does not wish to include any data that were derived from a model rather than direct observations, they would not use any data points with source flags between 30–39. The general source flag descriptions are:
0–19 Observed variable
20–29 Climatological value based on ARM observations at given site
30–39 Value derived from model values or climatology not based on site observations
50 Data outside of measurement range or detection limit
2.5 Quicklooks
Daily quicklook plots of the primary variables (cloud, atmosphere, aerosol, surface albedo) and their associated qc flags are produced in postprocessing. In the 2D quicklook plots, only the highest qc bit is plotted. Quicklook plots of the 1D summary qc are also produced. Several examples of the quicklook plots are shown in Section 3.
3.0 Input Data
Due to its complex nature, RIPBE has multiple input datastreams. Where possible, input files are standard ARM VAP netCDF files. In other cases, input datastreams may be ARM evaluation products, external datastreams, or fixed files. In this section, we briefly describe the current input variables and associated datastreams. Details of datastream and variable names are given in Appendix A. At present, RIPBE is only run at the Southern Great Plains (SGP) site, so only SGP datastreams are described.
In order to produce a near-continuous datastream, climatological values are used to fill in missing/bad data for all variables other than cloud variables (due to their highly variable nature and significant impact on radiation). Unless specified otherwise, monthly climatological values for each variable at the given site are calculated in pre-processing using the existing data from the standard input datastream for the site. When data are filled in from climatology, this will be indicated in the source flag for the variable.

S McFarlane, et al., June 2011, DOE/SC-ARM-TR-097
5
3.1 Cloud Properties
Layer values of cloud liquid water content (lwc), ice water content (iwc), and liquid and ice effective radius are input from sgpmicrobasepiC1.c1 (MICROBASE), which is a required input. We convert lwc and iwc to layer liquid water path (lwp) and ice water path (iwp) by multiplying by the layer depth (which in MICROBASE is fixed at 45 m). We also convert the MICROBASE ice effective radius to a cloud generalized ice effective diameter (Fu 1996).
Because of their highly variable nature and large effect on radiation, no secondary or climatological data sets are used for cloud properties. Additionally, no interpolation in height is allowed for cloud properties, and the time interval for sub-sampling is limited to 30 seconds.
For vertical grid points outside of the range or detection limit of the cloud remote sensors, cloud variables are set to 0 and the source flag is set to 50 to indicate that no information is known about cloud properties at these heights.
An example of the quicklook plots produced for the cloud iwp is given in Figure 2. The top panel shows the final values of the gridded iwp data in each layer. The middle panel shows the values of the 2D qc bit flags. While more than one bit may be tripped for a given time/height, only the highest 2D qc bit tripped is shown in this plot. Although hard to see in the plot, there are numerous cyan values (qc bit = 7) at the lower edge of the cloud, which indicate the input values were indeterminate. Likely, the iwp values failed the valid_min or valid_max tests in the microbase files, due to cloud edge effects. The bottom panel shows the 1D summary flags for all cloud variables, where qc=0 is good, qc=1 is indeterminate, and qc=2 is bad. The values are slightly offset so that all variables can be shown on one plot. The 1D summary qc for the iwp is set to 1 for much of the day because of the indeterminate values around cloud edges.

S McFarlane, et al., June 2011, DOE/SC-ARM-TR-097
6
Figure 2. Example of quicklook plots for cloud variables: (top) cloud ice water path, (middle) 2D qc
flags for cloud ice water path, and (bottom) 1D summary aqc flags for all cloud variables.

S McFarlane, et al., June 2011, DOE/SC-ARM-TR-097
7
3.2 Temperature and Humidity Variables
Temperature, pressure, water vapor mixing ratio, relative humidity (with respect to water at all temperatures), and density profiles are given on both layers and levels as different radiation codes require slightly different inputs. The primary source for these profiles is sgpmergesonde1maceC1.c1. (MERGESONDE VAP; Troyan 2010). For water vapor, we use the rh_scaled variable from MERGESONDE, which has been scaled to match the column precipitable water vapor from the microwave radiometer. Then we calculate a water vapor mixing ratio consistent with the scaled_rh value, using the Goff and Gratch formulation. Currently at SGP, RIPBE uses v2 of MERGESONDE, which produces values up to 60 km. The top of the BBHRP grid is at 68 km, and values are simply extrapolated from 60 to 68 km. For other sites or periods for which MERGESONDE v2 is not available, we will use v1, which goes up to ~ 20 km, and a standard atmosphere will be used to fill in temperature, pressure, water vapor, relative humidity, and density up to the top of the RIPBE grid. If v1 of MERGESONDE is used, a smoothing procedure will be implemented so that there are no large jumps in values at the top of the MERGESONDE grid. For missing or bad MERGESONDE data, variables are filled in from climatology (based on monthly averages of existing MERGESONDE data at the site). To avoid discontinuities in height, if missing values have to be filled in from climatology, the entire profile is replaced with the climatological profile. A source flag indicates whether values are from MERGESONDE, the standard atmosphere, or the climatological profile.
An example of the quicklook plots produced for relative humidity is shown in Figure 3. The top panel shows the output gridded relative humidity (RH) data, while the middle panel shows the 2D qc flags on relative humidity, and the bottom panel shows the summary qc flags for all of the atmospheric state variables. The white values in the top plot indicate RH values = 100%, and they correspond to periods in the middle plot where qc bit = 13 is set. This qc bit is a field-specific value for the water vapor fields, which indicates that the relative humidity in the input data was above 100% and was set to 100% within the gridding/interpolation routine. No other qc flags were set on the RH data for this day. The summary qc plot indicates that both the RH and water vapor mixing ratio fields are flagged as indeterminate at points throughout the day (due to the RH values > 100%) but no other qc flags are set on the water vapor or temperature fields.

S McFarlane, et al., June 2011, DOE/SC-ARM-TR-097
8
Figure 3. Quicklook figures for atmospheric state variables. (top) Output relative humidity field,
(middle) 2D qc flags for relative humidity, and (bottom) summary 1c flags for atmospheric state variables. Details of the qc flags in this image are given in the text.

S McFarlane, et al., June 2011, DOE/SC-ARM-TR-097
9
3.3 Aerosol Variables
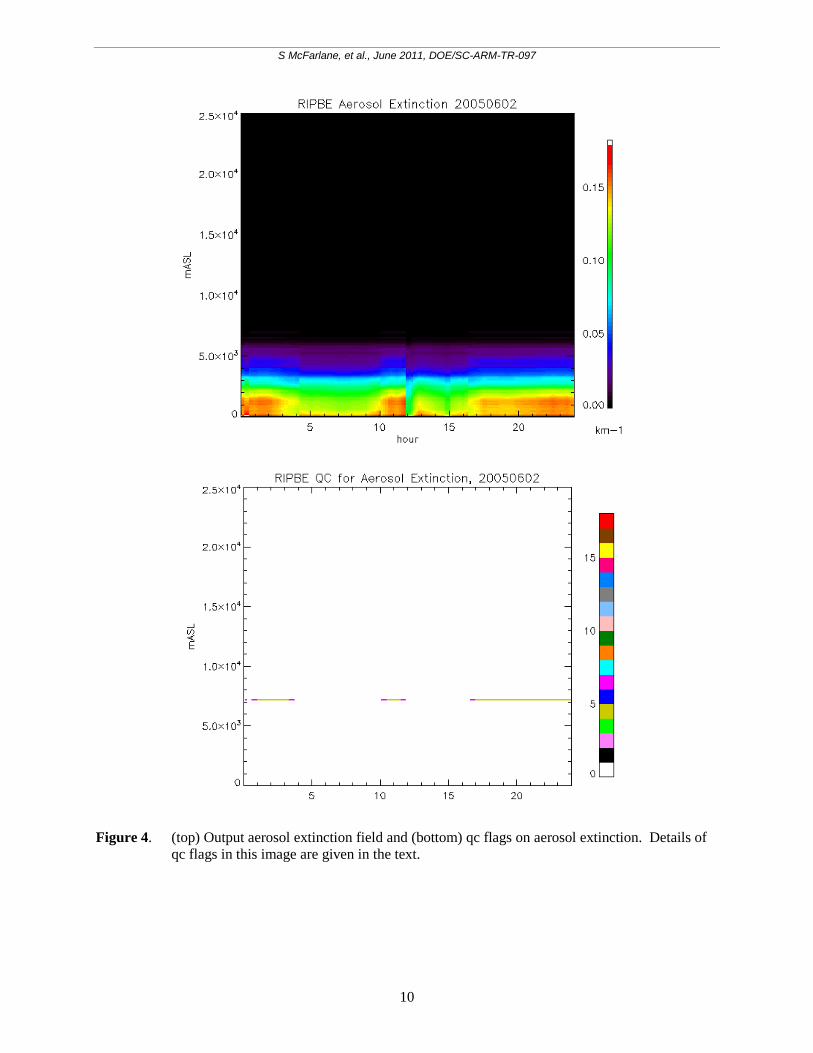
Aerosol optical depth at 500 nm and aerosol angstrom parameter are given as a function of time, while profiles of aerosol extinction, single scattering albedo, and asymmetry parameter at 500 nm are functions of time and layer height. The primary source for aerosol properties is sgpaerosolbeturnC1.c1 (the Aerosol Best Estimate VAP [AEROSOLBE]; Sivaraman et al. 2006). In some instances, the aerosol extinction profile contains small negative values (< -0.01); these are set to 0, and the source flag is modified to indicate the change (values are still considered ‘good’). In many cases, aerosol extinction is available from AEROSOLBE at a given time while values of single scattering albedo (SSA) or asymmetry parameter are not. In these cases, if the period of missing data is too large to be interpolated over, monthly climatological values of SSA and g are used (as indicated in source flag). If aerosol extinction is missing and the period of missing data is too large for interpolation, then the aerosol extinction will be set to 0 (and indicated in source flag). For grid points outside the vertical range of the AEROSOLBE product, aerosol properties are set to 0 and the source flag is set to 50 (“Outside of measurement range; data value set to 0.0”) to indicate that no information about aerosol properties is available.
An example of the quicklook plots produced for aerosol extinction is shown in Figure 4. The top panel shows the output gridded aerosol extinction at 500 nm, while the bottom panel shows the qc flags. Several qc flags are set near the top of the aerosol layer. Gold points indicate qc bit 4 is set, which has the description “Data interpolated while gridding” and an assessment of indeterminate. At the top of the AEROSOLBE profile, there are often small values of extinction and/or values of -9999 reported, and the gridder is interpolating over these missing values. Hot pink points indicate that qc bit 6, “Not using closest value while subsampling to grid,” is set. These are also cases of missing values at the top of the extinction profile—in this case, rather than interpolating, the gridder is using the closest good value (up to 30 minutes away).
3.4 Gaseous Properties
Ozone The default vertical profile of ozone concentration is currently from the standard ozone profile used in BBHRP. An option also exists for a user-specified ozone profile. Column ozone at each time is derived from a data set of values from the Total Ozone Mapping Spectrometer (TOMS) or Ozone Monitoring Instrument (OMI) satellites (depending on date), and the ozone profile is scaled to that value. If TOMS/OMI values are not available, then the ozone profile is not scaled.
CO2 Time-varying mixing ratios of CO2 are derived from a data set of NOAA observations at Mauna Loa (an alternate data set for other locations could be implemented). For times past 2008 (last date of current CO2 data set), values are extrapolated based on an algorithm developed by Dave Turner ([email protected]) that includes annual increases and seasonal variability (predict_co2.pro). The CO2 values are read in from a yearly netCDF file generated by an Interactive Data Language (IDL) script; therefore, to run RIPBE in production, this input gas file must also be generated in production.
Other Trace Gases Mixing ratios of other trace gases—CH4, N2O, CCl4, CFC11, CFC12—are given as a function of time (although currently they are set at fixed values for all times), assuming well-mixed gases.
S McFarlane, et al., June 2011, DOE/SC-ARM-TR-097
10
Figure 4. (top) Output aerosol extinction field and (bottom) qc flags on aerosol extinction. Details of
qc flags in this image are given in the text.

S McFarlane, et al., June 2011, DOE/SC-ARM-TR-097
11
3.5 Surface Albedo
Spectral band values of shortwave surface albedo are derived from the sgpsurfspecalb1mlawerC1.c1 (SURFSPECALB) VAP (Gaustad et al. 2011). If both the 10-m and 25-m tower albedos are available, they are averaged (before the data are gridded). If one is bad or missing, then only a single tower is used. In either case, the source flag will indicate which values are used. Band-integrated values are provided for four different sets of shortwave spectral bands commonly used in radiative transfer models— Rapid Radiative Transfer Model (RRTM) (Clough et al. 2005), Fu-Liou (Fu and Liou 1992), Edwards-Slingo (Edwards and Slingo 1996), and GCM 2-band. The band-integrated values are calculated by weighting the estimated spectral albedo from the SURFSPECALB VAP by the solar spectrum at the surface calculated from a high spectral resolution radiative transfer model simulation at the SGP (Gaustad et al. 2011). Although the water vapor loading at the SGP site (and hence the solar flux at the surface) varies over the course of the year, the spectral distribution of the water vapor absorption does not change, giving some universality to the shape of the spectrum used in the weighting.
The SURFSPECALB VAP does not produce values for times with cosine of the solar zenith angle less than 0.15. These data, as well as missing/bad values, are interpolated or filled in with monthly climatological values, although nighttime data (solar zenith angle ≥ 86°) are not filled. If the albedo at any wavelength is bad, the albedo across the entire shortwave spectrum is replaced with the climatological value to avoid spectral discontinuities in the albedo.
3.6 Surface Radiating Temperature
An estimate of the surface radiating temperature is needed to calculate the longwave fluxes. Currently, surface radiating temperature is the only variable that has a preferred input data source and a secondary data source, although RIPBE has been developed generally enough that secondary data sources could be added for other variables, if desired.
The preferred source of surface radiating temperature is the downward-looking infrared thermometer (IRT) on the 10-m tower (irt10mC1.b1). If this datastream is not available (currently it only exists at SGP) or the IRT data are missing or bad, then surface radiating temperature is calculated from the measured longwave upwelling at the surface, assuming emissivity = 1.0. If neither of those datastreams are available or both are missing or bad, then the surface radiating temperature is set to -9999. In future versions, an additional option to use surface air temperature from the surface met or the MERGESONDE VAP will be added.
3.7 Measured Surface Fluxes
Values of measured broadband surface fluxes at 1-min resolution: longwave downwelling, longwave upwelling, shortwave hemispheric downwelling, shortwave direct normal, and shortwave total downwelling are currently input from the qcradb1long datastream (Long and Shi, 2006). At SGP, where multiple flux measurements are available, this will be updated to use the qcradbeflux1long datastream in the next version. These values are gridded onto the RIPBE output grid; missing/bad values that cannot be handled by the data gridder are given values of -9999.

S McFarlane, et al., June 2011, DOE/SC-ARM-TR-097
12
3.8 Clear Sky Detection Flag
Along with measured surface fluxes, a clear sky detection flag from the shortwave flux analysis (SWFLUXANAL) VAP (Long and Gaustad, 2004) is included in RIPBE. This flag indicates when analysis of the SW broadband radiometers indicates likely hemispheric clear skies. It is included primarily for use in flux closure analysis of the BBHRP results. The 1-min data are gridded onto the RIPBE output grid using nearest neighbor interpolation. As with the measured surface fluxes, missing or bad data are not filled in, and are given values of -9999.
3.9 Other
To aid in radiative transfer calculations, solar zenith angle (‘solar_zenith’) and an Earth-Sun distance scaling factor (‘solar_distance_factor’) are calculated based on the site latitude, longitude, and time, and are included in the RIPBE output file.
4.0 Output Data
The RIPBE VAP currently produces a single output file, at 1-min time resolution.
The name of the output file is: SSSripbe1mcfarlane.c1.YYYYMMDD.hhmmss Where: SSS – the site of the input data (e.g., sgp) ripbe1mcfarlane1 – identifies that this is the RIPBE VAP YYYY – year, MM - month of the year, DD - day of the month, hh - hour of the day,
mm - minute of the hour, ss - second of the minute of data start
A detailed description of the output variables is contained in Appendix B.
5.0 Future Plans
5.1 Surface Properties
The surface radiating temperature, which is needed for radiative transfer calculations, is currently calculated from the upwelling longwave radiation at the surface, as measured by a pyrgeometer (at 10 m above ground at SGP). Since the pyrgeometer reacts strongly to the air temperature, it can produce a biased estimate of the surface radiative temperature on warm days. In future versions of RIPBE, surface radiative temperature will be preferentially obtained from a downward-looking IRT, when available. In addition, backup measurements sources will be added, in the following order of preference: downward-looking pyrgeometer, surface air temperature from the MET station, surface air temperature from MERGESONDE.

S McFarlane, et al., June 2011, DOE/SC-ARM-TR-097
13
5.2 CMBE–RIPBE Average File
As a complement to the Climate Modeling Best Estimate (CMBE) VAP, a 1-hour averaged RIPBE file will also be produced. Details of this product are currently under development. It is expected that the file will contain averages of only the cloud and aerosol properties and be on the same height/time resolution as CMBE.
5.3 BBHRP–RIPBE
One of the primary motivations for development of RIPBE was as input to the BBHRP VAP. An interface between RIPBE and RRTM is being developed so that flux and heating rate calculations can be performed. The output of the BBHRP-RIPBE VAP will be broadband longwave and shortwave fluxes and heating rates on the same time/height grid as the RIPBE file, to be used for process-level studies. In addition a 30-min file, which will contain averages of the input properties, calculated fluxes, and measured fluxes, will be produced for flux closure studies.
5.4 Extension to Other Sites
RIPBE has been developed first for the SGP Central Facility, where all input datastreams are available. At other sites, some datastreams (such as SURFSPECALB and AEROSOLBE) are not currently available. Extension to other sites will depend on resource availability. For extension to sites where AEROSOLBE is not available, possibilities include setting all aerosol parameters to zero or using aerosol optical depth from the multifilter rotating shadowband radiometer (MFRSR) along with climatological extinction, SSA, and asymmetry parameter profiles. For extension to sites where SURFSPECALB is not available, a spectral albedo for the site will have to be developed. Possibilities include using a fixed spectral albedo at all times based on surface properties of the site, using a spectral albedo that varies with season, or using a spectral albedo that is scaled to match broadband albedo from a set of upwelling/downwelling broadband radiometers.
5.5 Testbed Development
One of the future uses of RIPBE is as the template for the BBHRP testbed. Therefore, part of the design philosophy for RIPBE was to allow as much customization as possible, so that we provide a complete, stock version of RIPBE but there is also the potential for a user to swap in their own version of one (or more) inputs and build their own RIPBE-ish output to run through BBHRP. To this end, a configuration methodology is being developed that will allow specific processing choices (such as the gridding parameters or interpolation methods) to be specified or new input files to be supplied.

S McFarlane, et al., June 2011, DOE/SC-ARM-TR-097
14
6.0 References
Clough, SA, MW Shephard, E Mlawer, JS Delamere, M Iacono, K Cady-Pereira, S Boukabara, PD Brown. 2005. “Atmospheric radiative transfer modeling: A summary of the AER codes.” Journal of Quantitative Spectroscopy and Radiative Transfer 92: 233–244.
Edwards, JM and A Slingo. 1996. “Studies with a flexible new radiation code. Part 1: Choosing a configuration for a large-scale model.” Quarterly Journal of the Royal Meteorological Society 122: 689–719.
Fu, Q and KN Liou. 1992. “On the correlated k-distribution method for radiative transfer in nonhomogeneous atmospheres.” Journal of the Atmospheric Sciences 49: 2139–2156.
Fu, Q. 1996. “An accurate parameterization of the solar radiative properties of cirrus clouds for climate models.” Journal of Climate 9: 2058–2082.
Gaustad, K, SA McFarlane, CN Long, and E Mlawer. 2011. Spectral Surface Albedo Value-Added Product. U.S. Department of Energy. DOE/SC-ARM/TR-096, in preparation.
Long, CN and Y Shi. 2006. The QCRad Value Added Product: Surface Radiation Measurement Quality Control Testing, Including Climatology Configurable Limits. U.S. Department of Energy. DOE/SC-ARM/TR-074.
Long, CN and K Gaustad. 2004. The Shortwave (SW) Clear-Sky Detection and Fitting Algorithm: Algorithm Operational Details and Explanations. U.S. Department of Energy. DOE/SC-ARM/TR-004.1.
Sivaraman, C, DD Turner, and CJ Flynn. 2006. ABE – Aerosol Best Estimate Value Added Product: Algorithm Operational Details and Explanations. https://engineering.arm.gov/~sivaraman/vap/docs/aerosolbe1turn/TechnicalReport-aerosolbe1turn.doc
Troyan, D. 2010. Merged Sounding Value Added Product. U.S. Department of Energy. DOE/SC-ARM/TR-087.

S McFarlane, et al., June 2011, DOE/SC-ARM-TR-097
A.1
Appendix A
Input Data Table A.1 lists the various ARM datastreams used in the VAP for SGP data, along with the specific variables in files that are used in processing.
Table A.1. SGP Input Files and Variables Datastream Variable Name Variable Long Name Units
sgpmergesonde2maceC1.c1
temp Temperature C bar_pres Barometric pressure kPa rh_scaled Relative humidity scaled using MWR %
height Height km
MSL lat North latitude deg lon East longitude deg
sgpmicrobasepiC1.c1
Heights Height of computed value m
AGL Retrieved_LWC Retrieved liquid water content g m-3
qc_Retrieved_LWC Flag indicating quality of
retrieved_LWC data - Retrieved_IWC Retrieved ice water content g m-3
qc_Retrieved_IWC Flag indicating quality of
retrieved_IWC data - LiqEffectiveRadius Liquid effective radius um
qc_LiqEffectiveRadius Flag indicating quality of LiqEffectiveRadius data -
IceEffectiveRadius Ice effective radius um
qc_IceEffectiveRadius Flag indicating quality of Ice
EffectiveRadius data - MwrScaleFactor Ratio of MWR liq to integrated LWC -
sgpaerosolbe1turnC1.c1
height Height above ground level from aerosolbe1turn_parameter file km
be_angst_exp Best-estimate Angstrom exponent - extinction_profile Aerosol extinction profile at 500 nm km-1
be_aod_500 Best-estimate aerosol optical depth at
500 nm -
single_scattering_albedo Aerosol single scattering albedo
profile at 500 nm -
asymmetry_parameter Aerosol asymmetry parameter profile
at 500 nm -
gectomsX1.a1 ozone Ozone DU
lat Latitude deg lon Longitude deg

S McFarlane, et al., June 2011, DOE/SC-ARM-TR-097
A.2
sgpsurfspecalb1mlawerC1.c1
wavenumber Wavenumber for a given sample time cm-1
estimated_spectral_albedo_10m
Spectral albedo estimated from mfr albedos using surface type and Mlawer algorithm at 10m tower -
qc_estimated_spectral_albedo_10m Quality check results on field -
estimated_spectral_albedo_25m
Spectral albedo estimated from mfr albedos using surface type and Mlawer algorithm at 25m tower -
qc_estimated_spectral_albedo_25m Quality check results on field -
*sgptracegasship1C1.c1
co2 Volume mixing ratio for CO2 ppmv n20 Volume mixing ratio for N2O ppmv ch4 Volume mixing ratio for CH4 ppmv ccl4 Volume mixing ratio for CCl4 ppmv f11 Volume mixing ratio for CFC11 ppmv f12 Volume mixing ratio for CFC12 ppmv
sqpqcrad1longC1.c1
up_long_hemisp Upwelling (10 meter) longwave
hemispheric irradiance Wm-2 qc_up_long_hemisp Quality check results on field -
down_long_hemisp Downwelling longwave hemispheric
irradiance Wm-2 qc_down_long_hemisp Quality check results on field -
down_short_hemisp IR corrected global downwelling
shortwave hemispheric irradiance Wm-2
qc_down_short_hemisp Quality check results on field -
down_short_diffuse_hemisp Downwelling Shortwave Diffuse
Hemispheric Irradiance Wm-2 qc_down_short_diffuse_hemisp Quality check results on field -
short_direct_normal Shortwave direct normal irradiance Wm-2 qc_short_direct_normal Quality check results on field -
sgp1swfanalsirs1longC1.c1
flag_clearsky_detection Clear-sky detection flag -
qc_gswfluxdn Non-standard qc flags used to assess
clear sky detection flag - qc_difswfluxdn “ - qc_dirswfluxdn “ - qc_sswfluxdn “ -
sgpirt10mC1.b1
sfc_ir_temp Surface IR temperature K qc_sfc_ir_temp Quality check results on field
*sgptracegasshipC1.c1 is an internal file produced in pre-processing.

S McFarlane, et al., June 2011, DOE/SC-ARM-TR-097
B.1
Appendix B
Output Variables Table B.1 lists the detailed description of the variables for the RIPBE VAP output file.
Table B.1. sgpripbe1mcfarlane VAP output-file variables
Field Name Units Description base_time seconds seconds since 1970-1-1 0:00:00 0:00 time_offset seconds time offset from base_time time seconds time offset from midnight heights m asl heights of the center of each layer levels m asl heights of the boundaries of each layer solar_zenith degrees solar zenith angle solar_distance_factor unitless scale factor for solar source function for earth/sun distance pressure_level hpa pressure at each level qc_pressure_level unitless qc field for pressure_level source_pressure_level unitless source field for pressure_level aqc_summary_pressure_level unitless summary qc field for pressure_level pressure_layer hpa pressure at each layer qc_pressure_layer unitless qc field for pressure_layer source_pressure_layer unitless source field for pressure_layer aqc_summary_pressure_layer unitless summary qc field for pressure_layer temperature_level K temperature at each level qc_temperature_level unitless qc field for temperature_level source_temperature_level unitless source field for temperature_level aqc_summary_temperature_level unitless summary qc field for temperature_level temperature_layer K temperature at each layer qc_temperature_layer unitless qc field for temperature_layer source_temperature_layer unitless source field for temperature_layer aqc_summary_temperature_layer unitless summary qc field for temperature_layer watervapor_mr_level kg/kg watervapor mixing ratio at each level qc_watervapor_mr_level unitless qc field for watervapor_mr_level source_watervapor_mr_level unitless source field for watervapor_mr_level aqc_summary_watervapor_mr_level unitless summary qc field for watervapor_mr_level watervapor_mr_layer kg/kg watervapor mixing ratio at each layer qc_watervapor_mr_layer unitless qc field for watervapor_mr_layer source_watervapor_mr_layer unitless source field for watervapor_mr_layer aqc_summary_watervapor_mr_layer unitless summary qc field for watervapor_mr_layer watervapor_rh_level % relative humidity at each level qc_watervapor_rh_level unitless qc field for watervapor_rh_level source_watervapor_rh_level unitless source field for watervapor_rh_level aqc_summary_watervapor_rh_level unitless summary qc field for watervapor_rh_level watervapor_rh_layer % relative humidity at each layer qc_watervapor_rh_layer unitless qc field for watervapor_rh_layer source_watervapor_rh_layer unitless source field for watervapor_rh_layer aqc_summary_watervapor_rh_layer unitless summary qc field for watervapor_rh _layer

S McFarlane, et al., June 2011, DOE/SC-ARM-TR-097
B.2
airdensity_level g/m3 density of air at each level qc_airdensity_level unitless qc field for airdensity_level source_airdensity_level unitless source field for airdensity_level aqc_summary_airdensity_level unitless summary qc field for airdensity_level airdensity_layer g/m3 density of air at each layer qc_airdensity_layer unitless qc field for airdensity_layer source_airdensity_layer unitless source field for airdensity_layer aqc_summary_airdensity_layer unitless summary qc field for airdensity_layer cld_lwp g/m2 cloud liquid water path across layer qc_cld_lwp unitless qc field for cld_lwp source_cld_lwp unitless source field for cld_lwp aqc_summary_cld_lwp unitless summary qc field for cld_lwp cld_iwp g/m2 cloud ice water path across layer qc_cld_iwp unitless qc field for cld_iwp source_cld_iwp unitless source field for cld_iwp aqc_summary_cld_iwp unitless summary qc field for cld_iwp cld_reliq um cloud liquid effective radius in each layer qc_cld_reliq unitless qc field for cld_reliq source_cld_reliq unitless source field for cld_reliq aqc_summary_cld_reliq unitless summary qc field for cld_reliq cld_dgeice um cloud generalized effective diameter (Fu 1996) in each layer qc_cld_dgeice unitless qc field for cld_dgeice source_cld_dgeice unitless source field for cld_dgeice aqc_summary_cld_dgeice unitless summary qc field for cld_dgeice aerosol_angstrom untiless aerosol Angstrom parameter qc_aerosol_angstrom unitless qc for aerosol_angstrom source_aerosol_angstrom unitless source for each element of aerosol_angstrom aqc_summary_aerosol_angstrom unitless summary qc field for aerosol_angstrom aerosol_AOD_500 untiless aerosol optical depth at 500 nm qc_aerosol_AOD_500 unitless qc for aerosol_AOD_500 source_aerosol_AOD_500 unitless source for each element of aerosol_AOD_500 aqc_summary_aerosol_AOD_500 unitless summary qc field for aerosol_AOD_500 aerosol_ext_500 km-1 aerosol optical depth at 500 nm qc_aerosol_ext_500 unitless qc for aerosol_ext_500 source_aerosol_ext_500 unitless source for each element of aerosol_ext_500 aqc_summary_aerosol_ext_500 unitless summary qc field for aerosol_ext_500 aerosol_ssa_500 unitless aerosol single scattering albedo at 500 nm qc_aerosol_ssa_500 unitless qc for aerosol_ssa_500 source_aerosol_ssa_500 unitless source for each element of aerosol_ssa_500 aqc_summary_aerosol_ssa_500 unitless summary qc field for aerosol_ssa_500 aerosol_g_500 unitless aerosol asymmetry parameter at 500 nm qc_aerosol_g_500 unitless qc for aerosol_g_500 source_aerosol_g_500 unitless source for each element of aerosol_g_500 aqc_summary_aerosol_g_500 unitless summary qc field for aerosol_g_500 ozone_mr ppmv ozone volume mixing ratio at level heights qc_ozone_mr unitless qc field for ozone_mr source_ozone_mr unitless source for each element of ozone_mr field aqc_summary_ozone_mr unitless summary qc field for ozone_mr column_ozone DU total column ozone qc_column_ozone unitless qc field for column_ozone source_column_ozone unitless source for each element of column_ozone field

S McFarlane, et al., June 2011, DOE/SC-ARM-TR-097
B.3
aqc_column_ozone unitless summary qc field for column_ozone start_wnum_rrtm cm-1 wavenumber for start of rrtm band end_wnum_rrtm cm-1 wavenumber for end of rrtm band surface_albedo_rrtm unitless surface albedo in rrtm bands qc_surface_albedo_rrtm unitless qc field for surface_albedo_rrtm source_surface_albedo_rrtm unitless source field for surface_albedo_rrtm aqc_summary_surface_albedo_rrtm unitless summary qc field for surface_albedo_rrtm start_wnum_fu_liou cm-1 wavenumber for start of fu_liou band end_wnum_fu_liou cm-1 wavenumber for end of fu_liou band surface_albedo_fu_liou unitless surface albedo in fu_liou bands (Fu and Liou 1992) qc_surface_albedo_fu_liou unitless qc field for surface_albedo_fu_liou source_surface_albedo_fu_liou unitless source field for surface_albedo_fu_liou aqc_summary_surface_albedo_fu_liou unitless summary qc field for surface_albedo_fu_liou start_wnum_gcm2 cm-1 wavenumber for start of gcm2 band end_wnum_gcm2 cm-1 wavenumber for end of gcm2 band surface_albedo_gcm2 unitless surface albedo in 2-band GCM-type radiation model qc_surface_albedo_gcm2 unitless qc field for surface_albedo_gcm2 source_surface_albedo_gcm2 unitless source field for surface_albedo_gcm2 aqc_summary_surface_albedo_gcm2 unitless summary qc field for surface_albedo_gcm2 start_wnum_edwards_slingo cm-1 wavenumber for start of edwards_slingo band end_wnum_edwards_slingo cm-1 wavenumber for end of edwards_slingo band surface_albedo_edwards_slingo unitless surface albedo in edwards_slingo bands (Edwards and Slingo 1996) qc_surface_albedo_edwards_slingo unitless qc field for surface_albedo_edwards_slingo source_surface_albedo_edwards_slingo unitless source field for surface_albedo_edwards_slingo aqc_summary_surface_albedo_edwards_slingo unitless summary qc field for surface_albedo_edwards_slingo co2_mr ppmv volume mixing ratio for CO2; assumed constant with height qc_co2_mr unitless qc field for co2_mr source_co2_mr unitless source field for co2_mr aqc_summary_co2_mr unitless summary qc field for co2_mr ch4_mr ppmv volume mixing ratio for CH4; assumed constant with height qc_ch4_mr unitless qc field for ch4_mr source_ch4_mr unitless source field for ch4_mr aqc_summary_ch4_mr unitless summary qc field for ch4_mr n2o_mr ppmv volume mixing ratio for N2O; assumed constant with height qc_n2o_mr unitless qc field for n2o_mr source_n2o_mr unitless source field for n2o_mr aqc_summary_n2o_mr unitless summary qc field for n2o_mr ccl4_mr ppmv volume mixing ratio for CCL4; assumed constant with height qc_ccl4_mr unitless qc field for ccl4_mr source_ccl4_mr unitless source field for ccl4_mr aqc_summary_ccl4_mr unitless summary qc field for ccl4_mr f11_mr ppmv volume mixing ratio for CFC11; assumed constant with height qc_f11_mr unitless qc field for f11_mr source_f11_mr unitless source field for f11_mr aqc_summary_f11_mr unitless summary qc field for f11_mr f12_mr ppmv volume mixing ratio for CFC12; assumed constant with height qc_f12_mr unitless qc field for f12_mr source_f12_mr unitless source field for f12_mr aqc_summary_f12_mr unitless summary qc field for f12_mr surface_rad_temp K surface radiating temperature qc_surface_rad_temp unitless qc field for surf_rad_temp

S McFarlane, et al., June 2011, DOE/SC-ARM-TR-097
B.4
source_surface_rad_temp unitless source field for surf_rad_temp aqc_surface_rad_temp unitless summary qc field for surf_rad_temp meas_down_long_hemisp W/m2 measured longwave flux at surface qc_meas_down_long_hemisp unitless qc field for meas_down_long_hemisp source_meas_down_long_hemisp unitless source field for meas_down_long_hemisp aqc_summary_meas_down_long_hemisp unitless summary qc field for meas_down_long_hemisp meas_down_short_hemisp W/m2 measured shortwave flux at surface qc_meas_down_short_hemisp unitless qc field for meas_down_short_hemisp source_meas_down_short_hemisp unitless source field for meas_down_short_hemisp aqc_summary_meas_down_short_hemisp unitless summary qc field for meas_down_short_hemisp meas_down_short_diffuse_hemisp W/m2 measured shortwave diffuse flux at surface qc_meas_down_short_diffuse_hemisp unitless qc field for meas_down_short_diffuse_hemisp source_meas_down_short_diffuse_hemisp unitless source field for meas_down_short_diffuse_hemisp aqc_summary_meas_down_short_diffuse_hemisp unitless summary qc field for meas_down_short_diffuse _hemisp meas_down_short_direct_normal_hemisp W/m2 measured shortwave direct normal flux at surface qc_meas_down_short_direct_normal_hemisp unitless qc field for meas_down_short_direct_normal_hemisp source_meas_down_short_direct_normal_hemisp unitless source field for meas_down_short_direct_normal_hemisp aqc_summary_meas_down_short_direct_normal_hemisp unitless summary qc field for meas_down_short_direct_normal_hemisp lat degrees north latitude lon degrees east longitude alt m asl altitude


