106
Radical Agrarian Socio-Economic Transformation “”RASET”” PRESENTATION TO COLLOQUIUM Dated: 17 th November 2017
| Date post: | 03-Oct-2018 |
| Category: |
Documents |
| Upload: | phungthuan |
| View: | 221 times |
| Download: | 0 times |

Radical Agrarian Socio-Economic Transformation
“”RASET””
PRESENTATION TO
COLLOQUIUMDated: 17th November 2017
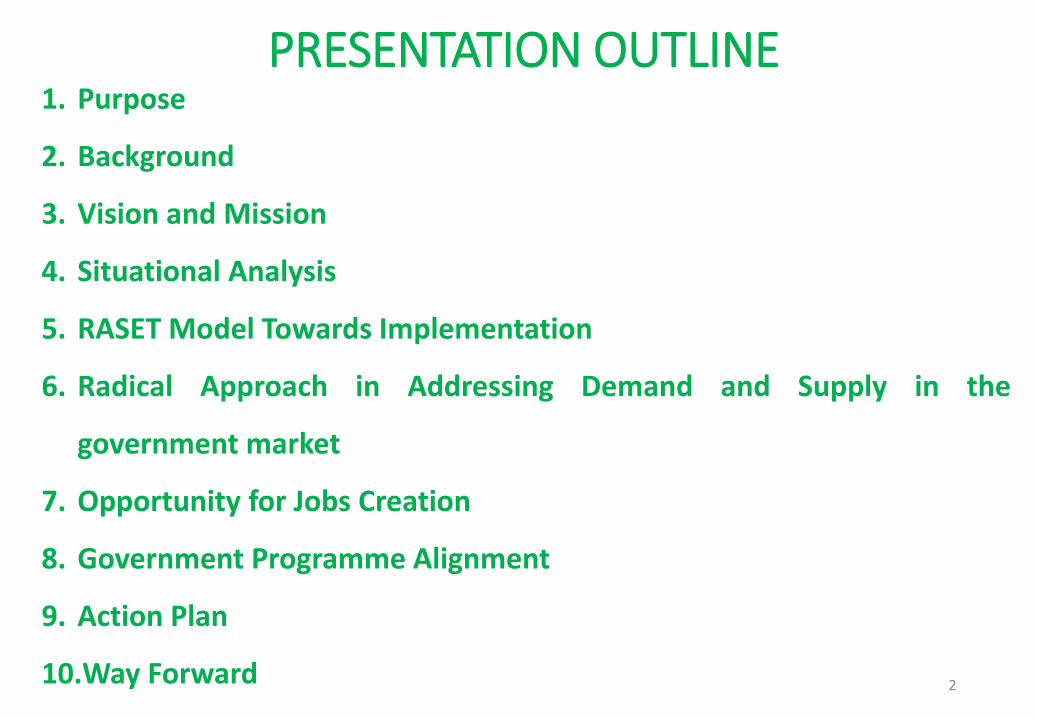
PRESENTATION OUTLINE1. Purpose
2. Background
3. Vision and Mission
4. Situational Analysis
5. RASET Model Towards Implementation
6. Radical Approach in Addressing Demand and Supply in the
government market
7. Opportunity for Jobs Creation
8. Government Programme Alignment
9. Action Plan
10.Way Forward 2

Agrarian Radical Socio-Economic Transformation ModelAgrarian Radical Socio-Economic Transformation Model 3
1. Purpose

Agrarian Radical Socio-Economic Transformation ModelAgrarian Radical Socio-Economic Transformation Model 4
1. Purpose
To present concepts & progress on
Radical Agrarian Socio-Economic
Transformation (RASET) as a meaningful
vehicle that ensures active participation of
PDIs in the entire food value chain.

Agrarian Radical Socio-Economic Transformation ModelAgrarian Radical Socio-Economic Transformation Model 5
2. Background
Agrarian Radical Socio-Economic Transformation ModelAgrarian Radical Socio-Economic Transformation Model
2. Background
6
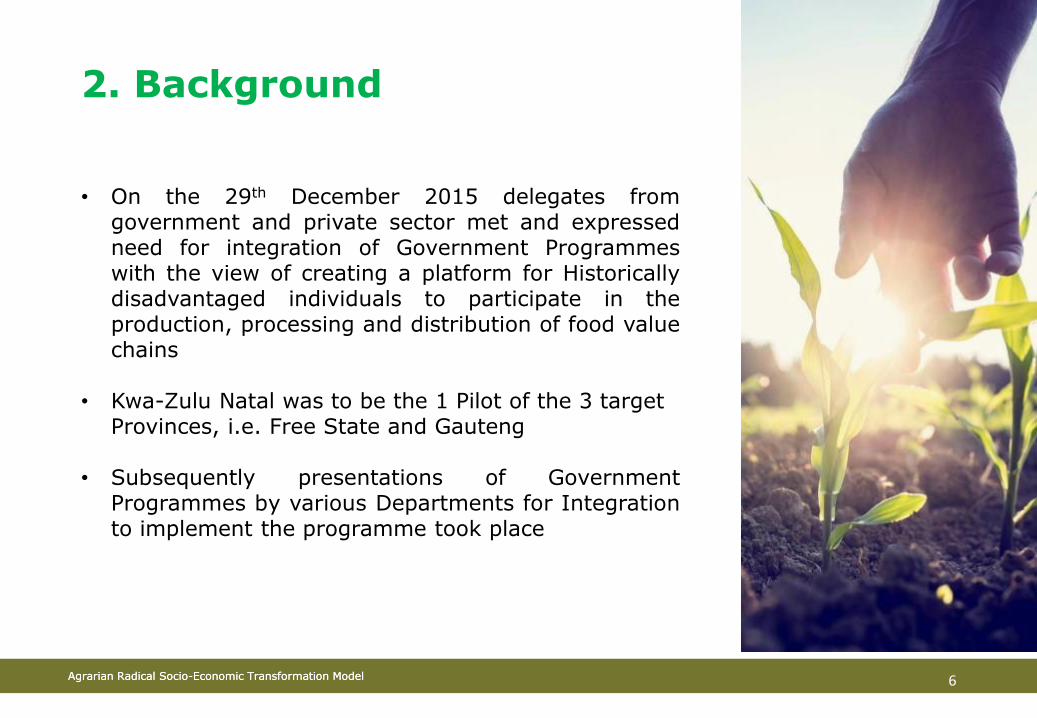
• On the 29th December 2015 delegates fromgovernment and private sector met and expressedneed for integration of Government Programmeswith the view of creating a platform for Historicallydisadvantaged individuals to participate in theproduction, processing and distribution of food valuechains
• Kwa-Zulu Natal was to be the 1 Pilot of the 3 target Provinces, i.e. Free State and Gauteng
• Subsequently presentations of GovernmentProgrammes by various Departments for Integrationto implement the programme took place

Agrarian Radical Socio-Economic Transformation ModelAgrarian Radical Socio-Economic Transformation Model 7
• High Level model for Integration of Government Programmes in pursuit
of implementing a Pilot in KZN was developed, dubbed “RADICAL
AGRARIAN SOCIO-ECONOMIC TRANFORMATION PROGRAMME
• The participating departments met and came up with a concept
document
• A comprehensive business plan was then developed.
• The Agrarian Radical Socio-economical Transformation Strategy was
presented and supported by SPCHD Technical Cluster.
• A presentation was made to SPCHD political Cluster on the 18 May 2016
• Approval by Executive Council on the 07 September 2016
• Draft Master Plan developed on the 11 October 2016

Agrarian Radical Socio-Economic Transformation ModelAgrarian Radical Socio-Economic Transformation Model
2. Background Eminating from Cabinet resolutions
8
Executive Council Resolved that:
As per the CABINET resolution No. 246 of 06 July 2016 the following were resolved:
1. The cabinet resolved that the implementation of the Radical Agrarian Socio-Economic Transformation (RASET) Programme as a pilot for the Province of KwaZulu-Natal was approved;
2. That a RASET Programme Implementing Unit be established to oversee the implementation of the programme at Edtea with specialised skills;
3. Edtea co-ordinates the Steering Committee;
4. That Government Departments who are on the demand side commit to a set aside of an initial minimum of 50% food supply from the RASET programme (R1,1 Billion);
5. That all effected Departments allocated budgets that will enable them to meaningfully participate and support the implementation of the RASET programme;
6. That eThekwini Municipality implements an Agri Park Model as a mechanism to rollout the RASET programme;
7. That strategic partnership with the private sector be institutionalised;
8. That the Memorandum of Agreement (MOA) is entered into and concluded between all the participating Departments in respect of their roles and financial commitments; and
9. That RASET Programme is launch by latest end of July 2016.

Agrarian Radical Socio-Economic Transformation ModelAgrarian Radical Socio-Economic Transformation Model 9
3. Vision and Mission

Agrarian Radical Socio-Economic Transformation Model
The Agrarian Radical Socio-Economic Transformation Model is aligned to government’spolicies and mandates:
National Development Plan (NDP)
2015 State of Nation Address (SONA)
Nine Point Plan
KZN Poverty Eradication Master Plan
The New Growth Path (NGP)
Operation Phakisa
Agriculture Policy Action Plan (APAP)
KwaZulu-Natal Provincial Growth and Development Plan
KwaZulu-Natal Department of Agriculture and Rural Development Strategic Plan
Strategy for Agrarian Transformation, and
Agri- Park strategy
3. Value Proposition (Policy Context)
10

Agrarian Radical Socio-Economic Transformation Model
The rationale of RET is to facilitate urgent change needed in economy to eradicatepoverty, reduce unemployment and inequality in accordance with the Nine PointPlan announced by President
1• Resolving the energy challenge.
2• Revitalising agriculture and the agro-processing value chain.
3• Advancing beneficiation or adding value to our mineral wealth.
4• More effective implementation of a higher impact Industrial Policy Action Plan.
5• Encouraging private sector investment.
6• Moderating workplace conflict.
7
• Unlocking the potential of small, medium and micro enterprises (SMMEs), cooperatives, township and rural enterprises.
8
• State reform and boosting the role of state owned companies, information and communications technology (ICT) infrastructure or broadband roll-out, water, sanitation and transport infrastructure as well as
9• Operation Phakisa aimed growing the ocean economy and other sectors
Nine Point Plan
11

Agrarian Radical Socio-Economic Transformation Model
The Gap is Widening not Narrowing
• The structural composition of agricultural modes of production in
the country has largely remained untransformed over the last two
decades, still benefiting minority groups and contributes to inequality and
underdevelopment.
• The South African economy is still skewed in favor of established
private sector, who monopolize the entire value chain.
• The previously disadvantaged farmers still find it difficult to access
the available markets for the produce.
• The gap between established private sector and previously
disadvantaged farmers is continuously widening.
4. Problem Statement
12

Agrarian Radical Socio-Economic Transformation Model
• Participation of local communities in a value chain is limited, despite social assistance of R263million in the Province of Kwa-Zulu Natal per year provided by DSD
• The following illustration captures the imagery of economic and financial leakage out of
impoverished communities (the leaking bucket).
13
Agrarian Radical Socio-Economic Transformation Model
Status Quo Of Current Scale Of Production By PDI & Market Dynamics
30/11/2017 14

Agrarian Radical Socio-Economic Transformation Model
Private Sector value chain
INPUT
PRODUCTION HARVEST
TRANSPORTSTORAGE
Development
PROCESSINGGVT & other
MARKET

Agrarian Radical Socio-Economic Transformation Model
• Each subsection of the food value chain in South Africa
is dominated by very few large well resourced-
companies
• The potential new entrant is therefore dwarfed by
prevailing anti competitive forces.
• The Goliath barriers to entry are deceptively
formidable forces requiring strategic Mindset of King
David
Private Sector Value chain
16
Agrarian Radical Socio-Economic Transformation Model
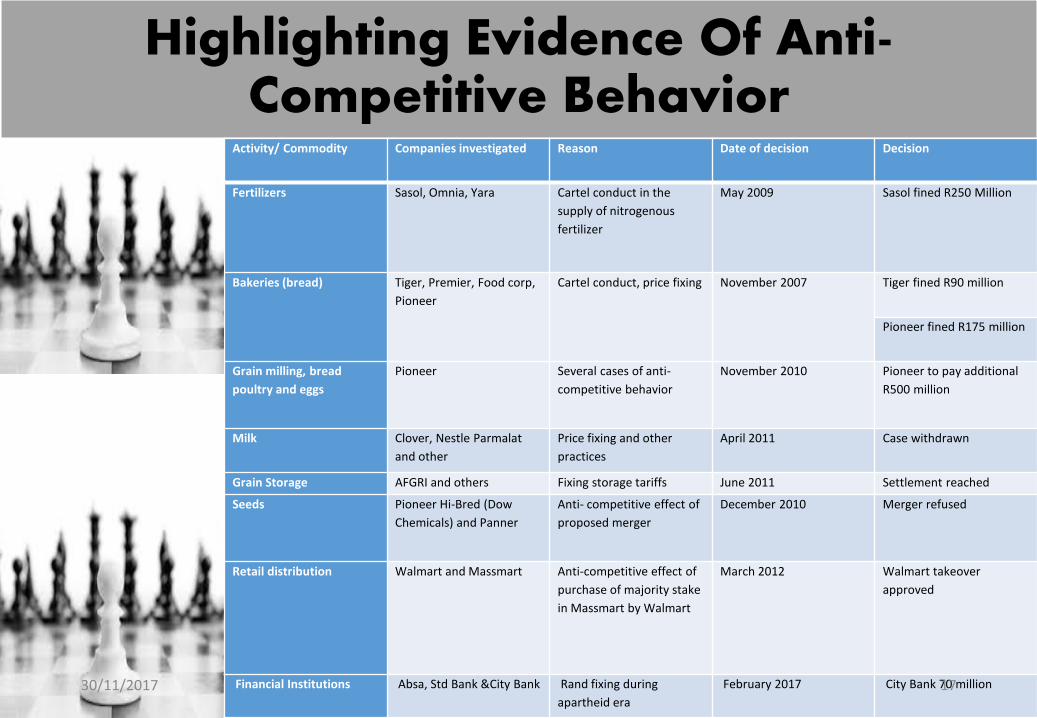
Highlighting Evidence Of Anti-Competitive Behavior
Activity/ Commodity Companies investigated Reason Date of decision Decision
Fertilizers Sasol, Omnia, Yara Cartel conduct in the
supply of nitrogenous
fertilizer
May 2009 Sasol fined R250 Million
Bakeries (bread) Tiger, Premier, Food corp,
Pioneer
Cartel conduct, price fixing November 2007 Tiger fined R90 million
Pioneer fined R175 million
Grain milling, bread
poultry and eggs
Pioneer Several cases of anti-
competitive behavior
November 2010 Pioneer to pay additional
R500 million
Milk Clover, Nestle Parmalat
and other
Price fixing and other
practices
April 2011 Case withdrawn
Grain Storage AFGRI and others Fixing storage tariffs June 2011 Settlement reached
Seeds Pioneer Hi-Bred (Dow
Chemicals) and Panner
Anti- competitive effect of
proposed merger
December 2010 Merger refused
Retail distribution Walmart and Massmart Anti-competitive effect of
purchase of majority stake
in Massmart by Walmart
March 2012 Walmart takeover
approved
Financial Institutions Absa, Std Bank &City Bank Rand fixing during
apartheid era
February 2017 City Bank 70 million 30/11/2017 17

Agrarian Radical Socio-Economic Transformation Model
Current Government Interventions
18
Various Government Departments in their respective areas of responsibility
are implementing various programmes as their mandate to address socio
economic constraints facing the country. The programmes of the following
role players will be highlighted below:
i. Department of Social Development (DSD)
ii. Economic Development, Tourism and Environmental Affairs
(EDTEA)
iii. Department of Agriculture and Rural Development (DARD)
iv. Department of Rural Development and Land Reform (DRDLR)
v. Cooperative Governance and Traditional Affairs (COGTA)
vi. Department of Education KZN
vii. Department of Health KZN
viii. eThekwini Metro and 10 Districts
ix. Agri-Parks Strategy

Agrarian Radical Socio-Economic Transformation Model
Silo Paradigm
19
The departments have all these
programmes which were made to
address socio economic
challenges, however lack of
integration and coordination of
programmes (silo approach)
continues to undermine this
contribution

Agrarian Radical Socio-Economic Transformation Model20
GAME
CHANGERS
Agrarian Radical Socio-Economic Transformation Model
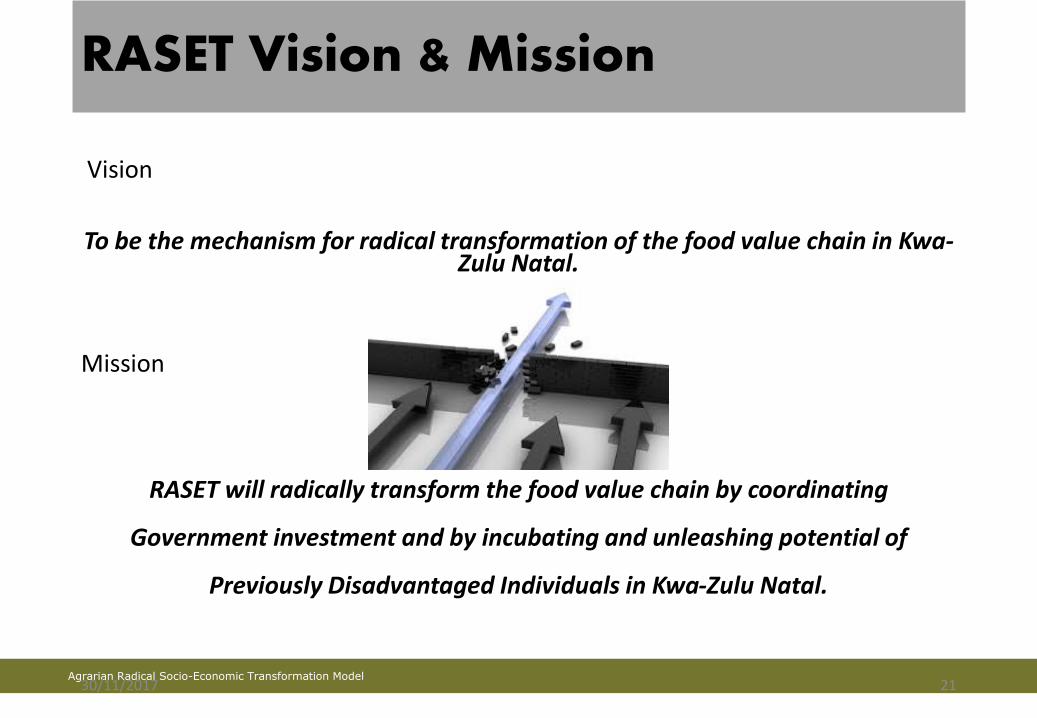
RASET Vision & Mission
Vision
To be the mechanism for radical transformation of the food value chain in Kwa-Zulu Natal.
Mission
RASET will radically transform the food value chain by coordinating
Government investment and by incubating and unleashing potential of
Previously Disadvantaged Individuals in Kwa-Zulu Natal.
30/11/2017 21

Agrarian Radical Socio-Economic Transformation Model
RASET Vision & Mission
Vision
To be the mechanism for radical transformation of the food value chain in Kwa-Zulu Natal.
Mission
RASET will radically transform the food value chain by coordinating Government investment and by incubating and
unleashing potential of Previously Disadvantaged Individuals in Kwa-Zulu Natal.
22

Agrarian Radical Socio-Economic Transformation ModelAgrarian Radical Socio-Economic Transformation Model 23
4. Situational Analysis

The gap established private sector and previously
disadvantage famers is continuously widening
Decrease Access
Markets
Increase cost of doing
business for Black Farmers
No of farmers in KZN declined
Contribution of KZN farmers to GDP in declined
Economy declinePoverty increased in Agric jobs declined
Stifled progress on programme
Implementation such Silo operations of
different departments
Untransformed agricultural sector, still benefiting minority
groups.
Skewed economy in favor of established private sector
Disadvantaged farmers still find it
difficult to access the available
markets
4. Situational Analysis

Agrarian Radical Socio-Economic Transformation ModelAgrarian Radical Socio-Economic Transformation Model 25
5. RASET Approach Towards Implementation
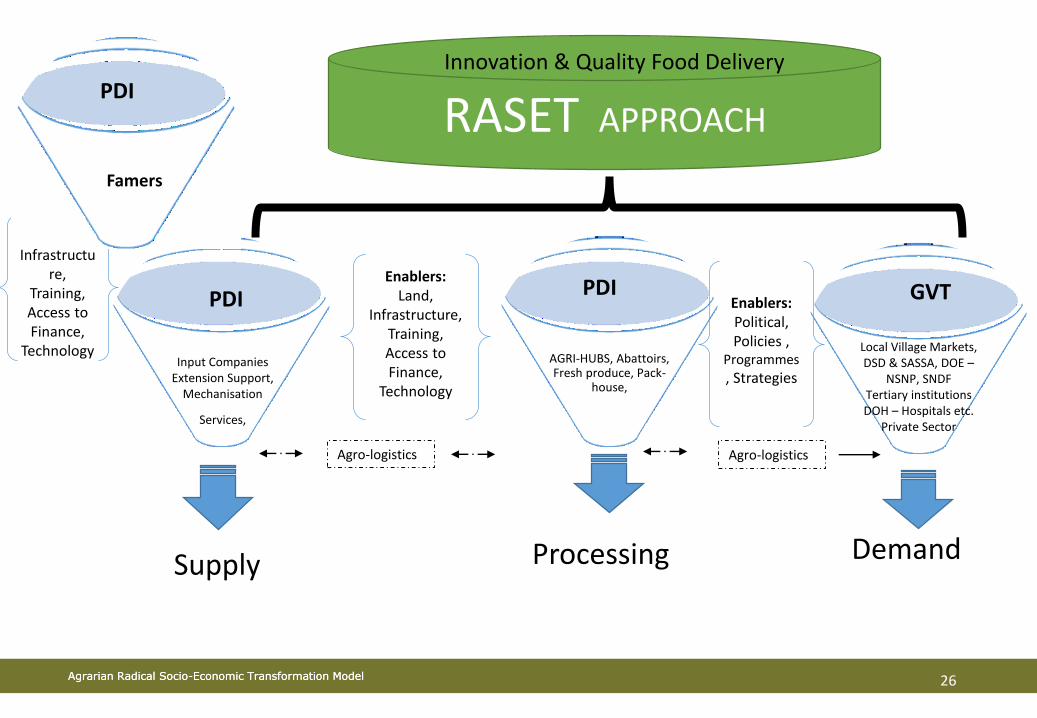
Agrarian Radical Socio-Economic Transformation ModelAgrarian Radical Socio-Economic Transformation Model 26
Supply Processing Demand
RASET APPROACH
Input CompaniesExtension Support,
Mechanisation
Services,
PDI PDI GVT
Enablers:Land,
Infrastructure,
Training, Access to Finance,
Technology AGRI-HUBS, Abattoirs, Fresh produce, Pack-
house,
Local Village Markets, DSD & SASSA, DOE –
NSNP, SNDFTertiary institutionsDOH – Hospitals etc.
Private Sector
Agro-logistics Agro-logistics
Enablers:Land,
Infrastructure, Training, Access to Finance,
Technology
Enablers:Political, Policies ,
Programmes
, Strategies
Innovation & Quality Food DeliveryPDI
Famers

Agrarian Radical Socio-Economic Transformation Model
RASET BUSINESS PROCESS
District
Development
Agency / FPM
DOE
Demand
Commitment
DOH
Demand
Commitment
DSD
Demand
Commitment
End Users
Chilled Transport 1 Chilled Transport 2 Chilled Transport 3
AT GOVERNMENT
LEVEL
AT LOCAL
MUNICIPALITY LEVEL
AT DISTRICT
MUNICIPALITY LEVEL
PrimCoops,
(Pty) Ltds, CCs
SPs,
NPOs, NGOs,
NPCs, Trusts
SECONDARY COOP
PrimCoops(Pty) Ltds, CCs
SPs, NPOs, NGOs,NPCs, Trusts
SECONDARY COOP
PrimCoops
(Pty) Ltds, CCs
SPs,
NPOs, NGOs,
NPCs, Trusts
SECONDARY
COOP
RASET
BUSINESS
UNIT
Agrarian Radical Socio-Economic Transformation Model
RASET IMPLEMENTATION MODEL
Individuals Community Local Municipality
District Municipality
Destination
5 5 5 5 5
P P P P P
S
Customer
5 5 5 5 5
P P P P P
S
Customer
5 5 5 5 5
P P P P P
S
FPM / DC
Customer
5 5 5 5 5
P P P P P
S
Customer
5 5 5 5 5
P P P P P
S
Customer
Customer
Transport 1 Transport 2 Transport 3

Agrarian Radical Socio-Economic Transformation ModelAgrarian Radical Socio-Economic Transformation Model 29
6. Radical Approach in Addressing
Demand and Supply in the
government market
Agrarian Radical Socio-Economic Transformation ModelAgrarian Radical Socio-Economic Transformation Model
Radical Approach in Addressing Demand and Supply in the government market
Based on the CABINET resolution No. 246 of 06 July 2016, state that,“government departments who are on the demand side must commit to aset aside an initial minimum of 50% food supply from the RASET programme(R1,1 Billion)”.
In response to the above resolution (03) three government departmentscame on board and disclosed data on their food consumption demand intheir different programmes (NSNP, SRP,CND) includes:
• Department of Education (DOE)
• Department of Health (DOH)
• Department of Social Development (DSD)
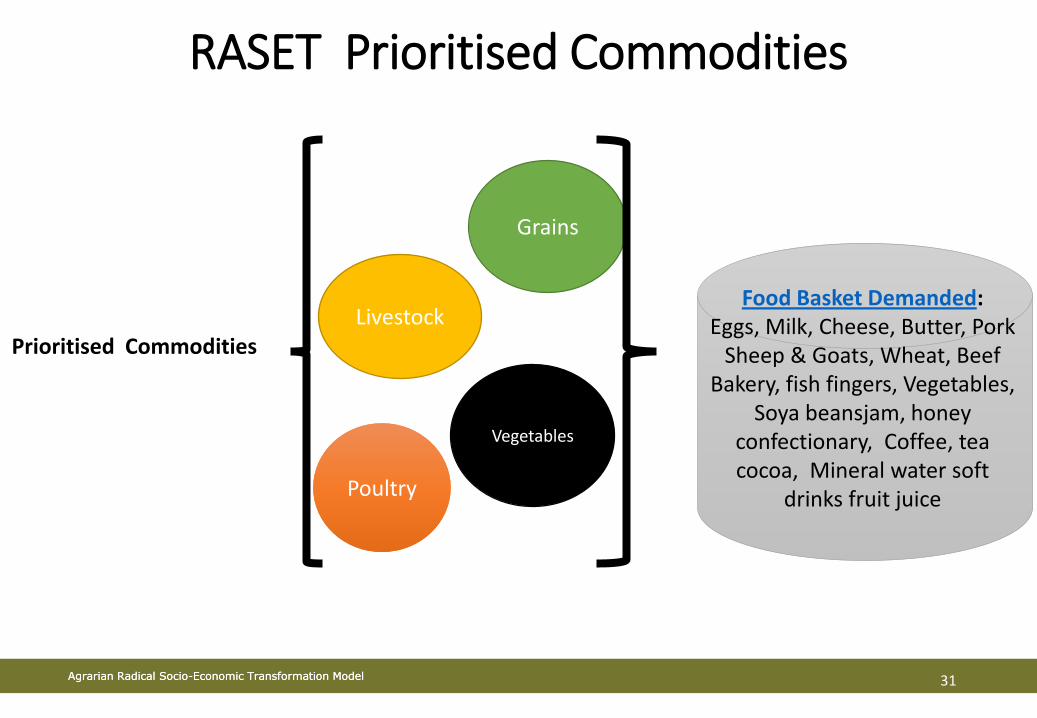
Emanating from the consumption demand supplied by aforesaiddepartments, (4) four commodities were then prioritised.
30
Agrarian Radical Socio-Economic Transformation ModelAgrarian Radical Socio-Economic Transformation Model
RASET Prioritised Commodities
31
Prioritised Commodities
Food Basket Demanded:Eggs, Milk, Cheese, Butter, Pork
Sheep & Goats, Wheat, BeefBakery, fish fingers, Vegetables,
Soya beansjam, honey confectionary, Coffee, tea cocoa, Mineral water soft
drinks fruit juice
Vegetables
Grains
Livestock
PoultryPoultry
Agrarian Radical Socio-Economic Transformation ModelAgrarian Radical Socio-Economic Transformation Model
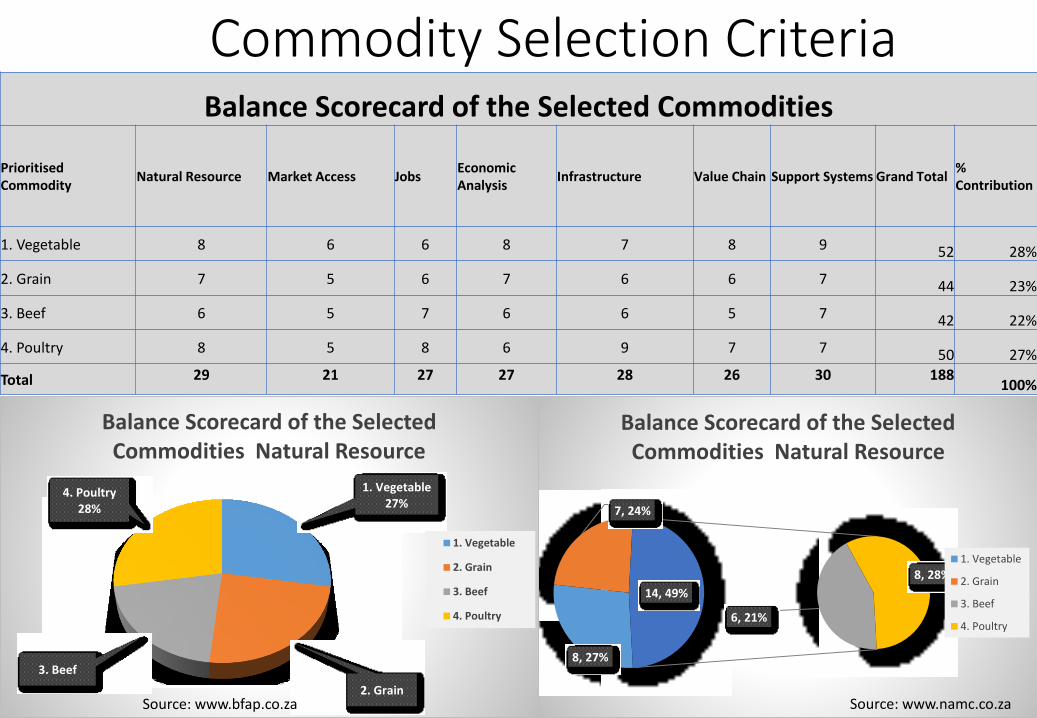
Commodity Selection Criteria
32
8, 27%
7, 24%
6, 21%
8, 28%
14, 49%
Balance Scorecard of the Selected Commodities Natural Resource
1. Vegetable
2. Grain
3. Beef
4. Poultry
Balance Scorecard of the Selected Commodities
Prioritised Commodity
Natural Resource Market Access JobsEconomic Analysis
Infrastructure Value Chain Support Systems Grand Total % Contribution
1. Vegetable 8 6 6 8 7 8 9 52 28%
2. Grain 7 5 6 7 6 6 7 44 23%
3. Beef 6 5 7 6 6 5 7 42 22%
4. Poultry 8 5 8 6 9 7 7 50 27%
Total 29 21 27 27 28 26 30 188100%
1. Vegetable 27%
2. Grain
3. Beef
4. Poultry28%
Balance Scorecard of the Selected Commodities Natural Resource
1. Vegetable
2. Grain
3. Beef
4. Poultry
Source: www.bfap.co.za Source: www.namc.co.za

Agrarian Radical Socio-Economic Transformation Model
PRIORITY COMMODITIES FOR GAUTENG IN LINE WITH APAP
Horticulture Value Chain (51% of KZN GVA)• Vegetables • Herbs & Essential oilsOpportunity: Proximity to large population and growing middle class –Bulking up, quality assurance and branding
Horticulture Value Chain Grains – Poultry Integrated Value Chain (4th largest producer of Grains i.e. maize & dry-bean)
Red Meat Value Chain
60% of KZN Gross farm income comes from Livestock predominantly in FeedlotsOpportunity: Processing infrastructure for smallholder farmers and their integration.- Linkage to mobile abattoirs program
PRIORITY COMMODITIES FOR RASET LOW-HANGING IN LINE WITH APAP

Agrarian Radical Socio-Economic Transformation Model
OPPORTUNITIES IN THE VALUE CHAIN

Global Food Value Chain
Agrarian Radical Socio-Economic Transformation Model
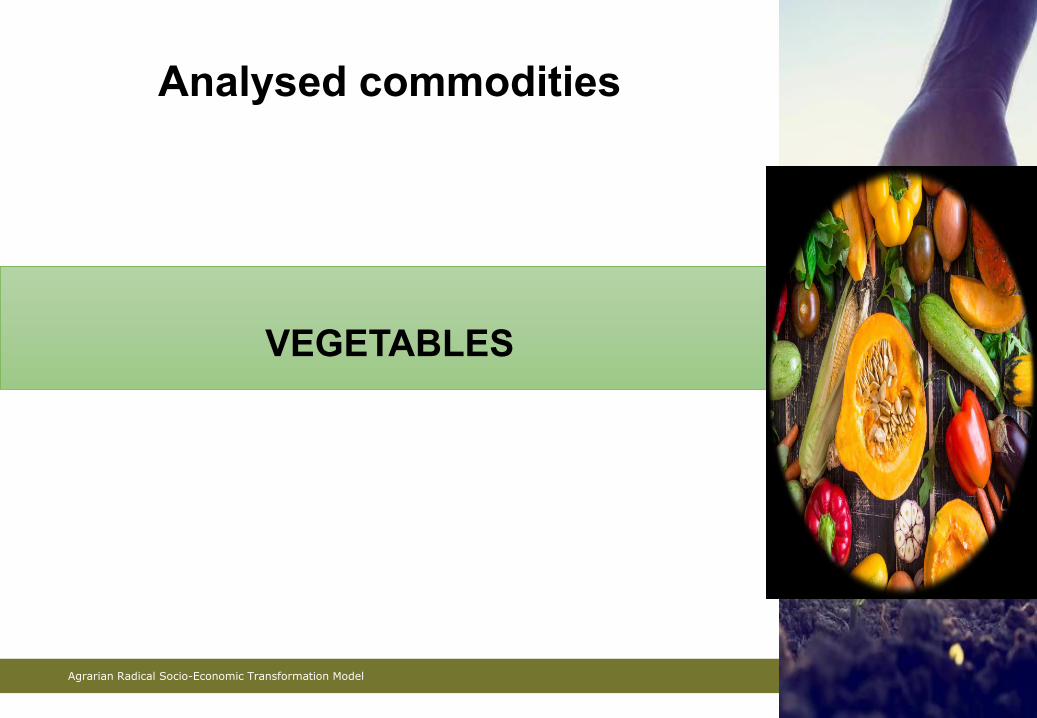
Analysed commodities
VEGETABLES
Agrarian Radical Socio-Economic Transformation ModelAgrarian Radical Socio-Economic Transformation Model 37
DOE demand calculation and consumption for vegetables
Agrarian Radical Socio-Economic Transformation Model
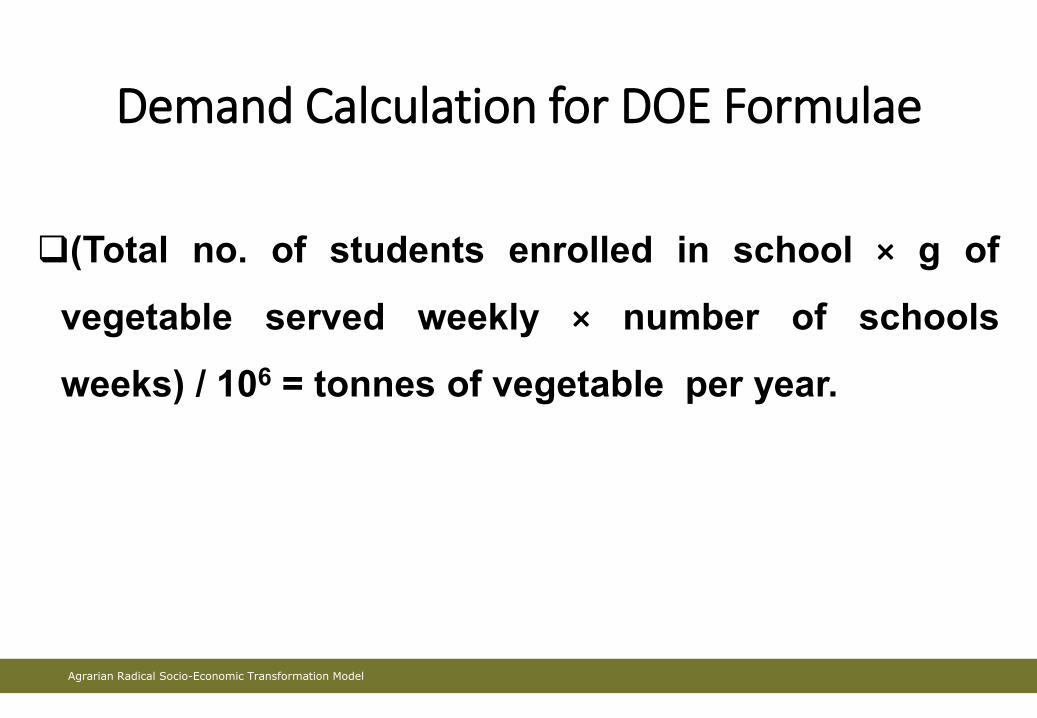
Demand Calculation for DOE Formulae
(Total no. of students enrolled in school × g of
vegetable served weekly × number of schools
weeks) / 106 = tonnes of vegetable per year.
Agrarian Radical Socio-Economic Transformation Model
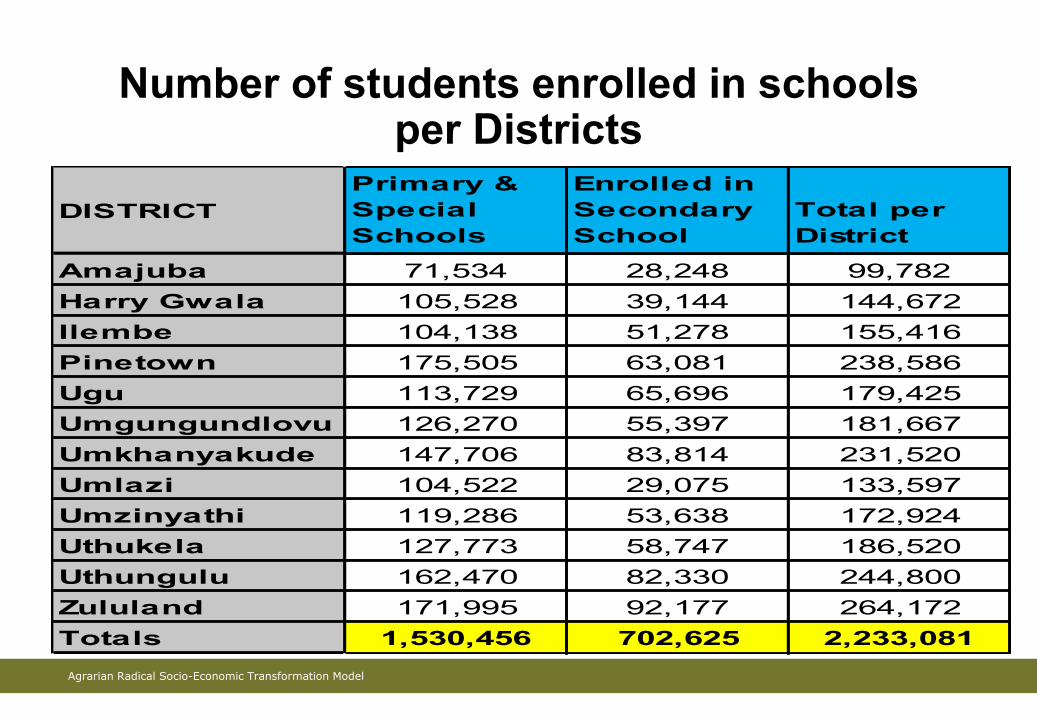
Number of students enrolled in schools per Districts
DISTRICT
Enrolled in
Primary &
Special
Schools
Enrolled in
Secondary
School
Total per
District
Amajuba 71,534 28,248 99,782
Harry Gwala 105,528 39,144 144,672
Ilembe 104,138 51,278 155,416
Pinetown 175,505 63,081 238,586
Ugu 113,729 65,696 179,425
Umgungundlovu 126,270 55,397 181,667
Umkhanyakude 147,706 83,814 231,520
Umlazi 104,522 29,075 133,597
Umzinyathi 119,286 53,638 172,924
Uthukela 127,773 58,747 186,520
Uthungulu 162,470 82,330 244,800
Zululand 171,995 92,177 264,172
Totals 1,530,456 702,625 2,233,081

Agrarian Radical Socio-Economic Transformation Model
DOE Daily and weekly frequency of vegetables per student
Onion 10 g 5
Cabbage 80 g 1
Spinach 80 g 1
Carrot 60 g 1
Butternut 60 g 1
Mixed Veg 60 g 1
Tomatoes 10 g 1
Commodity Daily requirement Frequencies per
week

Agrarian Radical Socio-Economic Transformation Model
DOH demand calculation and consumption

Agrarian Radical Socio-Economic Transformation Model
Calculation of vegetable demand for DOH
(Total no. of hospital beds × g of vegetable served weekly × 52
weeks) / 106 = tonnes of vegetable per year
Agrarian Radical Socio-Economic Transformation Model
Number of hospital beds per District
District/Metro Name No. of beds
Amajuba District 1407
Ethekwini Metro 8982
Harry Gwala District 1213
Ilembe District 925
Ugu District 1324
Umgungundlovo District 3513
Umkhanyakude District 1220
Umzinyathi District 1127
Uthukela District 919
Uthungulu District 2120
Zululand District 1559
TOTAL 24309

Agrarian Radical Socio-Economic Transformation Model
DOH Daily and weekly frequency of vegetables
Potatoes 100g 2
Potatoes, baby 100g 1
Butternut 80g 2
Beetroot 60g 1
Brinjal 60g 1
Green beans 60g 1
Cucumber 60g 2
Spinach 50g 1
Lettuce, head 30g 2
Green peppers 30g 3
Gem squash 80g 1
Pumpkin 80g 1
Onions 20g 7
Tomatoes 30g 7
Carrots, whole 40g 2
Item Frequencies
per weekSpecification per patient

Agrarian Radical Socio-Economic Transformation Model45
SUMMARY OF DEMANDED VEGETABLES TO RASET PRORAMME

Agrarian Radical Socio-Economic Transformation Model
Vegetables Annual demand (Tonnes) indicated by Departments
DISTRIBUTION OF VEGETABLES PER DEPARTMENT
Commodities Departments Total Tonnage consumed % Total Consumed
DOE DOH DSD
Onions 4377 177 579 5133 11.9%
Cabbage 7003 0 0 7003 16.2%
Spinach 7003 75 0 7078 16.4%
Carrots 6318 101 78 6497 15.0%
Butternuts /Pampkin 5803 404 259 6466 14.9%
Tomatoes 4377 0 0 4377 10.1%
Mixed Vegetable 5803 0 0 5803 13.4%
Potatoes 0 379 533 912 2.1%
Main Consumer 40684 1136 1449 43269 100.0%
Agrarian Radical Socio-Economic Transformation Model
Consumption percentage
11%
17%
17%
16%
14%
11%
14%0%
RELATIVE DISTRIBUTION OF TOTAL CONSUMED COMMODITIES PER DEPARTMENT
Onions Cabbage Spinach Carrots Butternuts /Pampkin Tomatoes Mixed Vegetable Potatoes

Agrarian Radical Socio-Economic Transformation Model
Percentage (%) of total demand per vegetable commodity per Departments
94%
3% 3%
CONSUMPTION PER DEPARTMENT
DOE DOH DSD
Agrarian Radical Socio-Economic Transformation Model
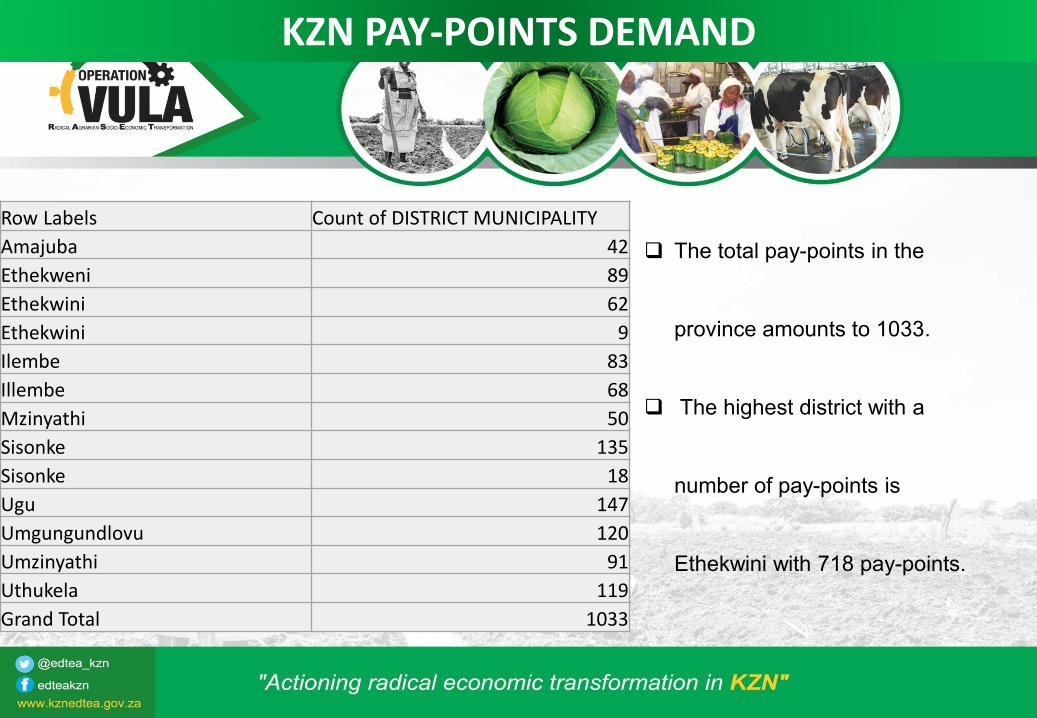
KZN PAY-POINTS DEMAND
Row Labels Count of DISTRICT MUNICIPALITY
Amajuba 42
Ethekweni 89
Ethekwini 62
Ethekwini 9
Ilembe 83
Illembe 68
Mzinyathi 50
Sisonke 135
Sisonke 18
Ugu 147
Umgungundlovu 120
Umzinyathi 91
Uthukela 119
Grand Total 1033
The total pay-points in the
province amounts to 1033.
The highest district with a
number of pay-points is
Ethekwini with 718 pay-points.

Agrarian Radical Socio-Economic Transformation Model
ALTERNATIVE PAY POINTS PROJECTThe objective of the project is to establish and test pilot two “alternative” pay point models:
Model 1 - Local Purpose Store Pay Point
A local general dealer business located within a community designated as a pay
point and serving as a pay point and “retailer of choice” for social grant
beneficiaries in the community.
The store will sell inter alia, fresh produce, nutritious food and school uniforms
procured locally from small emerging farmers, businesses and co-operatives and
will in its business processes create employment opportunities for youth and
women.

Agrarian Radical Socio-Economic Transformation Model
Model 2 – Co-operative Store Pay Point
• The establishment of a Co-operative Store and Pay Point, where the stokvel
funds have been used as start-up capital. The Co-operative store will
operate along the same lines as the local general dealer store indicated in
model 1.
• The co-operatives will provide stock for the store such as fresh produce and
school uniforms. The store will also provide employment opportunities for
women and the youth.
• Both models must integrate with the DSD Food Security programme and
where possible co-locate with CNDCs.

Agrarian Radical Socio-Economic Transformation Model
DESIRED OUTCOMESThe project seeks through the establishment of these business enterprises and pay points:
• To circulate and keep social grant money within communities;
• To leverage the buying power of social grant beneficiaries;
• To establish new multi-activity enterprises that leverage on the social grant money that enters communities;
• To enable owners of these enterprises to achieve sustainable economic empowerment;
• To increase consumption of locally produced goods and services;
• To support the improvement of the overall socio-economic level of under-resourced communities;
• To promote SASSA pay points as a vehicle to assist in creating decent employment and reducing poverty through income-generating activities;
• To assist with home deliveries of social grants in the future;
• To enhance the capacity of co-operatives and small businesses;
• To promote employment opportunities for youth and women.

Agrarian Radical Socio-Economic Transformation Model
SUPPLY CALCULATION FOR VEGETABLES

Agrarian Radical Socio-Economic Transformation Model
Supply Calculation
• District are grouped in clusters, taking account their
location from a logistical and managerial point of view.
• The calculated area is increased by 15%.
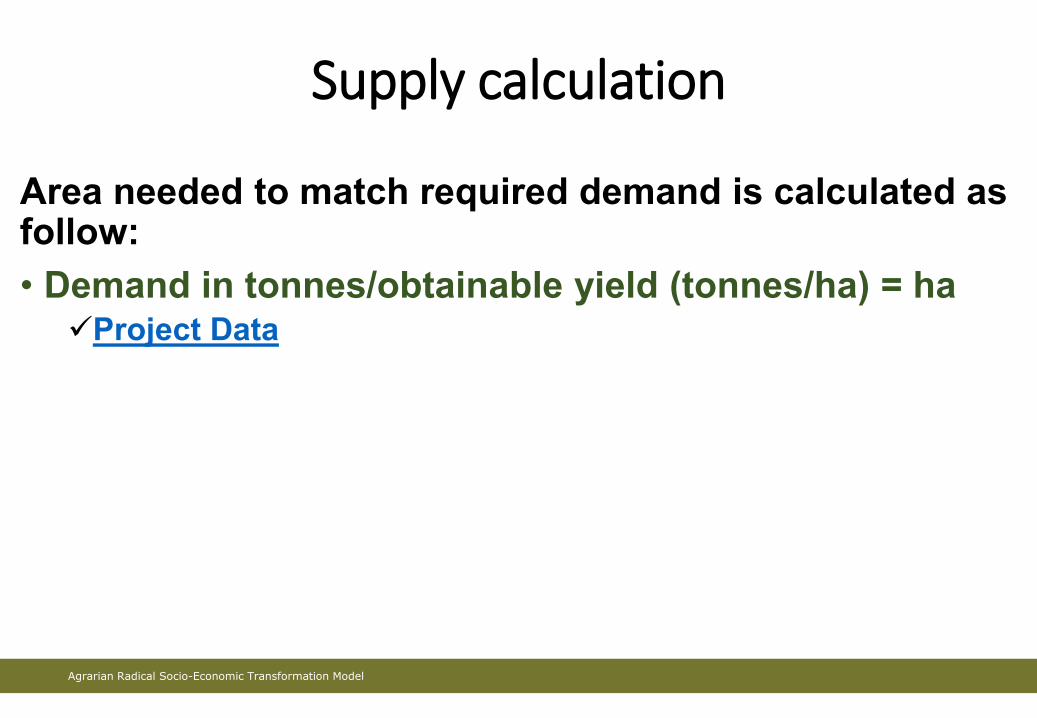
Agrarian Radical Socio-Economic Transformation Model
Supply calculation
Area needed to match required demand is calculated as follow:
• Demand in tonnes/obtainable yield (tonnes/ha) = ha Project Data
Agrarian Radical Socio-Economic Transformation Model
Cluster Of Projects, Famers, Wards And Inkosi
Cluster DistrictNumber of
projects
Number of
farmers Number of wards Number of Inkosi
Cluster 1
Umkhanyakude 67 411 15 5
Uthungulu 261 6844 27 32
Zululand 64 1799 19 28
Total 392 9054 61 65
Cluster 2
Ilembe 203 2942 21 46
eThekwini North 168 1134 36 35
eThekwini South 92 737 10 9
Ugu 55 816 15 22
Total 518 5629 82 112
Cluster 3Harry Gwala 89 551 21 26
Umgungundlovu 147 700 14 26
Total 236 1251 35 52
Cluster 4
Amajuba 71 585 25 8
Umzinyathi 157 2532 16 14
Uthukela 49 0 18 0
Total 277 3117 59 22
Grand Total 1423 19051 237 251

Agrarian Radical Socio-Economic Transformation Model
Land (ha) needed to match supply per commodity
Cluster DistrictOnion Cabbage Swiss chard Carrot
Pumpkin/Butter
nutMix Veg Tomatoes Grand Total
t1) ha2) t1) ha t ha t1) ha t1) ha t1) ha t1) ha t1) ha
Cluster 1
Umkhanyakude 454 21 726 14 726 42 662 25 610 35 610 23 454 9 4242 169
Uthungulu 480 22 768 15 768 44 698 27 640 37 640 25 480 9 4473 178
Zululand 518 24 828 16 828 48 754 29 694 40 694 27 518 10 4834 193
Total 1451 67 2322 45 2322 134 2114 81 1944 112 1944 75 1451 28 13550 540
Cluster 2
Ilembe 305 14 487 9 487 28 442 17 406 23 406 16 305 6 2838 113
eThekwini North 468 22 748 14 748 43 673 26 611 35 611 23 468 9 4325 172
eThekwini South 262 12 419 8 419 24 374 14 337 19 337 13 262 5 2410 96
Ugu 352 16 563 11 563 32 514 20 474 27 474 18 352 7 3289 131
Total 1386 64 2217 42 2217 127 2003 77 1827 105 1827 70 1386 27 12862 512
Cluster 3Harry Gwala 284 13 454 9 454 26 408 16 371 21 371 14 284 5 2625 104
Umgungundlovu 356 16 570 11 570 33 515 20 471 27 471 18 356 7 3308 132
Total 640 29 1023 20 1023 59 923 35 842 48 842 32 640 12 5933 236
Cluster 4
Amajuba 196 9 313 6 313 18 257 10 257 15 257 10 196 4 1787 71
Umzinyathi 339 16 542 10 542 31 491 19 449 26 449 17 339 6 3151 125
Uthukela 366 17 585 11 585 34 530 20 485 28 485 19 366 7 3400 135
Total 900 41 1440 28 1440 83 1278 49 1190 68 1190 46 900 17 8339 332
Grand Total 4377 201 7003 134 7003 403 6318 242 5803 334 5803 222 4377 84 40683 1620
Agrarian Radical Socio-Economic Transformation Model
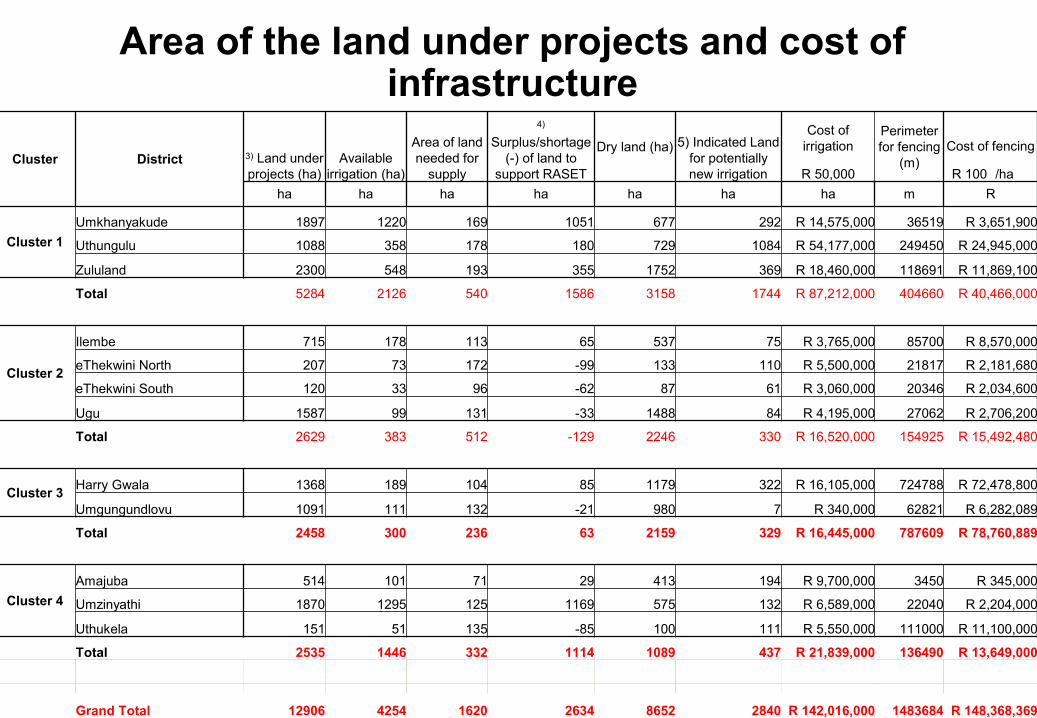
Area of the land under projects and cost of infrastructure
Cluster District 3) Land under
projects (ha)
Available
irrigation (ha)
Area of land
needed for
supply
4)
Surplus/shortage
(-) of land to
support RASET
Dry land (ha) 5) Indicated Land
for potentially
new irrigation
Cost of
irrigationPerimeter
for fencing
(m)
Cost of fencing
R 50,000 R 100 /ha
ha ha ha ha ha ha ha m R
Cluster 1
Umkhanyakude 1897 1220 169 1051 677 292 R 14,575,000 36519 R 3,651,900
Uthungulu 1088 358 178 180 729 1084 R 54,177,000 249450 R 24,945,000
Zululand 2300 548 193 355 1752 369 R 18,460,000 118691 R 11,869,100
Total 5284 2126 540 1586 3158 1744 R 87,212,000 404660 R 40,466,000
Cluster 2
Ilembe 715 178 113 65 537 75 R 3,765,000 85700 R 8,570,000
eThekwini North 207 73 172 -99 133 110 R 5,500,000 21817 R 2,181,680
eThekwini South 120 33 96 -62 87 61 R 3,060,000 20346 R 2,034,600
Ugu 1587 99 131 -33 1488 84 R 4,195,000 27062 R 2,706,200
Total 2629 383 512 -129 2246 330 R 16,520,000 154925 R 15,492,480
Cluster 3Harry Gwala 1368 189 104 85 1179 322 R 16,105,000 724788 R 72,478,800
Umgungundlovu 1091 111 132 -21 980 7 R 340,000 62821 R 6,282,089
Total 2458 300 236 63 2159 329 R 16,445,000 787609 R 78,760,889
Cluster 4
Amajuba 514 101 71 29 413 194 R 9,700,000 3450 R 345,000
Umzinyathi 1870 1295 125 1169 575 132 R 6,589,000 22040 R 2,204,000
Uthukela 151 51 135 -85 100 111 R 5,550,000 111000 R 11,100,000
Total 2535 1446 332 1114 1089 437 R 21,839,000 136490 R 13,649,000
Grand Total 12906 4254 1620 2634 8652 2840 R 142,016,000 1483684 R 148,368,369

Agrarian Radical Socio-Economic Transformation Model
Example of production plan
Size of total land 193.7
Size of irragable land 60.2
Expected yield 70.0
Jan Feb Mar Apr May Jun Jul Aug Sep Oct Nov Dec Total
Mean rainfall (mm) 119 101 103 52 44 17 18 34 67 88 109 108 860.0
Mean daily temperature (°C)
Minimum 15.9 16.0 15.0 12.1 8.8 5.8 5.8 7.4 9.8 11.4 13.2 14.9 11.3
Maximum 27.1 27.4 26.5 26.3 23.6 21.5 21.5 22.3 23.5 24.2 25.2 26.5 24.6
Mean 21.5 21.7 20.7 18.7 16.2 13.7 13.7 14.8 16.6 17.8 19.2 20.7 17.9
CROP
2.5 2.5 2.5 2.5 2.5 2.5 15.0
2.5 2.5 2.5 2.5 2.5 2.5 15.0
Total planting monthly ha 0.0 0.0 2.5 2.5 2.5 2.5 2.5 2.5 0.0 0.0 0.0 0.0 15.0
Total planted cumulative 0.0 0.0 2.5 5.0 7.5 10.0 12.5 15.0 15.0 15.0 15.0 15.0
Total harvesting 0.0 0.0 0.0 0.0 0.0 2.5 2.5 2.5 2.5 2.5 2.5 0.0 15.0
Total harvest cumulative 0.0 0.0 0.0 0.0 0.0 2.5 5.0 7.5 10.0 12.5 15.0 15.0
Quarterly planted
Quarterly harvested
Expected yield (tonnes) 0.0 0.0 0.0 0.0 0.0 175.0 175.0 175.0 175.0 175.0 175.0 0.0 1050
Planting
Harvesting
Cabbage
tonnes
0.0 2.5 7.5 5.0
CLIMATE DATAMONTH
2.5 7.5 5.0 0.0

Agrarian Radical Socio-Economic Transformation Model
Analysed commodities
Maize & Dry Beans

Agrarian Radical Socio-Economic Transformation Model
Crop Production Planned Support for 2016/17

Agrarian Radical Socio-Economic Transformation Model
Demand and Supply analyses for maize and sugar beans
Product/Crop
Demand-DSD
( tonnes)Total Demand
tons per yearPotential
yield t/ha
Area
needed in
ha
Crop
production
plan for
2016/17
SRD Pay point
Samp/Maize 806 806 4 1257
Mealie Meal /Maize 806 37771 38577 4 10353 10053
Sugar Beans 402 18885 19287 1.5 12858 5883
Total area needed (ha) for grain crop supply 29194

Agrarian Radical Socio-Economic Transformation Model
Analysed commodities
Layers - Eggs

Agrarian Radical Socio-Economic Transformation Model
Demand and Supply Analyses for DOH
DistrictNumbers of beds per
District
Number of eggs
per patient per
week
Number of eggs requirement
per year
Number of Layers required to
supply eggs
Umkhanyakude 1220 163440 227
Ugu 1324 168848 246
Amajuba 1407 173164 261
Uthukela 919 147788 171
Umzinyathi 1127 158604 209
Zululand 1559 181068 290
Ilembe 925 148100 172
Umgungundlovu 3513 1182676 652
Uthungulu 2120 1110240 394
Sisonke 1213 163076 225
Ethekwini 8982 1467064 1668
KZN Total 24309 111264068 4515
Agrarian Radical Socio-Economic Transformation Model
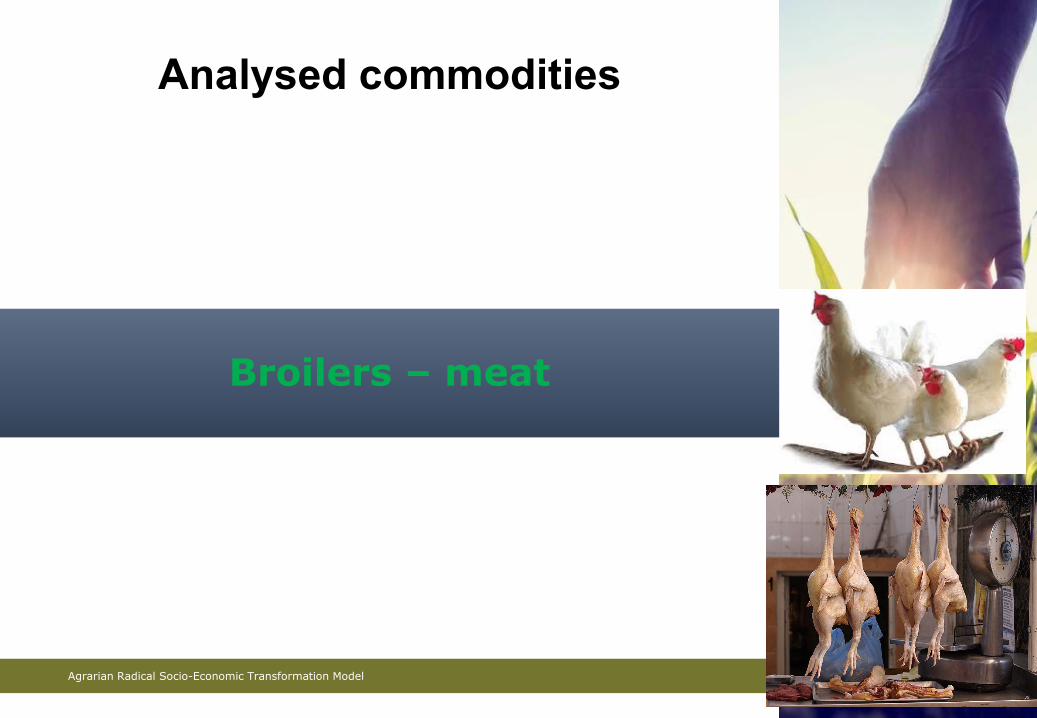
Analysed commodities
Broilers – meat
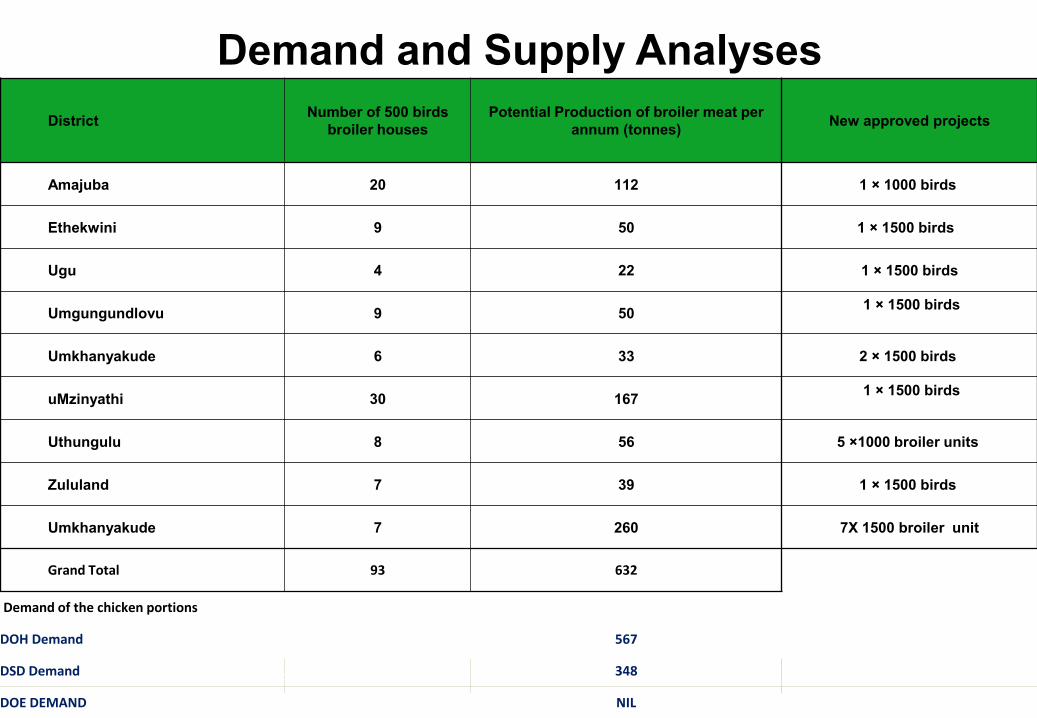
Agrarian Radical Socio-Economic Transformation Model
Demand and Supply Analyses
DistrictNumber of 500 birds
broiler houses
Potential Production of broiler meat per
annum (tonnes)New approved projects
Amajuba 20 112 1 × 1000 birds
Ethekwini 9 50 1 × 1500 birds
Ugu 4 22 1 × 1500 birds
Umgungundlovu 9 501 × 1500 birds
Umkhanyakude 6 33 2 × 1500 birds
uMzinyathi 30 1671 × 1500 birds
Uthungulu 8 56 5 ×1000 broiler units
Zululand 7 39 1 × 1500 birds
Umkhanyakude 7 260 7X 1500 broiler unit
Grand Total 93 632
Demand of the chicken portions
DOH Demand 567
DSD Demand 348
DOE DEMAND NIL
Agrarian Radical Socio-Economic Transformation Model
Analysed commodities
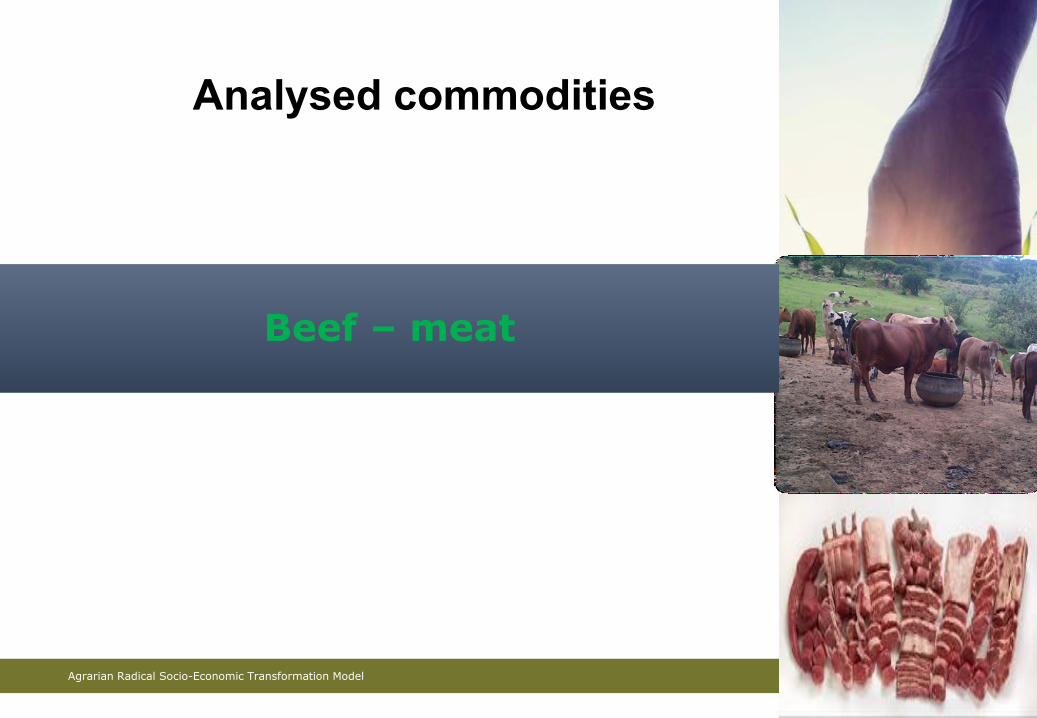
Beef – meat
Agrarian Radical Socio-Economic Transformation Model
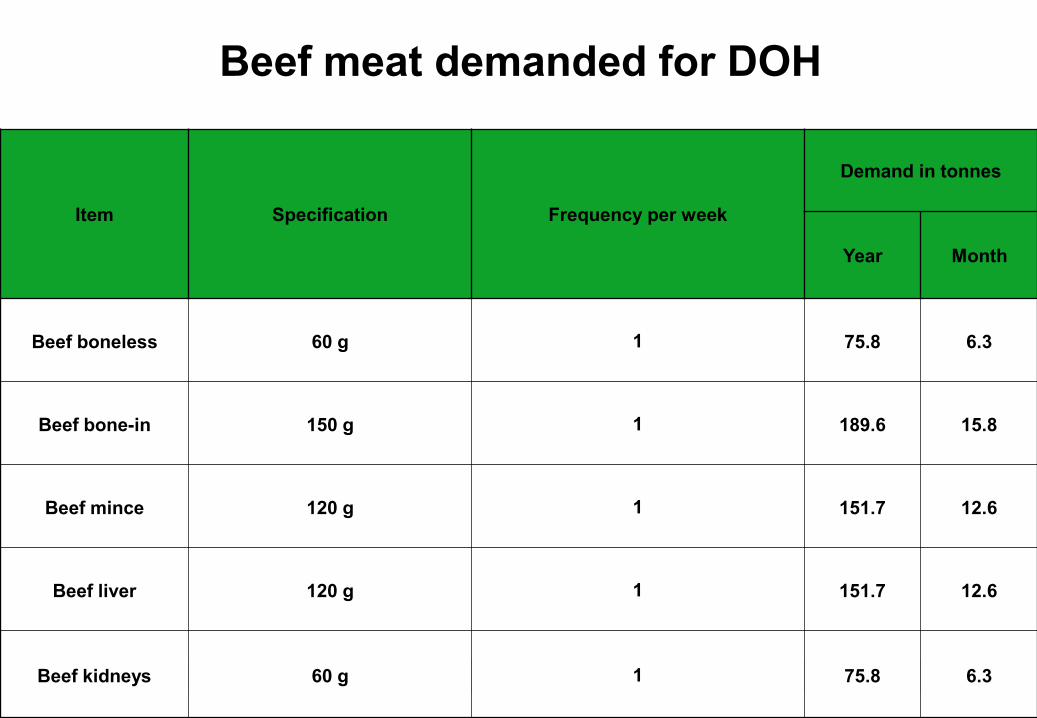
Beef meat demanded for DOH
Item Specification Frequency per week
Demand in tonnes
Year Month
Beef boneless 60 g 1 75.8 6.3
Beef bone-in 150 g 1 189.6 15.8
Beef mince 120 g 1 151.7 12.6
Beef liver 120 g 1 151.7 12.6
Beef kidneys 60 g 1 75.8 6.3

Agrarian Radical Socio-Economic Transformation Model
Beef meat supply
• The number of cattle in the communal areas of KZN isapproximate of 1,532 million (contributing 26.9% in RSA)
• Sufficient supply
• Problem with off take from communal land due to a lack ofmarket infrastructure in the communal areas

Agrarian Radical Socio-Economic Transformation Model
Summary of demand-supply analysis
Commodity Demand Supply Comment
Tonnage
required
Related Area and
Infrastructure
Capacity
Currently available land and
output of commodity using
current/planed infrastructure
Vegetables 43300 tonnes 1620 ha irrigable land 4254 ha of irrigable landOver supply, more market
is required
Maize 39383 tonnes 11610 ha (White maize) 10053 haDeficit, more land is
required
Sugar beans 19287 tonnes 17583 ha 5883 ha
Deficit more land is
required
Eggs 1.26 mill3 house of 2500
layers per unit10,2 mill
Over supply, more market
is required
Broiler meat 905 tonnes8 houses of 10000
birds778 tonnes
Deficit ,more throughput
is required
Beef meat664 tonnes
(different cuts)
1,532 million cattle
(unlock market
potential)
over supply
Over supply ,more market
is required
Agrarian Radical Socio-Economic Transformation Model
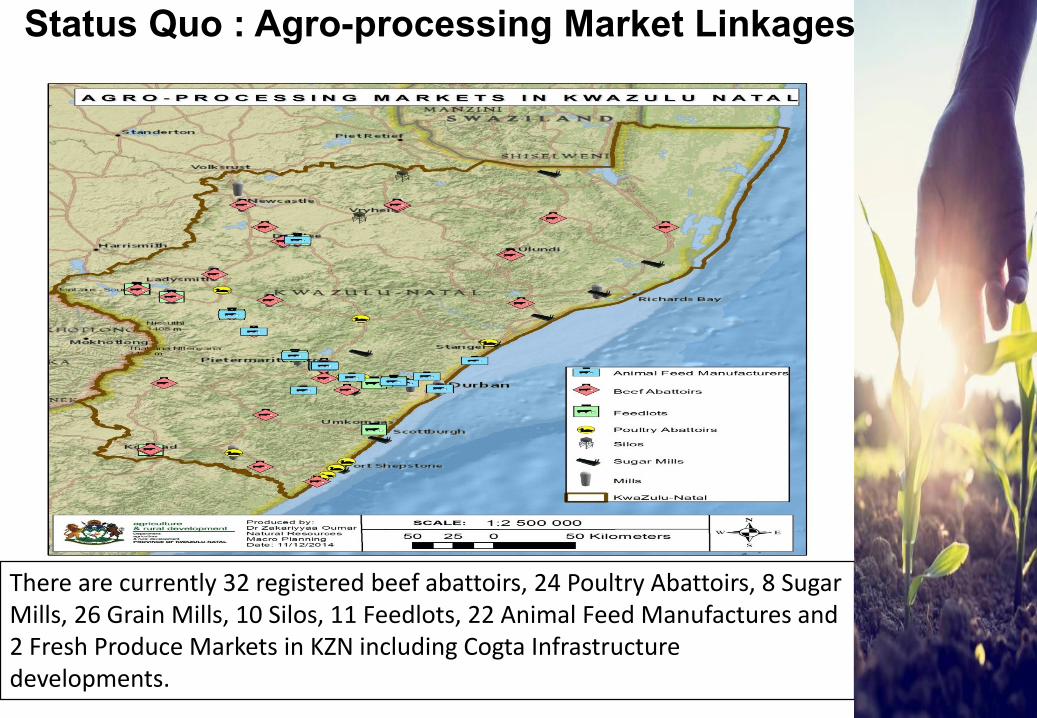
Status Quo : Agro-processing Market Linkages
There are currently 32 registered beef abattoirs, 24 Poultry Abattoirs, 8 Sugar Mills, 26 Grain Mills, 10 Silos, 11 Feedlots, 22 Animal Feed Manufactures and 2 Fresh Produce Markets in KZN including Cogta Infrastructure developments.

Funded projects
District & Local
Municipality Project Name/ Facility Ownership Nature of Business
King Cetshwayo, uMhlatuze LM uThungulu Fresh Produce
Market uThungulu DM Fresh Produce (Vegetables)
King Cetshwayo, Nkandla LM Nkandla Packhouse Qedisimo Cooperative Fresh Produce (Vegetables) and storage
Harry Gwala, uBuhlebezwe LM Ixopo Farmers Market Harry Gwala DMFresh Produce (Vegetables) and storage
and related activities
uMgungundlovu, uMsunduzi LM Mkhondeni Fresh Produce
Market uMsunduzi LM
Trading of Fresh Produce (Fruits &
Vegetables) and storage and related
activities in the fresh produce value chain.
uMgungundlovu, Mpendle LM Mpendle Maize Mill Mpende LMProcessing of Maize Mill & storage
facilities.
uMkhanyakude, Jozini LMJozini Value Adding Centre
(JVAC)Jozini LM
Fresh Produce (Vegetables) and storage
and related activities
uMkhanyakude, Jozini LMMnothophansi Ndumo B Maize
MillMnothophansi Cooperative
Processing of Maize Mill & storage
facilities.
Government Funded Market Infrastructure
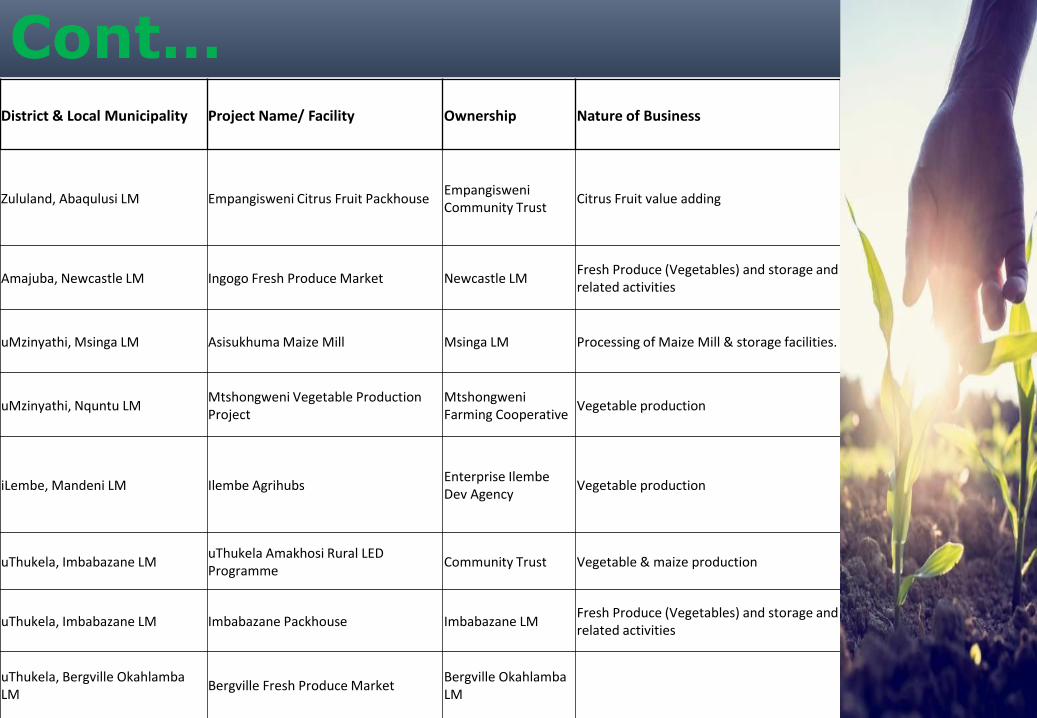
District & Local Municipality Project Name/ Facility Ownership Nature of Business
Zululand, Abaqulusi LM Empangisweni Citrus Fruit PackhouseEmpangisweni Community Trust
Citrus Fruit value adding
Amajuba, Newcastle LM Ingogo Fresh Produce Market Newcastle LMFresh Produce (Vegetables) and storage and related activities
uMzinyathi, Msinga LM Asisukhuma Maize Mill Msinga LM Processing of Maize Mill & storage facilities.
uMzinyathi, Nquntu LMMtshongweni Vegetable Production Project
Mtshongweni Farming Cooperative
Vegetable production
iLembe, Mandeni LM Ilembe AgrihubsEnterprise Ilembe Dev Agency
Vegetable production
uThukela, Imbabazane LMuThukela Amakhosi Rural LED Programme
Community Trust Vegetable & maize production
uThukela, Imbabazane LM Imbabazane Packhouse Imbabazane LMFresh Produce (Vegetables) and storage and related activities
uThukela, Bergville Okahlamba LM
Bergville Fresh Produce MarketBergville Okahlamba LM
Cont…
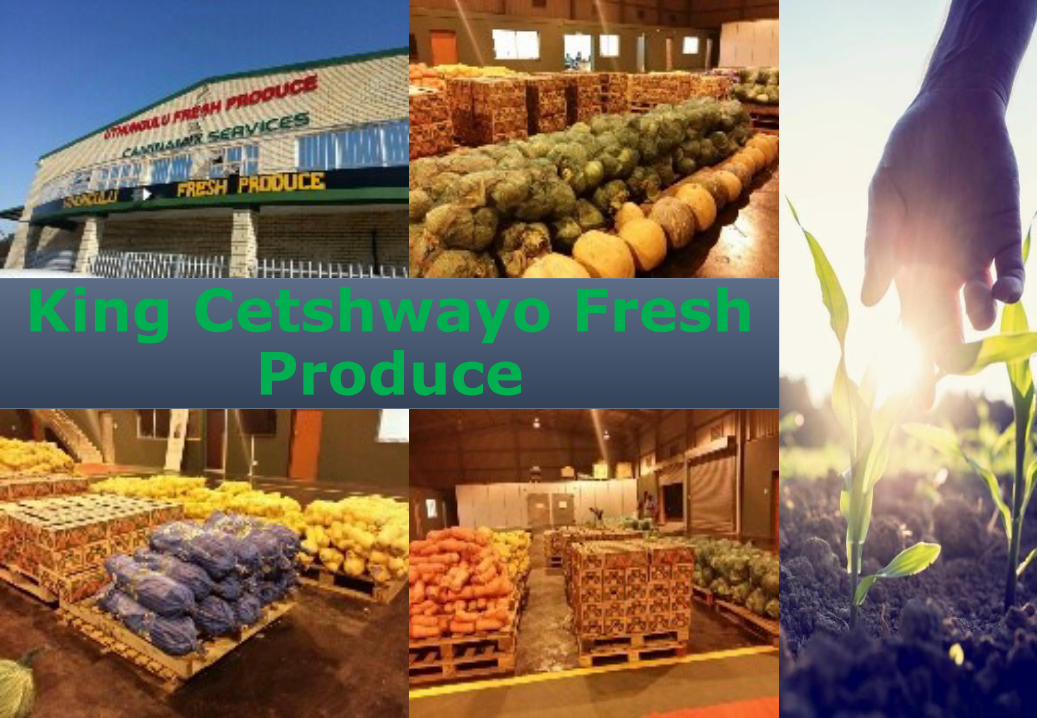
King Cetshwayo Fresh Produce

Ixopo Fresh Produce

76
Jozini Value Adding Centre

UMkhondeni Fresh Produce
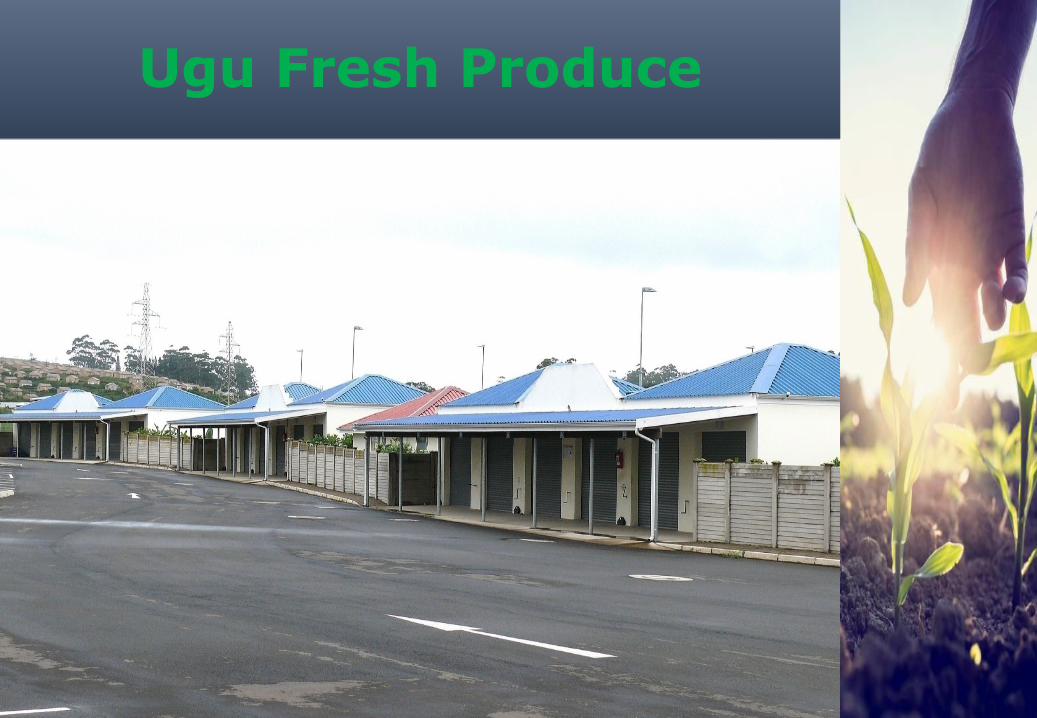
Ugu Fresh Produce

UMHLABUYALINGANA MARULA PACKER HOUSE
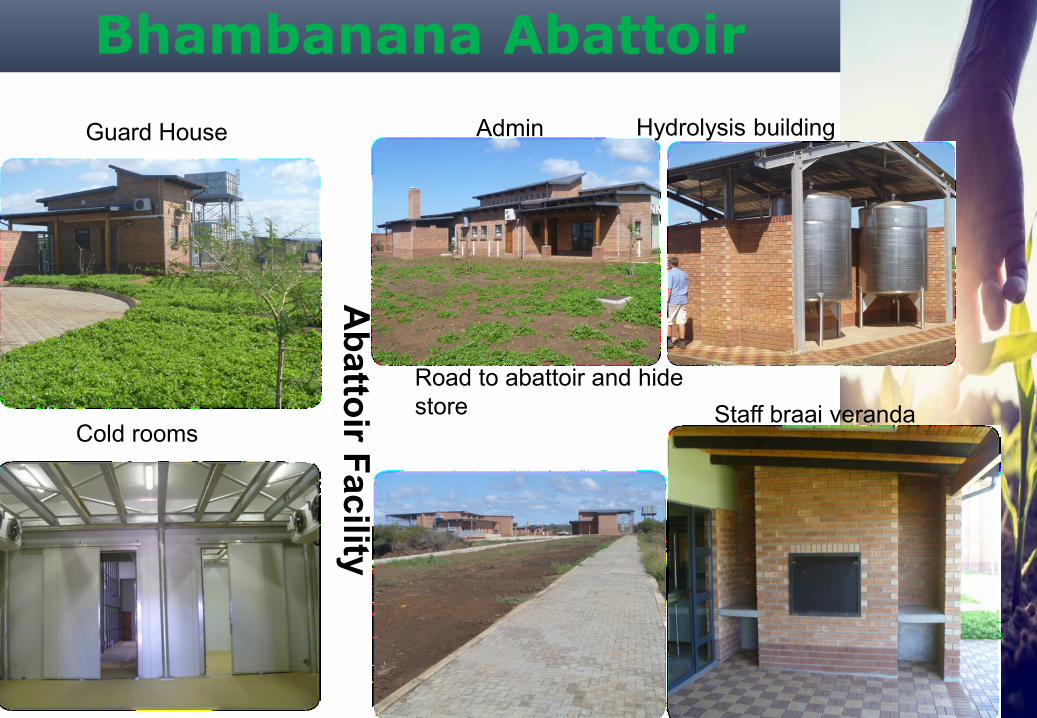
Guard House Admin Hydrolysis building
Cold rooms
Road to abattoir and hide
store
Ab
atto
ir Fa
cility
Bhambanana Abattoir
Staff braai veranda

Agrarian Radical Socio-Economic Transformation ModelAgrarian Radical Socio-Economic Transformation Model 81
7. Opportunities for Jobs Creation

BACKWARD AND FORWARD LINKAGES OF JOB CREATION
COMMODITY PRIMARY SECONDARY TERTIARY
1. MAIZE 1250-JOBS/200 000 HA
(LABOR/FIELD WORKERS)
250 JOBS (MILLS) 500 (Retail/Chain Stores)
2. PROCESSING 10-JOBS per miller X 11 (Floor
Workers)
275 pp (Hand-Man & Operators) 10 truck drivers
3. STORAGE &
HANDLING
100 workers
Total 1 360 525 610
The expected jobs that will be created from the forward and backward linkages of
maize value chain is 2 495 jobs.

Agrarian Radical Socio-Economic Transformation ModelAgrarian Radical Socio-Economic Transformation Model 83
8. Government Programme Alignment
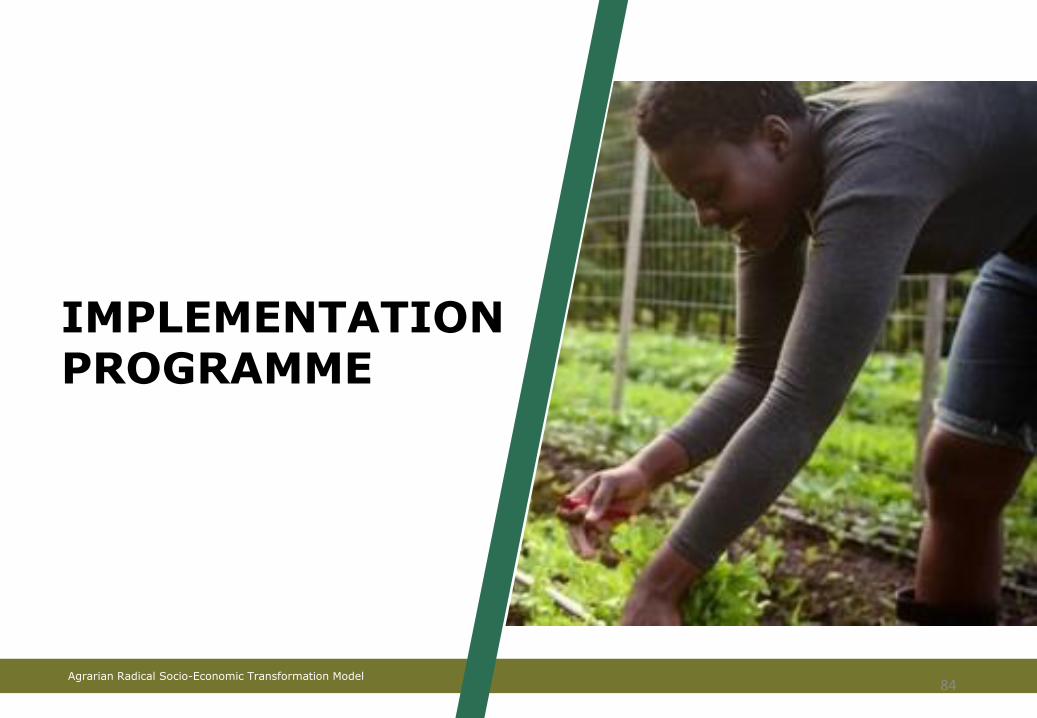
Agrarian Radical Socio-Economic Transformation Model84
IMPLEMENTATIONPROGRAMME

Agrarian Radical Socio-Economic Transformation Model
Operational Model
• The rollout of RASET programme will be focusing in all districts and
Ethekwini Metro will be responsible for coordinating functions in the
province to ensure the succesfull implementation of the programme.
• Ethekwini is leading with the development of an Incubator (Mega park)
which will serve as nucleus for Radical Agrarian Socio-Economic
Transformation with the 10 district feeding into this mega park.
• Ethekwini Metro Exco has allocated a budget of R630 million for
infrastructure and farmer support development
• A space of 28 000 square meter will be rehabilitated in Durban fresh
produce market
• District agri parks are in the process of being developed to feed into this
process.
85

Agrarian Radical Socio-Economic Transformation Model
Government Programme Alignment
Debt equity trade finance
Technical support
Debt equity structured
investment and technical support
Debt equity and technical support, Paypoint
technology
Incubator manufacturing grant funding international
network
Sanctioning Authority & Sponsoring
Agency
Business Incubator
Food Value Chain
intervention
Rxx Food spend linked
to emergency relief
Rxx Food spend linked
to emergency relief
Rxx Children School
Feeding scheme
Rxx Children School
Feeding scheme
Rxx Hospital food SupplyRxx Hospital food Supply
Rxx Inputs & Technical Support
Rxx Inputs & Technical Support
Rxx Access to Land, technical sfnupport and
Recap investment Grants Agri Parks
Rxx Access to Land, technical sfnupport and
Recap investment Grants Agri Parks
Rxx Technical support,
Investment grants
Rxx Technical support,
Investment grants
Rxx Access to Finance
Investment & Business Support
Training & Capacity Building
Drives set aside for the benefit of SMMEs/Coops
(Youth & Women-owned)
Rxx Access to Finance
Investment & Business Support
Training & Capacity Building
Drives set aside for the benefit of SMMEs/Coops
(Youth & Women-owned)
Rxx Training and Development
Grants
Rxx Training and Development
Grants
Technical Support and Poverty
Alleviation Grants
Technical Support and Poverty
Alleviation Grants
Infrastructure Port access land and
logistics
Infrastructure Port access land and
logistics
Agri Park
Agri Park
Agri Park
Agri Park
AgriPark
D
E
M
A
N
D
F
A
C
I
L
I
T
A
T
I
O
N D
F
I
s
Metro
Agri Park
86
Supply SideFarmers
(Rural and Commercial

Agrarian Radical Socio-Economic Transformation ModelAgrarian Radical Socio-Economic Transformation Model 87
9. Action Plan
Agrarian Radical Socio-Economic Transformation ModelAgrarian Radical Socio-Economic Transformation Model
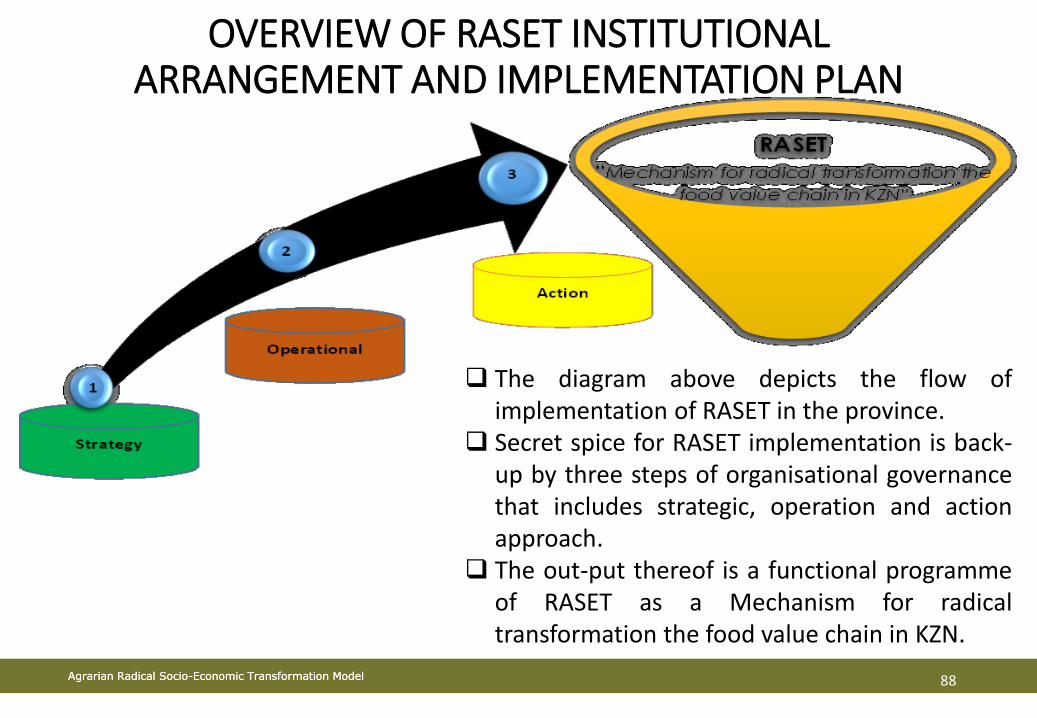
OVERVIEW OF RASET INSTITUTIONAL ARRANGEMENT AND IMPLEMENTATION PLAN
88
The diagram above depicts the flow ofimplementation of RASET in the province.
Secret spice for RASET implementation is back-up by three steps of organisational governancethat includes strategic, operation and actionapproach.
The out-put thereof is a functional programmeof RASET as a Mechanism for radicaltransformation the food value chain in KZN.

Agripark MMs/FP
DDAs
RASET Prov..
Technical
DAMC
District Mayor
MECs-DARD & Edtea
Premier
Ministers DRDLR –Presidency
Political
RASET REPORT STRUCTURE
Agrarian Radical Socio-Economic Transformation ModelAgrarian Radical Socio-Economic Transformation Model
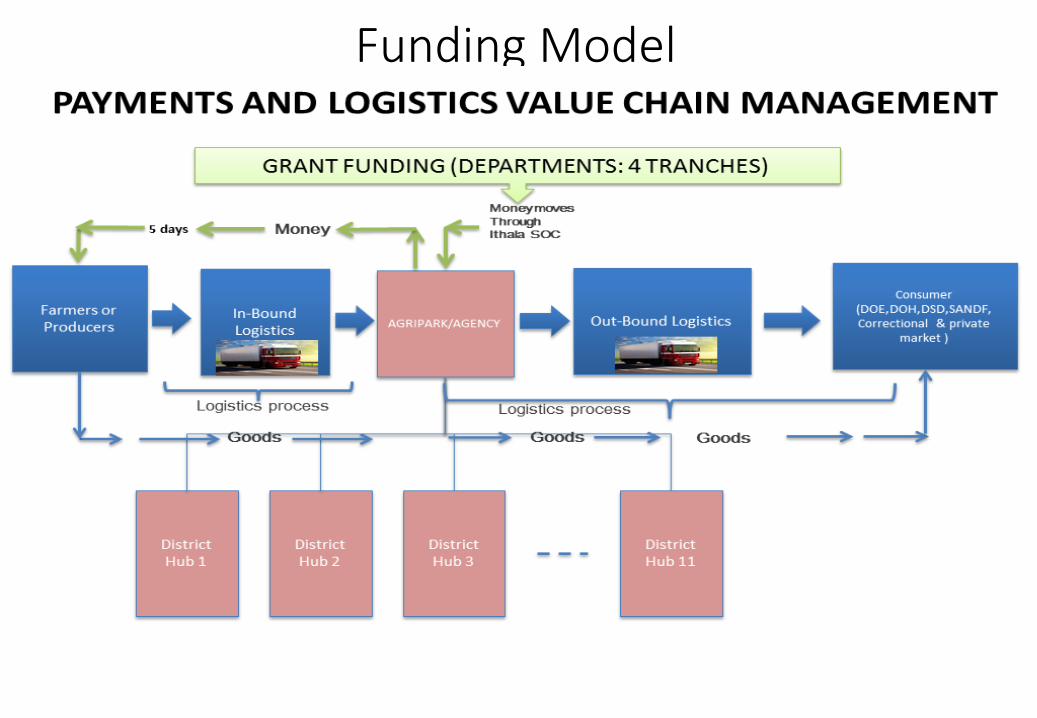
Funding Model
90

Agrarian Radical Socio-Economic Transformation Model
FARMER SUPPORT PACKAGES
1. Food Security Farm for household consumption and sell the surplus
2. Subsistence FarmerFarms to sell and consume some produce
3. Emerging/ SmallholderProduces for the market on an ongoing basis
4. Commercial Farmer
Practices farming with a sole intention of making a profit
Agrarian Radical Socio-Economic Transformation Model
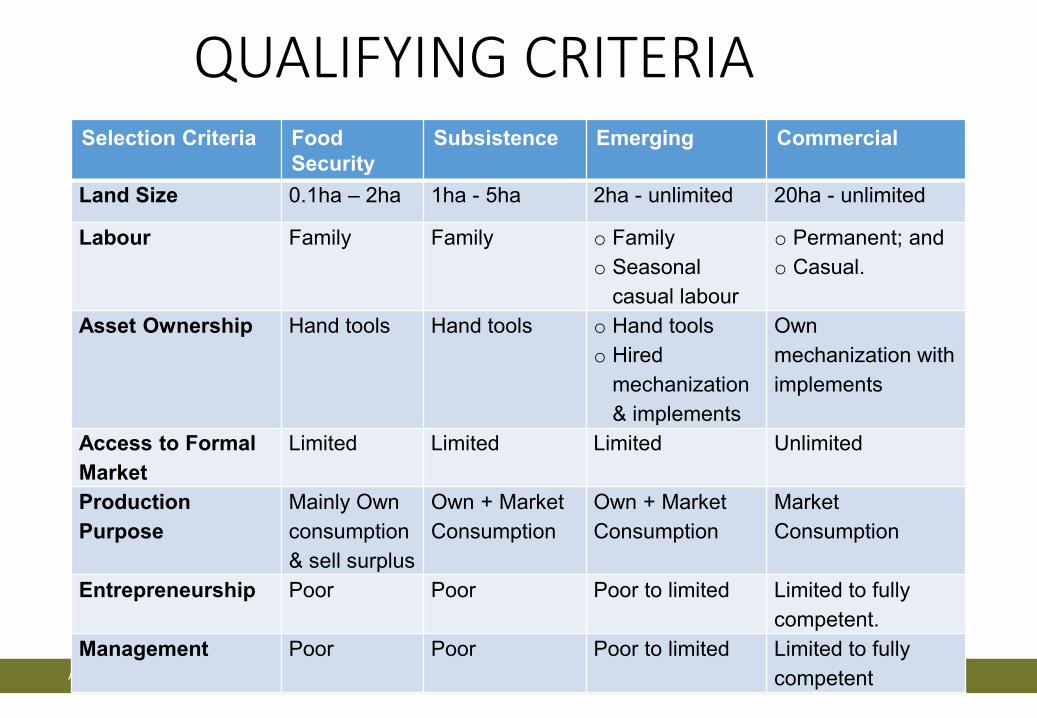
QUALIFYING CRITERIASelection Criteria Food
Security
Subsistence Emerging Commercial
Land Size 0.1ha – 2ha 1ha - 5ha 2ha - unlimited 20ha - unlimited
Labour Family Family o Family
o Seasonal
casual labour
o Permanent; and
o Casual.
Asset Ownership Hand tools Hand tools o Hand tools
o Hired
mechanization
& implements
Own
mechanization with
implements
Access to Formal
Market
Limited Limited Limited Unlimited
Production
Purpose
Mainly Own
consumption
& sell surplus
Own + Market
Consumption
Own + Market
Consumption
Market
Consumption
Entrepreneurship Poor Poor Poor to limited Limited to fully
competent.
Management Poor Poor Poor to limited Limited to fully
competent

Agrarian Radical Socio-Economic Transformation Model
FARMER SUPPORT PACKAGES1. FOOD SECURITY PACKAGE
Fencing Complete fencing for the perimeter of the project will be
provided according to approved specifications
Irrigation Projects of less than 1ha will be supplied with watering cans
Projects larger than 1ha to a maximum project size of 2ha
will be funded for a complete irrigation system.
Implements/
Tools
Projects shall receive hand tools as per the support package
OR mechanization services
Production
Inputs
Seed scoops and fertilizer scoops will apply to lands less than
0.5Ha
Areas between 0.5-2.0 ha will receive vegetable inputs
according to DARD COMBUD recommendations.
Market Access Supported with access to domestic government and private
sector market.

Agrarian Radical Socio-Economic Transformation Model
FARMER SUPPORT PACKAGES2. SUBSISTENCE FARMER PACKAGE
Fencing Complete fencing for the perimeter of the project will be
provided according to approved specifications
Irrigation Projects of less than 1ha will be supplied with watering cans
Projects larger than 1ha to a maximum project size of 5ha
will be funded for a complete irrigation system.
Implements/
Tools
Package consists of hand tools as per the support package or mechanization services
Production
Inputs
Projects larger than 1ha to a maximum project size of 5ha will receive vegetable inputs according to DARD COMBUD recommendations.
Market Access Supported with access to domestic government and private
sector market.

Agrarian Radical Socio-Economic Transformation Model
FARMER SUPPORT PACKAGES3. SMALLHOLDER FARMER PACKAGE
Fencing Project will be fenced according to approved specifications
• Private farms can also be funded
• Fixed improvement of LRAD farms are the responsibility of
DRDLR
Irrigation • Projects will be funded for a complete irrigation system as
per the recommendation of the funder
• Private farms can also be funded
• Fixed improvement of LRAD farms are the responsibility of
DRDLR
Implements Package consists of mechanization services or tractor(s) with implement(s) as per the support package
Inputs Projects & farms will receive inputs as per DARD COMBUD
Market Access Access to domestic and international markets

Agrarian Radical Socio-Economic Transformation Model
FARMER SUPPORT PACKAGES4. COMMERCIAL FARMER PACKAGE
Fencing A commercial farmers can only be considered for funding support provided that:• A bankable business plan is developed and shared with
DARD local office
• DARD local and district office is in support of the funding requested
• The business plan is approved by the Provincial Steering Committee
• Funding support is provided as per the approved business plan and recommendations of the Provincial Steering Committee
Irrigation
Implements
Inputs
Market Access Access to domestic and international markets

Agrarian Radical Socio-Economic Transformation Model
FOOD SECURITY PACKAGE
Items Food Security ≤ 0.5ha Food Security Between 0.5ha and 1ha
Infrastructure 67,500.00 115,000.00
Tools 935.00 1,870.00
Seeds 198.00 30,000.00
Fertilizer 180.00 24,000.00
Total Package68 813.00 170,870.00

Agrarian Radical Socio-Economic Transformation Model
FOOD SECURITY PACKAGE –LAND LESS THAN 0.5ha
NB: Service items (which are not tangible) such as transport service and training services are not included above
ITEM UNIT
SIZE
UNIT QUANTITY PRICE/UNIT (R) TOTAL PRICE (R)
Fencing 1 Km 0.3 100,000.00 30,000.00
Irrigation 1 Ha 0.5 75,000.00 37,500.00
TOTAL INFRASTRUCTURE 67,500.00
Hand Spade 1 each 1 195.00 195.00
Hand Fork 1 each 1 235.00 235.00
Watering can plastic 10lt can 1 145.00 145.00
Hand Weeder 1 each 1 70.00 70.00
Hoe flat 1 each 1 138.00 138.00
Hoe handle 1 each 1 82.00 82.00
Crate 1 each 1 70.00 70.00
TOTAL TOOLS 935.00
Seeds 20g sachet 9 22.00 198.00
TOTAL SEEDS 198.00
2:3:4 (30) Zn 5 kg 1 90.00 90.00
LAN 5 kg 1 90.00 90.00
TOTAL FERTILIZER 180.00
TOTAL PACKAGE 68 813.00

Agrarian Radical Socio-Economic Transformation Model
FOOD SECURITY PACKAGE –LAND BETWEEN 0.5ha & 1ha
NB: Service items (which are not tangible) such as transport service and training services are not included above
SUBSISTENCE FARMER PACKAGE -LAND BETWEEN 0.5ha AND 1ha
ITEM UNIT SIZE UNIT QUANTITY PRICE/ UNIT (R) TOTAL PRICE (R)
Fencing 1 Km 0.4 100,000.00 40,000.00
Irrigation 1 Ha 1 75,000.00 75,000.00
TOTAL INFRASTRUCTURE 115,000.00
Hand Spade 1 each 2 195.00 390.00
Hand Fork 1 each 2 235.00 470.00
Watering can plastic 10lt can 2 145.00 290.00
Hand Weeder 1 each 2 70.00 140.00
Hoe flat 1 each 2 138.00 276.00
Hoe handle 1 each 2 82.00 164.00
Crate 1 each 2 70.00 140.00
TOTAL TOOLS 1,870.00
Commodity 1 1 ha 1 15,000.00 15,000.00
Commodity 2 1 ha 1 15,000.00 15,000.00
TOTAL SEEDS 30,000.00
Fertilizer 1 1 ha 1 12,000.00 12,000.00
Fertilizer 2 1 ha 1 12,000.00 12,000.00
TOTAL FERTILIZER 24,000.00
TOTAL PACKAGE 170,870.00

Agrarian Radical Socio-Economic Transformation Model
SUBSISTENCE FARMER PACKAGEItems Subsistence 0.5ha and 1ha Subsistence up to 50ha
Infrastructure 105,000.00 4,550,000.00
Tools 1,870.00 0.00
Mechanization 0.00 150,000.00
Seeds 30,000.00 1,500,000.00
Fertilizer 24,000.00 1,200,000.00
Total Package 160,870.00 7,400,000.00
Agrarian Radical Socio-Economic Transformation Model
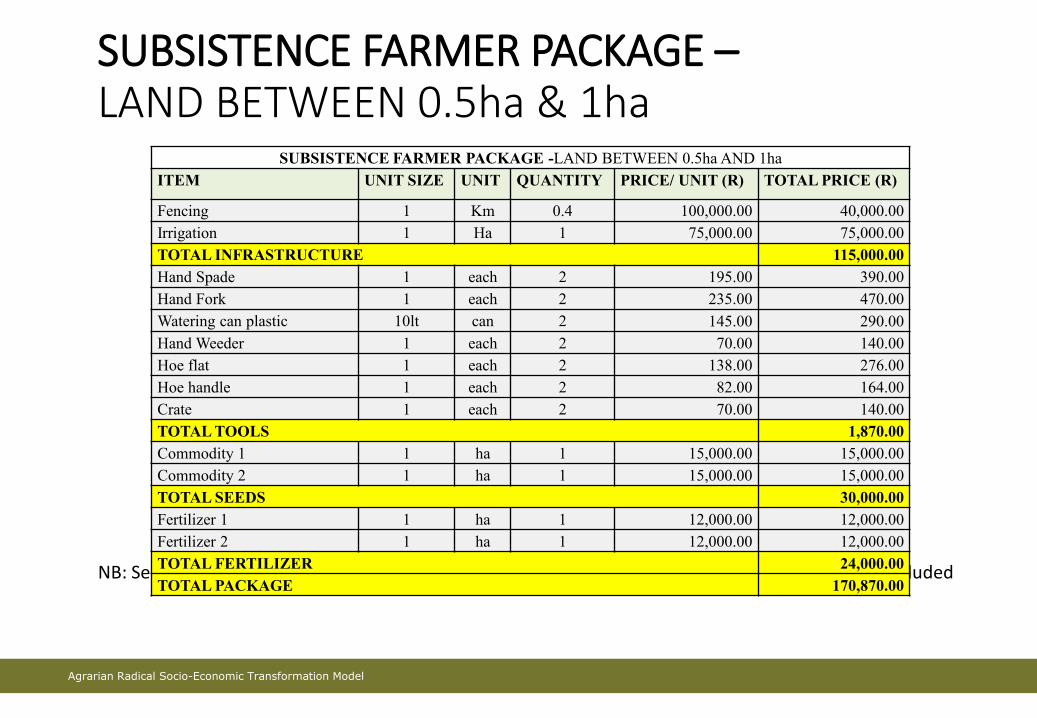
SUBSISTENCE FARMER PACKAGE –LAND BETWEEN 0.5ha & 1ha
NB: Service items (which are not tangible) such as transport service and training services are not included above
SUBSISTENCE FARMER PACKAGE -LAND BETWEEN 0.5ha AND 1ha
ITEM UNIT SIZE UNIT QUANTITY PRICE/ UNIT (R) TOTAL PRICE (R)
Fencing 1 Km 0.4 100,000.00 40,000.00
Irrigation 1 Ha 1 75,000.00 75,000.00
TOTAL INFRASTRUCTURE 115,000.00
Hand Spade 1 each 2 195.00 390.00
Hand Fork 1 each 2 235.00 470.00
Watering can plastic 10lt can 2 145.00 290.00
Hand Weeder 1 each 2 70.00 140.00
Hoe flat 1 each 2 138.00 276.00
Hoe handle 1 each 2 82.00 164.00
Crate 1 each 2 70.00 140.00
TOTAL TOOLS 1,870.00
Commodity 1 1 ha 1 15,000.00 15,000.00
Commodity 2 1 ha 1 15,000.00 15,000.00
TOTAL SEEDS 30,000.00
Fertilizer 1 1 ha 1 12,000.00 12,000.00
Fertilizer 2 1 ha 1 12,000.00 12,000.00
TOTAL FERTILIZER 24,000.00
TOTAL PACKAGE 170,870.00

Agrarian Radical Socio-Economic Transformation Model
SUBSISTENCE FARMER PACKAGE –LAND UP TO 50ha
NB: Service items (which are not tangible) such as transport service and training services are not included above
SUBSISTENCE FARMER PACKAGE -LAND SIZE UP TO 50ha
ITEM UNIT SIZE UNIT QUANTITY PRICE/ UNIT (R) TOTAL PRICE (R)
Fencing 1 Km 8 100,000.00 800,000.00
Irrigation 1 Ha 50 75,000.00 3,750,000.00
TOTAL INFRASTRUCTURE 4,550,000.00
MECHANIZATION SERVICES
Land Preparation 1 ha 50 2,100.00 105,000.00
Planting 1 ha 50 900.00 45,000.00
TOTAL MECHANIZATION SERVICE 150,000.00
SEED
Commodity 1 1 ha 50 15,000.00 750,000.00
Commodity 2 1 ha 50 15,000.00 750,000.00
TOTAL SEEDS 1,500,000.00
FERTILIZER
Fertilizer 1 1 ha 50 12,000.00 600,000.00
Fertilizer 2 1 ha 50 12,000.00 600,000.00
TOTAL FERTILIZER 1,200,000.00
TOTAL PACKAGE 7,400,000.00

Agrarian Radical Socio-Economic Transformation Model
SMALLHOLDER FARMER PACKAGE
Items Smallholder Land Between
2ha to 20ha
Smallholder Land Between
20ha to 50ha
Infrastructure 1,900,000.00 4,550,000.00
Mechanization 60,000.00 830,500.00
Seeds 600,000.00 1,500,000.00
Fertilizer 480,000.00 1,200,000.00
Total Package 3,040,000.00 8,080,500.00
Agrarian Radical Socio-Economic Transformation Model
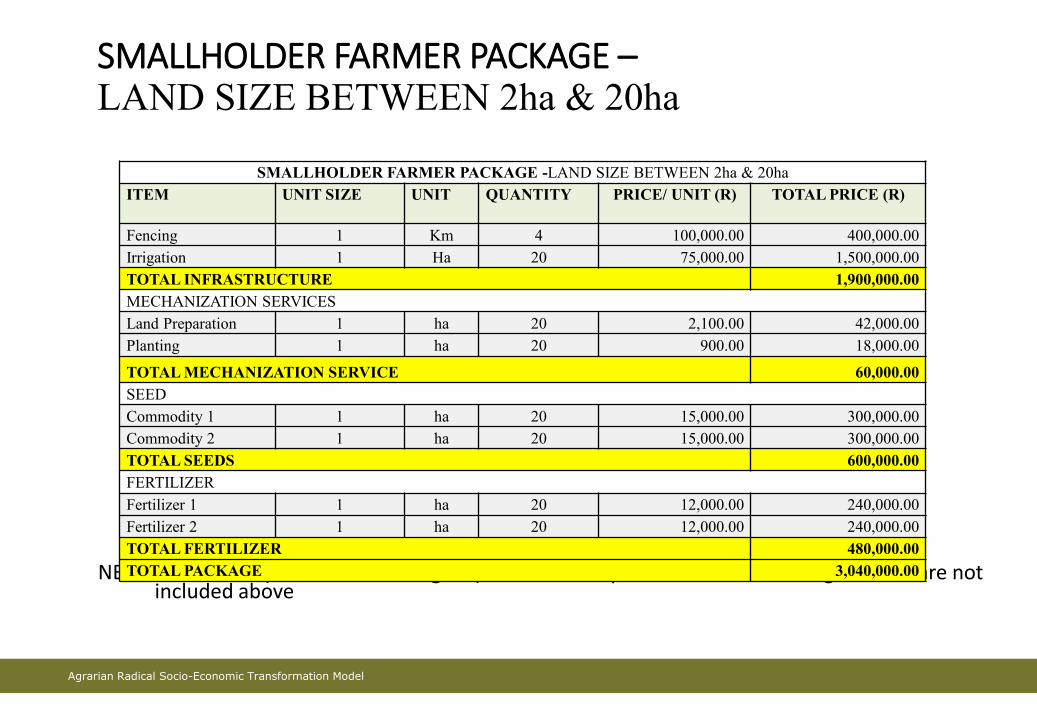
SMALLHOLDER FARMER PACKAGE –LAND SIZE BETWEEN 2ha & 20ha
NB: Service items (which are not tangible) such as transport service and training services are not included above
SMALLHOLDER FARMER PACKAGE -LAND SIZE BETWEEN 2ha & 20ha
ITEM UNIT SIZE UNIT QUANTITY PRICE/ UNIT (R) TOTAL PRICE (R)
Fencing 1 Km 4 100,000.00 400,000.00
Irrigation 1 Ha 20 75,000.00 1,500,000.00
TOTAL INFRASTRUCTURE 1,900,000.00
MECHANIZATION SERVICES
Land Preparation 1 ha 20 2,100.00 42,000.00
Planting 1 ha 20 900.00 18,000.00
TOTAL MECHANIZATION SERVICE 60,000.00
SEED
Commodity 1 1 ha 20 15,000.00 300,000.00
Commodity 2 1 ha 20 15,000.00 300,000.00
TOTAL SEEDS 600,000.00
FERTILIZER
Fertilizer 1 1 ha 20 12,000.00 240,000.00
Fertilizer 2 1 ha 20 12,000.00 240,000.00
TOTAL FERTILIZER 480,000.00
TOTAL PACKAGE 3,040,000.00
Agrarian Radical Socio-Economic Transformation Model
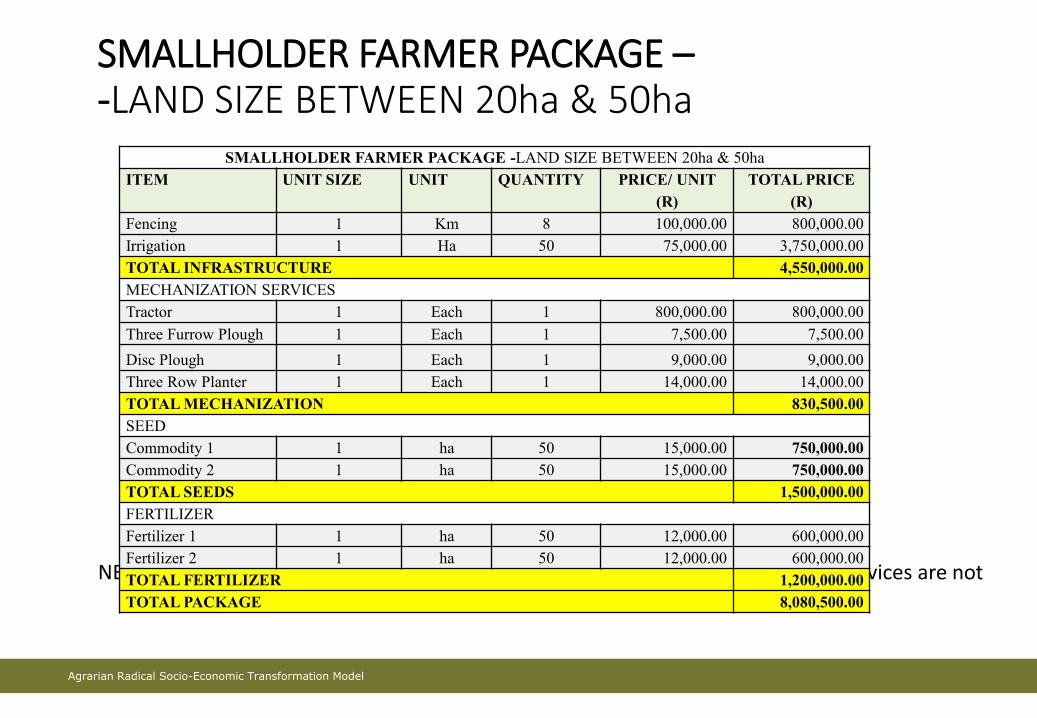
SMALLHOLDER FARMER PACKAGE –-LAND SIZE BETWEEN 20ha & 50ha
NB: Service items (which are not tangible) such as transport service and training services are not included above
SMALLHOLDER FARMER PACKAGE -LAND SIZE BETWEEN 20ha & 50ha
ITEM UNIT SIZE UNIT QUANTITY PRICE/ UNIT
(R)
TOTAL PRICE
(R)
Fencing 1 Km 8 100,000.00 800,000.00
Irrigation 1 Ha 50 75,000.00 3,750,000.00
TOTAL INFRASTRUCTURE 4,550,000.00
MECHANIZATION SERVICES
Tractor 1 Each 1 800,000.00 800,000.00
Three Furrow Plough 1 Each 1 7,500.00 7,500.00
Disc Plough 1 Each 1 9,000.00 9,000.00
Three Row Planter 1 Each 1 14,000.00 14,000.00
TOTAL MECHANIZATION 830,500.00
SEED
Commodity 1 1 ha 50 15,000.00 750,000.00
Commodity 2 1 ha 50 15,000.00 750,000.00
TOTAL SEEDS 1,500,000.00
FERTILIZER
Fertilizer 1 1 ha 50 12,000.00 600,000.00
Fertilizer 2 1 ha 50 12,000.00 600,000.00
TOTAL FERTILIZER 1,200,000.00
TOTAL PACKAGE 8,080,500.00

Agrarian Radical Socio-Economic Transformation Model
Thank you
Inaction is no Excuse…
106


