134


User's GuideMay 2011 (2st edition)
Mecasys Co., Ltd.

Notice!Spectrophotometer Optizen® and Software OptizenView™ are
trademarks of Mecasys Co., Ltd.
No part of the Optizen Series, including this publication
may be reproduced, or modified in any form or by any means
without the prior written permission of Mecasys Co., Ltd.
For more detail information on Optizen® and OptizenView™,
you may refer to “Technical Support”
in the last Chapter of this guide or visit our websites below.
http://english.mecasys.co.kr

PartⅠ. Introduction & General Information
1. Introduction
2. Specifications
3. Constructions
1) External Construction
2) Cell Holder
4. Turning on Switch
6
7
8
8
10
11
PartⅡ. OPTIZEN POP BIO
1. Nucleic Acid
1) Measurement
2) Setup
3) Report
4) Nucleic Acid Guideline
2. Warburg-Christian
1) Measurement
2) Setup
3) Report
4) Warburg-Christian Guideline
3. Kalb-Bernlohr
1) Measurement
2) Setup
3) Report
4) Kalb-Bernlohr Guideline
4. Protein Analysis
4-1. Standard Curve mode
1) How to open standard curve mode
14
14
16
17
18
22
22
24
25
26
30
30
32
33
34
38
38
38
Contents

2) Measurement
3) Setup
4) Report
4-2. Analyzing mode
1) Measurement
2) Setup
3) Report
4-3. Protein Analysis Guideline
5. Cell density
1) Measurement
2) Setup
3) Report
4) Cell density Guideline
6. Customize
1) Measurement
2) Setup
3) Report
4) Cell density Guideline
7. ABS/%T/Conc.
7-1. Standard Curve mode
1) How to open standard curve mode
2) Measurement
3) Setup
4) Report
7-2. Analyzing mode
1) Measurement
2) Setup
3) Report
39
40
42
43
43
44
45
46
53
53
55
56
57
61
61
62
64
66
70
70
70
71
73
76
77
77
79
81
7-3. Import/Export
1) Import
2) Export
7-4. ABS / %T / Conc. mode Guideline
8. Survey Scan
1) Measurement
2) Setup
3) Report
4) Survey Scan mode Guideline
9. Kinetic
1) Measurement
2) Setup
3) Report
4) Kinetic mode Guideline
10. Cell type
11. File browser
12. File open
13. PC link
14. POP Set
1) Application set
2) Device set
3) Calibration
1. Technical Supports
PartⅢ. Technical Supports
82
82
83
84
92
92
95
96
97
101
101
104
105
106
110
119
120
121
123
123
124
125
126

6
Part Ⅰ
. Introduction & G
eneral Information
1. Introduction
Part Ⅰ. Introduction & General Information
1. Introduction
Thank you for purchasing nanobiometer, Optizen POP bio! Optizen POP Bio is designed for bio applications such as Nucleic acids analysis, protein analysis and cell density with easy-to-use bio software. Convenient interface and auto-functions of OPTIZEN POP bio lead your test to be easier, faster, and more accurate.OPTIZEN POP bio provides you rich visual contents with 7 inch color LCD and easy operating with touch screen function. And Windows CE system, which is powerful and stable, enables 2GB of standard memory, USB data backup, user friendly interface, network operation and so on. OPTIZEN POP bio also provides you on-line diagnosis and upgrade via network connection.
Usage of the manualThis manual includes the instructions of system installation, operation, experiment setting, data editing and so on. Mecasys Co., Ltd. will continuously support update via mail, internet or e-mail.
7
Part Ⅰ
. Introduction & G
eneral Information
2. Specifications
2. Specifications
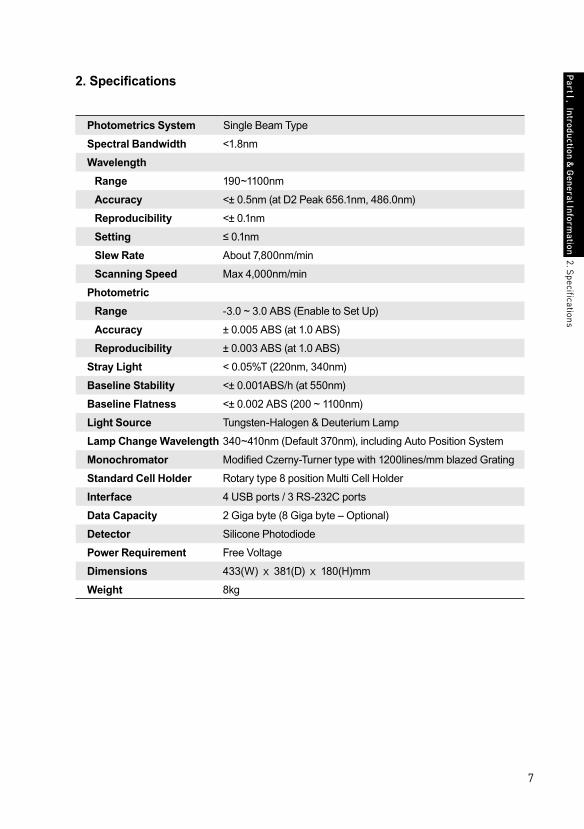
Photometrics System Single Beam Type
Spectral Bandwidth <1.8nm
WavelengthRange 190~1100nm
Accuracy <± 0.5nm (at D2 Peak 656.1nm, 486.0nm)
Reproducibility <± 0.1nm
Setting ≤ 0.1nm
Slew Rate About 7,800nm/min
Scanning Speed Max 4,000nm/min
PhotometricRange -3.0 ~ 3.0 ABS (Enable to Set Up)
Accuracy ± 0.005 ABS (at 1.0 ABS)
Reproducibility ± 0.003 ABS (at 1.0 ABS)
Stray Light < 0.05%T (220nm, 340nm)
Baseline Stability <± 0.001ABS/h (at 550nm)
Baseline Flatness <± 0.002 ABS (200 ~ 1100nm)
Light Source Tungsten-Halogen & Deuterium Lamp
Lamp Change Wavelength 340~410nm (Default 370nm), including Auto Position System
Monochromator Modified Czerny-Turner type with 1200lines/mm blazed Grating
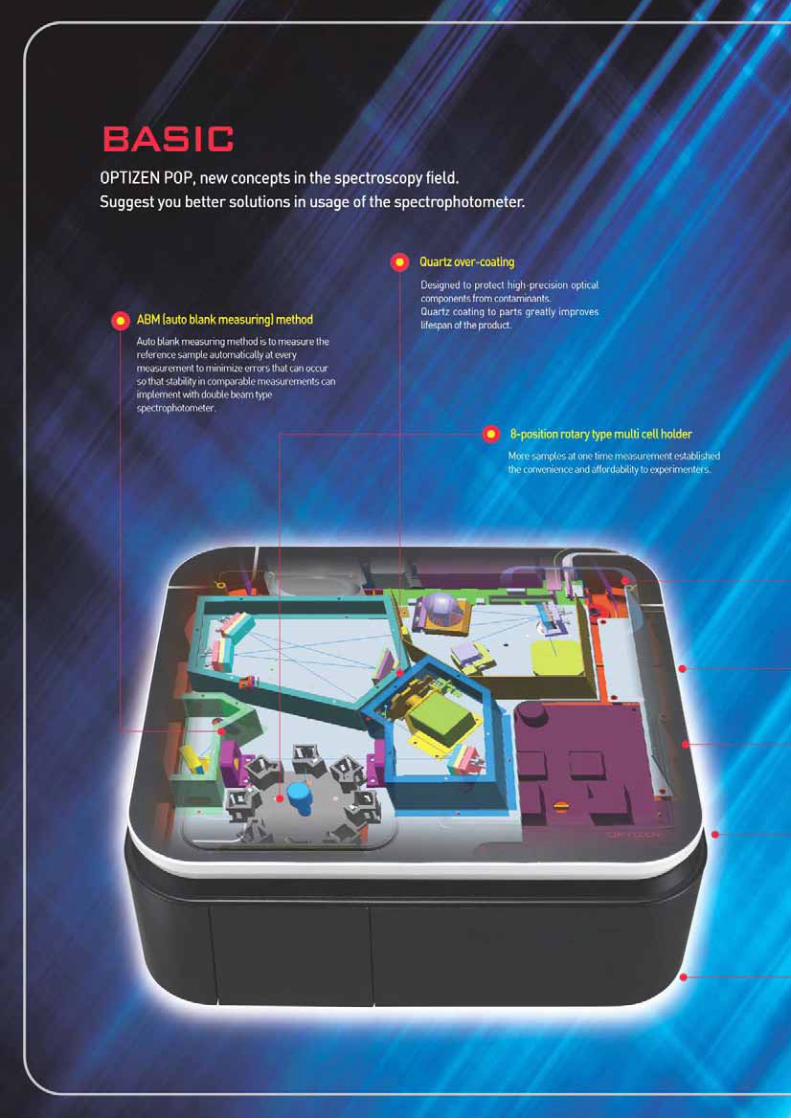
Standard Cell Holder Rotary type 8 position Multi Cell Holder
Interface 4 USB ports / 3 RS-232C ports
Data Capacity 2 Giga byte (8 Giga byte – Optional)
Detector Silicone Photodiode
Power Requirement Free Voltage
Dimensions 433(W) ⅹ 381(D) ⅹ 180(H)mm
Weight 8kg

8
Part Ⅰ
. Introduction & G
eneral Information
Main
Right Side
Left Side
① 4 USB PORT1
① One-Touch Type Sample Compartment Cover② 8-position Rotary Type Multi cell Holder
1
2
① Optional Acrylic Plate② 7 Inch LCD (Touch Screen)
1
2
3. Constructions
3. Constructions
1) External Construction

9
Part Ⅰ
. Introduction & G
eneral Information
① Remove Type Front Cover
① Fan② Power connection③ Speaker④ Main Power⑤ Ethernet⑥ Port for Accessory
132
4
5 6
1
Front Cover
Rear Plate
3. Constructions

10
Part Ⅰ
. Introduction & G
eneral Information
3. Constructions
2) Cell Holder
11
Part Ⅰ
. Introduction & G
eneral Information
4. Turning on Switch
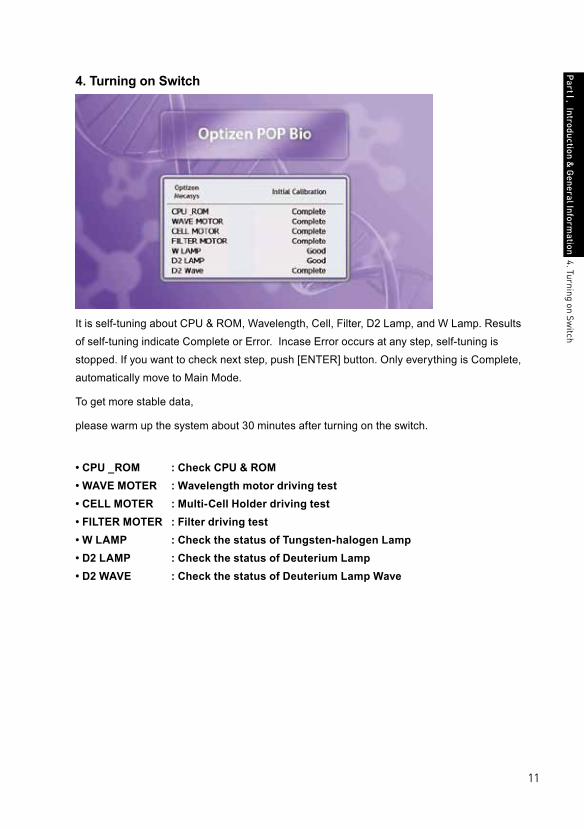
4. Turning on Switch
It is self-tuning about CPU & ROM, Wavelength, Cell, Filter, D2 Lamp, and W Lamp. Results of self-tuning indicate Complete or Error. Incase Error occurs at any step, self-tuning is stopped. If you want to check next step, push [ENTER] button. Only everything is Complete, automatically move to Main Mode.
To get more stable data,
please warm up the system about 30 minutes after turning on the switch.
• CPU _ROM : Check CPU & ROM• WAVE MOTER : Wavelength motor driving test• CELL MOTER : Multi-Cell Holder driving test• FILTER MOTER : Filter driving test• W LAMP : Check the status of Tungsten-halogen Lamp• D2 LAMP : Check the status of Deuterium Lamp• D2 WAVE : Check the status of Deuterium Lamp Wave

12
Part Ⅱ. OP
TIZEN P
OP BIO
Part Ⅱ. OPTIZEN POP BIO
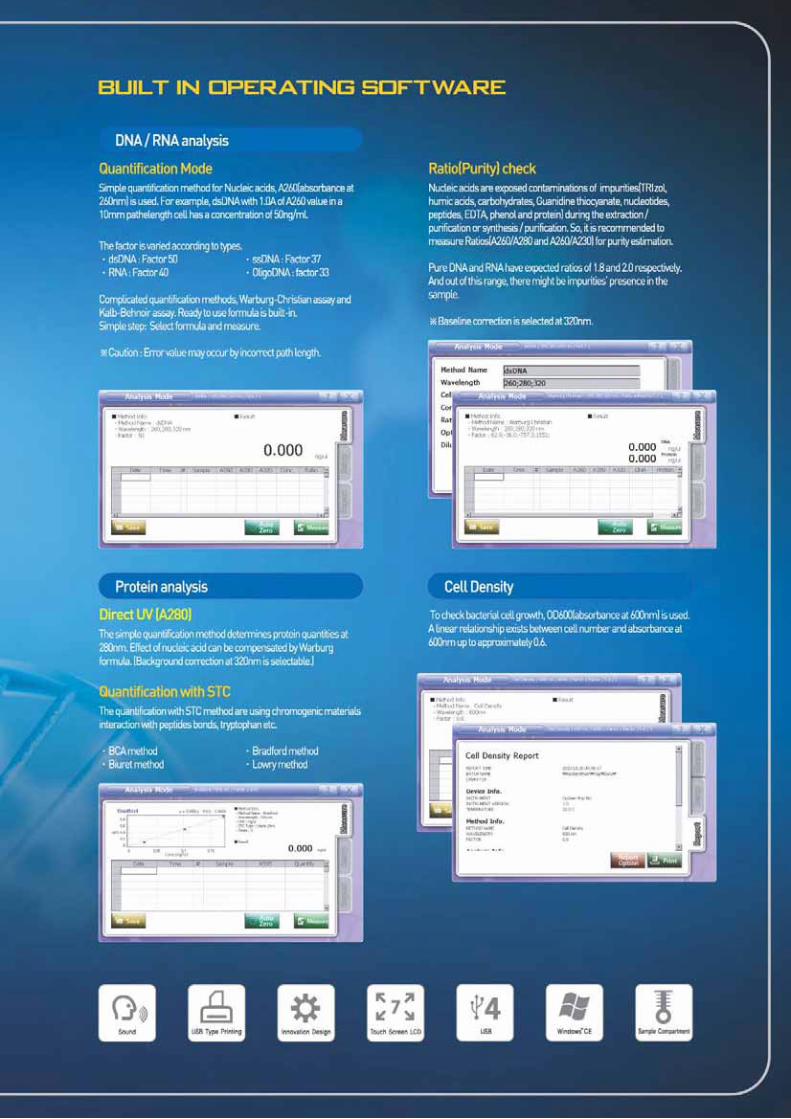
Optizen POP Bio provides Nucleic acid analysis, Protein analysis and cell density with easy-to-use bio software. It is consisted as Nucleic Acid, Warburg-Christian, Kalb-Bernlohr, Protein Analysis and Cell Density mode.And customize mode for multiple wavelength analysis.
• Nucleic Acid : dsDNA, ssDNA, OligoDNA, RNA quantification/purify check
• Warburg : Christian - Warburg-Christian
• Kalb-Bernlohr : Kalb-Bernlohr
• Protein Analysis : Bradford, Lowry, BCA, Biuret, Direct UV
• Cell Density : Cell Density
• Customize : Custom Mode
Mode selection
1. As double-clicking the desired folder, Sub list will appear.
13
Part Ⅱ. OP
TIZEN P
OP BIO
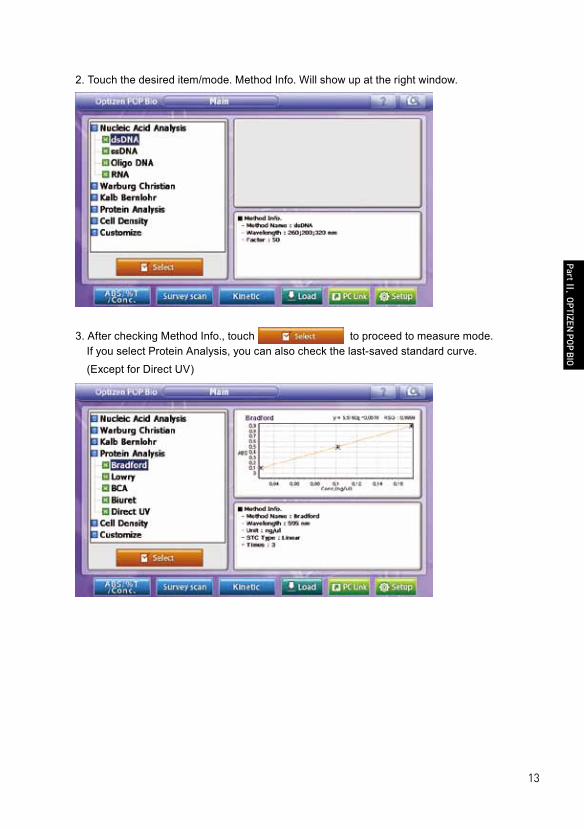
2. Touch the desired item/mode. Method Info. Will show up at the right window.
3. After checking Method Info., touch to proceed to measure mode. If you select Protein Analysis, you can also check the last-saved standard curve.(Except for Direct UV)

14
Part Ⅱ. OP
TIZEN P
OP BIO
1. Nucleic Acid
This mode is to measure the concentration and ratio of dsDNA, ssDNA, OligoDNA, RNA at the pre-set wavelengths. Results show up at data table and result tap at the right upper side of the window.
1) Measurement
• Input sample name – Double click desired window, and keypad appears. Input sample name.
• Measurement
1. Input the blank(reference) sample to cell holder and touch to make Auto zero.
2. After making auto zero, input the sample to cell holder and touch to measure.
3. Repeat item 2. for more samples.
4. Results show up at data table and result tap at the right upper side of the window.1. N
ucleic Acid

15
Part Ⅱ. OP
TIZEN P
OP BIO
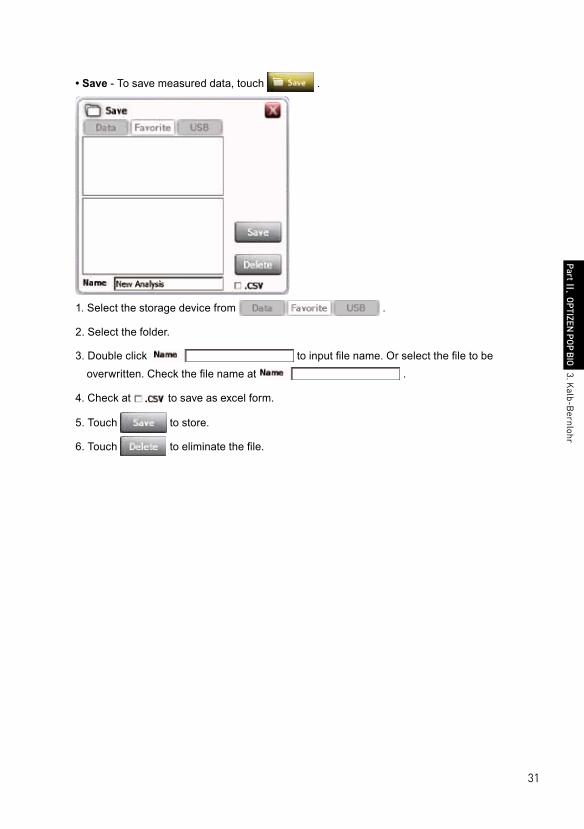
• Save - To save measured data, touch .
1. Select the storage device from .
2. Select the folder.
3. Double click to input file name. Or select the file to be overwritten. Check the file name at .
4. Check at to save as excel form.
5. Touch to store.
6. Touch to eliminate the file.
1. Nucleic A
cid

16
Part Ⅱ. OP
TIZEN P
OP BIO
2) Setup
Setting factors to be applied for measurement. Set up cell type, Ratio method and factor. Method name, wavelength, Conc., and Exp. are not amendable. Ratio is automatically set by selecting ratio method.
• Cell type - Touch to find proper one and touch to apply.
Default setting is Single cell. (Ref : 10. Cell type - 110page)
• Ratio Method selection
N/A : Do not use Ratio Method. Ratio without B.C. : Calculate the ratio without background correction using A320 value.
Ratio = A260 / A280 (dsDNA, ssDNA, OligoDNA)Ratio = A260 / A230 (RNA)
Ratio with B.C. : Calculate the ratio with background correction using A320 value.Ratio = (A260 - A320) / (A280 - A320) (dsDNA, ssDNA, OligoDNA)Ratio = (A260 - A320) / (A230 - A320) (RNA)
1. Nucleic A
cid

17
Part Ⅱ. OP
TIZEN P
OP BIO
• Factor - When the concentration of sample is too high and out of measuring ranges, make the diluted sample and input dilution factor to get the calculated (original) result.
Touch to input the dilution factor.
3) Report
Preview allows displaying measured data, then print out. Device info, Method info, Analyze Info and Analyze data will show up.
And touch to select items to print out.
Touch to print out after reviewing.
1. Nucleic A
cid

18
Part Ⅱ. OP
TIZEN P
OP BIO
4) Nucleic Acid Guideline
1. As double clicking [Nucleic Acid Analysis] at the main menu, the sub list of [Nucleic Acid Analysis] will show up. Check method list.
2. Click the desired method once at the sub list of [Nucleic Acid Analysis].
Detail method info. will show up on the right bottom window.
3. After checking Method Info., touch to proceed to analyzing mode.
1. Nucleic A
cid

19
Part Ⅱ. OP
TIZEN P
OP BIO
4. Touch [Setup] to set the measuring conditions.
Modify cell type, ratio method and factor as the experiment conditions. Method name, wavelength and Conc. Exp. are not amendable, and ratio is automatically set by selecting ratio method.
5. Touch to apply setting. [Measurement] screen will show up.
1. Nucleic A
cid

20
Part Ⅱ. OP
TIZEN P
OP BIO
6. Input the blank(reference) sample to cell holder and touch to make Auto zero.
7. After making auto zero, input the sample to cell holder and touch to measure.
8. Repeat item 7. For more samples. Results show up at data table and result tap at the right upper side of the window.
9. To save measured data, touch .
10. Select the storage device and folder. Then input file name and touch to save.
Check at to save as excel form.
1. Nucleic A
cid

21
Part Ⅱ. OP
TIZEN P
OP BIO
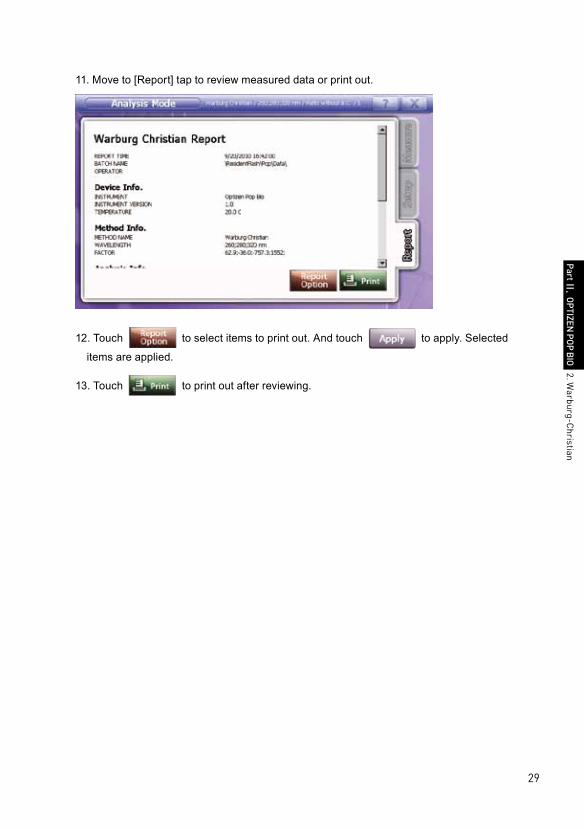
11. Move to [Report] tap to review measured data or print out.
12. Touch to select items to print out. And touch to apply. Selected
items are applied.
13. Touch to print out after reviewing.
1. Nucleic A
cid

22
Part Ⅱ. OP
TIZEN P
OP BIO
2. Warburg-Christian
This mode is to measure the concentration of DNA and Protein with Warburg-Christian Method. Results show up at data table and result tap at the right upper side of the window.
1) Measurement
• Input sample name – Double click desired window, and keypad appears. Input sample name.
• Measurement
1. Input the blank(reference) sample to cell holder and touch to make Auto zero.
2. After making auto zero, input the sample to cell holder and touch to measure.
3. Repeat item 2. for more samples.
4. Results show up at data table and result tap at the right upper side of the window.2. W
arburg-Christian

23
Part Ⅱ. OP
TIZEN P
OP BIO
• Save - To save measured data, touch .
1. Select the storage device from .
2. Select the folder.
3. Double click to input file name. Or select the file to be overwritten. Check the file name at .
4. Check at to save as excel form.
5. Touch to store.
6. Touch to eliminate the file.
2. Warburg-C
hristian

24
Part Ⅱ. OP
TIZEN P
OP BIO
2) Setup
Setting factors to be applied for measurement. Set up cell type, Ratio method and factor. Method name, wavelength, Conc., and Exp. are not amendable. Ratio is automatically set by selecting ratio method.
• Cell type - Touch to find proper one and touch to apply.
Default setting is Single cell. (Ref : 10. Cell type - 110page)
• Ratio Method selection
Ratio without B.C. : Calculate the ratio without background correction using A320 value. Ratio = A260 / A280
Ratio with B.C. : Calculate the ratio with background correction using A320 value.Ratio = (A260 - A320) / (A280 - A320)
• Factor - When the concentration of sample is too high and out of measuring ranges, make the diluted sample and input dilution factor to get the calculated (original) result.
Touch to input the dilution factor
2. Warburg-C
hristian
25
Part Ⅱ. OP
TIZEN P
OP BIO
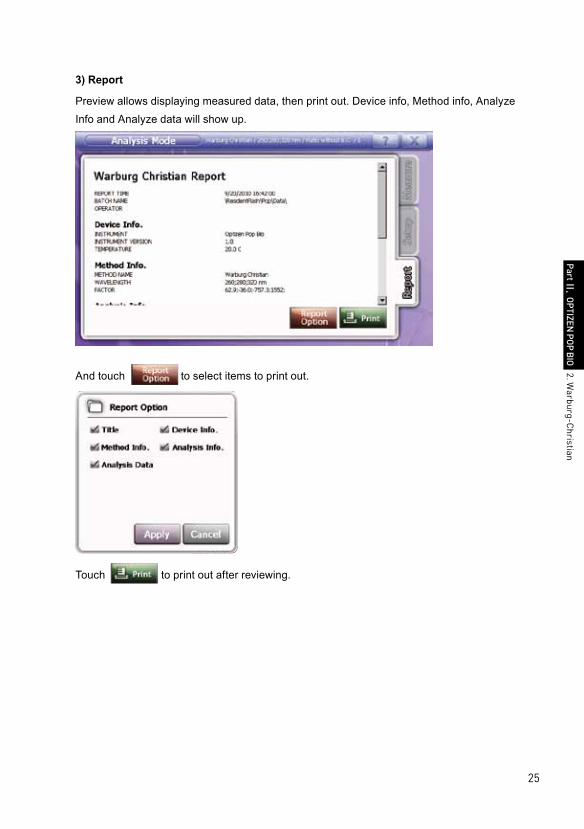
3) Report
Preview allows displaying measured data, then print out. Device info, Method info, Analyze Info and Analyze data will show up.
And touch to select items to print out.
Touch to print out after reviewing.
2. Warburg-C
hristian

26
Part Ⅱ. OP
TIZEN P
OP BIO
4) Warburg-Christian Guideline
1. As double clicking [Warburg-Christian] at the main menu, the sub list of [Warburg-Christian] will show up. Check method list.
2. Click the desired method once at the sub list of [Warburg-Christian].
Detail method info. will show up on the right bottom window.
3. After checking Method Info., touch to proceed to analyzing mode.
2. Warburg-C
hristian
27
Part Ⅱ. OP
TIZEN P
OP BIO
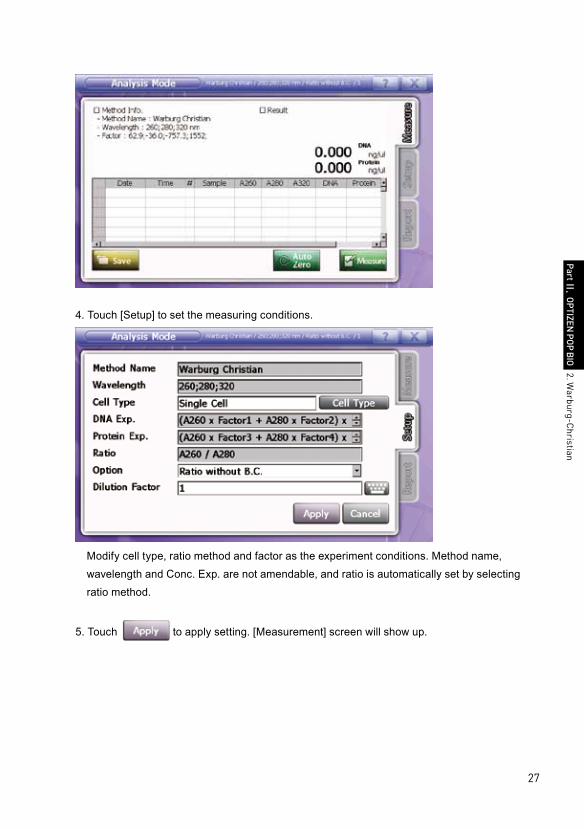
4. Touch [Setup] to set the measuring conditions.
Modify cell type, ratio method and factor as the experiment conditions. Method name, wavelength and Conc. Exp. are not amendable, and ratio is automatically set by selecting ratio method.
5. Touch to apply setting. [Measurement] screen will show up.
2. Warburg-C
hristian

28
Part Ⅱ. OP
TIZEN P
OP BIO
6. Input the blank(reference) sample to cell holder and touch to make Auto zero.
7. After making auto zero, input the sample to cell holder and touch to measure.
8. Repeat item 7. For more samples. Results show up at data table and result tap at the right upper side of the window.
9. To save measured data, touch .
10. Select the storage device and folder. Then input file name and touch to save.
Check at to save as excel form.
2. Warburg-C
hristian
29
Part Ⅱ. OP
TIZEN P
OP BIO
11. Move to [Report] tap to review measured data or print out.
12. Touch to select items to print out. And touch to apply. Selected
items are applied.
13. Touch to print out after reviewing.
2. Warburg-C
hristian

30
Part Ⅱ. OP
TIZEN P
OP BIO
3. Kalb-Bernlohr
This mode is to measure the concentration of DNA and Protein with Kalb-Bernlohr Method. Results show up at data table and result tap at the right upper side of the window.
1) Measurement
• Input sample name – Double click desired window, and keypad appears. Input sample name.
• Measurement
1. Input the blank(reference) sample to cell holder and touch to make Auto zero.
2. After making auto zero, input the sample to cell holder and touch to measure.
3. Repeat item 2. for more samples.
4. Results show up at data table and result tap at the right upper side of the window.3. K
alb-Bernlohr
31
Part Ⅱ. OP
TIZEN P
OP BIO
• Save - To save measured data, touch .
1. Select the storage device from .
2. Select the folder.
3. Double click to input file name. Or select the file to be overwritten. Check the file name at .
4. Check at to save as excel form.
5. Touch to store.
6. Touch to eliminate the file.
3. Kalb-B
ernlohr

32
Part Ⅱ. OP
TIZEN P
OP BIO
2) Setup
Setting factors to be applied for measurement. Set up cell type, Ratio method and factor. Method name, wavelength, Conc., DNA Exp., and Protein Exp. are not amendable. Ratio is automatically set by selecting ratio method.
• Cell type - Touch to find proper one and touch to apply.
Default setting is Single cell. (Ref : 10. Cell type - 110page)
• Ratio Method selection
Ratio without B.C. : Calculate the ratio without background correction using A320 value. Ratio = A260 / A280
Ratio with B.C. : Calculate the ratio with background correction using A320 value.Ratio = (A260 - A320) / (A280 - A320)
• Factor - When the concentration of sample is too high and out of measuring ranges, make the diluted sample and input dilution factor to get the calculated (original) result.
Touch to input the dilution factor.
3. Kalb-B
ernlohr

33
Part Ⅱ. OP
TIZEN P
OP BIO
3) Report
Preview allows displaying measured data, then print out. Device info, Method info, Analyze Info and Analyze data will show up.
And touch to select items to print out.
Touch to print out after reviewing.
3. Kalb-B
ernlohr

34
Part Ⅱ. OP
TIZEN P
OP BIO
4) Kalb-Bernlohr Guideline
1. As double clicking [Kalb-Bernlohr] at the main menu, the sub list of [Kalb-Bernlohr] will show up. Check method list.
2. Click the desired method once at the sub list of [Kalb-Bernlohr].
Detail method info. will show up on the right bottom window.
3. After checking Method Info., touch to proceed to analyzing mode.
3. Kalb-B
ernlohr

35
Part Ⅱ. OP
TIZEN P
OP BIO
4. Touch [Setup] to set the measuring conditions.
Modify cell type, ratio method and factor as the experiment conditions. Method name, wavelength, DNA Exp. and Protein Exp. are not amendable, and ratio is automatically set by selecting ratio method.
5. Touch to apply setting. [Measurement] screen will show up.
3. Kalb-B
ernlohr

36
Part Ⅱ. OP
TIZEN P
OP BIO
6. Input the blank(reference) sample to cell holder and touch to make Auto zero.
7. After making auto zero, input the sample to cell holder and touch to measure.
8. Repeat item 7. For more samples. Results show up at data table and result tap at the right upper side of the window.
9. To save measured data, touch .
10. Select the storage device and folder. Then input file name and touch to save.
Check at to save as excel form.
3. Kalb-B
ernlohr

37
Part Ⅱ. OP
TIZEN P
OP BIO
11. Move to [Report] tap to review measured data or print out.
12. Touch to select items to print out. And touch to apply. Selected
items are applied.
13. Touch to print out after reviewing.
3. Kalb-B
ernlohr

38
Part Ⅱ. OP
TIZEN P
OP BIO
4. Protein Analysis
This mode is to measure the concentration of protein with Bradford, Lowry, BCA, Biuret, and Direct UV Method. The standard curve is needed to analysis with Bradford, Lowry, BCA, Biuret Method. Use standard curve mode to draw it. ( Refer to Nucleic Acid Method for the usage of Direct UV Method )Results show up at data table and result tap at the right upper side of the window.
4-1. Standard Curve mode
1) How to open standard curve mode
Double click the standard curve graph at the left upper side of window to proceed to standard curve mode.
At Standard Curve mode, recently saved standard curve is stored.
4. Protein A
nalysis

39
Part Ⅱ. OP
TIZEN P
OP BIO
2) Measurement
Input concentration values of standard samples to Conc. orderly, and draw standard curve with measuring standard samples.
• Input sample name – Double click the desired window below [Conc.], then keypad appears. Input concentrations.
• Measurement
1. Input the blank(reference) sample to cell holder and touch to make Auto zero.
2. After making auto zero, input the first standard sample to cell holder and touch to measure.
3. Repeat item 2. For more standard samples. (Max 7 samples can be measured at one time with multi cell holder.)
4. After measuring, OPTIZEN POP BIO will draw the standard curve with measured data automatically, and it will also tell you the equation and RSQ value of the standard curve.
5. Each row, there is a mark box to select data. Check a mark box to select data or undo to
exclude data and touch .
• Save
1. Touch to save the created standard curve.
2. Message will appear after saving.
3. Touch to proceed to protein analysis mode.
4-1. Standard Curve m
ode

40
Part Ⅱ. OP
TIZEN P
OP BIO
2) Setup
Set factors and functions. Set up Cell type, STC type, measuring times and memo. Name, wavelength and unit are not amendable.
• Cell type - Touch to find proper one and touch to apply.
Default setting is Single cell. (Ref : 10. Cell type - 110page)
4-1. Standard Curve m
ode

41
Part Ⅱ. OP
TIZEN P
OP BIO
• STC type - Touch and STC type list will show up. Select the proper one among linear (0), linear, quadratic and cubic.
• Times - Input the number of measurement for each cell. Touch and input measuring times, Max. 5.
• Memo - Touch to write brief information on measurement.
4-1. Standard Curve m
ode

42
Part Ⅱ. OP
TIZEN P
OP BIO
3) Report
Preview allows displaying measured data, then print out. Device info, Standard Curve Chart, Standard Curve Info. and STC data will show up.
And touch to select items to print out.
Touch to print out after reviewing. 4-1. Standard C
urve mode

43
Part Ⅱ. OP
TIZEN P
OP BIO
4-2. Analyzing mode
1) Measurement
• Input sample name – Double click desired window, and keypad appears. Input sample name.
• Measurement
1. Input the blank(reference) sample to cell holder and touch to make Auto zero.
2. After making auto zero, input the sample to cell holder and touch to measure.
3. Repeat item 2. for more samples.
4. Results show up at data table and result tap at the right upper side of the window.
• Save - To save measured data, touch .
4-2. Analyzing m
ode
44
Part Ⅱ. OP
TIZEN P
OP BIO
1. Select the storage device from .
2. Select the folder.
3. Double click to input file name. Or select the file to be overwritten. Check the file name at .
4. Check at to save as excel form.
5. Touch to store.
6. Touch to eliminate the file.
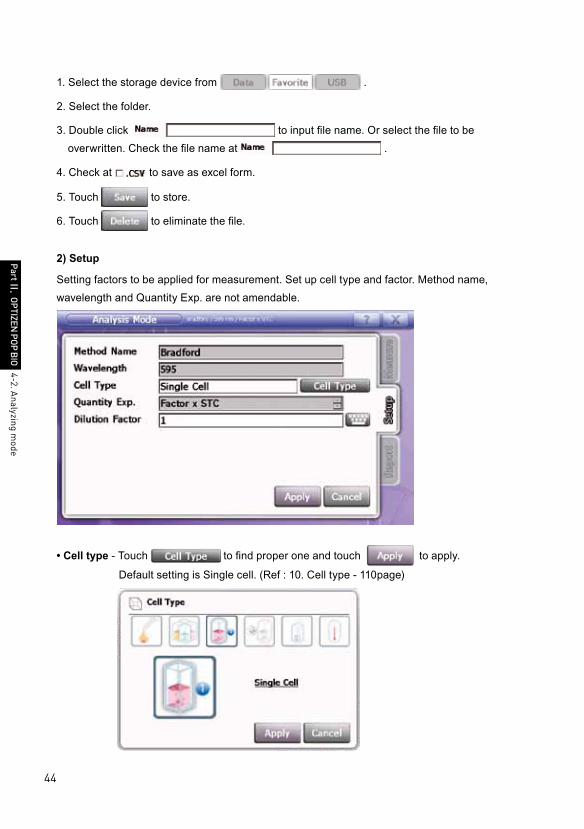
2) Setup
Setting factors to be applied for measurement. Set up cell type and factor. Method name, wavelength and Quantity Exp. are not amendable.
• Cell type - Touch to find proper one and touch to apply.
Default setting is Single cell. (Ref : 10. Cell type - 110page)
4-2. Analyzing m
ode
45
Part Ⅱ. OP
TIZEN P
OP BIO
• Factor - When the concentration of sample is too high and out of measuring ranges, make the diluted sample and input dilution factor to get the calculated (original) result.
Touch to input the dilution factor.
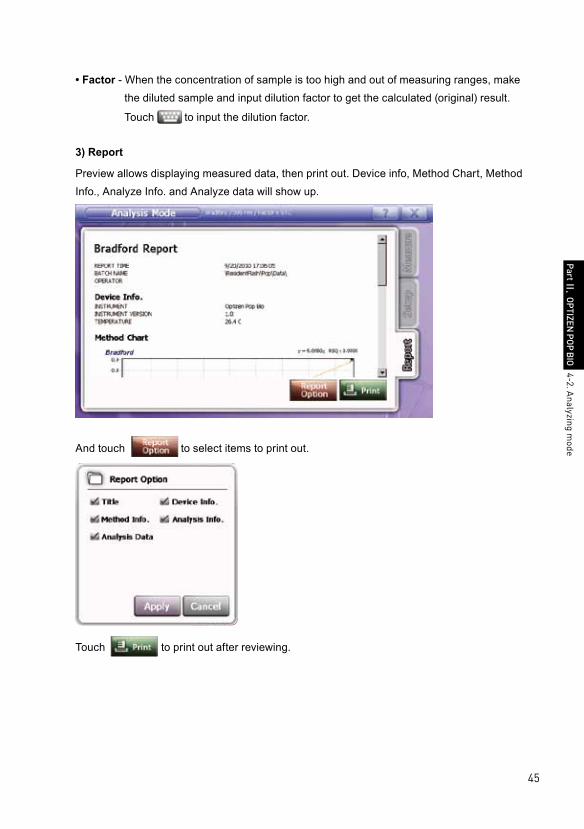
3) Report
Preview allows displaying measured data, then print out. Device info, Method Chart, Method Info., Analyze Info. and Analyze data will show up.
And touch to select items to print out.
Touch to print out after reviewing.
4-2. Analyzing m
ode

46
Part Ⅱ. OP
TIZEN P
OP BIO
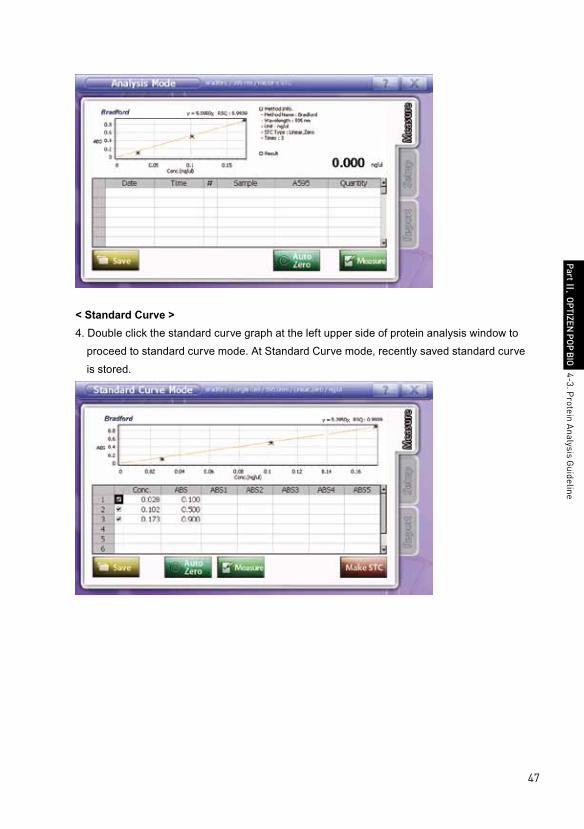
4-3. Protein Analysis Guideline
1.As double clicking [Protein Analysis] at the main menu, the sub list of [Protein Analysis] will show up. Check method list.
2. Click the desired method once at the sub list of [Protein Analysis].
Detail method info. and standard curve info. will show up on the right bottom window.
3. After checking Method Info., touch to proceed to analyzing mode.
4-3. Protein A
nalysis Guideline
47
Part Ⅱ. OP
TIZEN P
OP BIO
< Standard Curve >4. Double click the standard curve graph at the left upper side of protein analysis window to
proceed to standard curve mode. At Standard Curve mode, recently saved standard curve is stored.
4-3. Protein A
nalysis Guideline

48
Part Ⅱ. OP
TIZEN P
OP BIO
5. Touch [Setup] to set the measuring conditions.
Modify cell type, STC type, measuring times and memo as the experiment conditions. Name, wavelength and unit are not amendable.
6. Touch to apply setting. [Measurement] screen will show up.
7. Double click the desired window below [Conc.], and then keypad appears. Input concentrations.
8. Input the blank(reference) sample to cell holder and touch to make Auto zero.
9. After making auto zero, input the sample to the proper cell holder and touch to
measure.
10. Repeat item 9. for more samples.
11. Results show up at data table.
4-3. Protein A
nalysis Guideline

49
Part Ⅱ. OP
TIZEN P
OP BIO
12. Touch to draw the standard curve as the pre-set conditions. Chart, formula and
RSQ value are also shown up.
13. To save measured data, touch .
14. Move to [Report] tap to review measured data or print out.
15. Touch to select items to print out. And touch to apply. Selected
items are applied.
16. Touch to print out after reviewing.
< Protein Analysis >
17. After creating the standard curve, touch to save it.
4-3. Protein A
nalysis Guideline

50
Part Ⅱ. OP
TIZEN P
OP BIO
18. Message will appear after saving.
19. Touch to proceed to protein analysis mode.
20. Touch [Setup] to set the measuring conditions.
Modify cell type, STC type, measuring times and memo as the experiment conditions. Name, wavelength and unit are not amendable.
21. Touch to apply setting. [Measurement] screen will show up.
4-3. Protein A
nalysis Guideline
51
Part Ⅱ. OP
TIZEN P
OP BIO
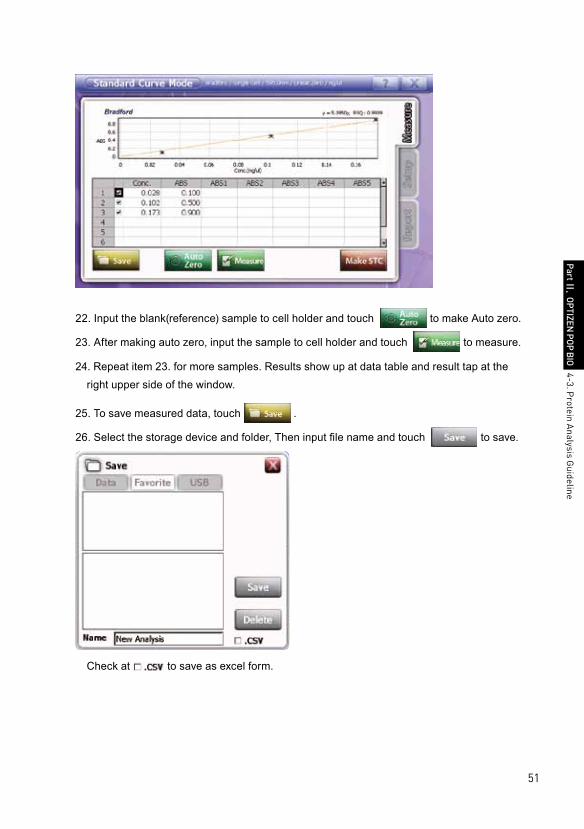
22. Input the blank(reference) sample to cell holder and touch to make Auto zero.
23. After making auto zero, input the sample to cell holder and touch to measure.
24. Repeat item 23. for more samples. Results show up at data table and result tap at the right upper side of the window.
25. To save measured data, touch .
26. Select the storage device and folder, Then input file name and touch to save.
Check at to save as excel form.
4-3. Protein A
nalysis Guideline
52
Part Ⅱ. OP
TIZEN P
OP BIO
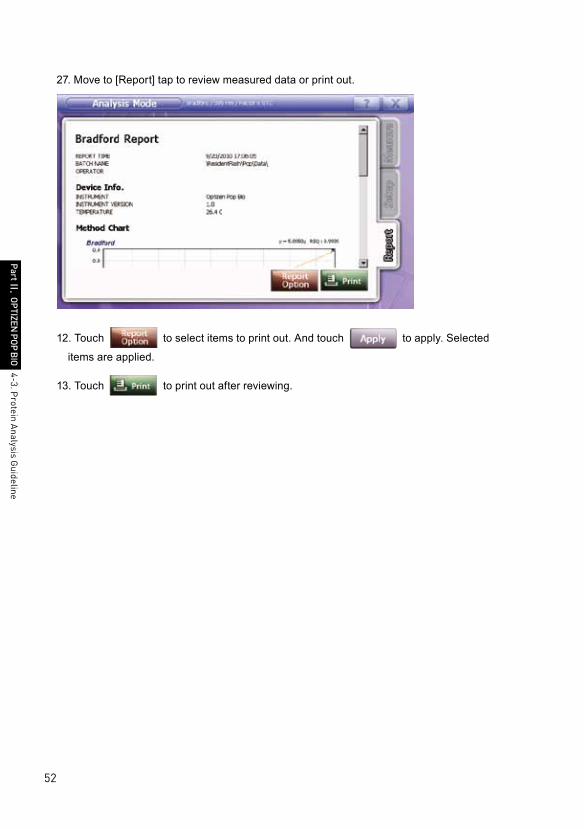
27. Move to [Report] tap to review measured data or print out.
12. Touch to select items to print out. And touch to apply. Selected
items are applied.
13. Touch to print out after reviewing.
4-3. Protein A
nalysis Guideline

53
Part Ⅱ. OP
TIZEN P
OP BIO
5. Cell density
This mode is to measure Cell density to determine bacterial cell growth. Results show up at data table and result tap at the right upper side of the window.
1) Measurement
• Input sample name – Double click desired window, and keypad appears. Input sample name.
• Measurement
1. Input the blank(reference) sample to cell holder and touch to make Auto zero.
2. After making auto zero, input the sample to cell holder and touch to measure.
3. Repeat item 2. for more samples.
4. Results show up at data table and result tap at the right upper side of the window.
5. Cell density

54
Part Ⅱ. OP
TIZEN P
OP BIO
• Save - To save measured data, touch .
1. Select the storage device from .
2. Select the folder.
3. Double click to input file name. Or select the file to be overwritten. Check the file name at .
4. Check at to save as excel form.
5. Touch to store.
6. Touch to eliminate the file.
5. Cell density

55
Part Ⅱ. OP
TIZEN P
OP BIO
2) Setup
Setting factors to be applied for measurement. Set up cell type and factor. Method name, wavelength and Density Exp. are not amendable.
• Cell type - Touch to find proper one and touch to apply.
Default setting is Single cell. (Ref : 10. Cell type - 110page)
• Factor - When the concentration of sample is too high and out of measuring ranges, make the diluted sample and input dilution factor to get the calculated (original) result.
Touch to input the dilution factor.
5. Cell density

56
Part Ⅱ. OP
TIZEN P
OP BIO
3) Report
Preview allows displaying measured data, then print out. Device info, Method Info., Analyze Info. and Analyze data will show up.
And touch to select items to print out.
Touch to print out after reviewing. 5. C
ell density
57
Part Ⅱ. OP
TIZEN P
OP BIO
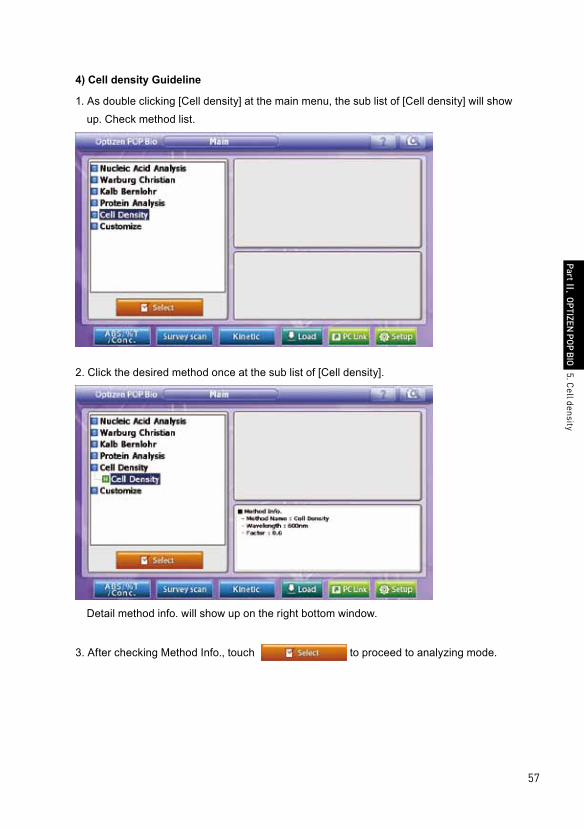
4) Cell density Guideline
1. As double clicking [Cell density] at the main menu, the sub list of [Cell density] will show up. Check method list.
2. Click the desired method once at the sub list of [Cell density].
Detail method info. will show up on the right bottom window.
3. After checking Method Info., touch to proceed to analyzing mode.
5. Cell density

58
Part Ⅱ. OP
TIZEN P
OP BIO
4. Touch [Setup] to set the measuring conditions.
Modify cell type and factor as the experiment conditions. Method name, wavelength and Density Exp. are not amendable.
5. Touch to apply setting. [Measurement] screen will show up.
5. Cell density

59
Part Ⅱ. OP
TIZEN P
OP BIO
6. Input the blank(reference) sample to cell holder and touch to make Auto zero.
7. After making auto zero, input the sample to cell holder and touch to measure.
8. Repeat item 7. for more samples.
9. To save measured data, touch .
10. Select the storage device and folder. Then input file name and touch to save.
Check at to save as excel form.
5. Cell density

60
Part Ⅱ. OP
TIZEN P
OP BIO
11. Move to [Report] tap to review measured data or print out.
12. Touch to select items to print out. And touch to apply. Selected
items are applied.
13. Touch to print out after reviewing.
5. Cell density

61
Part Ⅱ. OP
TIZEN P
OP BIO
6. Customize
This mode is to check absorbance from multiple wavelengths. It also provides simple calculation methods.Results show up at method info and data table at the upper side of the window.
1) Measurement
• Input sample name – Double click desired window, and keypad appears. Input sample name.
• Measurement
1. Input the blank(reference) sample to cell holder and touch to make Auto zero.
2. After making auto zero, input the sample to cell holder and touch to measure.
3. Repeat item 2. for more samples.
4. Results show up at data table and result tap at the right upper side of the window.
6. Custom
ize

62
Part Ⅱ. OP
TIZEN P
OP BIO
• Save - To save measured data, touch .
1. Select the storage device from .
2. Select the folder.
3. Double click to input file name. Or select the file to be overwritten. Check the file name at .
4. Check at to save as excel form.
5. Touch to store.
6. Touch to eliminate the file.
2) Setup
Set up window.Set cell type, wavelength, factor, expression and unit.
6. Custom
ize

63
Part Ⅱ. OP
TIZEN P
OP BIO
• Cell type - Touch to find proper one and touch to apply.
Default setting is Single cell. (Ref : 10. Cell type - 110page)
• Input wavelengths
1. Touch beside wavelengths.
2. Input wavelengths using number pad on the screen.
3. Input wavelengths between 190nm and 1100nm. It is possible to input to one decimal place and maximum 8 wavelengths.
4. Touch .
• Factor - When the concentration of sample is too high and out of measuring ranges, make the diluted sample and input dilution factor to get the calculated (original) result.
Touch to input the dilution factor.
6. Custom
ize

64
Part Ⅱ. OP
TIZEN P
OP BIO
• Input expressions
1. Touch besides expression.
2. Input expressions using number keypad on the screen. A means measured absorbance values. A1 is the absorbance value of the first wavelength, and A2 is that of the second wavelength.
3. Possible to input +,-,*,/,(,) to expressions.
4. Touch .
3) Report
Preview allows displaying measured data, then print out.Device info., Custom mode info., and custom mode data is shown at the report.
6. Custom
ize

65
Part Ⅱ. OP
TIZEN P
OP BIO
And touch to select items to print out.
Touch to print out after reviewing.
6. Custom
ize

66
Part Ⅱ. OP
TIZEN P
OP BIO
4) Customize Guideline
1. As double clicking [Customize] at the main menu, the sub list of [Customize] will show up. Check method list.
2. Click the Custom mode once at the sub list of [Customize].
6. Custom
ize
67
Part Ⅱ. OP
TIZEN P
OP BIO
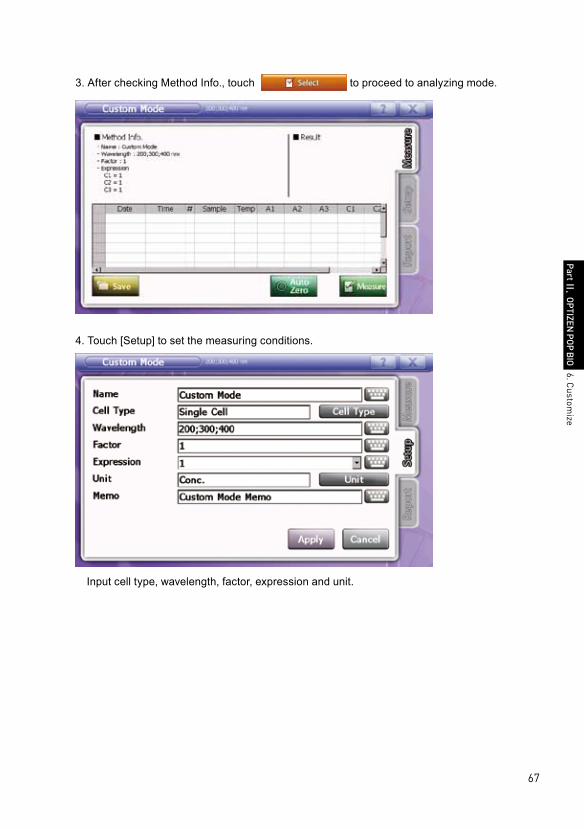
3. After checking Method Info., touch to proceed to analyzing mode.
4. Touch [Setup] to set the measuring conditions.
Input cell type, wavelength, factor, expression and unit.
6. Custom
ize

68
Part Ⅱ. OP
TIZEN P
OP BIO
5. Touch to apply setting. [Measurement] screen will show up.
6. Input the blank(reference) sample to cell holder and touch to make Auto zero.
7. After making auto zero, input the sample to cell holder and touch to measure.
8. Repeat item 7. for more samples.
9. To save measured data, touch .
10. Select the storage device and folder. Then input file name and touch to save.
Check at to save as excel form.
6. Custom
ize

69
Part Ⅱ. OP
TIZEN P
OP BIO
11. Move to [Report] tap to review measured data or print out.
12. Touch to select items to print out. And touch to apply. Selected
items are applied.
13. Touch to print out after reviewing. 6. Custom
ize

70
Part Ⅱ. OP
TIZEN P
OP BIO
7. ABS/%T/Conc.
This mode is to measure absorption, transmittance, and concentration calculated by applied standard curve at selected wavelength. Results show up at data table and result tap at the right upper side of the window.
7-1. Standard Curve mode
1) How to open standard curve mode
Touch at ABS / %T / Conc. window to proceed to STC manager.
• STC Manager enables you to draw, modify, select and delete the standard curve and to import and export standard curve files from other data storages.
• : Take STC file from other data storages into STC manager.
• : Copy STC file from STC manager list to other data storages
To draw or modify the standard curve, touch or . 7. A
BS
/%T/C
onc.

71
Part Ⅱ. OP
TIZEN P
OP BIO
2) Measurement
Input concentration value of standard sample to Conc. orderly, draw standard curve with measuring standard samples. 7-1. Standard C
urve mode

72
Part Ⅱ. OP
TIZEN P
OP BIO
• Input concentration – Double click the desired window below [Conc.], then keypad appears. Input concentrations.
• Measurement
1. Input the blank(reference) sample to cell holder and touch to make Auto zero.
2. After making auto zero, input the first standard sample to cell holder and touch to measure.
3. Repeat item 2. For more standard samples. (Max 7 samples can be measured at one time with multi cell holder.)
4. After measuring, OPTIZEN POP bio will draw the standard curve with measured data automatically, and it will also tell you the formula and RSQ value of the standard curve.
5. Each row, there is a mark box to select data. Check a mark box to select data or undo to
exclude data and touch .
7-1. Standard Curve m
ode
73
Part Ⅱ. OP
TIZEN P
OP BIO
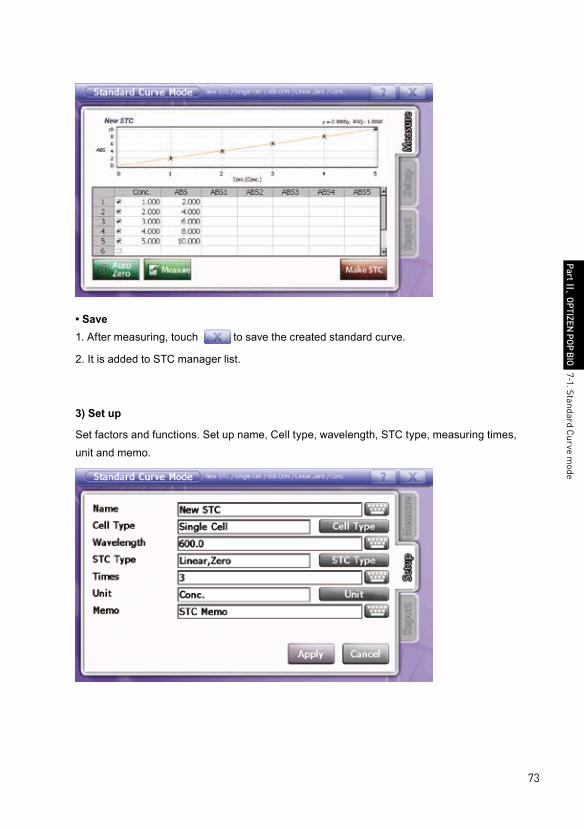
• Save1. After measuring, touch to save the created standard curve.
2. It is added to STC manager list.
3) Set up
Set factors and functions. Set up name, Cell type, wavelength, STC type, measuring times, unit and memo.
7-1. Standard Curve m
ode

74
Part Ⅱ. OP
TIZEN P
OP BIO
• Name - Touch and keypad appears. Input STC name.
• Cell type - Touch to find proper one and touch to apply.
Default setting is Single cell. (Ref : 10. Cell type - 110page)
• Wavelength - Touch to input wavelength. Default setting is 600nm, and possible wavelength ranges are 190~1100nm.
• STC type - Touch aand STC type list will show up. Select the proper one among linear (0), linear, quadratic and cubic.
• Times - Input the number of measurement for each cell. Touch and input measuring times, Max. 5.
7-1. Standard Curve m
ode

75
Part Ⅱ. OP
TIZEN P
OP BIO
• Unit - Touch and 9 units show up. Select proper one and touch to apply.
※Modify unit list.
Touch to modify unit list.
1. Touch , then unit list show up.
2. Double click unit window to modify, and keypad appears.
3. Input desired unit, and touch enter. Modified unit is applied.
4. Touch to apply.
• Memo - Touch to write brief information on measurement.
7-1. Standard Curve m
ode
76
Part Ⅱ. OP
TIZEN P
OP BIO
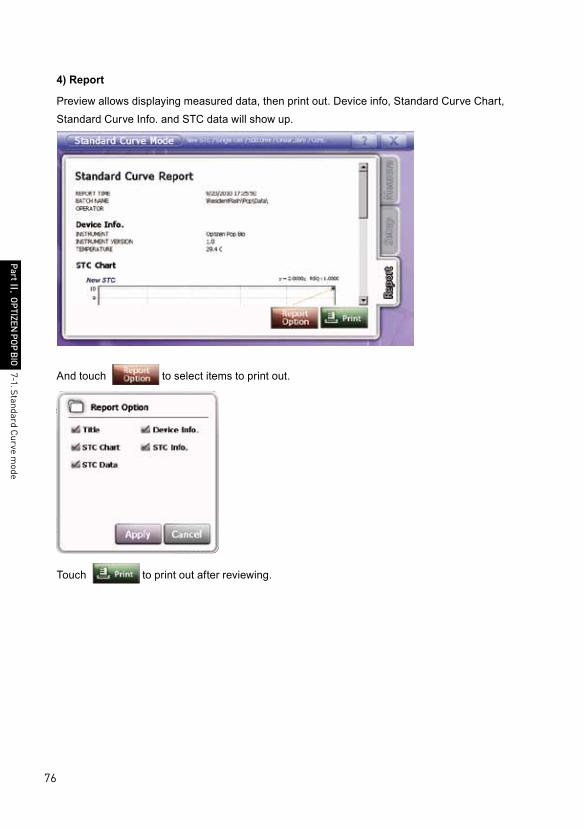
4) Report
Preview allows displaying measured data, then print out. Device info, Standard Curve Chart, Standard Curve Info. and STC data will show up.
And touch to select items to print out.
Touch to print out after reviewing. 7-1. Standard C
urve mode

77
Part Ⅱ. OP
TIZEN P
OP BIO
7-2. Analyzing mode
Check the standard curve at the STC Manager, and touch to proceed to ABS / %T / Conc. mode.
1) Measurement
• Input sample name – Double click desired window, and keypad appears. Input sample name.
7-2. Analyzing m
ode

78
Part Ⅱ. OP
TIZEN P
OP BIO
• Measurement
1. Input the blank(reference) sample to cell holder and touch to make Auto zero.
2. After making auto zero, input the sample to cell holder and touch to measure.
3. Repeat item 2. for more samples.
4. Results show up at data table and result tap at the right upper side of the window.
• Save - To save measured data, touch .
1. Select the storage device from .
2. Select the folder.
3. Double click to input file name. Or select the file to be overwritten. Check the file name at .
4. Check at to save as excel form.
5. Touch to store.
6. Touch to eliminate the file.7-2. A
nalyzing mode

79
Part Ⅱ. OP
TIZEN P
OP BIO
2) Setup
Set factors and functions. Set up name, Cell type, wavelength, factor, unit and memo. In case of using standard curve, cell type, wavelength and unit is set as those of standard curve.
▪ Name - Touch and keypad appears. Input file name.
• Cell type - Touch to find proper one and touch to apply.
Default setting is Single cell. (Ref : 10. Cell type - 110page)
• Wavelength - Touch to input wavelength. Default setting is 600nm, and possible wavelength ranges are 190~1100nm.
▪ Factor – When the concentration of sample is too high and out of measuring ranges, make the diluted sample and input dilution factor to get the calculated (original) result.
7-2. Analyzing m
ode

80
Part Ⅱ. OP
TIZEN P
OP BIO
• Unit - Touch and 9 units show up. Select proper one and touch to apply.
※Modify unit list.
Touch to modify unit list.
1. Touch , then unit list show up.
2. Double click unit window to modify, and keypad appears.
3. Input desired unit, and touch enter. Modified unit is applied.
4. Touch to apply.
• Memo - Touch to write brief information on measurement.
7-2. Analyzing m
ode

81
Part Ⅱ. OP
TIZEN P
OP BIO
3) Report
Preview allows displaying measured data, then print out. Device info, STC Chart, STC Info. STC data, ATC Info. and ATC data will show up.
And touch to select items to print out.
Touch to print out after reviewing.
7-2. Analyzing m
ode

82
Part Ⅱ. OP
TIZEN P
OP BIO
7-3. Import/Export
1) Import
1. Touch .
2. Select the storage device among to import the file from.
3. Select the folder.
4. Double click the file to open. Check the file name at .
5. Touch
6. Touch to eliminate the file.
7-3. Import/E
xport

83
Part Ⅱ. OP
TIZEN P
OP BIO
2) Export
1. Mark a STC file, and then touch .
2. Select the storage device among to export the file to.
3. Select the folder.
4. Double click to input file name.
5. Touch .
6. Touch to eliminate the file.
7-3. Import/E
xport

84
Part Ⅱ. OP
TIZEN P
OP BIO
7-4. ABS / %T / Conc. mode Guideline
1. Touch to proceed to ABS / %T / Conc. Mode.
2. At ABS / %T / Conc. mode, touch to open STC manager.
3. To draw or modify the standard curve, touch or .
7-4. AB
S / %T / C
onc. mode G
uideline

85
Part Ⅱ. OP
TIZEN P
OP BIO
< Standard Curve >
4. Proceed to STC mode.
7-4. AB
S / %T / C
onc. mode G
uideline
86
Part Ⅱ. OP
TIZEN P
OP BIO
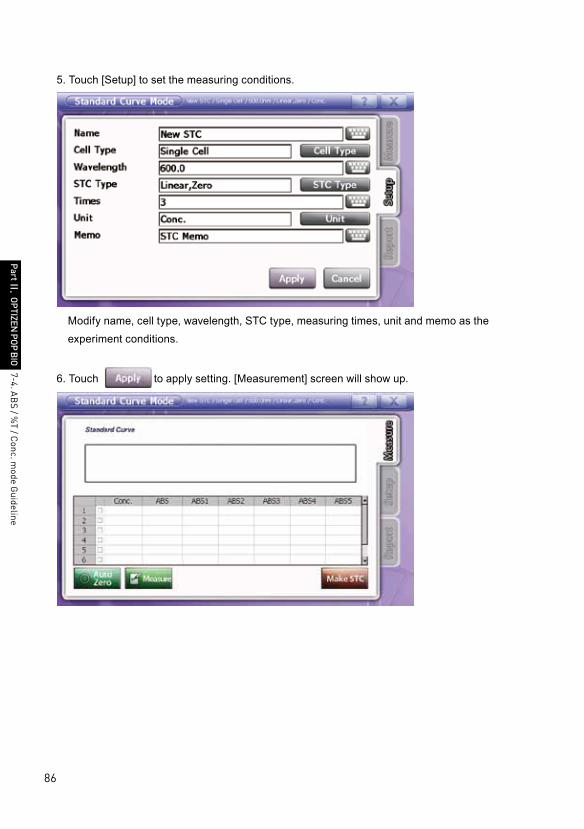
5. Touch [Setup] to set the measuring conditions.
Modify name, cell type, wavelength, STC type, measuring times, unit and memo as the experiment conditions.
6. Touch to apply setting. [Measurement] screen will show up.
7-4. AB
S / %T / C
onc. mode G
uideline

87
Part Ⅱ. OP
TIZEN P
OP BIO
7. Double click the desired window below [Conc.], and then keypad appears. Input concentrations.
8. Input the blank(reference) sample to cell holder and touch to make Auto zero.
9. After making auto zero, input the sample to the proper cell holder and touch to
measure.
10. Repeat item 9. for more samples.
11. Results show up at data table.
12. Touch to draw the standard curve as the pre-set conditions. Chart, formula
and RSQ value are also shown up.
13. To save measured data, touch . It is added to STC manager list.
7-4. AB
S / %T / C
onc. mode G
uideline

88
Part Ⅱ. OP
TIZEN P
OP BIO
14. Move to [Report] tap to review measured data or print out.
15. Touch to select items to print out. And touch to apply. Selected
items are applied.
13. Touch to print out after reviewing.
< ABS / %T / Conc Analysis >
17. Check the standard curve at the STC Manager and touch .
7-4. AB
S / %T / C
onc. mode G
uideline

89
Part Ⅱ. OP
TIZEN P
OP BIO
18. Proceed to ABS / %T / Conc. mode.
19. Touch [Setup] to set the measuring conditions.
Modify name, cell type, wavelength, factor, unit and memo as the experiment conditions. In case of using standard curve, cell type, wavelength and unit is set as those of standard curve.
20. Touch to apply setting. [Measurement] screen will show up.
7-4. AB
S / %T / C
onc. mode G
uideline

90
Part Ⅱ. OP
TIZEN P
OP BIO
21. Input the blank(reference) sample to cell holder and touch to make Auto zero.
22. After making auto zero, input the sample to cell holder and touch to measure.
23. Repeat item 7. for more samples.
24. To save measured data, touch .
25. Select the storage device and folder. Then input file name and touch to save.
Check at to save as excel form.
7-4. AB
S / %T / C
onc. mode G
uideline

91
Part Ⅱ. OP
TIZEN P
OP BIO
26. Move to [Report] tap to review measured data or print out.
27. Touch to select items to print out. And touch to apply. Selected
items are applied.
28. Touch to print out after reviewing.
7-4. AB
S / %T / C
onc. mode G
uideline
92
Part Ⅱ. OP
TIZEN P
OP BIO
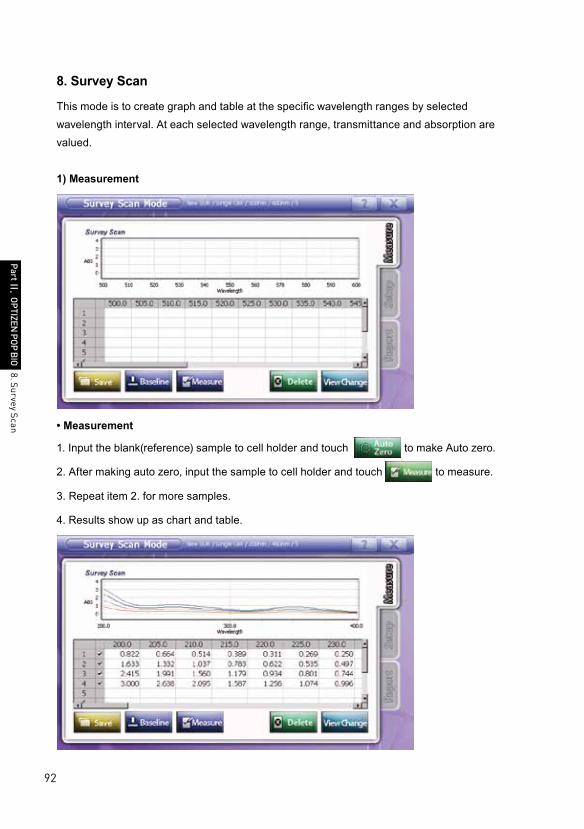
8. Survey Scan
This mode is to create graph and table at the specific wavelength ranges by selected wavelength interval. At each selected wavelength range, transmittance and absorption are valued.
1) Measurement
• Measurement
1. Input the blank(reference) sample to cell holder and touch to make Auto zero.
2. After making auto zero, input the sample to cell holder and touch to measure.
3. Repeat item 2. for more samples.
4. Results show up as chart and table.
8. Survey Scan

93
Part Ⅱ. OP
TIZEN P
OP BIO
• Hide Chart – Each row, there is a mark box to select chart. Check a mark box to show chart or undo to exclude chart.
• Measuring info – touch to convert the screen as Chart + Data, Chart and Data forms. At Chart forms, Functions such as Zoom, Zoom out, Move graph, %T/ABS conversion, and peak/valley are available.
No. Button Description
1 Enlarge chart.
2 Minimize chart (Return to original size)
3 Move chart to the left
4 Move chart to the right.
5 Move chart to the upper direction.
6 Move chart to the bottom
7 Change data format to transmittance.
8 Change data format to absorbance.
9When Peak/Valley appears, click cursor to check Absorbance(Transmittance) and wavelength value
10 Move cursor to the left.
8. Survey Scan

94
Part Ⅱ. OP
TIZEN P
OP BIO
11 Move cursor to the right.
12 Show Peak & Valley points of graph.
13 Change Peak/Valley Setting
• Save - To save measured data, touch .
1. Select the storage device from .
2. Select the folder.
3. Double click to input file name. Or select the file to be overwritten. Check the file name at .
4. Check at to save as excel form.
5. Touch to store.
6. Touch to eliminate the file.8. Survey Scan

95
Part Ⅱ. OP
TIZEN P
OP BIO
2) Setup
This step allows setting factors to be applied for measurement. Set up name, Cell type, start wavelength, end wavelength, interval, memo and process mode.
▪ Name - Touch and keypad appears. Input file name.
• Cell type - Touch to find proper one and touch to apply.
Default setting is Single cell. (Ref : 10. Cell type - 110page)
• Start Wavelength - Touch to input start wavelength. Default setting is 600nm, and possible wavelength ranges are 190~1100nm.
• End Wavelength - Touch to input end wavelength. Default setting is 600nm, and possible wavelength ranges are 190~1100nm.
• Interval - Touch to set the scanning steps.
• Memo - Touch to write brief information on measurement.
8. Survey Scan

96
Part Ⅱ. OP
TIZEN P
OP BIO
• Process Mode
Fast Mode : Measure without showing process Bar and show all data at once. It is unable to cancel or check the progress during this measurement but fast.
Display Mode : Users can check the progress from the process bar. It is possible to stop the measurement by clicking cancel button.
3) Report
Preview allows displaying measured data, then print out. Device info, Survey Scan Chart, Survey Scan Info. and Survey Scan Data will show up.
And touch to select items to print out.
Touch to print out after reviewing.
8. Survey Scan

97
Part Ⅱ. OP
TIZEN P
OP BIO
4) Survey Scan mode Guideline
1. Touch at the main screen to proceed to Survey Scan Mode.
2. Touch to set the measuring conditions. 8. Survey Scan

98
Part Ⅱ. OP
TIZEN P
OP BIO
3. Modify name, cell type, start wavelength, end wavelength, interval, memo and Process mode as the experiment conditions.
4. Touch to apply setting. [Measurement] screen will show up.
5. Input the blank(reference) sample to cell holder and touch to make Auto zero.
6. After making baseline, input the sample to cell holder and touch to measure.
7. Repeat item 6. for more samples.
8. Results show up as chart and table.
8. Survey Scan

99
Part Ⅱ. OP
TIZEN P
OP BIO
9. Touch to convert the screen as Chart + Data, Chart and Data forms.
8. Survey Scan

100
Part Ⅱ. OP
TIZEN P
OP BIO
10. To save measured data, touch .
11. Select the storage device and folder, Then input file name and touch to save.
Check at to save as excel form.
12. Move to [Report] tap to review measured data or print out.
13. Touch to select items to print out. And touch to apply. Selected
items are applied.
14. Touch to print out after reviewing.
8. Survey Scan

101
Part Ⅱ. OP
TIZEN P
OP BIO
9. Kinetic
This mode is to get variable with time differences. It is easy to check the values of reacting samples. Results show up as table and graph forms.
1) Measurement
1. Input the blank(reference) sample to cell holder and touch to make Auto zero.
2. After making auto zero, input the sample to cell holder and touch to measure.
3. Repeat item 2. for more samples.
4. Results show up as chart and table.
• Hide Chart – Each row, there is a mark box to select chart. Check a mark box to show chart or undo to exclude chart.
9. Kinetic

102
Part Ⅱ. OP
TIZEN P
OP BIO
• Measuring info – touch to convert the screen as Chart + Data, Chart and Data forms. At Chart forms, Functions such as Zoom, Zoom out, Move graph, %T/ABS conversion, and activity are available.
No. Button Description
1 Enlarge chart.
2 Minimize chart (Return to original size)
3 Move chart to the left
4 Move chart to the right.
5 Move chart to the upper direction.
6 Move chart to the bottom
7 Change data format to transmittance.
8 Change data format to absorbance.
9When Peak/Valley appears, click cursor to check Absorbance(Transmittance) and wavelength value
10 Move cursor to the left.
11 Move cursor to the right.
12 Show activity data of pre-set time ranges.
9. Kinetic

103
Part Ⅱ. OP
TIZEN P
OP BIO
13 Change activity setting
• Save - To save measured data, touch .
1. Select the storage device from .
2. Select the folder.
3. Double click to input file name. Or select the file to be overwritten. Check the file name at .
4. Check at to save as excel form.
5. Touch to store.
6. Touch to eliminate the file.
9. Kinetic

104
Part Ⅱ. OP
TIZEN P
OP BIO
2) Setup
This step allows setting factors to be applied for measurement. Set up name, Cell type, wavelength, total time, interval and memo.
▪ Name - Touch and keypad appears. Input file name.
• Cell type - Touch to find proper one and touch to apply.
Default setting is Single cell. (Ref : 10. Cell type - 110page)
• Wavelength - Touch to input wavelength. Default setting is 600nm, and possible wavelength ranges are 190~1100nm.
• Total time - Touch to input total time.
• Interval - Touch to set time interval.
• Memo - Touch to write brief information on measurement.
9. Kinetic

105
Part Ⅱ. OP
TIZEN P
OP BIO
3) Report
Preview allows displaying measured data, then print out. Device info, KIN Chart, KIN Info. and KIN Data will show up.
And touch to select items to print out.
Touch to print out after reviewing.
9. Kinetic

106
Part Ⅱ. OP
TIZEN P
OP BIO
4) Kinetic mode Guideline
1. Touch at the main screen to proceed to Kinetic Mode.
2. Touch to set the measuring conditions. 9. K
inetic

107
Part Ⅱ. OP
TIZEN P
OP BIO
3. Modify name, cell type, wavelength, total time, interval, and memo as the experiment conditions.
4. Touch to apply setting. [Measurement] screen will show up.
5. Input the blank(reference) sample to cell holder and touch to make Auto zero.
6. After making baseline, input the sample to cell holder and touch to measure.
7. Repeat item 6. for more samples.
8. Results show up as chart and table.
9. Kinetic

108
Part Ⅱ. OP
TIZEN P
OP BIO
9. Touch to convert the screen as Chart + Data, Chart and Data forms.
9. Kinetic

109
Part Ⅱ. OP
TIZEN P
OP BIO
10. To save measured data, touch .
11. Select the storage device and folder, Then input file name and touch to save.
Check at to save as excel form.
12. Move to [Report] tap to review measured data or print out.
13. Touch to select items to print out. And touch to apply. Selected
items are applied.
14. Touch to print out after reviewing.
9. Kinetic
110
Part Ⅱ. OP
TIZEN P
OP BIO
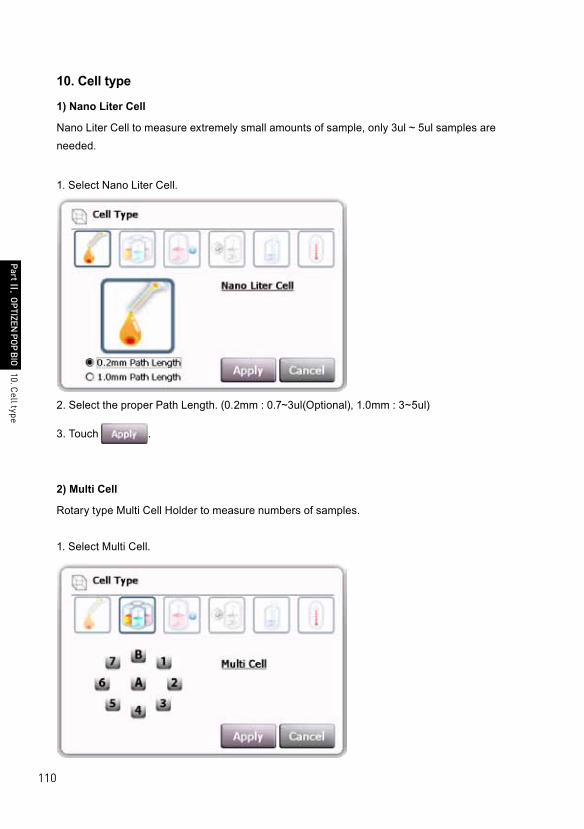
10. Cell type
1) Nano Liter Cell
Nano Liter Cell to measure extremely small amounts of sample, only 3ul ~ 5ul samples are needed.
1. Select Nano Liter Cell.
2. Select the proper Path Length. (0.2mm : 0.7~3ul(Optional), 1.0mm : 3~5ul)
3. Touch .
2) Multi Cell
Rotary type Multi Cell Holder to measure numbers of samples.
1. Select Multi Cell.
10. Cell type
111
Part Ⅱ. OP
TIZEN P
OP BIO
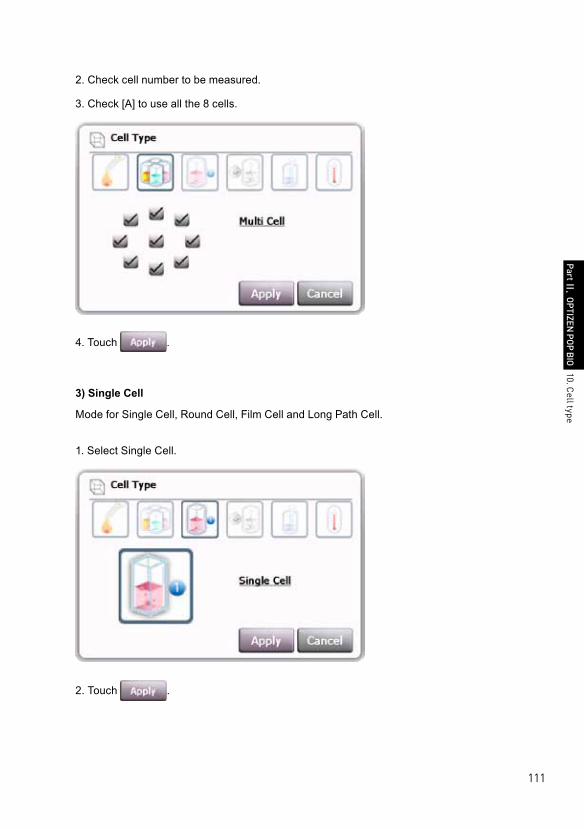
2. Check cell number to be measured.
3. Check [A] to use all the 8 cells.
4. Touch .
3) Single Cell
Mode for Single Cell, Round Cell, Film Cell and Long Path Cell.
1. Select Single Cell.
2. Touch .
10. Cell type

112
Part Ⅱ. OP
TIZEN P
OP BIO
4) Sipper Cell
Mode for Sipper Cell(Flow cell). Aspiration and measurement are regulated by sipper module.
1. Select Sipper Cell.
3. Touch .
4. Proceed to measure mode after setup
Cautions : Aspiration
At the aspiration step, you can see twice aspirations upon clicking ASP button on the
Sipper or touching .
The first aspiration is the sample aspiration as the volume set at the Calibration – Sample mode.
And the second aspiration is the air aspiration for the feeding - moving samples to the measuring point of flow through cell with air.
Please make it sure to aspirate the sample at the first aspiration only and remove the sample tube at the second aspiration for feeding.
10. Cell type
113
Part Ⅱ. OP
TIZEN P
OP BIO
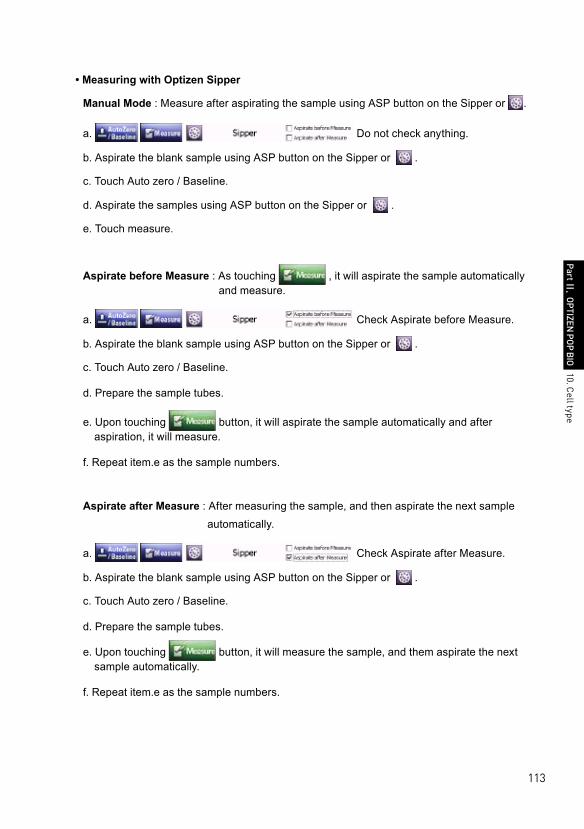
• Measuring with Optizen Sipper
Manual Mode : Measure after aspirating the sample using ASP button on the Sipper or .
a. Do not check anything.
b. Aspirate the blank sample using ASP button on the Sipper or .
c. Touch Auto zero / Baseline.
d. Aspirate the samples using ASP button on the Sipper or .
e. Touch measure.
Aspirate before Measure : As touching , it will aspirate the sample automatically and measure.
a. Check Aspirate before Measure.
b. Aspirate the blank sample using ASP button on the Sipper or .
c. Touch Auto zero / Baseline.
d. Prepare the sample tubes.
e. Upon touching button, it will aspirate the sample automatically and after aspiration, it will measure.
f. Repeat item.e as the sample numbers.
Aspirate after Measure : After measuring the sample, and then aspirate the next sample automatically.
a. Check Aspirate after Measure.
b. Aspirate the blank sample using ASP button on the Sipper or .
c. Touch Auto zero / Baseline.
d. Prepare the sample tubes.
e. Upon touching button, it will measure the sample, and them aspirate the next sample automatically.
f. Repeat item.e as the sample numbers.
10. Cell type

114
Part Ⅱ. OP
TIZEN P
OP BIO
• Calibration
Touch [Calibration] to set the conditions of the Sipper.Check the connection of the Sipper. If it is OK, it will show below message. Then touch [OK] to proceed to calibration mode. If it is not OK, it will show [Check Sipper Cable] message. Then check connection once again.
User can define every items on calibration window.But it may cause malfunctions.‘Before’ line shows current values, and ‘After’ line shows the values to be replaced.To modify the calibration value, input the new values at the ‘After’ line windows, then touch [Apply]. You can see the changes at the ‘Before’ line.Check and touch [Close].
Name Description Details
Speed Aspiration speed. You can select from 1 to 30. Set as the measuring conditions.
CalibrationRevolutions(rotating numbers) of the peristaltic pump per specific volumes.
You can select from 50 to 500. We recommend not to modify it as you choose but to use automatic calibration mode.The calibration values can be changed upon Speed, Tube size ans so on. If the real aspirated volume is different with the set volume, correct it at the automatic calibration mode.
10. Cell type

115
Part Ⅱ. OP
TIZEN P
OP BIO
Sample The sample aspiration volume. You can select from 200 to 5000. The unit is ㎕.
Feed
The air aspiration volume to move samples to the measuring point of flow through cell.
As it can be changed upon Tube length, check if the sample arrives at the measuring point before measuring.
• Automatic Calibration (Aspiration volume calibration)
[Calibration] button at this window is to calibrate the aspiration volume automatically. As you touch [Calibration] button, CAL LED on the sipper will be turned on and sipper proceed to calibration waiting mode.
Usage
1. It is done by calculating revolutions(rotating numbers) of the peristaltic pump per specific sample volume(5 ㎕). Please prepare 5 ㎕ of D.W. before calibration.
2. Touch [Calibration] button to proceed to calibration waiting mode.
3. Aspirate 5 ㎕ of D.W. by pushing CAL button on the sipper.Please note to keep pushing the button until aspirating the whole sample. Caution : Pay attention that aspiration is not interrupted.
4. After the end of aspiration, stop pushing the CAL Button.
5. It will calculate the calibration value automatically at the S/W window. After checking, if the calibration procedures and the values are OK, touch [Apply]
10. Cell type

116
Part Ⅱ. OP
TIZEN P
OP BIO
5) Micro Volume Cell
Mode for Micro Volume Cell.
1. Select Micro Volume Cell.
2. Touch .
6) Temperature Cell
Mode for Temperature Cell Holder precisely regulated by TEC Control System (Peltier type) module. (5~85 ㎕)
1. Select Temp. Cell(TEC).
2. Touch to set the temperature control conditions.
10. Cell type

117
Part Ⅱ. OP
TIZEN P
OP BIO
3. Input Term(duration time) and Temperature. Double click the intended window and input using keypad.
Ex) 0min~10min (duration : 10minutes) : 20℃
10min~60min (duration : 50minutes) : 40℃
60min~70min (duration : 10minutes) : 20℃
Start End Temperature
0 10 20
10 50 40
60 10 20
4. Graph shows temperature profile.
5. Centigrade and Fahrenheit convertible. Temperature will be changed automatically upon your choice.
6. Touch to end the setting.
7. Touch to start temperature control.
10. Cell type

118
Part Ⅱ. OP
TIZEN P
OP BIO
8. Touch .
9. TEC Control System shows temperature status.
10. Cell type
119
Part Ⅱ. OP
TIZEN P
OP BIO
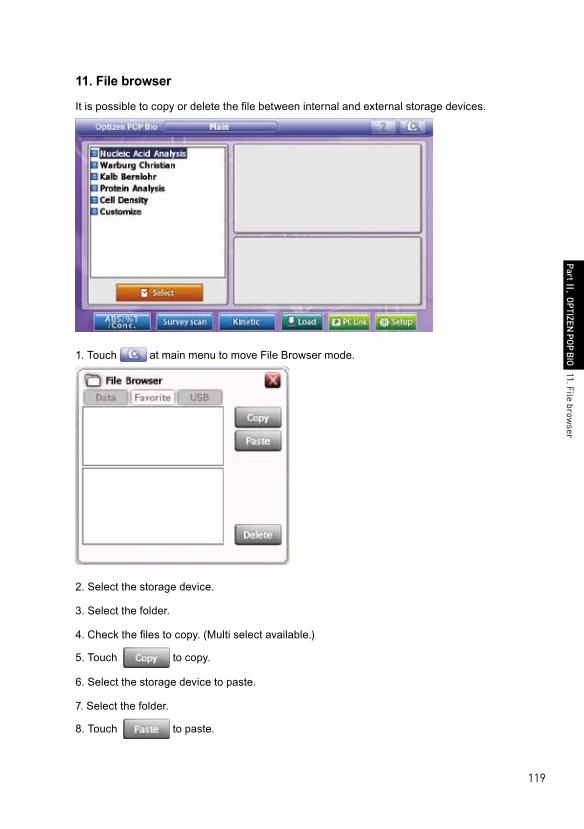
11. File browser
It is possible to copy or delete the file between internal and external storage devices.
1. Touch at main menu to move File Browser mode.
2. Select the storage device.
3. Select the folder.
4. Check the files to copy. (Multi select available.)
5. Touch to copy.
6. Select the storage device to paste.
7. Select the folder.
8. Touch to paste.
11. File browser
120
Part Ⅱ. OP
TIZEN P
OP BIO
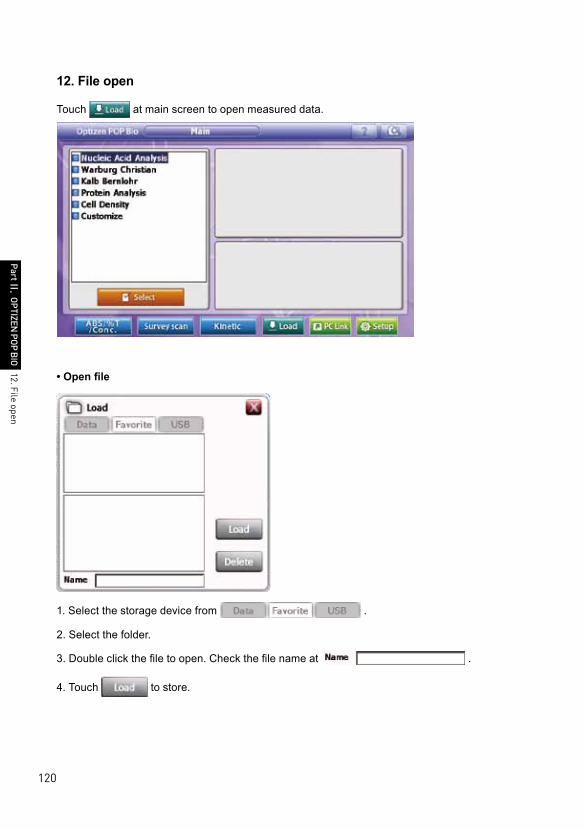
12. File open
Touch at main screen to open measured data.
• Open file
1. Select the storage device from .
2. Select the folder.
3. Double click the file to open. Check the file name at .
4. Touch to store.
12. File open

121
Part Ⅱ. OP
TIZEN P
OP BIO
13. PC link
1. Connect PC, IP router and OPTIZEN POP bio with lan cables.
2. Turn on Optizen POP bio. (Caution : Turn OPTIZEN POP bio on only after connecting OPTIZEN POP bio and IP router. And always check power of IP router with connection. Otherwise PC link cannot be operated. )
3. Touch at the main screen.
4. Check display while connecting PC and Optizen POP bio.
5. Execute OptizenView 4.2 at PC.
6. Open config>options.
13. PC
link

122
Part Ⅱ. OP
TIZEN P
OP BIO
7. In Optizen View 4.2, set up device address as appeared IP address of Optizen POP bio. (Input IP address, then Enter to apply PC link)
8. Touch [Apply], and PC and OPTIZEN POP bio will be connected.
9. It is possible to use OptizenView 4.2 for operating OPTIZEN POP bio.
13. PC
link

123
Part Ⅱ. OP
TIZEN P
OP BIO
14. POP Set
Touch at main screen to move to POP set mode.
Manage application setting, device setting and calibration of OPTIZEN POP bio.
1) Application set
• Initial Wave : Set initial wavelength
• Auto Zero : select Auto Zero working type
Auto [B] : POP will measure 'B' cell and set auto zero automatically. You don't need to touch [Auto Zero] before measuring.
Manual : You have to touch [Auto Zero] before measuring.
• Language : Select language
• : Initialize application Set.
14. PO
P Set

124
Part Ⅱ. OP
TIZEN P
OP BIO
2) Device set
• Lamp Change Wave : Select wavelength point of lamp change. Select between 340~410nm
• Sipper : Use of sipper
• D2 Power Save : Select D2 Lamp power save mode. Without necessity of UV range, check D2 power save 'ON' to extend the lifespan of D2 lamp.
(Caution: Frequent changes of ON/OFF saving mode may create diminution of D2 lamp's lifespan.)
• Sound : select voice guide and sound effect
• Volume : set volume
• Printer : direct connection/network connection
• Printer Option : select display of printer option tab. If you check 'hide', it will print without modifying of the print option.
• Interface : Select PC connecting method
• : initialize Device Set
14. PO
P Set

125
Part Ⅱ. OP
TIZEN P
OP BIO
3) Calibration
• WP : Calibration Factor. 0th point of wavelength
• LP : Calibration Factor. Motor steps to move 1 nm of wavelength
• CP : Multi-cell Holder calibration factor. motor steps to move 1 cell holder at multi cell holder.
• D2 : Used time of D2 lamp
• W : Used time of W lamp
• : Start calibration of WP & LP
• : Start calibration of CP
• : Check and print used time of D2 & W lamps.
• : Initialize calibration value. You must perform calibrating the equipment again
after [Reset].
14. PO
P Set

126
Part Ⅲ
. Technical Supports
Part Ⅲ. Technical Supports
1. Technical Supports
When you have any difficulties of using Optizen POP, Please go through and review with this user’s guide. If troubleshooting does not help to solve troubles, please contact your nearest distributor or producer.
Caution: When contact for after service, must be reported symptom of trouble.
1. Technical Supports

Mecasys Co., Ltd.
Postal code: 305-15010F, 640-3 Bansuk dong, Yuseong-gu, Daejeon, Rep. of KOREA.
Fax : +82-42-485-7118
For technical service E-mail : [email protected]
http://english.mecasys.co.kr


