66
Radon in the Ground Water Drinking Supplies of North Carolina Ted Campbell, NC Division of Water Quality, Aquifer Protection Section [email protected]

Radon in the Ground Water Drinking Supplies of North Carolina
Ted Campbell, NC Division of Water Quality, Aquifer Protection Section [email protected]
Contributors:
Staff of DWQ, Aquifer Protection Section
Dr. Felix Fong, NC Radiation Protection Division
U.S. Environmental Protection Agency
Duke University, Nicholas School of the Environment and Earth Sciences
Staff of the NC Geological Survey

• a radioactive gas produced by the decay of uranium-238
Radon-222

• a radioactive gas produced by the decay of uranium-238
• found everywhere; very mobile; migrates from rock and soils into atmosphere and indoor air
• readily dissolves in water….so it shows up in ground water supplies
Radon-222
• not common in surface waters due to volatilization
• a human carcinogen - 2nd leading cause of lung cancer
• half life of 3.8 days….can’t travel “unsupported” for long distances

Radon-222
• degasses during showering can increase one’s overall exposure and health risk over ambient levels alone
• tends to occur at higher levels in private wells than in public supply wells
• Ongoing debate about “safe” levels in water. However, studies suggest that risks from radon in water are larger than those caused by all other radionuclides in the nation’s water supply.
• In most – though not all – cases, the main source of radon is from underlying rock and soils.

• Radon in water can result in new pathways of exposure (upper floors, for example).
• “10,000 to 1” rule of thumb; but does not account for daily acute doses during showering, for example
Radon-222

Radon Standards
• EPA proposed alternate standard for radon in water = 4000 pCi/L (if a supplier has a radon mitigation program)
In NC, monitoring radon in public water supply wells is voluntary.
Radon is not included in NC’s “new well” sampling list; private well owners are “on their own”.
• EPA proposed standard for radon in water = 300 pCi/L
Water
• EPA “Action Level” = 4 pCi/L
Indoor Air

• Lung cancer (inhalation) and stomach cancer (ingestion)
So what are the risks from radon-222 in water?
• Follows “linear risk” model; any dose above zero carries risk; MCLG = zero
• At 4000 pCi/L: lifetime cancer risk (combined inhalation-ingestion) is greater than lifetime cancer risk from:
arsenic, at MCL of 10 ug/L
combined radium-226 +radium-228, at MCL of 5 pCi/L
uranium, at MCL of 30 ug/L
most other regulated compounds, at their MCL

Some states have begun to establish their own standards/advisories.
Examples: Connecticut = 5,000 pCi/L
Vermont = 5,000 pCi/L
Massachusetts = 10,000 pCi/L
New Hampshire = 2,000 pCi/L
Maine = 4,000 pCi/L
Wisconsin = 5,000 pCi/L
New Jersey = 300 pCi/L
Standard does not exist for NC.

For perspective…
Radon
Across USA
75% of wells are above 300 pCi/L
Radon 9% of wells are above 4000 pCi/L
Nitrate 8% of wells are above 10 mg/L (MCL)
Arsenic 11% of wells are above 10 ug/L (MCL)
(Focazio and others, 2006)

• geology and soil permeability• gamma-ray fly-overs (U and Ra detected at land surface; NURE, 70s and 80s)
• indoor radon levels
• typical home construction (slab, basement, crawl space)
Map was developed based on:
Predicted indoor radon across USA

General Patterns of Radon Occurrence in the US
Rn exceeds 4000 pCi/L in about 9% of private wells in the USA (Focazio and
others)
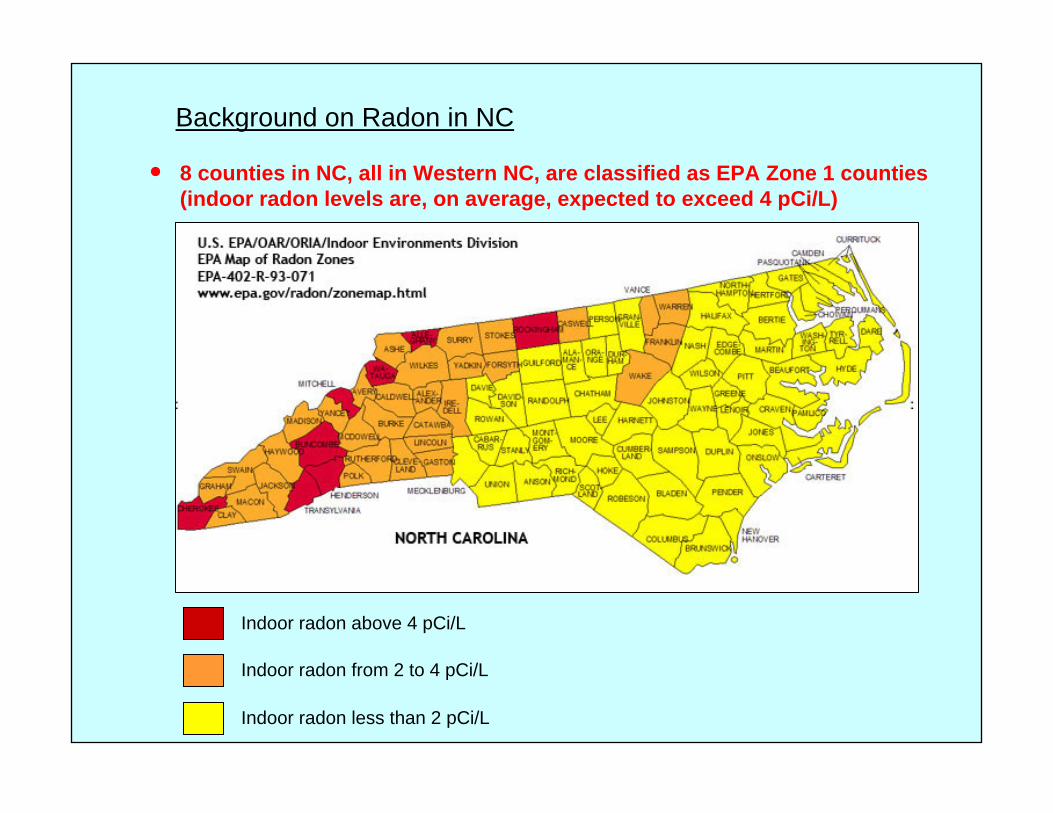
Background on Radon in NC
8 counties in NC, all in Western NC, are classified as EPA Zone 1 counties (indoor radon levels are, on average, expected to exceed 4 pCi/L)
Indoor radon above 4 pCi/L
Indoor radon from 2 to 4 pCi/L
Indoor radon less than 2 pCi/L

Indoor Radon in NCabove 8 pCi/L
above 20 pCi/L
Meta-igneous rocks
* Data from Airchek, Inc, 2006n = 16,384max = 2146 pCi/Lmedian = 1.6 pCi/LGuilford, Forsyth, Wake
EPA Zone 1 Counties

Background on Radon in NC
8 counties in NC, all in Western NC, are classified as EPA Zone 1 counties (indoor radon levels are, on average, expected to exceed 4 pCi/L)
Uranium-rich rock exists across region

Blue Ridge Belt
Inner Pied
mont Belt
Charlotte
Belt
Carolin
a Slate
Belt
Raleig
h Belt
Coastal
Plain
Major Geologic Belts in NC
Meta-igneous rocks
Uranium rich rock in NC
Granit
e, gn
eiss,
and s
chist
Granite
, gne
iss, a
nd sc
hist
Granite, g
neiss
, and sc
hist
NC minerals high in uranium include: monazite, allanite, and uraninite
Meta-igneous rocks tend to be higher in
uranium content

Background on Radon in NC
About half of the population uses ground water as its principal drinking water supply
8 counties in NC, all in Western NC, are classified as EPA Zone 1 counties (indoor radon levels are, on average, expected to exceed 4 pCi/L)
Uranium-rich rock exists across region

Background on Radon in NC
Elevated radon and other radionuclides have been found in ground water of the Piedmont and Mountains of NC since the 1970s
Existing data
About half of the population uses ground water as its principal drinking water supply
8 counties in NC, all in Western NC, are classified as EPA Zone 1 counties (indoor radon levels are, on average, expected to exceed 4 pCi/L)
Uranium-rich rock exists across region

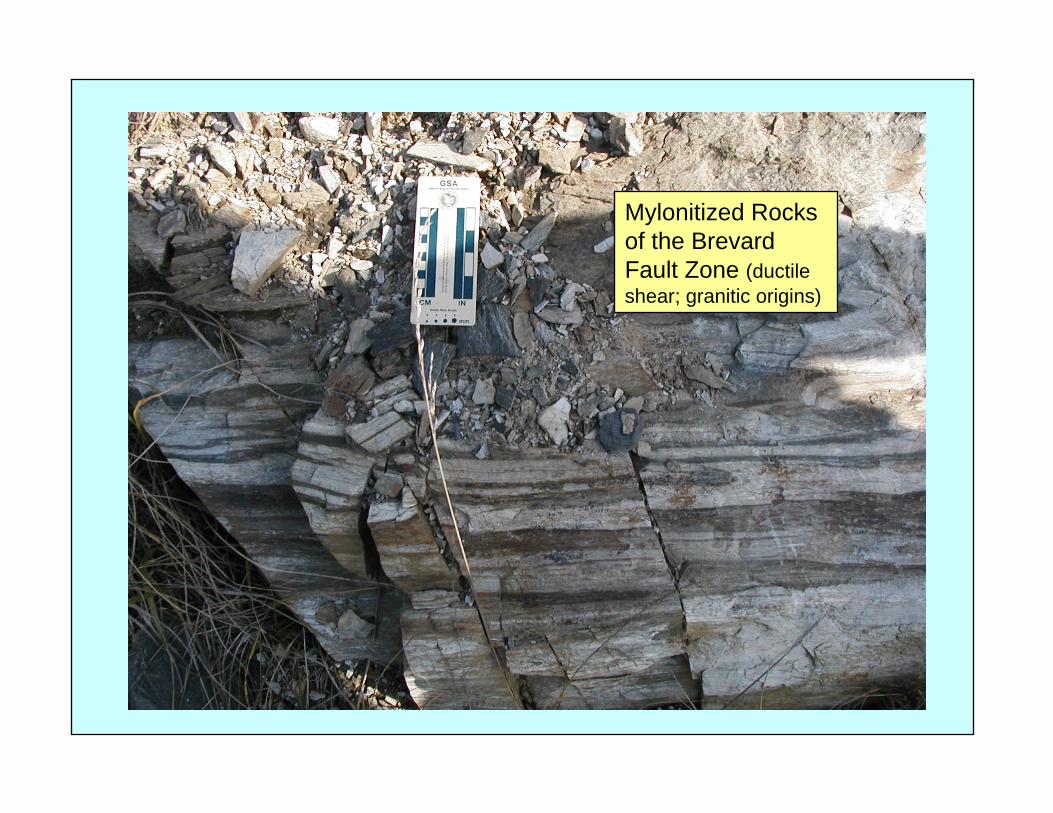
Henderson gneiss near Brevard Mylonitized Rocks
of the Brevard Fault Zone (ductile shear; granitic origins)
From NURE database, Geochemical Atlas of NC (Reid, 1991)
Raleig
h Belt
Carolin
a Slate
Belt
Charlotte
Belt
Existing data
1983 - Menetrez & Watson; and Fong (2004)
- 2.4% of suppliers exceeded EPA MCLs for gross alpha or combined radium
- 2000 suppliers
15 pCi/L 5 ug/L

Existing data
- 211 PWS wells across NC
1975 -
- Median radon across NC ~ 1400 pCi/L
Aldridge, Sasser, and Conners
- Average radon across Western NC ~ 4100 pCi/L
1974 - Environmental Science Lab
- 60% contained radon above 2000 pCi/L
- Lowest radon levels are in Coastal Plain, and highest are in Mtns & Piedmont.
- 204 PWS wells across NC
Radon in NC Ground Water

Existing data
granitesgneisses
- 96 suppliers
1987 - Loomis, Watson, & Crawford-Brown
- Rock type effects radon levels.
- Well yield, depth, and casing length were not predictors of radon levels.
maficssedimentary rocks of the Coastal Plain
High variability
within subtypes
Radon in NC Ground Water

Existing data
1993 - University of North Carolina
- 83% contained radon above 2000 pCi/L
- 277 private wells across mountains of NC
1975 to Current 1) Many counties still have very limited radon-in-water data. 2) Comprehensive studies underway in parts of Raleigh Belt and Blue Ridge and Inner Piedmont Belts.
Radon in NC Ground Water

Blue Ridge Belt
Inner Pied
mont Belt
Charlotte
Belt
Carolin
a Slate
Belt
Raleig
h Belt
Coastal
Plain
Current Studies
Counties with known susceptibility to elevated radon in ground water *
Radon in NC Ground Water

Guilford
Orange
Wake
Meta-igneous rock
Franklin
Median = 735 pCi/L
Max = 6,300 pCi/L(70 private wells)
(Spruill and others, 1997)
Felsic and mafic igneous and meta-igneous rock
Median = 586 pCi/L
Max = 4,229 pCi/L(42 wells)
(Orange Co. staff, 1997)
Metamorphosed granitic rock
Granitic plutonsRaleigh
gneiss
Median = 2800 pCi/L
Max = 32,000 pCi/L(305 private wells - Phase I & II)
(Cornell and others, 2005)
(Bolich and Stoddard, 2004)
27 wells above 10,000 pCi/L
60 wells above 4,000 pCi/L
Slate Belt and Raleigh Belt

• 2005 - sampled 103 private wells (Buncombe, Henderson, and Transylvania Counties -- all EPA Zone 1 counties)
• focused more heavily on areas underlain by meta-igneous rocks
radionuclides other parameters well construction
radon DO well depthuranium, total pH casing depthgross alpha activity spec cond well yieldradium-226 ORP latituderadium-224 temperature longituderadium-223 alkalinity observed local geologyindoor radon iron
manganese
• analyzed:
• 2006 - sampled 78 private wells (Buncombe, Henderson, Transylvania, Mitchell, Madison, Watauga, Jackson)
Blue Ridge and Inner Piedmont Belts

• Where do radionuclides occur and at what levels?
• What factors control radionuclide levels in our study area?
NCDWQ Study is Addressing 3 Questions
• What are the policy implications?

EPA Zone 1 Counties
Meta-igneous rock
EPA Zone 1 CountiesBlue Ridge
Piedmont
Coastal Plain
Meta-igneous rock
Buncombe
Henderson
Transylvania
Study Area
Sampled wells
Meta-igneous rocks
Includes granites and granitic gneisses (Henderson, Toxaway, Caesar’s Head)
Meta-sedimentary rocks
Includes schists, metagraywackes, and metavolcanics of the Ashe Metamorphic Suite
103 private wells
2005

Henderson gneiss near Brevard
Henderson gneiss near Rosman
Henderson gneiss near Brevard Mylonitized Rocks
of the Brevard Fault Zone (ductile shear; granitic origins)

Above 8 pCi/L
Indoor radonSource: data from Airchek, Inc, obtained 2005
Meta-igneous rockMetasedimentary rock

Above 20 pCi/L
Indoor radonSource: data from Airchek, Inc, obtained 2005
Meta-igneous rockMetasedimentary rock

Above 50 pCi/L
Indoor radonSource: data from Airchek, Inc, obtained 2005
Meta-igneous rockMetasedimentary rock

Above 100 pCi/L
Indoor radonSource: data from Airchek, Inc, obtained 2005
Meta-igneous rockMetasedimentary rock
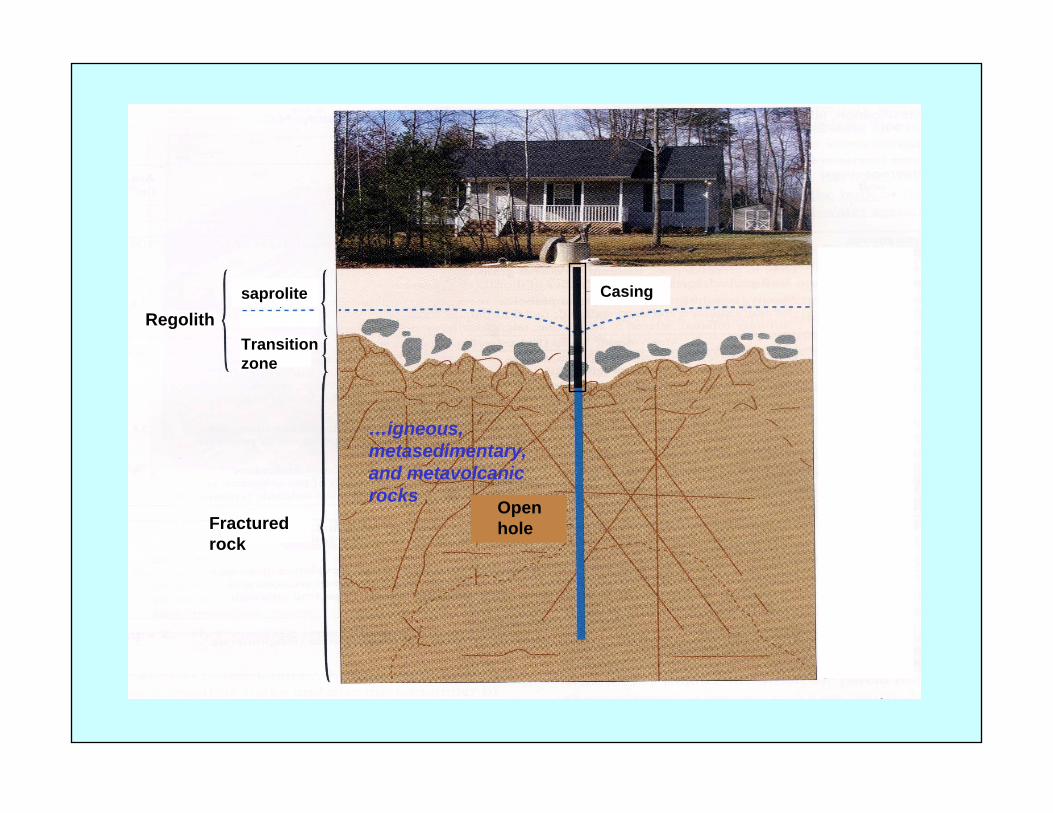
Open hole
CasingsaproliteRegolith
…igneous, metasedimentary, and metavolcanicrocks
Transition zone
Fractured rock
Open hole

Wells are open hole in fractured rock (granite, gneiss, schist, metagraywackes,…) typically about 100 to 600 ft deep
Ground water is slightly acidic, oxidizing, and minimally conductive
Depth to water ranges from a few feet to tens of feet below land surface
Scale = Regional
pH Spec Cond Temp DO ORPuS/cm C mg/L mV
median value (103 wells) 6.2 65 14.8 7.4 308

Summary of 2005 Data – 103 private wells
Counties sampled: Buncombe, Henderson, Transylvania
Radionuclide No. of wells Range Median% above proposed
MCL
% above proposed
alternate MCL
RADON, pCi/L 103 109 - 45600 6060 96% 64%URANIUM, ug/L 103 BDL - 63 <1 2% n/a
GROSS ALPHA, pCi/L 103 BDL - 56 1 3% n/aRADIUM-226, pCi/L 103 BDL - 1.4 0.1 0% n/a
INDOOR RADON, pCi/L 67 homes 0.3 - 23 2.7 34% n/a

Meta-igneous rockMetasedimentary rock
Radon above proposed MCL of 300 pCi/L
Uranium above MCL of 30 ug/L
Gross alpha above MCL of 15 pCi/L
Results of 2005 data – 103 private wells
Buncombe
HendersonTransylvania

Radon above 300 pCi/L
Meta-igneous rockMetasedimentary rock
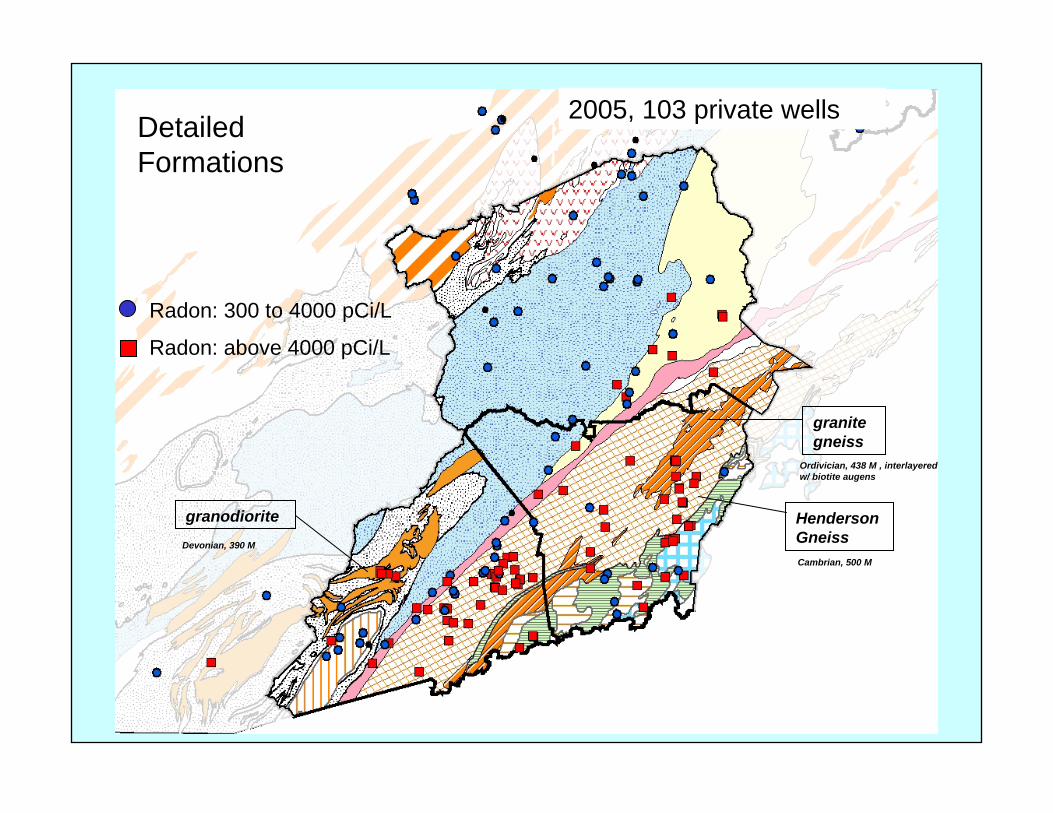
2005, 103 private wells

Radon above 4,000 pCi/L
Meta-igneous rockMetasedimentary rock
2005, 103 private wells

Radon above 10,000 pCi/L
Meta-igneous rockMetasedimentary rock
(30X proposed MCL)
2005, 103 private wells

Radon above 20,000 pCi/L
Meta-igneous rockMetasedimentary rock
(60X proposed MCL)
2005, 103 private wells

FACTORS THAT CONTROL OCCURRENCE

Wells in meta-igneous rock tended to have higher dissolved radon than wells in meta-sedimentary rock…
0
1000
2000
3000
4000
5000
6000
7000
8000
9000
Meta-igneous Meta-sedimentary Brevard fault zone
Dissolved Radon, pCi/L
Median Radon, All Data
6060 pCi/L
63 wells 39 wells 5 wells
3110
7680
3820
Geology
Met
a-ig
n eou
s
Met
a-se
dim
ent a
ry
Br e
var d
Fa
ult
Radon above 20,000 pCi/L
Meta-igneous rockMetasedimentary rock
(60X proposed MCL)
Henderson Gneiss
granite gneiss
granodiorite
Radon: above 4000 pCi/L
Radon: 300 to 4000 pCi/L
Cambrian, 500 M
Devonian, 390 M
Ordivician, 438 M , interlayered w/ biotite augens
2005, 103 private wellsDetailed Formations

Dissolved oxygen
• Most wells were oxic
• Oxic ground water was higher in radon-222 and uranium
• Oxic ground water was lower in radium-226
Ground water geochemistry No. of samples Radon, pCi/L Ra-226, pCi/L Uranium, ug/L
oxidizing 98 8018 0.15 1.8reducing or moderately reducing 5 1930 0.37 near zero
"Radon:Radium-226" ratio
0
50000
100000
150000
200000
250000
oxidizing conditions reducing conditions
Radon/Radium-226 ratio
oxidizing reducing
Oxidizing vsReducing Conditions
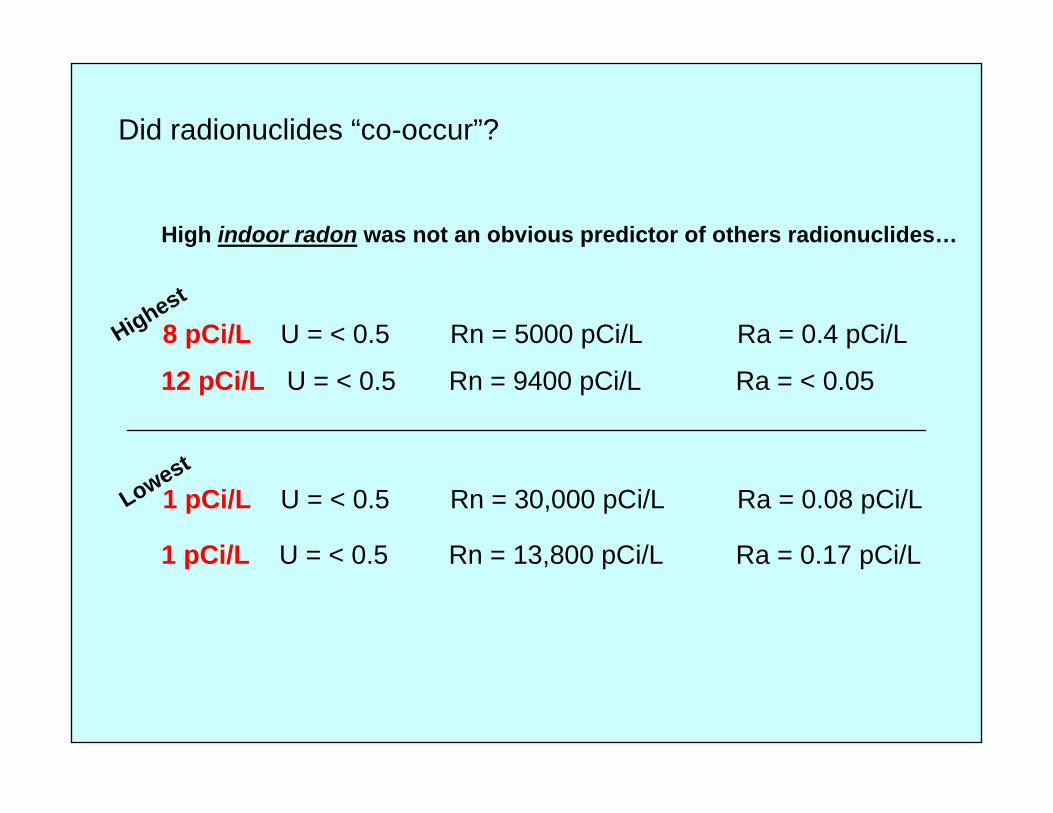
High indoor radon was not an obvious predictor of others radionuclides…
8 pCi/L U = < 0.5 Rn = 5000 pCi/L Ra = 0.4 pCi/L
12 pCi/L U = < 0.5 Rn = 9400 pCi/L Ra = < 0.05
1 pCi/L U = < 0.5 Rn = 30,000 pCi/L Ra = 0.08 pCi/L
1 pCi/L U = < 0.5 Rn = 13,800 pCi/L Ra = 0.17 pCi/L
Highest
Lowest
Did radionuclides “co-occur”?

Rn = 45,600 pCi/L U = < 0.5 ug/L Ra = 0.03 pCi/L
Rn = 37,300 pCi/L U = 1.4 ug/L Ra = 0.03 pCi/L
Rn = 2750 pCi/L U = 63 ug/L Ra = 0.33 pCi/L
High radon was not an obvious predictor of others radionuclides…
Highest
Low/moderate
Did radionuclides “co-occur”?

U = 63 ug/L Rn = 2,800 pCi/L Ra = 0.3 pCi/L
U = 16 ug/L Rn = 5210 pCi/L Ra = 1.4 pCi/L
High uranium was not an obvious predictor of others radionuclides…
Highest
Did radionuclides “co-occur”?

Isotope disequilibrium
• Dissolved radon 3 to 5 orders of magnitude higher than 226Ra and uranium
• Radium isotopes were used to determine source rock (U vs Th) and radon transfer mechanisms
Radon levels were not correlated with hydrologic setting, well depth, casing depth, well yield, Fe, or Mn

2006 – 78 private wells
Counties sampled: Buncombe, Henderson, Transylvania, Mitchell, Madison, Watauga, Jackson
Awaiting results from lab
Radionuclide No. of wells Range Median% above
proposed MCL
% above proposed
alternate MCL
RADON, pCi/L 78 87 - 15742 pCi/L 1897 96% 31%URANIUM 75 BDL - 30 ug/L 0.5 1%
RADIUM-226 75 BDL - 2.2 pCi/L 0.3 0%RADIUM-228 75 BDL - 1.1 pCi/L 0.1 0%
INDOOR RADON 55 homes BDL - 19.6 pCi/L 1.7 29%

Rn: greater than 4000 pCi/L
Meta-igneousMetasedimentary
Rn: 300 to 4000 pCi/L
Rn: less than 300 pCi/L
2006 – 78 wells Watauga
Mitchell
Madison
Buncombe
Henderson
TransylvaniaJackson

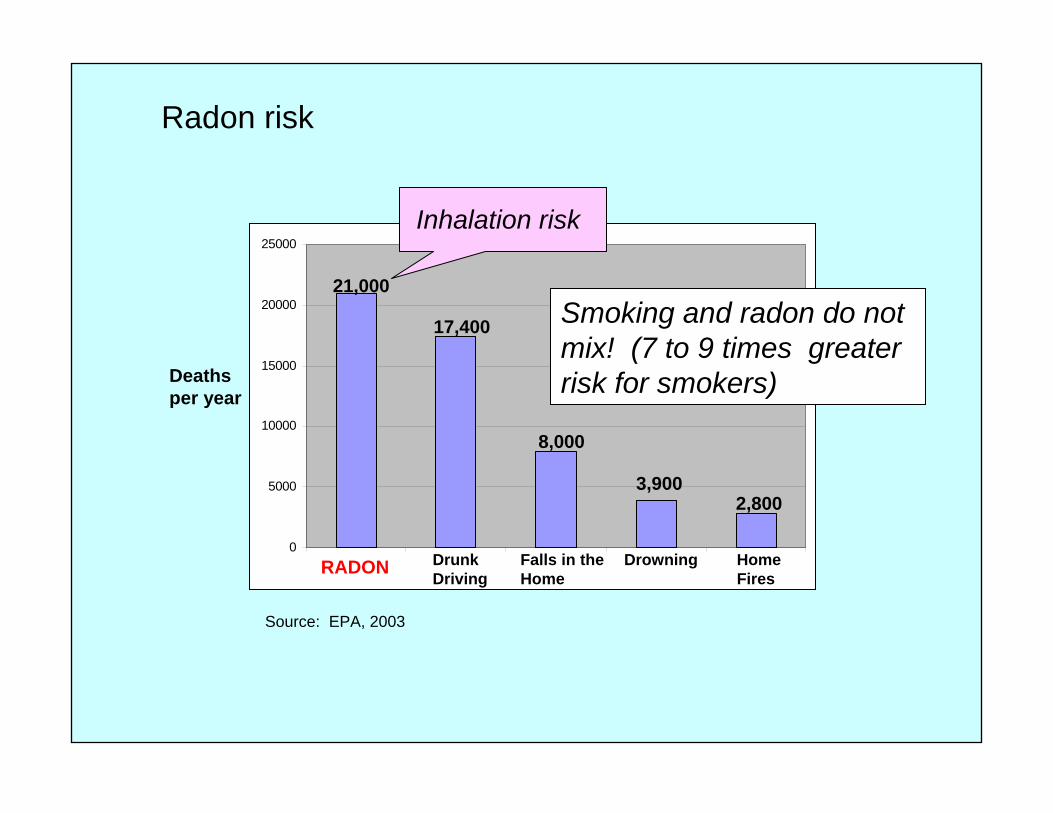
HEALTH RISKS FOR RADON

Radon is a Class “A” Carcinogen.
0
5000
10000
15000
20000
25000
1 2 3 4 5RADON Drunk Driving
Falls in the Home
Drowning Home Fires
21,000
17,400
8,000
3,9002,800
Deaths per year
Source: EPA, 2003
Radon risk
Inhalation risk
Smoking and radon do not mix! (7 to 9 times greater risk for smokers)

Radon in Air
• National average for ambient (outdoor) radon is 0.4 pCi/L.
• National average indoor radon is 1.3 pCi/L.
• EPA “Action Guideline” is 4.0 pCi/L.

Radon in water can result in new pathways of exposure (upstairs living areas, for example)
Off gassing of shower water can result in increased overall radon exposure…
Risks of radon in water are associated with off gassing to indoor air
Radon in Water
Radon in water (inhalation exposure) results in a few hundred US deaths per year (studies ongoing)

Rn in water => Rn in air

HEALTH RISKS FOR RADON

Testing and Mitigation
• testing is easy; as low as $10 for indoor radon test and $25 for radon-in-water test
• radon can be removed from indoor air by sub-slab depressurization ($1000 to $2000)

Sub-slab depressurization

• One should consider the levels of both indoor radon and radon in water when determining an optimal mitigation system
• radon can be removed from a water supply by aeration ($2500 to $4000), storage, or GAC filter (~$1000 to $1500, but disposal may be costly)
Aeration

Summary
• Elevated radon occurs in the ground water drinking supplies in several areas of NC, particularly in the Blue Ridge, Inner Piedmont, and Raleigh Belts.
• Elevated radon is associated with meta-igneous rocks (granites and granitic gneisses).
• Geochemistry controls radionuclide solubility and occurrence.
• Degassing from water during showers results in an acute (short term) daily dose over that of ambient conditions.

• Main source of indoor radon is from underlying rock and soils.
• Risk of radon in water is much greater from inhalation than from ingestion.
• Risk from exposure to radon rich water is greater than the risk from exposure to most other regulated compounds
Summary

Meta-igneous rocks
Indoor Air Radon in NC
3 to 4 pCi/L
* Data from Airchek, Inc, 2006n = 16,384max = 2146 pCi/Lmedian = 1.6 pCi/L

Ted Campbell, NC Division of Water Quality, Aquifer Protection Section
For more information:
http://h2o.enr.state.nc.us/admin/pubinfo/DWQPubInfoHotTopics.htm
Final report available: Radionuclides in Ground Water Drinking Supplies in Western NC, 2005


