Page 1
Radon Monitoring and Data Collection in the
United States
Environmental Public Health Tracking Network
Radon Task Force
Norman Anderson, Maine Center for Disease Control and Prevention
Mike Brennan, Washington State Department of Health
Eric Brown, Colorado Department of Public Health and Environment
John Colby, New Hampshire Department of Health
Roger Gibson, Missouri Department of Health and Senior Services
Morgan Hoenig, Ross Strategic
Chrys Kelley, Colorado Department of Public Health and Environment
Barbara Malczewska-Toth, New Mexico Department of Health
Clifford Mitchell, Maryland Department of Health and Mental Hygiene
Jane Mitchell, Colorado Department of Public Health and Environment
Michele Monti, CDC, NCEH- Environmental Health Tracking Branch
Aimee Morrow, South Carolina Department of Health and Environmental Control
Kris Schwartz, Missouri Department of Health and Senior Services
Louis Sweeny, Ross Strategic
Robert Whitcomb, CDC, NCEH-Radiation Studies Branch
May 2014
Page 2
Contents
1 Introduction ......................................................................................................................... 1
1.1 The Radon Task Force .................................................................................................. 1
1.2 EPA Radon State Data Exchange (RSDX) ................................................................... 1
2 Background: Radon and Its Characteristics ........................................................................ 2
2.1 What is Radon? ......................................................................................................... 2
2.2 Important Radon Characteristics ............................................................................... 2
[This section adapted from USGS, The Geology of Radon,
http://energy.cr.usgs.gov/radon/georadon/3.html] ............................................................. 2
2.3 Key Exposure Pathways ........................................................................................... 3
2.4 Health Impacts .......................................................................................................... 4
3 Key Radon Public Health Interventions ............................................................................. 4
3.1 Public Outreach and Education ................................................................................. 4
3.2 Hazard Assessment ................................................................................................... 5
3.3 Radon Mitigation ...................................................................................................... 5
3.4 Assurance of Testing and Mitigation – Radon Control Programs ............................ 6
4 Radon Data Sources ............................................................................................................ 6
4.1 Radon Test Data ........................................................................................................ 6
4.2 Key Data Gaps .......................................................................................................... 7
4.3 Behavioral Risk Factor Surveillance System (BRFSS) ............................................ 7
5 Considering Radon Nationally Consistent Data Measures: Candidate Measures and
Challenges .......................................................................................................................... 8
5.1 Overview of Candidate Measures and Challenges ................................................... 8
5.2 Candidate Measure: Basic Public Awareness ........................................................... 8
5.3 Candidate Measure: Radon Testing Prevalence ....................................................... 9
5.4 Candidate Measure: Prevalence of Elevated Radon Levels ...................................... 9
5.5 Candidate Measure: Mitigation Rate ........................................................................ 9
5.6 Candidate Measure: Mitigation Effectiveness ......................................................... 10
5.7 Additional Measures ............................................................................................... 10
6 Considering a National Radon Database .......................................................................... 10
7 Recommendations ............................................................................................................. 11
8 References ......................................................................................................................... 13
Appendix A: Maine Case Study ................................................................................................... 14
Synopsis ............................................................................................................................ 14
Page 3
Introduction ....................................................................................................................... 14
Ideal set of Indicators ........................................................................................................ 15
Maine’s Radon Data ......................................................................................................... 15
BRFSS: Behavioral Risk Factor Surveillance System: .................................................... 17
Summary of findings: ....................................................................................................... 18
Moving forward ................................................................................................................ 18
Database Development ..................................................................................................... 18
Appendix B: EPHT Radon Task Force Grantee State BRFSS Collection Practices .................... 20
Appendix C: EPHT Radon Task Force Starting Matrix: Data collection practices in selected
states. ............................................................................................................................................. 21
Page 4
1 | P a g e
1 Introduction
This white paper was prepared by members of the Radon Task Force of the Environmental
Public Health Tracking Program (EPHTP) to investigate the merits (opportunity, cost and value)
of developing public health indicators associated with residential exposure to naturally occurring
radon gas. The current status of radon monitoring and data collection in the U.S. and the
suitability of these data for inclusion in the EPHTN are described. Significant challenges in
using the current data and improving the quality and quantity of available radon data are also
addressed. Recommendations are provided to resolve issues prior to use of the data. This white
paper was intended for use by members of the EPHT Radon Task Force and the greater EPHTP.
1.1 The Radon Task Force
The Radon Task Force was established during 2010 to explore existing datasets on radon and the
feasibility of using those data for the CDC/NCEH Environmental Public Health Tracking
Program (EPHTP). Environmental public health tracking is the ongoing collection, integration,
analysis, and interpretation of data about environmental hazards, exposure to environmental
hazards, and health effects potentially related to exposure to environmental hazards. The tracking
program has been successful in developing a nationwide environmental public health tracking
network (EPHTN) and in developing capacity in environmental health within state and local
health departments.
A small workgroup of interested states--Maine, Maryland, Missouri, New Mexico, Oregon,
Washington, and Wisconsin--met on a monthly basis to discuss their efforts and progress in
determining the availability, quality, and compatibility of residential radon test data. If the data
were found usable for the EPHTN, further discussion would define appropriate uses, linkages
and data communication strategies.
1.2 EPA Radon State Data Exchange (RSDX)
The Environmental Protection Agency (EPA) formed the Radon State Data Exchange (RSDX) to
better coordinate the collection and aggregation of radon data. This partnership effort included
federal agencies, states, tribes, and the radon industry. The intent was to create a national
database with state-level input to collect radon data so that it could be shared and combined with
other data on a national scale allowing for better analyses or other ways to accommodate users’
needs. This group was interested in using the EPHTN as a platform to store the database and to
display important indicators created from the database to educate and inform the public. An
important function of this group was to identify the core data elements that would be collected by
a national radon database.
Representatives from both groups came together to determine if the EPHTN could serve as an
appropriate platform for the national radon database. Efforts are still underway to secure
resources to develop, test, and pilot a database.
Page 5
2 | P a g e
2 Background: Radon and Its Characteristics
2.1 What is Radon?
Radon is a naturally occurring radioactive gas that is created as part of the natural radioactive
decay chain of uranium. Radon levels vary by location and can accumulate in structures. It can
also be found in some natural water sources. Radon is not produced as a commercial product,
nor created as a byproduct of a manufacturing process.
Epidemiological studies have shown a causal association between radon exposure and lung
cancer development.1 The EPA states that radon is the second most frequent cause of lung
cancer, after cigarette smoking, causing approximately 21,000 lung cancer deaths per year in the
United States.2 It is the number one cause of lung cancer among non-smokers, according to EPA
estimates.2
2.2 Important Radon Characteristics
[This section adapted from USGS, The Geology of Radon,
http://energy.cr.usgs.gov/radon/georadon/3.html]
All rocks contain some uranium, although most contain just a small amount—between 1 and 3
parts per million (ppm) of uranium. In general, the uranium content of a soil will be about the
same as the uranium content of the rock from which the soil was derived. The uranium content of
soils varies widely depending on local geology.
Because radon is a gas, it has much greater mobility than uranium and radium, which are fixed in
the solid matter in rocks and soils. Radon can more easily leave the rocks and soils by escaping
into fractures and openings in rocks and into the pore spaces between grains of soil. The ease and
efficiency with which radon moves in the pore space or fracture affects how much radon enters a
house. If radon is able to move easily in the pore space, then it can travel a great distance before
it decays, and it is more likely to collect in high concentrations inside of a building. The method
and speed of radon's movement through soils is controlled by the amount of water present in the
pore space (the soil moisture content), the percentage of pore space in the soil (the porosity), and
the "interconnectedness" of the pore spaces that determines the soil's ability to transmit water and
air (called soil permeability). Radon moves more rapidly through permeable soils, such as coarse
sand and gravel, than through impermeable soils, such as clays. Fractures in any soil or rock
allow radon to move more quickly.
Radon moving through soil pore spaces and rock fractures near the surface of the earth usually
escapes into the atmosphere. Where a structure is present, however, soil air often flows toward
its foundation for three reasons: (1) differences in air pressure between the soil and the structure,
(2) the presence of openings in the structure's foundation, and (3) increases in permeability
around the foundation. .
Page 6
3 | P a g e
The air pressure in the ground around most structures is often greater than the air pressure inside
the structure. Thus, air tends to move from the disturbed zone and gravel bed into the structure
through openings in the foundation. All foundations have openings such as cracks, utility entries,
seams between foundation materials, and uncovered soil in crawl spaces and basements. Most
structures draw less than one percent of their indoor air from the soil; the remainder comes from
outdoor air, which is generally quite low in radon. Structures with low indoor air pressure, poorly
sealed foundations, and several entry points for soil air, however, may draw as much as 20
percent of their indoor air from the soil. Even if the soil air has only moderate levels of radon,
levels inside the structure may be very high.
SOURCE: USGS, The Geology of Radon, http://energy.cr.usgs.gov/radon/georadon/3.html
2.3 Key Exposure Pathways
[This section adapted from Agency for Toxic Substances & Disease Registry (CDC), Radon
Toxicity, http://www.atsdr.cdc.gov/csem/csem.asp?csem=8&po=6]
The average person in the US receives an estimated 625 millirem (mrem)/year dose from
ionizing radiation. The largest percentage is from medical radiation (48 percent, 300 mrem),
primarily due to the use of computed tomography (CT) scans and nuclear medicine. This is
followed by radon (37 percent, 228 mrem), which is the largest source of background radiation.
While the dose from radon has remained the same over the years, the percentage that it
represents has dropped from 55 percent, based on 1980s data, to 37 percent using 2006 data. Due
to the increased use of certain medical procedures, this trend is expected to continue (NCRP
2009). The dose of ionizing radiation from radon comes from soil, water, natural gas, and
building materials.
The primary pathway for human exposure to radon is inhalation from soil vapor intrusion into
dwellings and buildings. Indoor radon levels can, however, also originate from water usage,
outdoor air infiltration, and the presence of building materials containing radium (EPA 2003).
The main source of inhalation exposure is radon gas that is released from the soil into an indoor
environment and trapped in indoor air. Background levels of radon in outdoor air are generally
quite low and represent a target for reducing indoor levels. But radon levels can vary based on
location and soil geology. In indoor locations, such as homes, schools, or office buildings, levels
of radon and radon progeny are generally higher than are outdoor levels. This is especially true
of newer construction that is more energy-efficient. In new construction, indoor radon levels may
actually increase, due in part to decreased air entry or exit (i.e., natural ventilation from
outdoors) in such energy-efficient homes. Radon releases from groundwater also contribute to
exposure. Measurement of radon in water is not within the scope of this white paper.
SOURCE: Agency for Toxic Substances & Disease Registry (CDC), Radon Toxicity,
http://www.atsdr.cdc.gov/csem/csem.asp?csem=8&po=6
Page 7
4 | P a g e
2.4 Health Impacts
[This section adapted from SOURCES: U.S. EPA, Radon Health Risks,
http://www.epa.gov/radon/healthrisks.html and CDC, ATSDR Case Studies in
Environmental Medicine: Radon Toxicity, http://www.atsdr.cdc.gov/csem/radon/radon.pdf]
The U.S. EPA has estimated that about 21,000 lung cancer deaths each year in the U.S. are
radon-related. As noted above, exposure to radon is the second leading cause of lung cancer after
smoking. Radon is a source of ionizing radiation and a proven carcinogen. Lung cancer is the
only known effect on human health from exposure to radon in air. Children have higher
estimated radiation doses due to the differences in their lung shape and size, and their higher
respiration rates compared with adults. Risk of lung cancer in children resulting from exposure
to radon may be almost twice as high as the risk to adults exposed to the same amount of radon.
If children are also exposed to tobacco smoke, the risk of lung cancer is at least twenty times
greater. For smokers, the risk of lung cancer is much greater than for non-smokers due to the
synergistic effects of radon and smoking, with the risk for smokers being ten times the risk for
nonsmokers or more.
Two studies, a North American study that combined data from seven case-control studies3 and a
European study that combined data from thirteen case-control studies4 showed evidence of an
association between residential radon exposure and lung cancer development. These two studies
go a step beyond earlier findings. They support the radon health risks predicted by occupational
studies of underground miners who breathed radon for a mean exposure period of 6 years.5
The radon health risk is underscored by the fact that in 1988, Congress added Title III on Indoor
Radon Abatement to the Toxic Substances Control Act. It codified and funded EPA’s then
fledgling radon program. Also that year, the Office of the U.S. Surgeon General issued a warning
about radon urging Americans to test their homes and to reduce the radon level when necessary
(U.S. Surgeon General).
SOURCE: U.S. EPA, Radon Health Risks, http://www.epa.gov/radon/healthrisks.html and
CDC, ATSDR Case Studies in Environmental Medicine: Radon Toxicity,
http://www.atsdr.cdc.gov/csem/radon/radon.pdf
3 Key Radon Public Health Interventions
3.1 Public Outreach and Education
Radon programs typically emphasize public outreach and education to encourage testing and
mitigation where high levels are found. As discussed below, several methods are used to measure
the coverage and effectiveness of outreach and education efforts. These include overall testing
and mitigation rates, changes in testing rates (due to specific outreach “pushes”), and
testing/mitigation rates estimated via the Behavioral Risk Factor Surveillance System (BRFSS).
Page 8
5 | P a g e
3.2 Hazard Assessment
Radon testing should be conducted in any building or basement where its location and
characteristics suggest that elevated levels could be found and significant exposures to people are
possible. Testing is the only way to determine the radon levels of a structure. There are no
immediate symptoms that will alert a person to the presence of radon. It typically takes years of
exposure before any health problems can be diagnosed.
Inexpensive test kits can be obtained through state and local radon testing programs or from
home improvement retailers. These tests provide detailed instructions and can be easily
conducted by the public. Delivery to a laboratory and return of the results is usually completed
by mail. Assistance interpreting the testing results and providing follow-up information is
available through the test kit manufacturer, the testing laboratory, state and local indoor air
quality programs, and certified radon professionals.
Radon concentrations in adjacent buildings, even adjoining ones, can differ by as much as a
factor of ten; test results from neighboring properties cannot be relied upon as indicators to the
presence or level of radon. These variances can depend upon factors such as the building design,
construction practices used, and the surrounding soil composition.
Structures with elevated radon levels have been discovered in every state. The EPA estimates
that as many as eight million homes, or one in five, throughout the country have elevated levels
of radon. The EPA recommends taking action to reduce radon in buildings that have a radon
level at or above 4 picocuries per liter (pCi/L) of air.6 Radon testing should not be limited to
private homes. Testing of day care facilities, schools, long-term care centers, and workplaces is
strongly encouraged.
3.3 Radon Mitigation
No known safe level of radon exists; however, the risks from exposure can be greatly reduced by
lowering the radon level in the building. Radon mitigation is the process used to reduce radon
concentrations in occupied buildings.
Several methods reduce radon in existing buildings. Building design, construction practices
used, and site geology are studied by radon professionals to determine the most effective method
for each structure. The primary method is known as an active sub-slab depressurization system
(ASD). This method utilizes a fan which pulls the radon gas from beneath the structure through
a system of vent pipes to exit the building. Some radon reduction systems have been proven to
reduce radon levels in existing structures by up to 99 percent.7
Radon-resistant construction practices can be highly effective in preventing the entry of radon
gas. When installed properly and completely as part of the new construction process, these
techniques can help reduce indoor radon levels. These construction techniques do not supersede
the need to conduct radon testing. Once ready to be occupied, the structure should be tested. If
radon levels are found to exceed 4 pCi/L, then the passive system incorporated into the structural
design can be quickly and easily activated by a certified mitigator.
Page 9
6 | P a g e
3.4 Assurance of Testing and Mitigation – Radon Control Programs
Assurance of radon testing and mitigation services is a key objective of state radon control
programs supported by the U.S. EPA. State radon contacts can be found on EPA’s web page at:
http://www.epa.gov/radon/whereyoulive.html.
Maine is the only state on the Environmental Public Health Tracking Network (EPHTN) Radon
Task Force (Task Force) that has a radon assurance program, and is cited here as an example of
how such a program is administered.
Maine law requires that anyone providing any radon services (sampling, analysis, mitigating,
advising) in the state or for the residents of the state must be registered with the Maine Radon
Control Program. Exceptions to this law include:
1) Testing or mitigation of a structure that is not for sale, done by a homeowner or resident;
2) Post-mitigation testing done by the homeowner or resident;
3) Installation of radon preventive features in new construction when adhering to Maine
radon new construction code requirements.
To become a registered radon service provider in Maine involves the completion of three steps:
1) Successfully complete an approved radon training course;
2) Pass an approved national certification exam; and
3) Register with the Radon Section.
All radon service providers are required to maintain their registration and renew yearly, and all
results of tests conducted in Maine must be reported to the Maine Radon Control Program.
Further, all those registering with the Radon Program are required to submit a Quality Assurance
Plan for radon sample collection and/or sample analysis. The plan is required so that radon
testers and labs can ensure accurate and precise radon results that can be defended.
4 Radon Data Sources
4.1 Radon Test Data
Task Force members have collected a variety of radon-related data over the years. Using a data
inventory approach, the Task Force found that numerous states had data that varied both in
completeness and coverage. In contrast to the wide variations in data collected, task force
members were able to identify a common core of desired radon data needed to estimate proposed
radon mitigation measures and provide information for radon program management. These data
are described in greater detail below.
To gain a better understanding of states’ current levels for data collection, task force members
completed a “Starting Matrix,” which outlines data collection assets and practices in their own
states (Appendix C). An example of the specific data collected by a state can be found in
Appendix A: Maine Case Study.
Page 10
7 | P a g e
4.2 Key Data Gaps
While the terminology varied widely for data elements collected by states, where they
overlapped, there was broad consistency in the actual data elements themselves. The more
serious challenges to the estimation of radon measures from these data were gaps in both data
availability (coverage) and internal gaps in data resolution. The gaps in data coverage result from
differences in states’ allocation of resources for radon testing and different requirements for
radon test reporting. A significant number of states currently have outdated or incomplete
databases. The two types of internal gaps in data resolution are:
Lack of address level data. In these cases only coarser geographic (e.g. zip codes) level
data are available for the individual test results. This gap precludes de-duplication of tests
conducted on the same structure. Inclusion of re-tests therefore biases the testing rate
high, and makes the data less useful for map development and measure estimation.
Lack of pre/post mitigation testing indicator. It appears that only about half of the
testing laboratories record whether a test is being conducted pre- or post-mitigation.
When this indicator is absent, the data will be biased toward a high testing rate because
re-tests on mitigated facilities are double-counted. In addition, estimates of radon
incidence above EPA action levels will be biased towards low values, because re-tests of
mitigated (and therefore lower radon level) structures are included. Lack of this flag
makes it impossible to calculate mitigation rates from the test data.
Although several Task Force member states had access to large numbers of individual test
results, issues with these gaps prevented their use for most purposes. For example, as illustrated
by the Maine case study (Appendix A), the program had access to over 190,000 test results, but
the lack of individual address data made this data less useful for program management and
measure calculation. Until recently (after data coverage improvements), Maine’s primary source
of data has been the BRFSS (described below).
4.3 Behavioral Risk Factor Surveillance System (BRFSS)
BRFSS is the longest ongoing health survey in the nation.8 In coordination with the Centers for
Disease Control and Prevention (CDC), states participate in implementing the survey and data
collection. Colorado, Maine, and New Hampshire, three states participating in the Radon Task
Force, collect BRFSS data using optional state-added questions regarding radon awareness,
testing, and mitigation. Although similar, the questions from individual states are not identical
and may cause a degree of uncertainty when comparing the data across states. It was
recommended by the Task Force that some effort be put into identifying core information sought
and developing consistent wording for regularly asked questions. Currently, states ask the radon
questions at varying intervals. The states that participate in the BRFSS and that are part of the
Task Force along with information on the questions asked can be found in Appendix B - EPHT
Radon Task Force Grantee State BRFSS Collection Practices. From 2000-2004, 10 states (IA,
ID, MO, NE, NH, NY, TN, VT, WV, WY) and the District of Columbia (DC) collected radon
information through BRFSS.9 The Task Force did not identify any other surveys with wide
availability.
Page 11
8 | P a g e
The Task Force discussed how a federal radon module for the BRFSS would be a powerful,
national-level data source; exploration of this option is advised in the recommendations section
below.
5 Considering Radon Nationally Consistent Data Measures:
Candidate Measures and Challenges
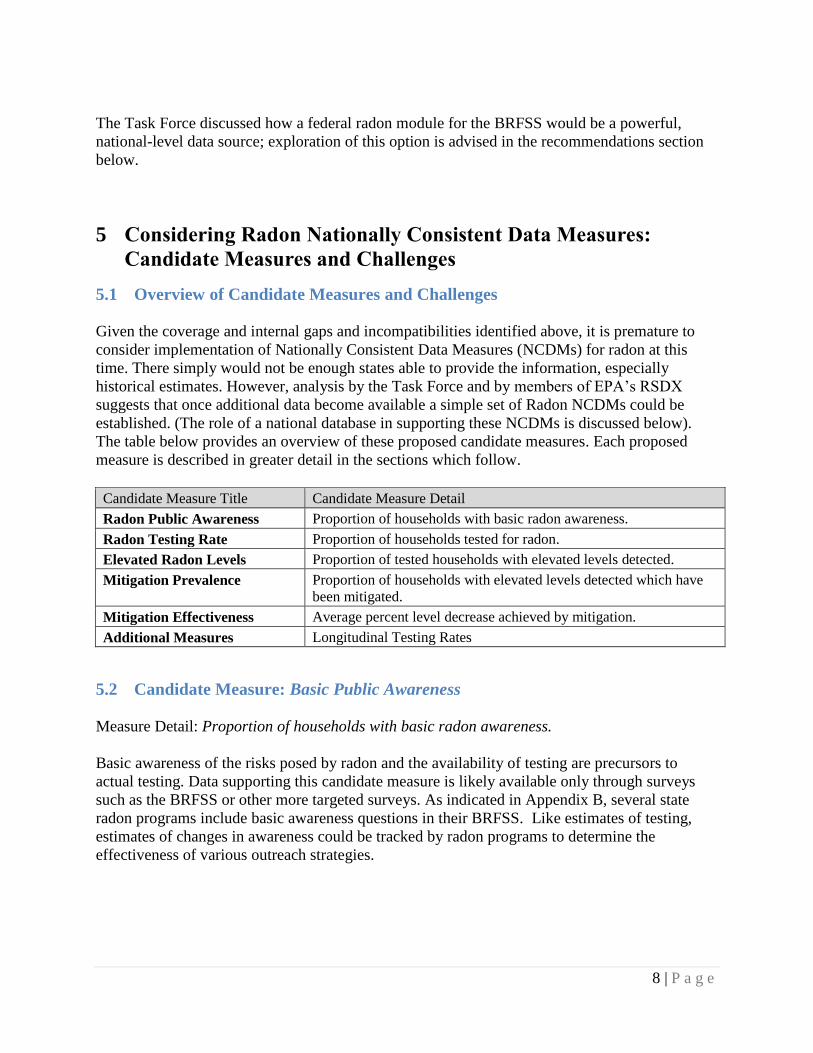
5.1 Overview of Candidate Measures and Challenges
Given the coverage and internal gaps and incompatibilities identified above, it is premature to
consider implementation of Nationally Consistent Data Measures (NCDMs) for radon at this
time. There simply would not be enough states able to provide the information, especially
historical estimates. However, analysis by the Task Force and by members of EPA’s RSDX
suggests that once additional data become available a simple set of Radon NCDMs could be
established. (The role of a national database in supporting these NCDMs is discussed below).
The table below provides an overview of these proposed candidate measures. Each proposed
measure is described in greater detail in the sections which follow.
Candidate Measure Title Candidate Measure Detail
Radon Public Awareness Proportion of households with basic radon awareness.
Radon Testing Rate Proportion of households tested for radon.
Elevated Radon Levels Proportion of tested households with elevated levels detected.
Mitigation Prevalence Proportion of households with elevated levels detected which have
been mitigated.
Mitigation Effectiveness Average percent level decrease achieved by mitigation.
Additional Measures Longitudinal Testing Rates
5.2 Candidate Measure: Basic Public Awareness
Measure Detail: Proportion of households with basic radon awareness.
Basic awareness of the risks posed by radon and the availability of testing are precursors to
actual testing. Data supporting this candidate measure is likely available only through surveys
such as the BRFSS or other more targeted surveys. As indicated in Appendix B, several state
radon programs include basic awareness questions in their BRFSS. Like estimates of testing,
estimates of changes in awareness could be tracked by radon programs to determine the
effectiveness of various outreach strategies.
Page 12
9 | P a g e
5.3 Candidate Measure: Radon Testing Prevalence
Measure Detail: Proportion of households tested for radon.
Since elevated levels of radon must be detected before they can be mitigated, the prevalence of
radon testing is a key measure. Using zip code level test results and census data for the number
of households it is possible to estimate the prevalence of radon testing at the state or county
level. In many cases, however, these estimates do not account for pre- and post-mitigation tests
on the same structure (only about 50 percent of laboratories provide this data). This produces a
high bias in the testing rate by double counting tests on the same structure. Recognizing this,
states may decide to implement new testing policies and work with radon contractors and
laboratories to identify tests as pre- or post-mitigation. This will help build a more robust data
set for future work. Testing prevalence can also be estimated from BRFSS.
5.4 Candidate Measure: Prevalence of Elevated Radon Levels
Measure Detail: Proportion of tested households with elevated levels detected.
The prevalence of radon tests over a limit is another candidate measure. In most cases, test
results of 4 picocuries/liter (pCi/L) or higher would be counted in this measure, and used as an
indicator of risk for an area. However, some states may decide to use the lower value of 2 pCi/L
as an indicator of risk in recommending that homeowners in an area test their homes for radon.
In Colorado, for example, the EPA identifies most counties as high risk, at or above 4 pCi/L, and
the remaining at moderate risk, expecting a test result between 2–4 pCi/L.10
It is useful to
understand that a combination of test result analysis in the range of 2–4 pCi/L or greater than 4
pCi/L is useful in developing radon programs.10
5.5 Candidate Measure: Mitigation Rate
Measure Detail: Proportion of households with elevated levels detected which have been
mitigated.
Given the current state of many data sets, it is very difficult (and in many cases impossible) to
determine prevalence of mitigation from test results since only about 50 percent of laboratories
provide a pre-/post-mitigation data element. This is a key area where it would be useful to
evaluate current data collection practices and form partnerships with testing laboratories to
collect these data. By requesting and obtaining access to data sets where the results are flagged
as pre- or post-mitigation, radon program personnel can better estimate mitigation rates. For
states without broad testing data coverage including pre-/post-mitigation flags, the next best
source of information for mitigation prevalence are radon-related questions included in the
BRFSS by some states (see Appendix B). Some states use this survey to ask if an action was
taken and resulting responses to a high radon test result.
Page 13
10 | P a g e
5.6 Candidate Measure: Mitigation Effectiveness
Measure Detail: Percentage of mitigations which reduce radon to below 4 pCi/l, below 2 pCi/l,
and below 1 pCi/l.
As discussed above, approximately ten grantee state radon programs collect results with pre-
/post-mitigation flags. These data can also be used to estimate mitigation effectiveness by
comparing the pre- and post-mitigation test result levels. These data may allow radon program
staff to identify patterns of deficient mitigation installations, or, conversely to identify installers
with especially good indications of mitigation effectiveness. This candidate measure is more
likely to be of use for local program management rather than for national collection as an
NCDM.
5.7 Additional Measures
Longitudinal Testing Rates
Typically, a radon test result will include the date sampled and date analyzed. Collection of
these data helps to determine the number of new samples submitted annually. Testing date
information can also be used to detect patterns (rises, declines, peaks or valleys) in the rate of
new testing, and correlate these to other factors such as awareness promotion activities. As
discussed above, the lack of pre- and post-mitigation flags tend to result in higher testing rates.
However, this bias should not change the general testing patterns and so can still inform
programs. These data are probably more useful for local program management than for NCDM
development.
6 Considering a National Radon Database
EPA and CDC continue discussions on the possibility of creating an integrated national database
for radon data. Much work has already been done on the data elements needed for such a
database; this includes the work done by EPA’s Radon State Data Exchange group as well as
work by New Jersey Department of Environmental Protection (NJ DEP, – relevant New Jersey
material is being added to the Exchange Network website). Benefits of such a national system
could include:
Improved Data Compatibility: Establishing a common core set of elements and
providing these fields as a target for other systems to map should increase the
consistency, compatibility, and availability of these data.
Direct Support of State Programs: Some states may elect to use the national database for
direct support of their state programs, eliminating the need (and costs) of developing and
maintaining a local system. Use of a national system for program support would likely
require inclusion of additional data elements, beyond those strictly required for the
proposed measures, such as those identified by NJ DEP. See possible security
considerations below.
Page 14
11 | P a g e
Common Target for National Laboratories: A national database could provide a common
repository for the national testing laboratories; this may reduce the burden on the part of
the laboratories for reporting this data, and act as an incentive for them to provide more
consistent and complete data.
Ideally, a comprehensive national radon database would include address level data, in order to
de-duplicate and geo-locate tested structures. States using the national system (only) to manage
their primary test data would need this functionality. However, storing this data nationally could
present confidentiality and security issues. Some data providers may simply refuse to provide
data if they know that it will be nationally aggregated and possibly publicly released. Some of
these issues might be addressed by de-duplicating and geo-referencing the data but then also de-
identifying the data, before transmitting it to the national database. This approach would require
some local system to perform these functions, since they would not be performed in the national
database itself. It could be possible to jointly develop such local software but doing so would
entail the usual shared software challenges of functionality and version management. Still, this
option may be worthy of further exploration.
7 Recommendations
Radon represents a large environmental public health risk. Through working with radon
exposure data, it is feasible to make a difference in public health outcomes. To accomplish this,
the Radon Task Force developed the recommendations outlined below.
Place development of radon NCDMs on hold for now. Currently available data will
not support sufficient coverage for the proposed measures to justify their addition to the
current NCDMs. CDC should continue to monitor the availability of radon data from data
partners and grantees to identify when sufficient coverage (perhaps 12-15 grantees) exists
to include radon measures in the national set. Once new data become available, the
candidate measures listed here could be piloted.
Explore how radon can receive continued attention from the Tracking Program. Per
the findings by the Radon Task Force, current data collection methods do not support
development of radon NCDMs. However, given the relative magnitude of the risk
represented by radon, the Tracking Program should consider other ways of supporting
radon programs. Options could include:
o Including information about radon on the National Portal, with links to grantee
Radon program pages.
o Including data where it exists for the measures identified by the Task Force.
o Partnering with EPA’s Radon State Data Exchange program to support grantees
in leveraging their Tracking Portals for Radon public outreach.
o Consider taking opportunities to provide radon-related technical assistance.
Explore the addition of optional radon questions into the optional BRFSS module.
Given the data gaps identified by the Task Force, the BRFSS survey represents the next
most powerful data source for radon measures and program management. The Tracking
Page 15
12 | P a g e
Program should explore the addition, as is done in some states, of radon-related questions
to the national BRFSS set. The first four of the proposed radon measures could be
effectively estimated by a national Radon module for BRFSS.
The Tracking Program should continue the discussions with EPA about establishing
a national radon database. A national radon database could significantly improve the
consistency, quality and availability of radon testing and mitigation data; it could provide
laboratories with an easier unified way to report data; and it could provide program
management functionality to state radon programs without local test data management
systems. As a next step in their discussions, CDC and EPA could develop exploratory
scenarios for usage and data ownership, security and formatting issues. Even without a
national system, EPA and CDC could work with the national testing laboratories to
develop a standardized reporting format, especially one that includes address level data
and the critical pre-/post-mitigation testing data element.
Page 16
13 | P a g e
8 References
1. National Cancer Institute at the National Institutes of Health. Radon and Cancer. Available at
URL: http://www.cancer.gov/cancertopics/factsheet/Risk/radon
2. U.S. Environmental Protection Agency (EPA) Radon (Rn) Health Risks. Available at URL:
http://www.epa.gov/radon/healthrisks.html
3. Krewski D, Lubin JH, Zielinski JM, Alavanja M, Catalan VS, Field RW, Klotz JB,
Letourneau EG, Lynch CF, Lyon JI, Sandler DP, Schoenberg JB, Steck DJ, Stolwik JA,
Weinberg C, Wilcox HB. Residential radon and risk of lung cancer:a combined analysis of 7
North American case-control studies. Epidemiology, 2005 Mar; 16(2): 137-45.
4. Darby S, Hill D, Auvinen A, Barros-Dios JM, Baysson H, Bochicchio F, Deo H, Falk R,
Forastiere F, Hakama M, Heid I, Kreienbrock L, Kreuzer M, Lagarde F, Mäkeläinen I, Muirhead
C, Oberaigner W, Pershagen G, Ruano-Ravina A, Ruosteenoja E, Rosario AS, Tirmarche M,
Tomásek L, Whitley E, Wichmann HE, Doll R. Radon in homes and risk of lung cancer:
cpllaborative analysis of individual data from 13 European case-control studies. BMJ, 2005 Jan
29; 330(7485):223.
5. Committee on Health Risks of Exposure to Radon (BEIR VI), National Research Council
Health Effects of Exposure to Radon. Available through National Academies Press at URL:
http://www.nap.edu/catalog/5499.html
6. U.S. Environmental Protection Agency (EPA) Radon (Rn) Basic Information Why is Radon
the public health risk that it is? Available at URL: http://www.epa.gov/radon/aboutus.html
7. U.S. Environmental Protection Agency (EPA) Radon (Rn) A Consumers Guide to Radon
Reduction. Available at URL: http://www.epa.gov/radon/pubs/consguid.html
8. Methodologic Changes in the Behavioral Risk Factor Surveillance System in 2011 and
Potential Effects on Prevalence Estimates. MMWR Weekly June 8, 2012 / 61(22); 410-413
Available at URL: http://www.cdc.gov/mmwr/preview/mmwrhtml/mm6122a3.htmBRFSS
9. Centers for Disease Control and Prevention (CDC) Behavioral Risk Factor Surveillance
System (BRFSS) Available at URL: http://www.cdc.gov/brfss/index.htm.
10. U.S. Environmental Protection Agency (EPA) Radon (Rn) Where You Live, Colorado.
Available at URL: http://www.epa.gov/radon/states/colorado.html.
Page 17
14 | P a g e
Appendices
Appendix A: Maine Case Study
Synopsis
Maine has over 20 years of air radon test data, comprising approximately 240,000 tests. These
tests results are of limited usefulness for environmental public health tracking because they do
not contain address level information until 2009. The Maine CDC has included radon testing
and mitigation questions in its BRFSS. These questions have provided Maine with information
on radon testing prevalence, high radon households, and the percentage of high radon households
that have undergone mitigation. Data are currently summarized at the state and public health
district levels. Maine plans to continue with these questions. It also hopes to develop a database
that will store radon test results with address level information. These data will provide Maine
with more local information on radon levels, as well as pre- and post-mitigation results by which
intervention effectiveness can be assessed. Water radon data can also be stored in this database,
possibly in a manner that can be linked with other private well water test information.
Introduction
Maine has had some level of radon outreach, education, training, and/or research since the mid-
1950s, and established its Radon Control Program through legislation in 1989. One of the
program’s requirements is that all laboratories doing business in the State of Maine must submit
their test results to the program. There are approximately 500,000 habitable structures in Maine,
most of which are residences. Maine has approximately 5001,000 school buildings. To date,
the program has collected over 300,000 test results on Maine buildings; approximately 240,000
have been air tests and about 80,000 have been water tests, for an average of 10,000 air tests and
3,500 water tests per year. Most of these tests are from residences. Maine does not know how
many of these test results were from individual buildings, because radon test data were only
available at the zip code and town level until recently.
Of approximately 1,0001,400 lung cancer deaths per year in Maine, 8085 percent are
attributable to smoking. Based on modeling and risk projections from the National Research
Council BEIR VI report, radon exposure accounts for most of the remainder. Thus, as a crude
approximation, radon exposure is responsible for roughly 150200 lung cancer deaths per year in
the state. 5
Air radon is a very suitable candidate for NCDM development, when considered from the
perspective of the original environmental public health tracking paradigm
(hazardexposurehealth effectintervention). There are established methods to measure radon
hazard (pre- and post-mitigation), a clear association between radon exposures and lung cancer
risk, effective mitigation measures to reduce risk, and a well-established program for training
and certification of radon mitigators.
Page 18
15 | P a g e
Ideal set of Indicators
Ideally, Maine’s goal is to have every house tested for radon, and every house with radon levels
above 4 pCi/L (or even 2 pCi/L) effectively mitigated. It would like a similar outcome for all
schools and day care centers. To accomplish and verify this goal, Maine would need the radon
test results for every house, school, and day care facility, as well as evidence that all high radon
buildings have been mitigated effectively.
For Maine’s purposes, indicators would not only focus on compiling a set of hazard (indoor air)
data, but in also organizing those data in ways that could motivate public action to test and
reduce indoor radon levels. To accomplish this, it is important that such data be organized at a
local level. These data and results can be scaled up as needed to county and regional levels
(public health district) levels in Maine.
Maine’s Radon Data
A state indoor radon survey conducted by EPA in the late 1980s indicated that approximately 30
percent of Maine homes had radon levels above 4 pCi/L (see table below).
Radon Levels in Maine Homes by County
County
Number
of
Homes
Sampled
Indoor Air Radon Levels (pCi/L)
50th
Percentile
Maximum
Level
Percent
> 4 pCi/L
Percent
> 2 pCi/L
Androscoggin 47 2.4 11.4 23 % 57 %
Aroostook 102 3.6 25.2 41 % 63 %
Cumberland 132 3.2 82.7 39 % 72 %
Franklin 22 1.7 103.2 18 % 33 %
Hancock 53 2.2 19.4 28 % 51 %
Kennebec 61 2.0 19.4 28 % 50 %
Knox 30 1.6 9.7 23 % 41 %
Lincoln 18 1.7 6.9 11 % 35 %
Oxford 42 4.2 30.3 52 % 65 %
Penobscot 79 1.7 7.5 15 % 36 %
Piscataquis 42 1.9 22.5 26 % 47 %
Sagadahoc 34 1.6 8.0 18 % 39 %
Somerset 31 1.6 5.8 19 % 31 %
Waldo 27 2.1 13.0 22 % 51 %
Washington 40 1.6 12.2 15 % 39 %
York 79 2.9 33.0 41 % 67 %
Page 19
16 | P a g e
The Table above contains screening indoor air radon data from the EPA/State of Maine
Residential Survey of Maine conducted during 1988 and 1989. Data represent 2-7 day charcoal
canister measurements from the lowest level of each tested home. SOURCE: EPA’s Map of
Radon Zones: MAINE, U.S. Environmental Protection Agency, Air and Radiation, 402-R-93-
039, September, 1993.
Household test data through Maine’s Radon Control Program:
Laboratories submitting test results to Maine’s Radon Control Program provided town (and zip
code) level information. Until recently, however, the test information did not contain addresses;
thus, assessing the historical database multiple tests results on the same house is not possible.
These are the fields contained in the air and water test reports from the laboratories.
Data field Detail/Comment
Medium Air/Water
Company ID number Company that collected sample
Lab ID Number Lab that analyzed sample
Test kit/Sample Sample identification – for further information
Zip code
Result (pCi/L)
Building level (basement, 1st, 2
nd, etc.) which floor of the building was tested for radon
Address Note- address level data has always been requested
and occasionally received; only recently was it
made mandatory.
Town
Charcoal test Yes/No
Alpha track test Yes/No
Working Level test (derived) Yes/No (asking if the test being reported was a
working level measurement)
Working Level result (actual) Yes/No (if a working level measurement, what was
the result)
Notes
Mitigation Yes/no (added to the database in 2010)
Summary data of these results indicate that approximately 30 percent of the tests show levels
above the 4 pCi/L action level (consistent with the EPA survey), with appreciable variation
across the state. Because these results are based largely on historical tests which lack address
level information, they are only approximations of the number of homes tests. While they can
discriminate between pre-mitigation and post-mitigation tests, they cannot de-duplicate among
multiple tests done either before or after mitigation.
The Radon program currently stores this information in three datasets: air radon test results;
water radon test results; and mitigation test results. All of these datasets are housed in a legacy
dBase III system, which has several limitations. For example, it does not recognize any date
Page 20
17 | P a g e
after December 31, 1999, thereby limiting the radon program’s ability to track trends in test
results; processing time slows down when over 50,000 records are analyzed; it lacks networking
capabilities; and it does not work at all over the Internet.
BRFSS: Behavioral Risk Factor Surveillance System:
While test level data does provide local (e.g., town or zip code level) information which can
inform and motivate public health action, it is limited in its ability to provide precise estimates of
radon testing prevalence due to the lack of address level information. This limitation can be
addressed through the use of BRFSS information, which provides population based prevalence
estimates at state, public health district, and county levels.
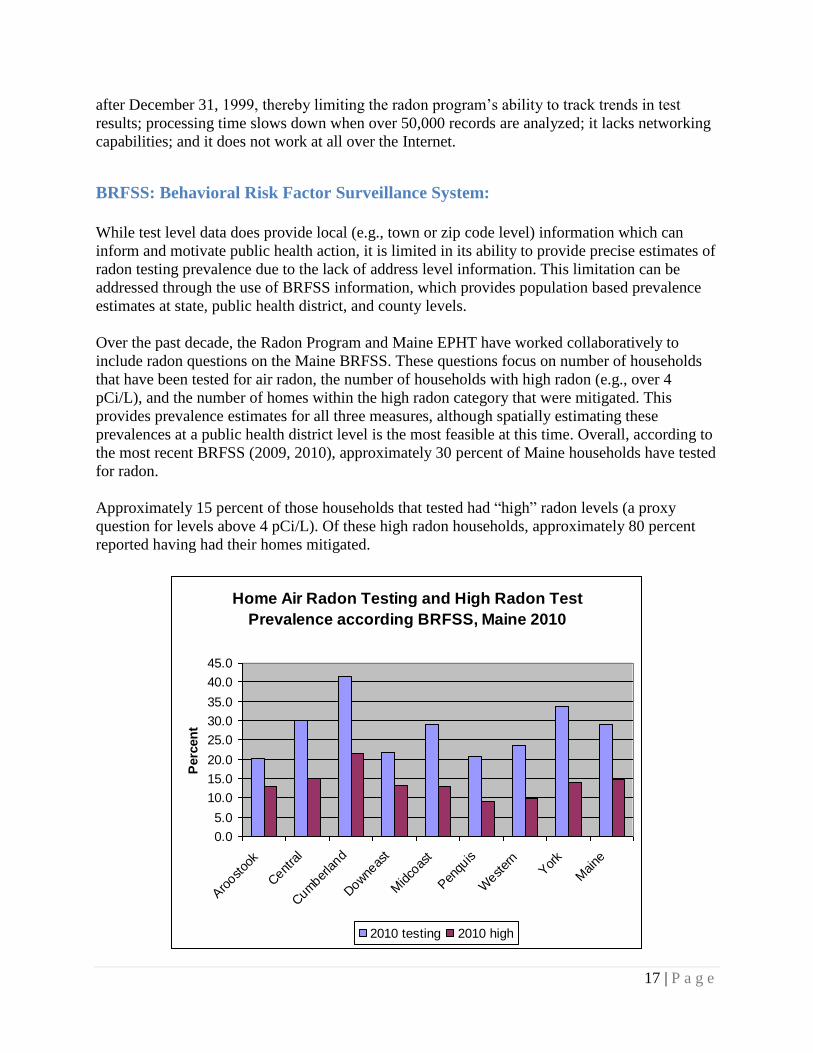
Over the past decade, the Radon Program and Maine EPHT have worked collaboratively to
include radon questions on the Maine BRFSS. These questions focus on number of households
that have been tested for air radon, the number of households with high radon (e.g., over 4
pCi/L), and the number of homes within the high radon category that were mitigated. This
provides prevalence estimates for all three measures, although spatially estimating these
prevalences at a public health district level is the most feasible at this time. Overall, according to
the most recent BRFSS (2009, 2010), approximately 30 percent of Maine households have tested
for radon.
Approximately 15 percent of those households that tested had “high” radon levels (a proxy
question for levels above 4 pCi/L). Of these high radon households, approximately 80 percent
reported having had their homes mitigated.
Home Air Radon Testing and High Radon Test
Prevalence according BRFSS, Maine 2010
0.0
5.0
10.0
15.0
20.0
25.0
30.0
35.0
40.0
45.0
Aro
ostoo
k
Cent
ral
Cum
berland
Dow
neas
t
Midco
ast
Pen
quis
West
ern
Yor
k
Maine
Perc
en
t
2010 testing 2010 high
Page 21
18 | P a g e
School data:
The Bureau of Public Improvements, later renamed the Bureau of General Services, conducted a
radon survey of all Maine schools from 1988 to 1991. Results showed that approximately one
third (just over 200) of Maine schools had one or more rooms with radon levels above 4 pCi/L.
No comprehensive follow-up action or mitigation was undertaken. Currently, Maine schools are
not required to enact radon mitigation measures when high radon is found, either in new or
existing structures.
Summary of findings:
An EPA survey and subsequent radon test data gathered through Maine’s Radon Control
Program, indicates that approximately one third of Maine’s residences have radon levels
exceeding the 4 pCi/L action level. Furthermore, about the same percentage of schools were also
found to exceed this benchmark. One limitation, however, associated with the interpretation of
the historical air radon test data has been the absence of radon address level information,(which
recently became available. This limitation has prevented the Radon Program from: 1)
distinguishing between the number of homes tested and the homes with multiple radon tests; and
2) analyzing pre- and post-mitigation tests from the same building. Maine has explored
alternative approaches to estimating the proportion of high radon homes and the amount of
mitigation activity undertaken through the BRFSS. BRFSS results indicate that only fifteen
percent of Maine homes have high radon levels (i.e., above 4 pCi/L), about half the estimate
indicated from both the EPA survey and the household radon test results. Reasons for this
disparity are currently being investigated. The BRFSS is Maine’s only current source of
information regarding the percentage of homes being mitigated (an encouraging 80 percent).
Moving forward
Moving forward, a tracking system that uses radon test data submitted to the Radon Control
Program and the BRFSS results is envisioned. BRFSS results could continue to provide overall
prevalence information, but at best a county or public health district level. The submitted test
reports--now having address level information-- will be able to provide de-duplicated household
data, including both pre-mitigation and post-mitigation readings, at a community level. In this
respect, the air radon test data will function similarly to the private well water test data, which
will eventually also house water radon data. Evaluating intervention effectiveness of radon
mitigation efforts will also become possible with the ability to compare pre- and post-mitigation
test results for the same address.
Database Development
The Maine Radon Control Program is at a crossroads with respect to its database development. It
is clear that the current dBase III system is inadequate, but unclear what new system should be
developed to take its place. Conceptually, the most logical system would be in the Healthy
Homes database (HHLPPS). Yet the future of that database is unclear. Also, radon data are not
currently included in that database. Another possibility is to develop a database for air and water
radon, and align this database with one currently under consideration for other private well water
Page 22
19 | P a g e
data. Yet another possibility is to consider the development of a national database. Such a system
could avoid the data analysis and display problems, as well as multiple reporting requirements
for data providers that exist when several jurisdictions are developing data independently.
Page 23
20 | P a g e
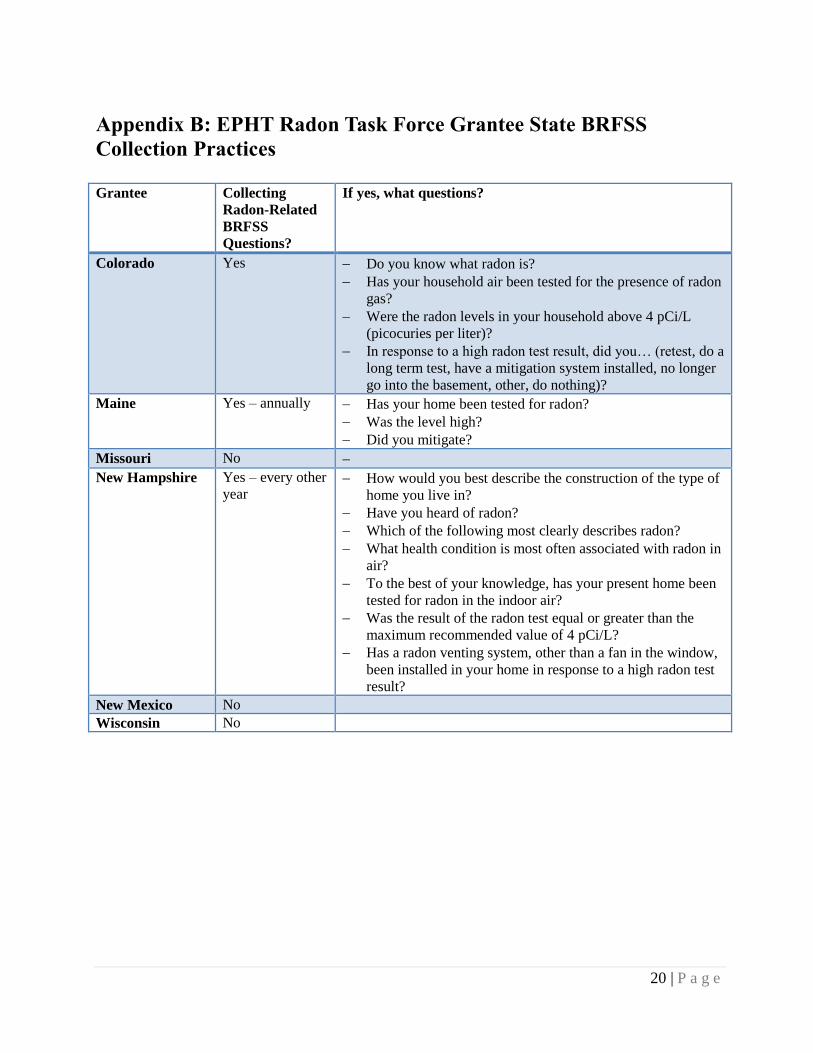
Appendix B: EPHT Radon Task Force Grantee State BRFSS
Collection Practices
Grantee Collecting
Radon-Related
BRFSS
Questions?
If yes, what questions?
Colorado Yes Do you know what radon is?
Has your household air been tested for the presence of radon
gas?
Were the radon levels in your household above 4 pCi/L
(picocuries per liter)?
In response to a high radon test result, did you… (retest, do a
long term test, have a mitigation system installed, no longer
go into the basement, other, do nothing)?
Maine Yes – annually Has your home been tested for radon?
Was the level high?
Did you mitigate?
Missouri No
New Hampshire Yes – every other
year How would you best describe the construction of the type of
home you live in?
Have you heard of radon?
Which of the following most clearly describes radon?
What health condition is most often associated with radon in
air?
To the best of your knowledge, has your present home been
tested for radon in the indoor air?
Was the result of the radon test equal or greater than the
maximum recommended value of 4 pCi/L?
Has a radon venting system, other than a fan in the window,
been installed in your home in response to a high radon test
result?
New Mexico No
Wisconsin No
Page 24
21 | P a g e
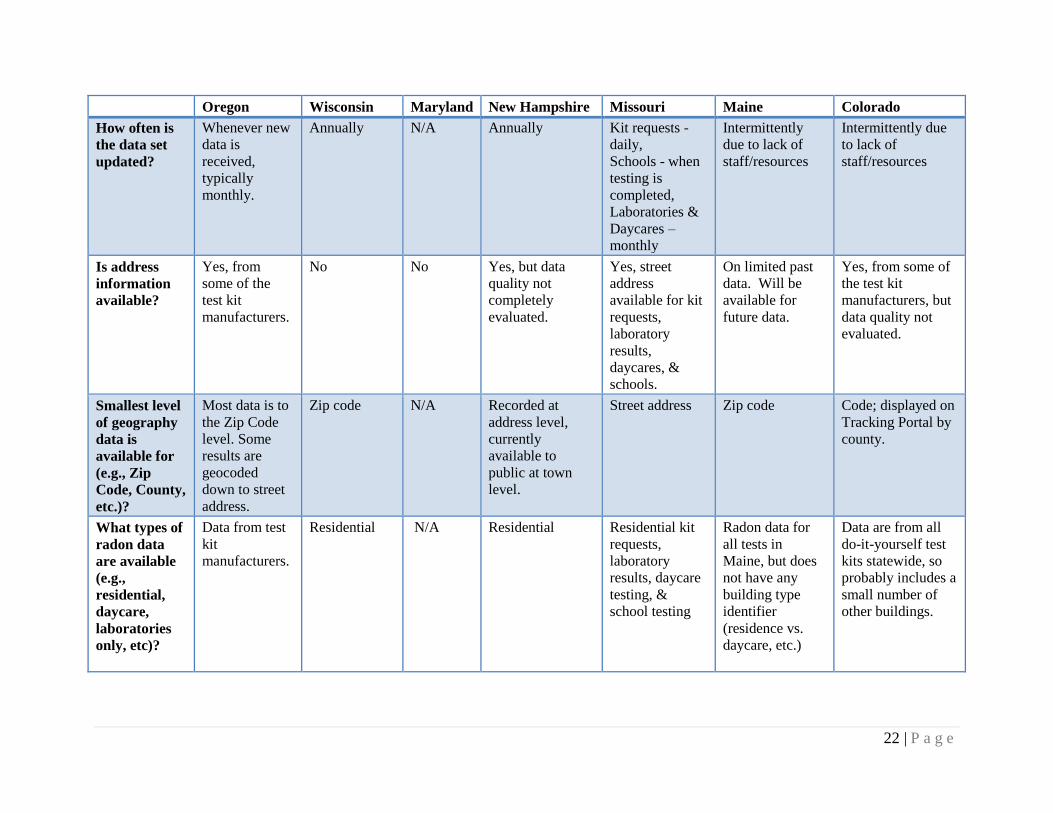
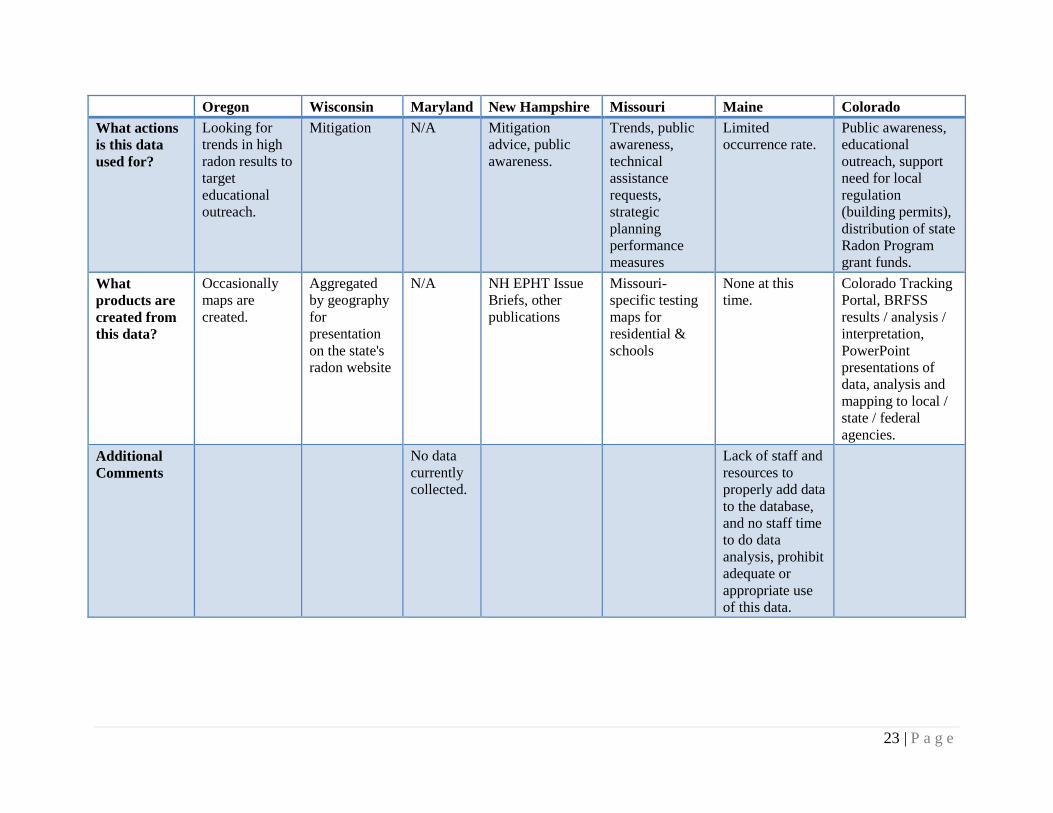
Appendix C: EPHT Radon Task Force Starting Matrix: Data collection practices in selected
states.
Oregon Wisconsin Maryland New Hampshire Missouri Maine Colorado
Data available
electronically?
Yes Yes No Yes Yes Yes Yes
Beginning
date radon
data is
available?
1/1/1990 At least as far
back as 2004.
Investigating
if we can
access data
older than
that.
No 1987 2004 (some
previous data
available;
however it is
spotty)
1988 (sporadic)
1993 (regularly
received)
1/1/2005
Ending date
radon data is
available?
7/1/2011 Current No 2010 Current Spring 2009
(data since then
needs to be
entered into
database)
2009 (Will update
with 2010 and
2011, including
pre-/post-
mitigation, next
quarter.
Approximate
number of
records?
16,000 120,000 N/A 25,000 Approximately
16,000
laboratory
results and
31,000 kit
requests
190,000 20,000/year
(Based on 102,851
total tests for 2005-
2009)
Format data
is stored in
(Excel,
Access, etc.)?
Excel Access N/A Access Access dBase III+ Access
Is a data
dictionary
available?
No No No No No - currently
in development
No No
Page 25
22 | P a g e
Oregon Wisconsin Maryland New Hampshire Missouri Maine Colorado
How often is
the data set
updated?
Whenever new
data is
received,
typically
monthly.
Annually N/A Annually Kit requests -
daily,
Schools - when
testing is
completed,
Laboratories &
Daycares –
monthly
Intermittently
due to lack of
staff/resources
Intermittently due
to lack of
staff/resources
Is address
information
available?
Yes, from
some of the
test kit
manufacturers.
No No Yes, but data
quality not
completely
evaluated.
Yes, street
address
available for kit
requests,
laboratory
results,
daycares, &
schools.
On limited past
data. Will be
available for
future data.
Yes, from some of
the test kit
manufacturers, but
data quality not
evaluated.
Smallest level
of geography
data is
available for
(e.g., Zip
Code, County,
etc.)?
Most data is to
the Zip Code
level. Some
results are
geocoded
down to street
address.
Zip code N/A Recorded at
address level,
currently
available to
public at town
level.
Street address Zip code Code; displayed on
Tracking Portal by
county.
What types of
radon data
are available
(e.g.,
residential,
daycare,
laboratories
only, etc)?
Data from test
kit
manufacturers.
Residential N/A Residential Residential kit
requests,
laboratory
results, daycare
testing, &
school testing
Radon data for
all tests in
Maine, but does
not have any
building type
identifier
(residence vs.
daycare, etc.)
Data are from all
do-it-yourself test
kits statewide, so
probably includes a
small number of
other buildings.
Page 26
23 | P a g e
Oregon Wisconsin Maryland New Hampshire Missouri Maine Colorado
What actions
is this data
used for?
Looking for
trends in high
radon results to
target
educational
outreach.
Mitigation N/A Mitigation
advice, public
awareness.
Trends, public
awareness,
technical
assistance
requests,
strategic
planning
performance
measures
Limited
occurrence rate.
Public awareness,
educational
outreach, support
need for local
regulation
(building permits),
distribution of state
Radon Program
grant funds.
What
products are
created from
this data?
Occasionally
maps are
created.
Aggregated
by geography
for
presentation
on the state's
radon website
N/A NH EPHT Issue
Briefs, other
publications
Missouri-
specific testing
maps for
residential &
schools
None at this
time.
Colorado Tracking
Portal, BRFSS
results / analysis /
interpretation,
PowerPoint
presentations of
data, analysis and
mapping to local /
state / federal
agencies.
Additional
Comments
No data
currently
collected.
Lack of staff and
resources to
properly add data
to the database,
and no staff time
to do data
analysis, prohibit
adequate or
appropriate use
of this data.