Page 1
8/12/2019 Raid Alghamdi MCS 2012
http://slidepdf.com/reader/full/raid-alghamdi-mcs-2012 1/96
MOVEMENT GENERATOR FOR MOBILE
NETWORK SIMULATION
by
Raid A. Alghamdi
B.Sc. in Computer ScienceAl Baha University, 2007
A REPORT SUBMITTED IN PARTIAL FULFILLMENT OFTHE REQUIREMENTS FOR THE DEGREE OF
Master of Computer Science
In the Graduate Academic Unit of Computer Science
Supervisor(s): Prof. Przemyslaw Pochec, Computer ScienceProf. John DeDourek, Computer Science
Examining Board: Prof. Wei Song, Computer Science,ChairProf. Andrew McAllister, Computer Science
This report is accepted by the
Dean of Graduate Studies
THE UNIVERSITY OF NEW BRUNSWICK
October, 2012
cRaid A. Alghamdi, 2012
Page 2
8/12/2019 Raid Alghamdi MCS 2012
http://slidepdf.com/reader/full/raid-alghamdi-mcs-2012 2/96
Dedication
I dedicate this work to a woman who is in her 9th decade. A woman whomI really appreciate for teaching us the most important lessons about life: mygrandmother Fatimah.
To my mother Sandalah: you inspired my whole life; you are the only schoolthat I will never graduate from.
To my father Abdullah: the trust that you gave me turned me into a suc-cessful person. God bless you.
To Maryam, Rashid, Faisal, Turki, Asma and Ahmed: you are the onesto whom I turn when I need wisdom. Each and every one of you has his orher own traits that are reflected in me.
To Bushra: Your name means the good news, and since we got married mylife has become more valuable. The good news rings throughout it. Whetheryou are geographically far from me or close to me, you live all the happy mo-ments with me and the sad ones too. Patience is your most powerful trait,because you handle huge situations with such calm and wisdom.
Since the 10th of March 2012, a tiny person, Bashair, turned me into a father.I dedicate this work personally to you, and I wish to see you become the bestperson in this world.
To Ahmed and his son Nawaf: Ahmed wanted to study for his masters degreewith me, but due to his sons ill health, he could not; Ahmed canceled hisstudies to donate his liver to his son. I dedicate this work to you both.
ii
Page 3
8/12/2019 Raid Alghamdi MCS 2012
http://slidepdf.com/reader/full/raid-alghamdi-mcs-2012 3/96
Abstract
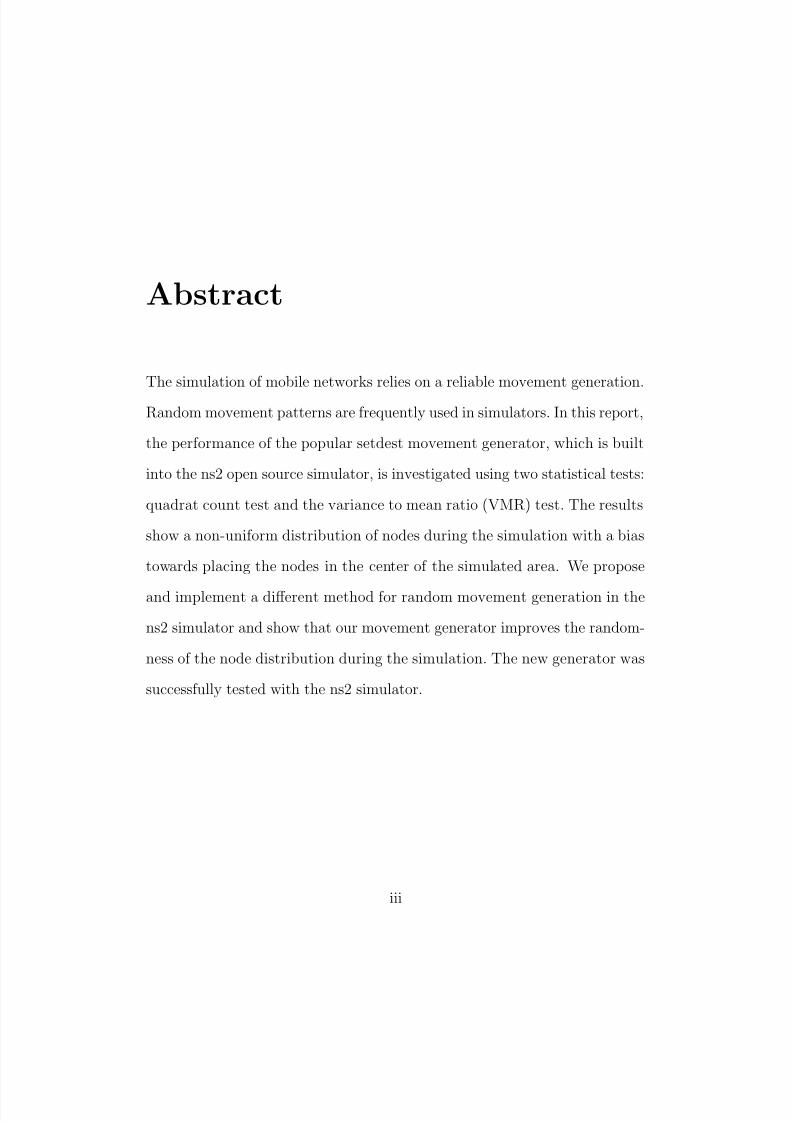
The simulation of mobile networks relies on a reliable movement generation.
Random movement patterns are frequently used in simulators. In this report,
the performance of the popular setdest movement generator, which is built
into the ns2 open source simulator, is investigated using two statistical tests:
quadrat count test and the variance to mean ratio (VMR) test. The results
show a non-uniform distribution of nodes during the simulation with a bias
towards placing the nodes in the center of the simulated area. We propose
and implement a different method for random movement generation in the
ns2 simulator and show that our movement generator improves the random-
ness of the node distribution during the simulation. The new generator was
successfully tested with the ns2 simulator.
iii
Page 4
8/12/2019 Raid Alghamdi MCS 2012
http://slidepdf.com/reader/full/raid-alghamdi-mcs-2012 4/96
Acknowledgements
Indeed, all praise and thanks due to Allah1 for the continuous support and
guidance he has bestowed on me throughout my entire life in general and in
my studies in specific.
I would like to express my heart-felt gratitude to every member of my fam-
ily, particularly my parents, who endured my study abroad, for their great
support and encouragement.
I am truly indebted and thankful for the tremendous support from the in-
dividuals and groups who helped and guided me throughout my temporary
residency and study in Canada. I am sincerely and heartily grateful to my
supervisors Prof.John DeDourek and Prof.Przemyslaw Pochec for their mo-
tivations, suggestive views, provision of great information resources, and pa-
tience during the last two years of being working with them.
Last but not least, I acknowledge this work to the Ministry of Higher Educa-
tion of Saudi Arabia through the Saudi Arabian Cultural Bureau in Canada
for their sponsorship.
1The proper name applied to the God.
iv
Page 5
8/12/2019 Raid Alghamdi MCS 2012
http://slidepdf.com/reader/full/raid-alghamdi-mcs-2012 5/96
Table of Contents
Dedication ii
Abstract iii
Acknowledgments iv
Table of Contents vii
List of Tables viii
List of Figures x
Abbreviations xi
1 Introduction 1
1.1 Networking . . . . . . . . . . . . . . . . . . . . . . . . . . . . 2
1.1.1 Wired Networks . . . . . . . . . . . . . . . . . . . . . . 2
1.1.2 Wireless Networks . . . . . . . . . . . . . . . . . . . . 2
1.1.2.1 Mobile Networks . . . . . . . . . . . . . . . . 3
1.1.2.2 Mobile Ad hoc Networks (MANET) . . . . . 6
v
Page 6
8/12/2019 Raid Alghamdi MCS 2012
http://slidepdf.com/reader/full/raid-alghamdi-mcs-2012 6/96
1.2 Investigating Network Performance . . . . . . . . . . . . . . . 7
1.2.1 Empirical Study . . . . . . . . . . . . . . . . . . . . . . 7
1.2.2 Analytical Modeling . . . . . . . . . . . . . . . . . . . 8
1.2.3 Simulation . . . . . . . . . . . . . . . . . . . . . . . . . 8
1.2.3.1 Network Simulator . . . . . . . . . . . . . . . 9
1.3 Problem Description and Scope . . . . . . . . . . . . . . . . . 9
2 Background 11
2.1 Factors that Impact Network Performance . . . . . . . . . . . 11
2.1.1 Movement has Performance Impact . . . . . . . . . . . 12
2.1.2 Selected Related Work on Movement Generators . . . . 13
3 Movement in MANETs 15
3.1 Movement Types . . . . . . . . . . . . . . . . . . . . . . . . . 16
3.1.1 Deterministic Movement . . . . . . . . . . . . . . . . . 16
3.1.2 Random Movement . . . . . . . . . . . . . . . . . . . . 17
3.1.3 Other Movement Types . . . . . . . . . . . . . . . . . 19
3.2 Setdest Utility . . . . . . . . . . . . . . . . . . . . . . . . . . . 23
3.3 Custom Random Movement Generators . . . . . . . . . . . . . 25
4 Investigating the Performance 37
4.1 Statistical Tests Used . . . . . . . . . . . . . . . . . . . . . . . 37
4.1.1 Quadrats Count . . . . . . . . . . . . . . . . . . . . . . 38
4.1.2 Variance to Mean Ratio (VMR) . . . . . . . . . . . . . 39
vi
Page 7
8/12/2019 Raid Alghamdi MCS 2012
http://slidepdf.com/reader/full/raid-alghamdi-mcs-2012 7/96
4.1.3 Confidence Intervals . . . . . . . . . . . . . . . . . . . 41
4.2 Comparing the Randomness in the Setdest Utility and the
Custom Generator . . . . . . . . . . . . . . . . . . . . . . . . 41
4.3 Comparing the Packets Transmission in Both Generators . . . 44
4.3.1 The Differences Between Both Generators in Delivery
Ratio Through the Centre . . . . . . . . . . . . . . . . 46
4.3.2 The Differences Between Both Generators in Delivery
Ratio Along the Edges . . . . . . . . . . . . . . . . . . 48
5 Conclusion 52
5.1 Results of the work . . . . . . . . . . . . . . . . . . . . . . . . 52
5.2 Future work . . . . . . . . . . . . . . . . . . . . . . . . . . . . 54
Bibliography 55
A 62
A.1 RunningNodes Class . . . . . . . . . . . . . . . . . . . . . . . 62
B 80
B.1 Node Class . . . . . . . . . . . . . . . . . . . . . . . . . . . . 80
Vita
vii
Page 8
8/12/2019 Raid Alghamdi MCS 2012
http://slidepdf.com/reader/full/raid-alghamdi-mcs-2012 8/96
List of Tables
4.1 The confidence interval results of the delivery ratio through
the centre for both generators. . . . . . . . . . . . . . . . . . . 47
4.2 The confidence interval results of the delivery ratio along the
edges for both generators. . . . . . . . . . . . . . . . . . . . . 49
viii
Page 9
8/12/2019 Raid Alghamdi MCS 2012
http://slidepdf.com/reader/full/raid-alghamdi-mcs-2012 9/96
List of Figures
3.1 Example of the city bus movement model (After [34]) . . . . . 17
3.2 Mobile node travelling following a Random Walk Mobility
Model (After [7]) . . . . . . . . . . . . . . . . . . . . . . . . . 19
3.3 Mobile node travelling following a Random Waypoint Mobility
Model (After [7]) . . . . . . . . . . . . . . . . . . . . . . . . . 20
3.4 Mobile node travelling following a Random Direction Mobility
Model (After [7]) . . . . . . . . . . . . . . . . . . . . . . . . . 21
3.5 Mobile node travelling following a Boundless Area Mobility
Model (After [7]) . . . . . . . . . . . . . . . . . . . . . . . . . 22
3.6 Mobile node travelling following the Gauss-Markov Mobility
Model (After [7]) . . . . . . . . . . . . . . . . . . . . . . . . . 23
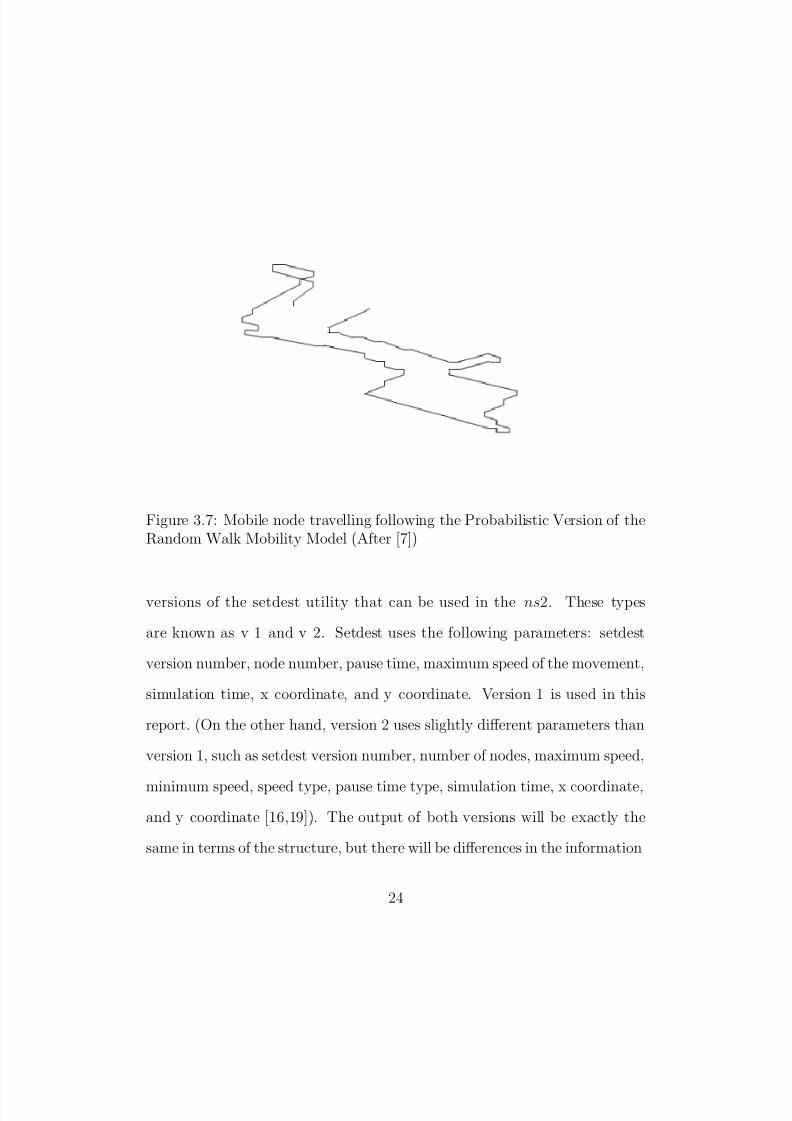
3.7 Mobile node travelling following the Probabilistic Version of
the Random Walk Mobility Model (After [7]) . . . . . . . . . . 24
3.8 The City Section Mobility Model . . . . . . . . . . . . . . . . 25
3.9 The simulation area of Boundless Simulation Area Mobility
Model is shown as a tube [7, 28] . . . . . . . . . . . . . . . . . 27
ix
Page 10
8/12/2019 Raid Alghamdi MCS 2012
http://slidepdf.com/reader/full/raid-alghamdi-mcs-2012 10/96
3.10 Three steps those nodes have to follow once they reach the
boundary. . . . . . . . . . . . . . . . . . . . . . . . . . . . . . 33
4.1 Division the simulation area to sub-areas (Quadrats). . . . . . 39
4.2 Sets of VMR samples . . . . . . . . . . . . . . . . . . . . . . . 43
4.3 101 means (of five VMRs) of the Setdest Utility. . . . . . . . . 44
4.4 101 means (of five VMRs) of the Custom Generator. . . . . . 45
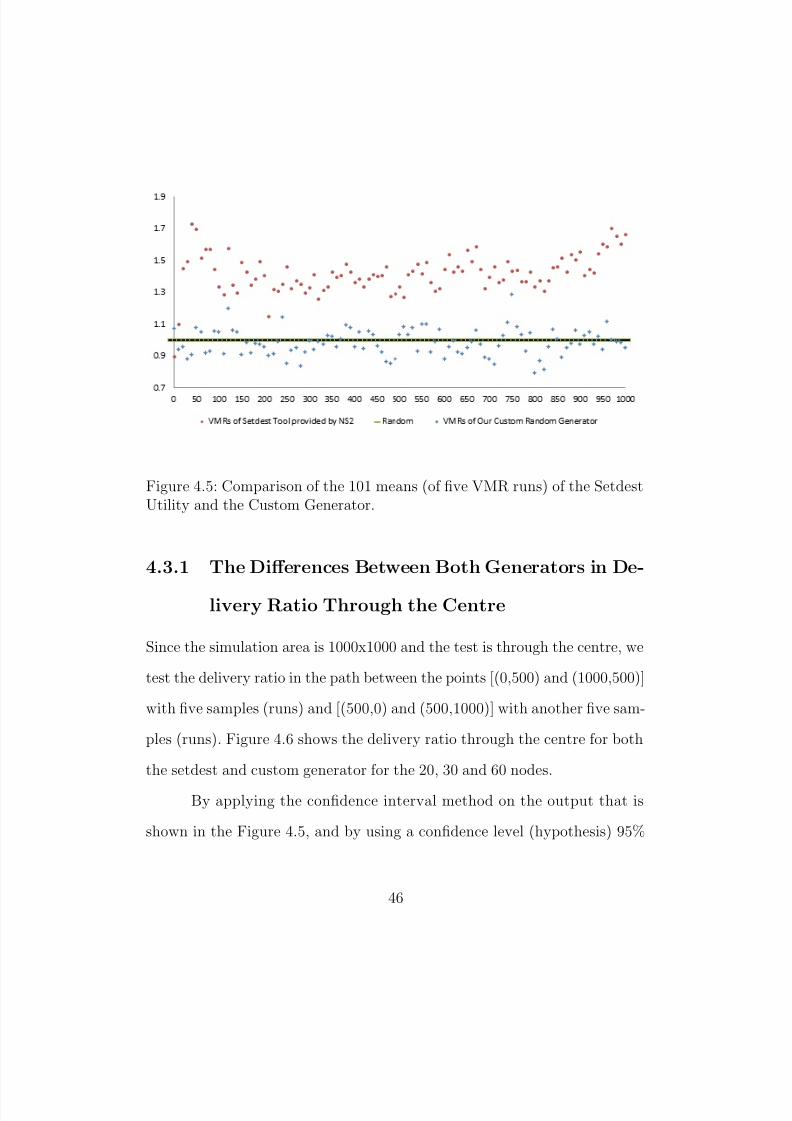
4.5 Comparison of the 101 means (of five VMR runs) of the Setdest
Utility and the Custom Generator. . . . . . . . . . . . . . . . 46
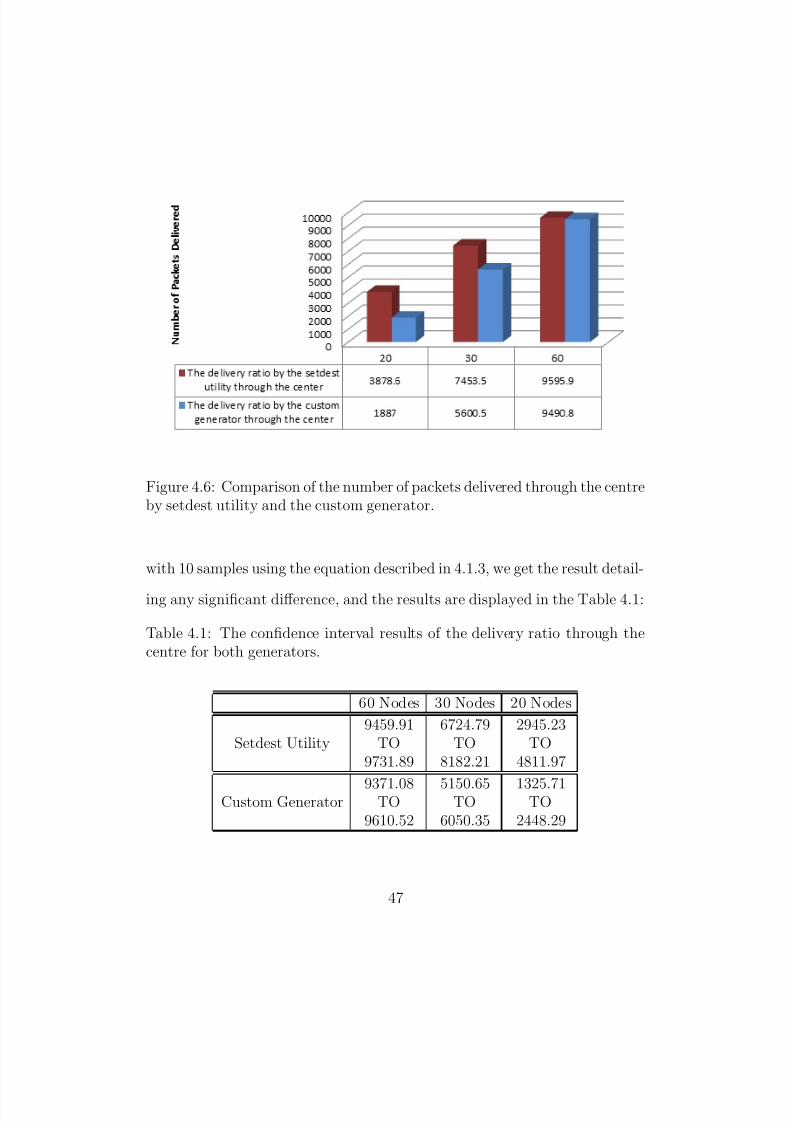
4.6 Comparison of the number of packets delivered through the
centre by setdest utility and the custom generator. . . . . . . . 47
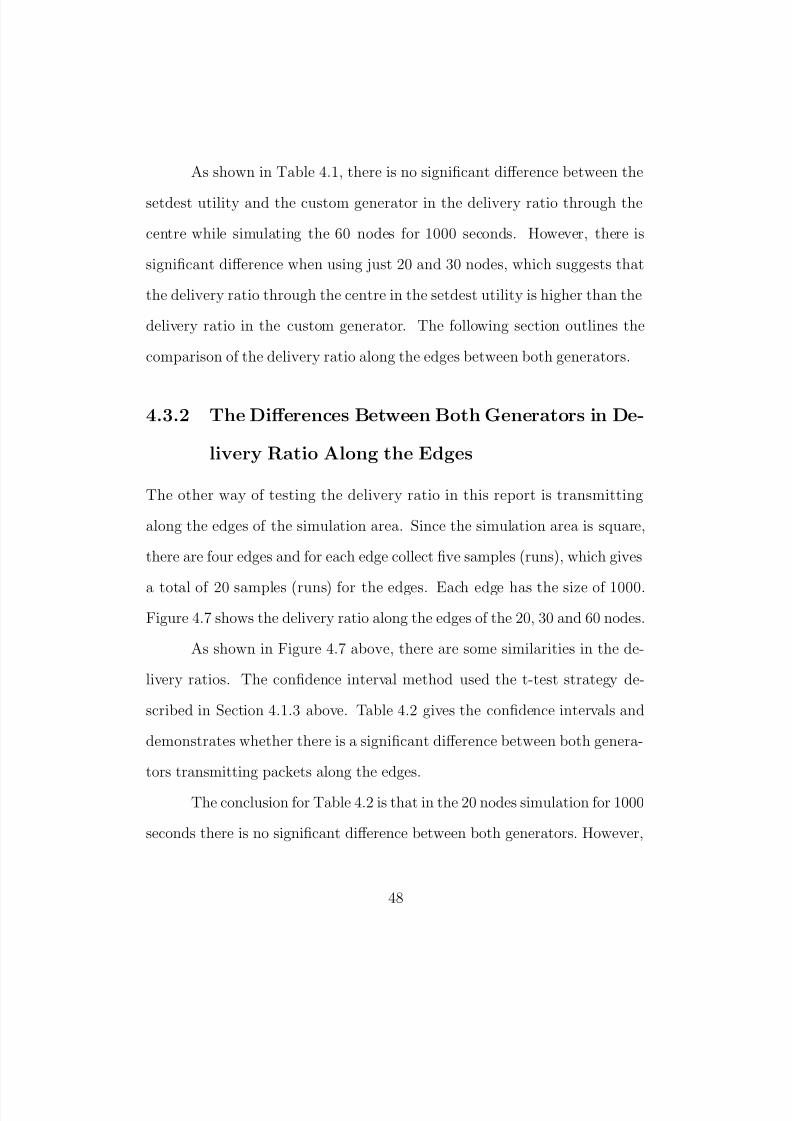
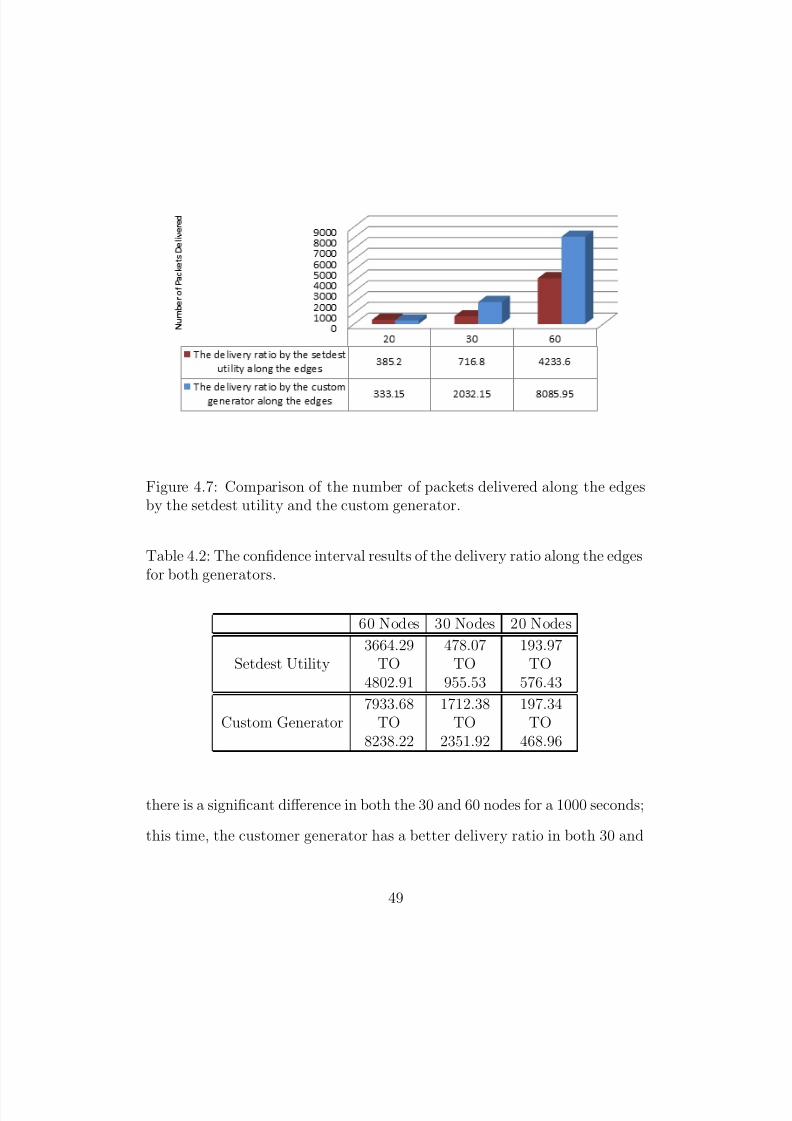
4.7 Comparison of the number of packets delivered along the edges
by the setdest utility and the custom generator. . . . . . . . . 49
4.8 Comparison of the number of packets delivered through the
centre and along the edges using the setdest utility. . . . . . . 504.9 Comparison of the number of packets delivered through the
centre and along the edges using the custom generator. . . . . 51
x
Page 11
8/12/2019 Raid Alghamdi MCS 2012
http://slidepdf.com/reader/full/raid-alghamdi-mcs-2012 11/96
List of Abbreviations
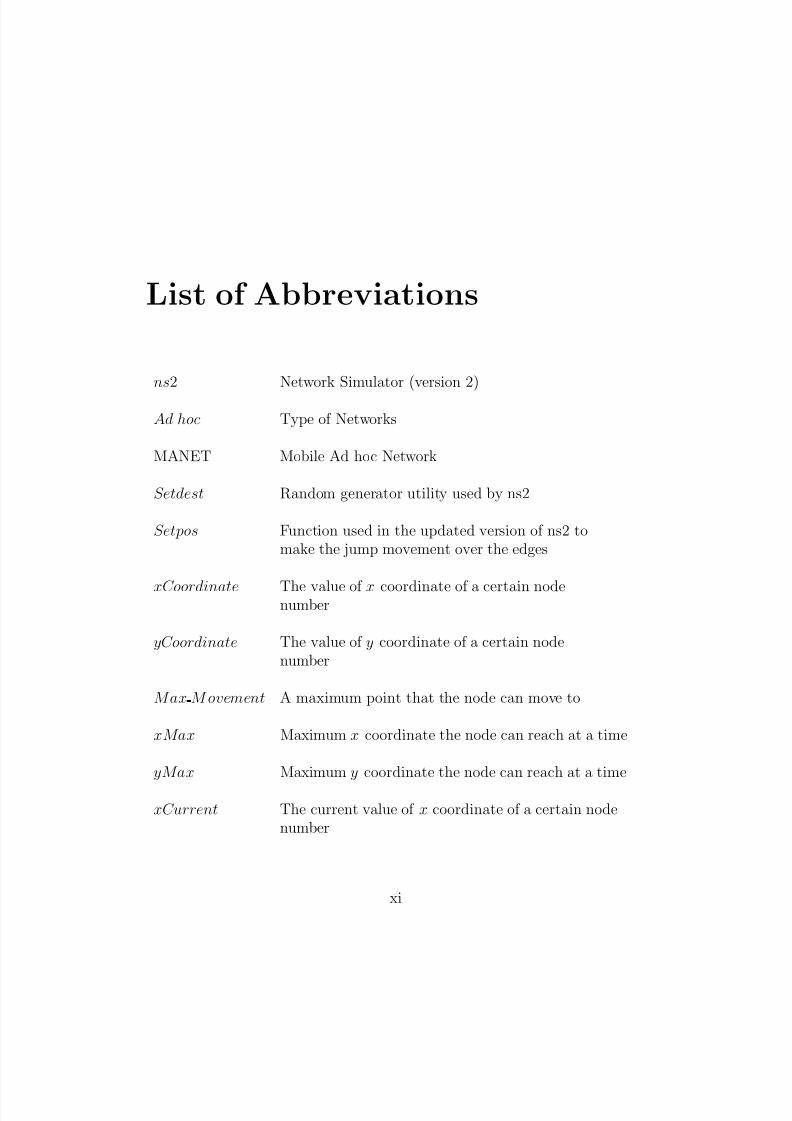
ns2 Network Simulator (version 2)
Ad hoc Type of Networks
MANET Mobile Ad hoc Network
Setdest Random generator utility used by ns2
Setpos Function used in the updated version of ns2 tomake the jump movement over the edges
xCoordinate The value of x coordinate of a certain nodenumber
yCoordinate The value of y coordinate of a certain nodenumber
Max M ovement A maximum point that the node can move to
xMax Maximum x coordinate the node can reach at a time
yMax Maximum y coordinate the node can reach at a time
xCurrent The current value of x coordinate of a certain nodenumber
xi
Page 12
8/12/2019 Raid Alghamdi MCS 2012
http://slidepdf.com/reader/full/raid-alghamdi-mcs-2012 12/96
Page 13
8/12/2019 Raid Alghamdi MCS 2012
http://slidepdf.com/reader/full/raid-alghamdi-mcs-2012 13/96
Chapter 1
Introduction
This report focuses on two main aspects: investigating the setdest utility
used in the open source network simulator ns2 which is generating random
movements of the nodes, and building a new random movement generator
that can work with the ns2 as well[16,19]. For the investigating portion,
we will compare and contrast the randomness and the delivery ratios of both
generators. In this chapter, we present a general view of the networking from
both wired and wireless perspectives, of mobile networks, and of mobile ad
hoc networks. We also investigate the network performance methods and
finally outline the description and scope of the problem.
1
Page 14
8/12/2019 Raid Alghamdi MCS 2012
http://slidepdf.com/reader/full/raid-alghamdi-mcs-2012 14/96
1.1 Networking
Generally speaking, communication networks can be divided into two main
categories: wired and wireless. Wired networks exist between a number of
devices connected to each other using connecting media such as cables and
routers. Wired networks can be applied within an area limited by the cables
and routers that allow for sending and receiving of data. Wireless networks,
on the other hand, are free of such space limitations and are able to connect
different devices more easily. A wireless node can function both as different
hosts and different routers and it forwards the packets to neighboring nodes.
1.1.1 Wired Networks
Wired networks are networks that contain two or more computers connected
to each other using cables and routers to deliver data packets between com-
puters. Wired networks are limited by the physical cables required to connect
the computers.
1.1.2 Wireless Networks
Wireless networks are networks that have a number of devices connected
to each other without using any kind of cables to deliver the data packets.
Transmission takes place over a wireless medium, typically electromagnetic
(radio) waves. Nodes in wireless networks play an important role in sending
and receiving data packets while simultaneously acting as routers. There are
2
Page 15
8/12/2019 Raid Alghamdi MCS 2012
http://slidepdf.com/reader/full/raid-alghamdi-mcs-2012 15/96
six types of wireless network; each has criteria distinguishing it from the oth-
ers. These types are wireless personal area networks (WPANs), wireless local
area networks (WLANs), wireless wide area networks, wireless metropolitan
area networks, mobile devices networks, and finally, wireless mesh networks
[29]. This report focuses primarily on mobile networks.
1.1.2.1 Mobile Networks
Mobiles (cell phones) have become one of the necessities of daily life. Mobilesmake communications among people much easier and play an important role
in many aspects of our lives, including communicating with family, friends,
work or study colleagues, and business associates. Mobiles can do much more
than a typical communication using voice. Mobiles can make calls, send
text messages, capture pictures and videos, browse the internet, use social
networks, and many other things not related to this study. Mobiles connect
to the internet using the Internet Protocol (IP) [1]. IP is a network layer of
the TCP/IP protocol stack that delivers the packets of information [1]. The
TCP/IP protocol stack is created based on five layers to send and receive
information between two units [1]. There are some other protocols used
with mobiles such as MITP and MVoIP. MITP is based on Mobile Internet
Telephony Protocol, which is an application layer protocol that deals with
a model known as client and server for mobile Internet services [2]. MVoIP
is another protocol that is used to communicate and pass voice through the
mobile; it stands for Mobile Voice over IP [3].
3
Page 16
8/12/2019 Raid Alghamdi MCS 2012
http://slidepdf.com/reader/full/raid-alghamdi-mcs-2012 16/96
A cellular network is a large network that contains mobile nodes along
with base stations [4]. A cellular network can have more than one base sta-
tion, and all base stations are connected to each other to make the whole
network. A base station is a node that has different criteria from other
nodes, such as a high energy demand [5]. Furthermore, the base station
is a fixed-location transceiver that serves each cell in the area [6]. Hun-
dreds of phone users in a specific area who are supported by the same base
station are assigned different frequencies. Multiple base stations and theircontrollers can be connected by one of three link types: wireline, fiberline,
or wireless microwave links. A base station controller typically serves more
than 100,000 phone users and switches their support among adjacent base
stations. Base stations have characteristics such as location, connectivity to
public switched telephone network, use of mobile switching centres, and the
ability to communicate with mobile stations using transceivers. Frequency
reuse is a highly-common strategy in cellular networks. Adjacent cells in a
network each use a radio frequency; given their limited number, frequencies
are reused under the restriction that adjacent cells cannot have the same
frequency [11].
Networks containing computers, mobiles, game devices, etc., can be
connected to each other by different types of wireless networks, called ad hoc
networks. Ad hoc networks are different from other networks because they
have no need for designated routers or centralized control of the network.
Ad hoc is originally a Latin phrase meaning for this purpose. Ad hoc
4
Page 17
8/12/2019 Raid Alghamdi MCS 2012
http://slidepdf.com/reader/full/raid-alghamdi-mcs-2012 17/96
is a connection between two or more devices, and it can be either wired or
wireless without central control [7][11]. Two mobile hosts can communicate
with each other without having both hosts in the same range of transmission
as long as the packets can be transferred between them with the help of other
mobile hosts [7]. Having ad hoc networks without central control gives the
opportunity for a number of different applications to deal with the ad hoc.
There are three main applications that can deal with wireless ad hoc net-
works. These are wireless mesh networks (WMN), wireless sensor networks(WSN), and mobile ad-hoc networks (MANET) [22].
Firstly, wireless mesh networks have nodes containing mesh routers
and mesh clients [8]. The nodes in this application can be hosts, routers
to transfer the packets for themselves, or nodes that have no direct wire-
less connection with their destinations [8]. Wireless mesh networks have
the advantages of low up-front costs, ease of maintenance, robustness, and
trustworthy service coverage [8].
Secondly, a wireless sensor network is a number of sensors or nodes
connected to each other using wireless network media to accomplish sensing
tasks [10]. Wireless sensor networks can be used in many ways, such as se-
curity, monitoring, or following patients health [10]. The main advantages
of wireless sensor network application are low power for communicating un-
tethered over a short distance and collaboration with the others as a group
[9].
Finally, mobile ad hoc networks (MANETs) will be described in detail
5
Page 18
8/12/2019 Raid Alghamdi MCS 2012
http://slidepdf.com/reader/full/raid-alghamdi-mcs-2012 18/96
in the following section.
1.1.2.2 Mobile Ad hoc Networks (MANET)
The mobile ad hoc network (MANET) is a subcategory of ad hoc networks,
which are described in detail in the previous section. Ray argues that with the
advent of newer technologies, mobile ad hoc networks are becoming an inte-
gral part of next-generation networks because of its exibility, autoconguration
capability and lack of infrastructure, ease of maintenance, self-administrationcapabilities, and cost-effectiveness [12]. A MANET contains mobile nodes
that can be connected wirelessly to each other, for example, through ei-
ther Wi-Fi or Bluetooth. Node can be connected over wireless links in ad
hoc fashion without central control; this is one of the main advantages of
MANETs. In addition, MANET is dynamic and does not rely on fixed or
static structures [12].
Consequently, the frequent changes that occur in network topology
play a very important role in mobile ad hoc network protocols performance
[12]. MANET consists of mobile nodes, and these nodes move in the space
following a pattern based on user preferences, or they follow an algorithm
that can be random or uniform. There are many mobility models for ad hoc
networks. In this report, some of them will be described in detail in Chapter
3, such as Random Walk Mobility Model, Random Waypoint Mobility Model,
Random Direction Mobility Model, A Boundless Simulation Area Mobility
Model, GaussMarkov Mobility Model, A Probabilistic Version of the Random
6
Page 19
8/12/2019 Raid Alghamdi MCS 2012
http://slidepdf.com/reader/full/raid-alghamdi-mcs-2012 19/96
Walk Mobility Model, and City Section Mobility Model [13]. In addition
to continuing the movement, bandwidth optimization, power control, and
transmission quality enhancement are some of the usual factors impacting
MANET performance, all of which are outlined in the literature on wireless
and mobile communication using ad hoc networks [21].
1.2 Investigating Network Performance
Each new network has to be investigated and evaluated before the network
can be opened for regular use. By evaluating network performance, the errors
in network operation can be detected and corrected before the network is put
to use. There are three approaches that can be followed to investigate the
network performance: empirical study, analytical modeling, and simulation.
1.2.1 Empirical Study
In an empirical study, the actual network is used under a controlled envi-
ronment. Test users that behave like real users are needed. Performance is
measured by observing the actual network in use. The main inconvenience of
this approach is that the entire network or a significant portion thereof must
be built, which can be both difficult and expensive. In an empirical study,
the actual network is used under a controlled environment. Test users that
behave like real users are needed. Performance is measured by observing the
actual network in use. The main inconvenience of this approach is that the
7
Page 20
8/12/2019 Raid Alghamdi MCS 2012
http://slidepdf.com/reader/full/raid-alghamdi-mcs-2012 20/96
entire network or a significant portion thereof must be built, which can be
both difficult and expensive.
1.2.2 Analytical Modeling
Analytical modeling is a tool that uses analytical techniques to predict net-
work performance. Using mathematical formulae to calculate interactions
that might happen between different network entities allows us to predict
network performance. Analytical models help to detect errors that might
occur while the network is operational so that they can be solved before
the actual network is constructed. Analytical modeling should be done us-
ing one-dimensional and two-dimensional tests with both static and dynamic
situations for topology. Analytical modeling will be examined in more detail
in Chapter 4 below.
1.2.3 Simulation
Simulation is testing using a computer program to track the behaviour of a
network. Simulation includes protocol simulation, movement simulation, and
traffic generators. Network simulation helps determine how a real network
would function and helps predict the networks behaviour. Several program-
ming languages and simulators are used for network simulation, such as Java,
C, or ns2; in this report, however, we focus on ns2 and Java only.
8
Page 21
8/12/2019 Raid Alghamdi MCS 2012
http://slidepdf.com/reader/full/raid-alghamdi-mcs-2012 21/96
1.2.3.1 Network Simulator
A network simulator (or ns2) is a functional tool that was first used in 1989
and became one of the most commonly used tools for testing networks [27].
Ns2 uses the same functions as protocols such as TCP and UDP to simulate
the nodes movements and behaviours and to choose the appropriate network
type and the preferred traffic model [27]. All aspects of simulation are defined
in a TCL script that denotes the number of nodes, the topology, the data
traffic etc. Using the Network AniMator (NAM), ns2 visually depicts the
movement of nodes and the transfer of packets [27].
The random movement in ns2 is implemented using a tool called set-
dest. Setdest is an independent tool that generates the movement and creates
the OTcl file that can be read from the simulation TCL file to simulate the
movement. Setdest generates the movement following the Waypoint Algo-
rithm, which is described in Chapter 3 in more detail [6,13,17,18].
1.3 Problem Description and Scope
The main focus of this study is an investigation of how movement generators
are used in network simulation in ns2 and how to generate random movement
for the nodes in the wireless network.
In order to evaluate the network performance, we need to simulate not
only the network behaviour but also, in the case of mobile networking, the
node movement itself. This requires generating the nodes trajectories and
9
Page 22
8/12/2019 Raid Alghamdi MCS 2012
http://slidepdf.com/reader/full/raid-alghamdi-mcs-2012 22/96
movements, which can be accomplished with a movement generator. Every
mobile network simulation requires such generators; as a result, we need a
variety of movement generators to study different mobile network scenarios.
The main scope of this report is the investigation of the setdest util-
ity used in ns2 to generate the random movement, and the development of a
new random movement generator for use in ns2. In particular, this report de-
scribes the performance of ns2 setdest, from the point of view of how random
the movement is, using statistical tests. Also, a new method for generatingsimulation movement is described and integrated into ns2 simulation.
In Chapter 2, we present the background information and the related
work on movement generators. In Chapter 3, we present the movement
in MANET, providing some movement types supported by some mobility
models. Finally, in Chapter 4, we investigate the performance of the setdest
utility and the custom generator using some tests also described in that same
chapter.
10
Page 23
8/12/2019 Raid Alghamdi MCS 2012
http://slidepdf.com/reader/full/raid-alghamdi-mcs-2012 23/96
Chapter 2
Background
Section 2.1 covers the major factors and movements that impact the networks
performance. Section 2.2 identifies some related works that have been done
by other researchers working in this field.
2.1 Factors that Impact Network Performance
Network performance is not always consistent across networks because there
are some factors that play important roles in the performance. Each in-
dividual factor, or a combination of more than one factor, can change the
performance of the network. Some of the main parameters that can make
the difference to the network performance are bandwidth and latency.
Bandwidth is one of the characteristic measurements used to test net-
work performance, and sometimes it is also be as a throughput. Second,
11
Page 24
8/12/2019 Raid Alghamdi MCS 2012
http://slidepdf.com/reader/full/raid-alghamdi-mcs-2012 24/96
latency is the other major method of measuring network performance. La-
tency, also known as delay, refers to the time it takes for a message to travel
from one end of the network to the other. The propagation time, transmit
time and queuing time are the three major components that on which latency
is based.
2.1.1 Movement has Performance Impact
In mobile networks like MANET, the node movement results in changes
to the network topology and in turn has an impact on the performance of
the entire network. The movement of mobile nodes can be classified under
three main categories: deterministic, random and uniform. Each of these
movement categories has a number of movement styles, and each style has
its own performance. Each movement style impacts the movements within
the network and cosequentily the netwok performance directly or indirectly
and positively or negatively, all which could determine network performance
to greater or lesser extents. The theory of natural movement as studied by
N.S. Dalton and R.C. Dalton tried to quantify the effect on the performance
of MANET [23]. One previous study at UNB by Xinmei Zhang investigated
two main movement styles, random movement and urban movement, and
compared them in terms of their impact on the network performance [32].
12
Page 25
8/12/2019 Raid Alghamdi MCS 2012
http://slidepdf.com/reader/full/raid-alghamdi-mcs-2012 25/96
Page 26
8/12/2019 Raid Alghamdi MCS 2012
http://slidepdf.com/reader/full/raid-alghamdi-mcs-2012 26/96
F. Choy, J. Bltjens and R. H. Soni, in [26] investigated the perfor-
mance of the hyper wireless ad hoc networks in two main ways, with static
and dynamic nodes. They used a number of movement mobility models to
perform this investigation, and as a result of their work they stated that there
was no significant impact on some of the performance categories they used,
such as packet delivery ratio and routing load. However, other categories
such as throughput and end-to-end delay varied from time to time.
At UNB, Xinmei Zhang [32] discussed the MANET performance indifferent simulated environments. Zhangs report relied on the free space
environment and the urban environment to investigate network performance.
The main result was that MANETs performance in free space was better than
the one in the urban environment. The testing of the two environments was
done using two routing protocols: DSDV and DSR.
14
Page 27
8/12/2019 Raid Alghamdi MCS 2012
http://slidepdf.com/reader/full/raid-alghamdi-mcs-2012 27/96
Chapter 3
Movement in MANETs
There are five types of mobility models described in [7]:
• Exponential Correlated Random Mobility Model,
• Column Mobility Model,
• Nomadic Community Mobility Model,
• Pursue Mobility Model,
• Reference Point Group Mobility Model.
Firstly, Exponential Correlated Random Mobility Model is a group
mobility that has movement created using motion equations with a given
position of a node or group of nodes at a specific time. Secondly, Column
Mobility Model has a methodology of searching and scanning nodes following
a given line, allowing each node to follow the other in a specific direction.
15
Page 28
8/12/2019 Raid Alghamdi MCS 2012
http://slidepdf.com/reader/full/raid-alghamdi-mcs-2012 28/96
Thirdly, the Nomadic Community Mobility Model is a number of movements
from one point to another as a group following specific realistic scenarios.
Fourthly, Pursue Mobility Model also follows specific realistic scenarios for
a group of mobile nodes. Finally, Reference Point Group Mobility Model
(RPGM) denotes the random motion for a specific node or group of nodes
that has a group leader to control the group motion [7, 3, 4, 2]. In addition
to these five models, node movements can follow different movement types;
three types will be covered more extensively in the following section.
3.1 Movement Types
Mobile ad hoc networks are based mostly on mobiles. Mobiles move around
and change position relative to one another over time. Furthermore, mobiles
or nodes can move following many types of movements, such as deterministic,
random, and other movements. These types of movements can be generated
on the computer using programming languages such as Java or C++, and
then used by ns2 in simulation and movement visualization.
3.1.1 Deterministic Movement
Deterministic movement is based on the source, destination, direction, and
velocity as known parameters [102, 31]. City bus movement is one of the
most popular examples used to explain deterministic movement. A bus in
a certain city has a specified rout and time schedule. Furthermore, the bus
16
Page 29
8/12/2019 Raid Alghamdi MCS 2012
http://slidepdf.com/reader/full/raid-alghamdi-mcs-2012 29/96
source, destination, and direction are always known for every bus; we can
calculate the velocity if needed while the source and destination are known
parameters. This particular example can be shown in Figure 3.1: Example of
the city bus movement model representing buses routes in Fredericton, New
Brunswick with all bus stops placed on the routes directions.
Figure 3.1: Example of the city bus movement model (After [34])
3.1.2 Random Movement
The random mobility used in MANET development and performance evalu-
ation has different types. Even though the node movement is random, thesetypes differ in the way the nodes move. Three random movement types have
been investigated in [7]. These types are Random Walk, Random Waypoint,
17
Page 30
8/12/2019 Raid Alghamdi MCS 2012
http://slidepdf.com/reader/full/raid-alghamdi-mcs-2012 30/96
and Random Direction. Each mobile node in the Random Walk model has
a randomly generated starting position. The nodes travel from their start-
ing position to a randomly generated new location by generating random
direction and velocity. The velocity has to be bounded by minspeed and
maxspeed values and the direction also has to be in range between 0 and 2
[7]. A node changes direction and speed either at the end of a time interval t
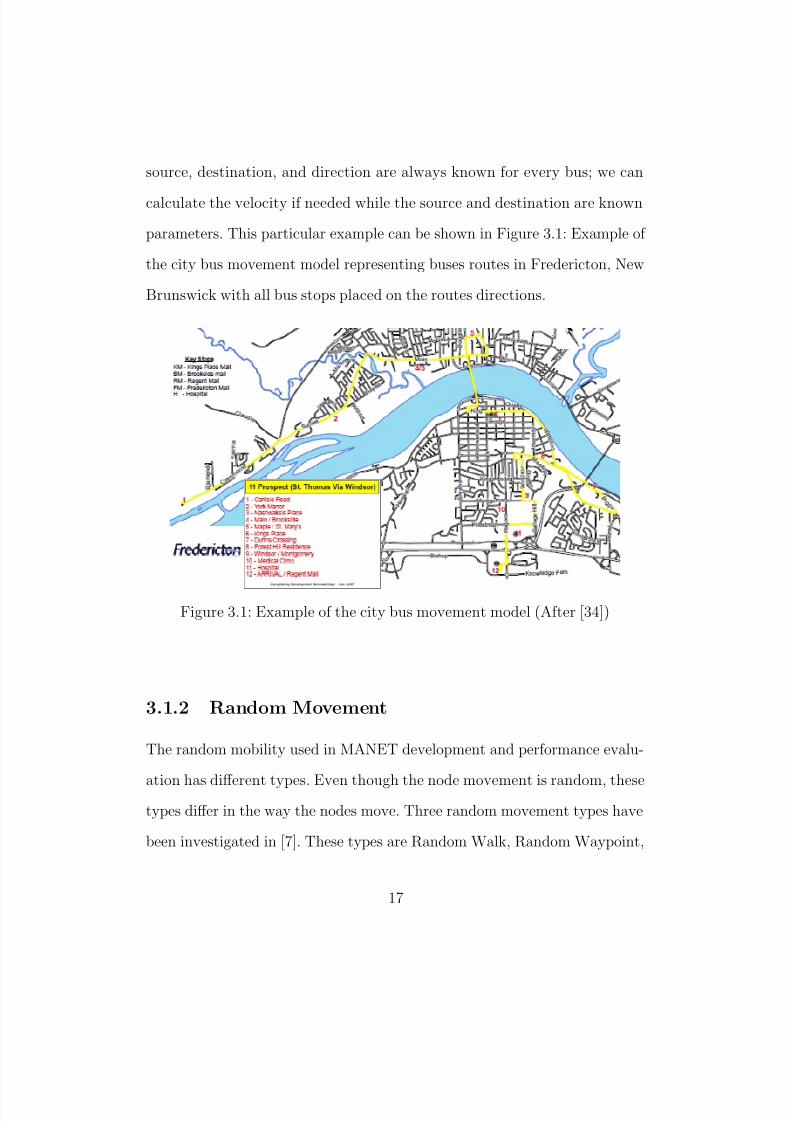
or if it traveled a distance d. The Figure 3.2 demonstrates how the Random
Walk Mobility Model works. In this diagram the path of a single node isshown, with the lines modeling the paths and the dots modeling the turning
points.
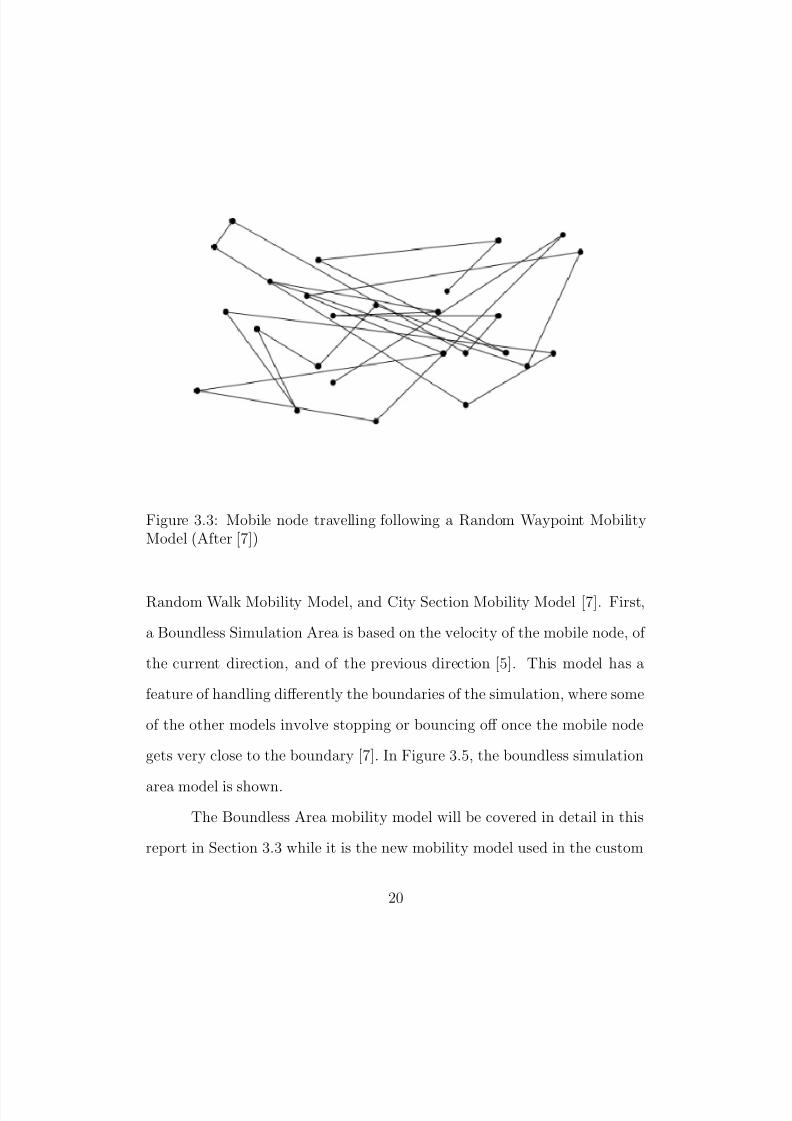
In Random Waypoint, the movement is not constant since pause times
are introduced. The nodes in this model have to pause for some time before
they change direction or speed [7]. The nodes start at randomly chosen posi-
tions, pause for some time, and then start moving in a uniformly distributed
velocity between minspeed and maxspeed towards a chosen destination. The
drawback in Random Waypoint is clustering near the centre (i.e. having the
probability that a nodes is near a given point increase towards the center
of the area). Figure 3.3 shows the mechanism that the Random Waypoint
Mobility Model uses when simulated.
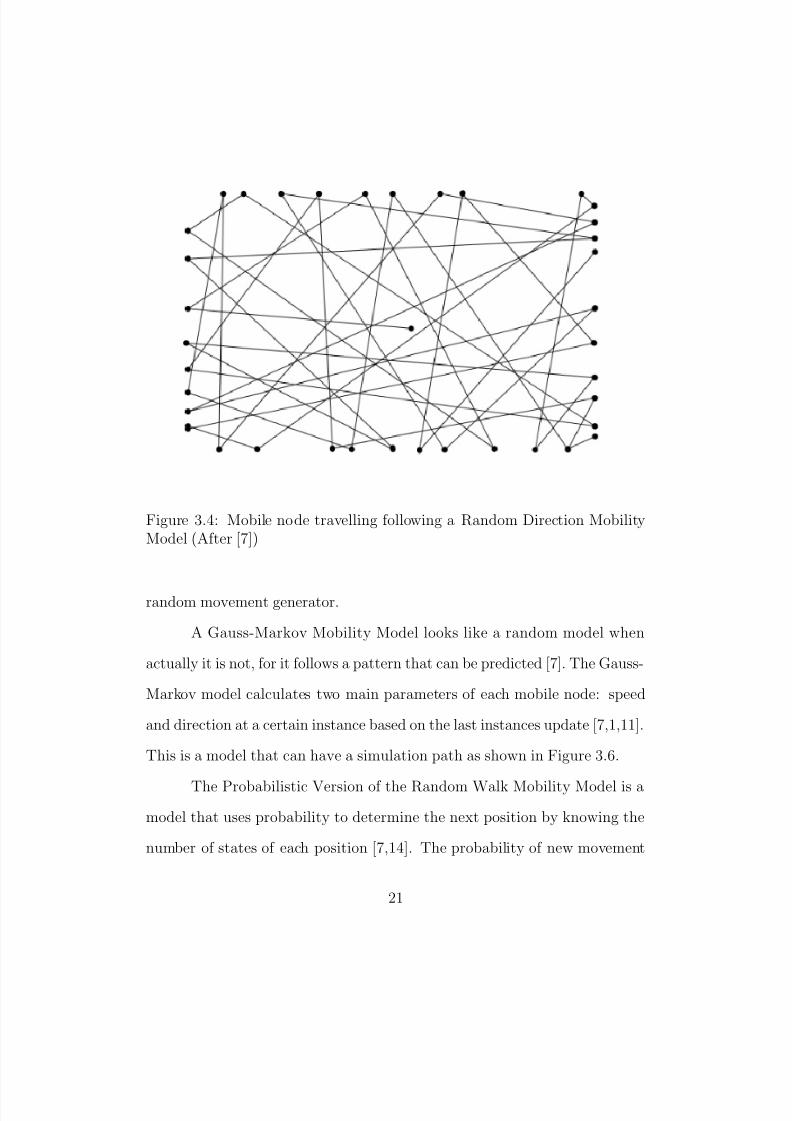
The Random Direction Mobility model [7] was introduced to over-
come the drawback in the Random Waypoint model. In the Random Direc-
tion model, a node travels at a chosen velocity in a chosen direction until
it reaches the boundary or boundaries of the area rather than a randomly
18
Page 31
8/12/2019 Raid Alghamdi MCS 2012
http://slidepdf.com/reader/full/raid-alghamdi-mcs-2012 31/96
Figure 3.2: Mobile node travelling following a Random Walk Mobility Model(After [7])
chosen location. Once a node hits the boundaries, it pauses for a time t,
chooses a new direction, starts moving toward the boundaries again, and so
on. For better understanding of this model, Figure 3.4 shows the Random
Direction Mobility model mechanism.
3.1.3 Other Movement Types
In this section, some other movement models will be discussed. The other
category contains four well known models: Boundless Simulation Area Mo-
bility Model, Gauss-Markov Mobility Model, A Probabilistic Version of the
19
Page 32
8/12/2019 Raid Alghamdi MCS 2012
http://slidepdf.com/reader/full/raid-alghamdi-mcs-2012 32/96
Figure 3.3: Mobile node travelling following a Random Waypoint MobilityModel (After [7])
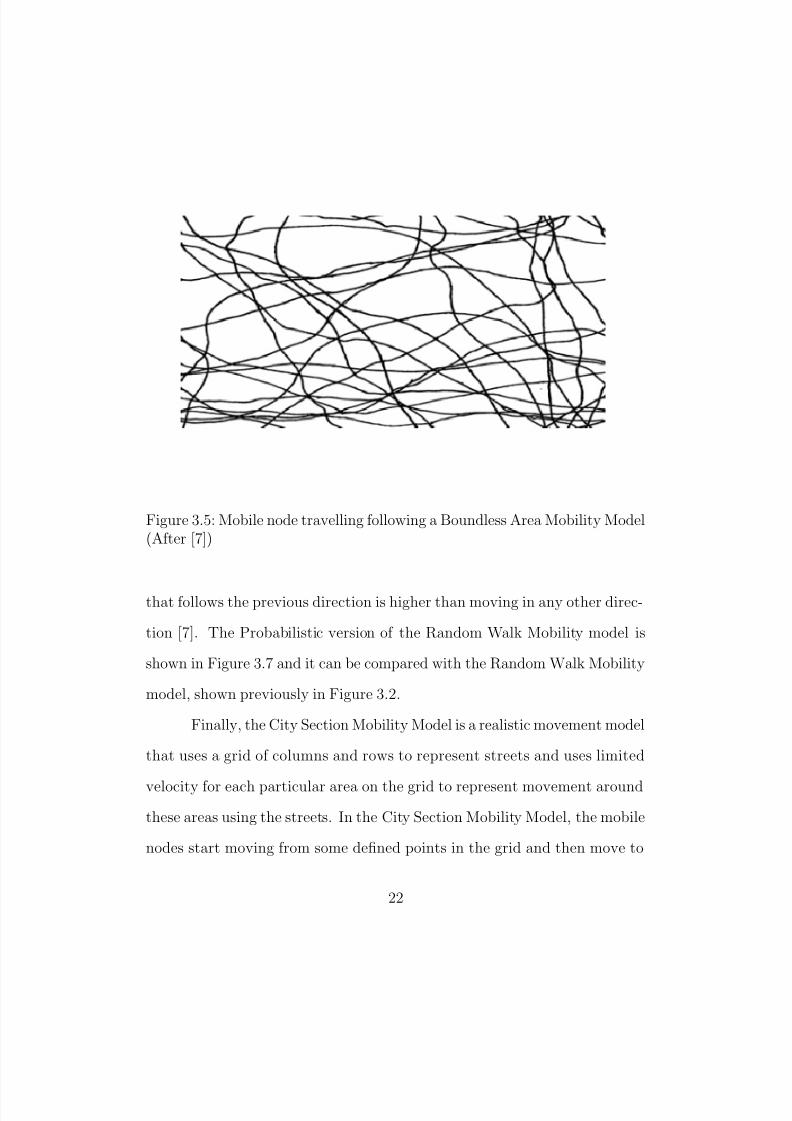
Random Walk Mobility Model, and City Section Mobility Model [7]. First,
a Boundless Simulation Area is based on the velocity of the mobile node, of
the current direction, and of the previous direction [5]. This model has a
feature of handling differently the boundaries of the simulation, where some
of the other models involve stopping or bouncing off once the mobile node
gets very close to the boundary [7]. In Figure 3.5, the boundless simulation
area model is shown.
The Boundless Area mobility model will be covered in detail in this
report in Section 3.3 while it is the new mobility model used in the custom
20
Page 33
8/12/2019 Raid Alghamdi MCS 2012
http://slidepdf.com/reader/full/raid-alghamdi-mcs-2012 33/96
Figure 3.4: Mobile node travelling following a Random Direction MobilityModel (After [7])
random movement generator.
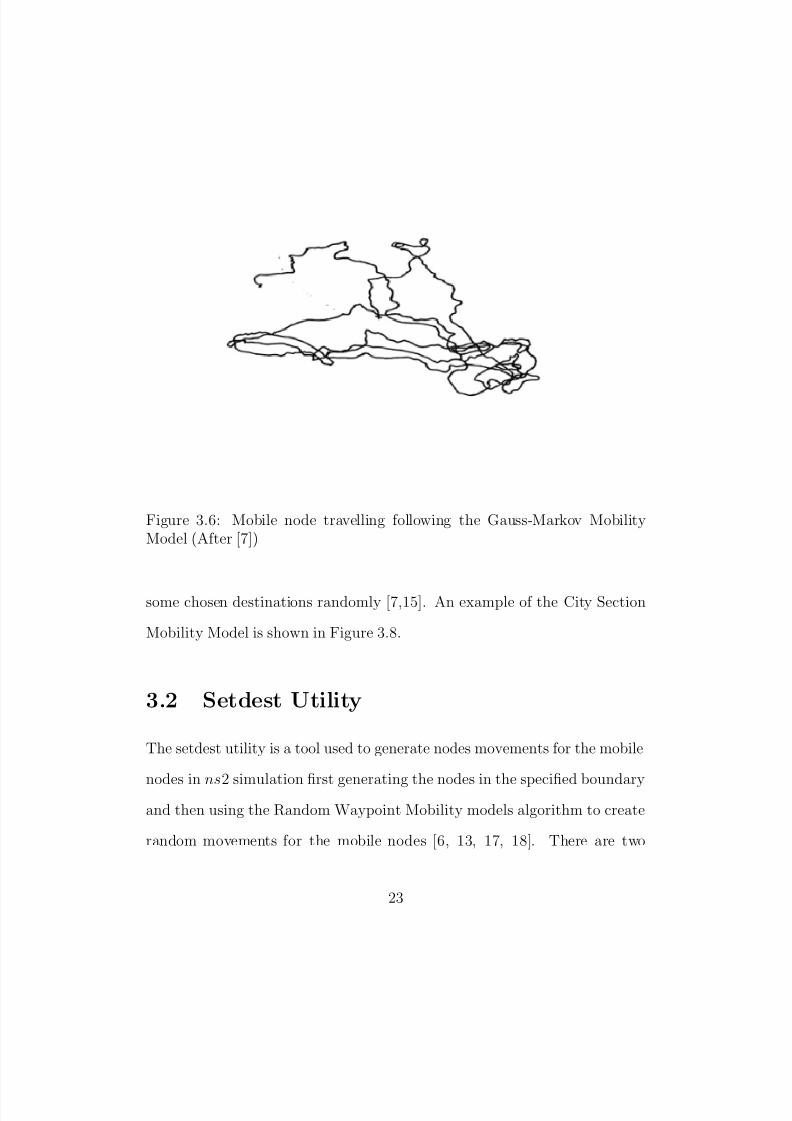
A Gauss-Markov Mobility Model looks like a random model when
actually it is not, for it follows a pattern that can be predicted [7]. The Gauss-
Markov model calculates two main parameters of each mobile node: speed
and direction at a certain instance based on the last instances update [7,1,11].
This is a model that can have a simulation path as shown in Figure 3.6.
The Probabilistic Version of the Random Walk Mobility Model is a
model that uses probability to determine the next position by knowing the
number of states of each position [7,14]. The probability of new movement
21
Page 34
8/12/2019 Raid Alghamdi MCS 2012
http://slidepdf.com/reader/full/raid-alghamdi-mcs-2012 34/96
Figure 3.5: Mobile node travelling following a Boundless Area Mobility Model(After [7])
that follows the previous direction is higher than moving in any other direc-
tion [7]. The Probabilistic version of the Random Walk Mobility model is
shown in Figure 3.7 and it can be compared with the Random Walk Mobility
model, shown previously in Figure 3.2.
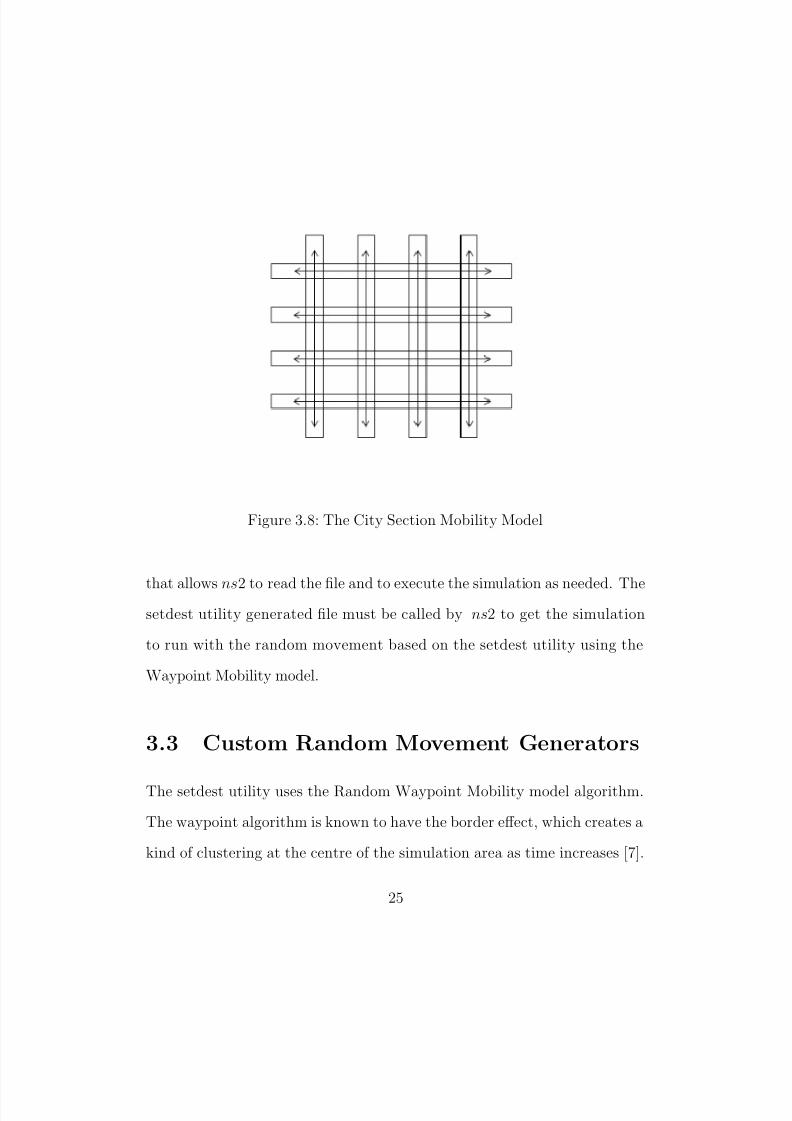
Finally, the City Section Mobility Model is a realistic movement model
that uses a grid of columns and rows to represent streets and uses limited
velocity for each particular area on the grid to represent movement around
these areas using the streets. In the City Section Mobility Model, the mobile
nodes start moving from some defined points in the grid and then move to
22
Page 35
8/12/2019 Raid Alghamdi MCS 2012
http://slidepdf.com/reader/full/raid-alghamdi-mcs-2012 35/96
Figure 3.6: Mobile node travelling following the Gauss-Markov MobilityModel (After [7])
some chosen destinations randomly [7,15]. An example of the City Section
Mobility Model is shown in Figure 3.8.
3.2 Setdest Utility
The setdest utility is a tool used to generate nodes movements for the mobile
nodes in ns2 simulation first generating the nodes in the specified boundaryand then using the Random Waypoint Mobility models algorithm to create
random movements for the mobile nodes [6, 13, 17, 18]. There are two
23
Page 36
8/12/2019 Raid Alghamdi MCS 2012
http://slidepdf.com/reader/full/raid-alghamdi-mcs-2012 36/96
Figure 3.7: Mobile node travelling following the Probabilistic Version of theRandom Walk Mobility Model (After [7])
versions of the setdest utility that can be used in the ns2. These types
are known as v 1 and v 2. Setdest uses the following parameters: setdest
version number, node number, pause time, maximum speed of the movement,
simulation time, x coordinate, and y coordinate. Version 1 is used in this
report. (On the other hand, version 2 uses slightly different parameters than
version 1, such as setdest version number, number of nodes, maximum speed,
minimum speed, speed type, pause time type, simulation time, x coordinate,
and y coordinate [16,19]). The output of both versions will be exactly the
same in terms of the structure, but there will be differences in the information
24
Page 37
8/12/2019 Raid Alghamdi MCS 2012
http://slidepdf.com/reader/full/raid-alghamdi-mcs-2012 37/96
Figure 3.8: The City Section Mobility Model
that allows ns2 to read the file and to execute the simulation as needed. Thesetdest utility generated file must be called by ns2 to get the simulation
to run with the random movement based on the setdest utility using the
Waypoint Mobility model.
3.3 Custom Random Movement Generators
The setdest utility uses the Random Waypoint Mobility model algorithm.
The waypoint algorithm is known to have the border effect, which creates a
kind of clustering at the centre of the simulation area as time increases [7].
25
Page 38
8/12/2019 Raid Alghamdi MCS 2012
http://slidepdf.com/reader/full/raid-alghamdi-mcs-2012 38/96
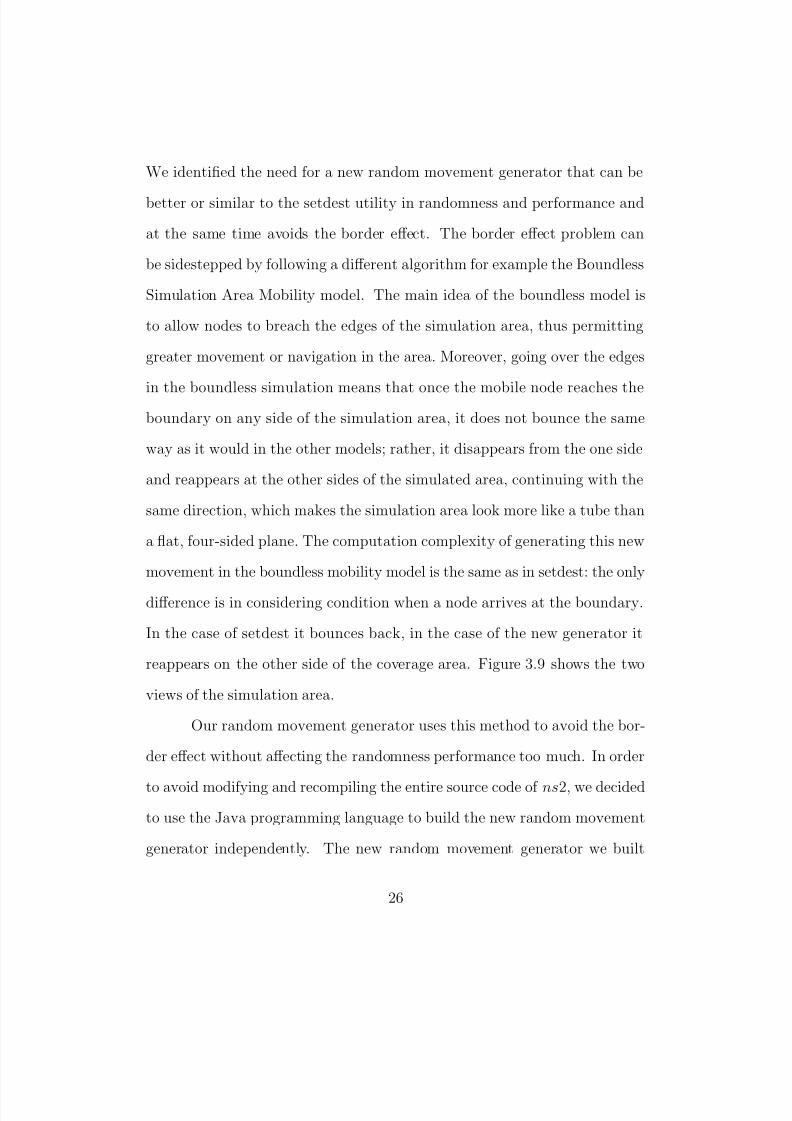
We identified the need for a new random movement generator that can be
better or similar to the setdest utility in randomness and performance and
at the same time avoids the border effect. The border effect problem can
be sidestepped by following a different algorithm for example the Boundless
Simulation Area Mobility model. The main idea of the boundless model is
to allow nodes to breach the edges of the simulation area, thus permitting
greater movement or navigation in the area. Moreover, going over the edges
in the boundless simulation means that once the mobile node reaches theboundary on any side of the simulation area, it does not bounce the same
way as it would in the other models; rather, it disappears from the one side
and reappears at the other sides of the simulated area, continuing with the
same direction, which makes the simulation area look more like a tube than
a flat, four-sided plane. The computation complexity of generating this new
movement in the boundless mobility model is the same as in setdest: the only
difference is in considering condition when a node arrives at the boundary.
In the case of setdest it bounces back, in the case of the new generator it
reappears on the other side of the coverage area. Figure 3.9 shows the two
views of the simulation area.
Our random movement generator uses this method to avoid the bor-
der effect without affecting the randomness performance too much. In order
to avoid modifying and recompiling the entire source code of ns2, we decided
to use the Java programming language to build the new random movement
generator independently. The new random movement generator we built
26
Page 39
8/12/2019 Raid Alghamdi MCS 2012
http://slidepdf.com/reader/full/raid-alghamdi-mcs-2012 39/96
Figure 3.9: The simulation area of Boundless Simulation Area MobilityModel is shown as a tube [7, 28]
generates a file readable by ns2 that has all the movements of all the nodes
during the simulation time. During testing, while applying the Boundless
Area Mobility model to the new movement generator, we faced a problem:
ns2 does not allow for a node disappearing from one edge and reappearing at
another edge. To address this issue, we had to split a single motion specifi-
cation for a node into three steps: motion to the boundary, then skipping to
the other side of the simulation area followed by continued motion from the
other boundary to the destination. Shipping to a new position is not sup-
ported by a standard version of ns2. Our solution proposed by DeDourek
uses a new function, setpos, which forces a new position on a mobile node,
without moving along a straight line like in the setdest function [33].
27
Page 40
8/12/2019 Raid Alghamdi MCS 2012
http://slidepdf.com/reader/full/raid-alghamdi-mcs-2012 40/96
Once this problem of jumping from one edge to another was solved,
we applied this method to ns2 using the Java code. The Java code firstly
generates the initial random positions of the nodes, giving them a random
double for the x Coordinate between zero and xMax, a random double for
the y Coordinate between zero and yMax, and zCoordinate equal to zero
at all times for all nodes, where xMax and yMax are entered by the user
along with the simulation time. These initial coordinates of x, y , and z have
to follow a specific format that allows ns2 to read it correctly. The followingis an example of the initial random position of one node in ns2 TCL format:
$node (0) set X 323.81544267544473
$node (0) set Y 576.9394231828528
$node (0) set Z 0.000000000000
After randomly setting the initial positions of the nodes, it is the time
to create the nodes movements by taking into account the following four main
parameters: xEdgeMax, yEdgeMax, the simulation time and the maximum
value of the interval Max Movement. The node movements commands can
be in one of two main formats. The first format is used for the node that
does not reach the boundary, and this kind of format has the time, node
number, xCoordinate, yCoordinate and speed. The other format is used
for the nodes that jump from one side to the other. This second format has
a small difference in the parameters than the first format. In this second
28
Page 41
8/12/2019 Raid Alghamdi MCS 2012
http://slidepdf.com/reader/full/raid-alghamdi-mcs-2012 41/96
format we used setpos instead of setdest based on DeDoureks modifications
to the ns2 mentioned above. Moreover, in this format there is no speed in
one of the three movement commands that will be generated for the nodes
which cross the borders. We used setpos instead of setdest because the node
disappears from one side and reappears at the other side at precisely the same
time. The time generated in setdest command is chosen randomly between
0.0 and simulation time for all nodes. Moreover, the time for each movement
of a single node depends on the time for the node immediately previous.First, the initial time used for each node as the pause time and also as the
first value for simulation time is chosen randomly between the 0.0 and 5.0
to keep the initial pause of the movement as brief as possible. The following
equation shows how the initial node time is calculated:
T initial = 5 > Randomdouble > 0 (3.1)
Second, for all other moves, we set the pause time to 0 and increase
the simulation time with a random double value between 0.0 and 15.0 (the
maximum value of 15 was chosen to match the speed of movement in the
custom generator with the corresponding value used in setdest), and the
only difference between the second move and the rest of the moves is that
the time for the second move will be added to the initial time; however, for
all subsequent moves, the equation will be different and will be shown later
in this Section. The following equation demonstrates the second move of a
29
Page 42
8/12/2019 Raid Alghamdi MCS 2012
http://slidepdf.com/reader/full/raid-alghamdi-mcs-2012 42/96
node that had an initial time calculated:
∆T = (15 ≥ Randomdouble ≥ 0) + T initial (3.2)
Third, for all the movements from the third movement on and the
time will be calculated using the following equation:
∆T new = (15 ≥ Randomdouble ≥ 0) + ∆T (3.3)
Time is not the only random dynamic parameter in the movement
commands, for the new position which includes the xCoordinate and
yCoordinate is also a random dynamic parameter that uses a random double
interval. Generating new positions for the nodes is based on two parameters:
the angle and the random interval. Firstly, before generating a new position
for a node, a random angle between 0 and 360 degrees has to be chosen based
on the current position of the node using the following equation:
angle = (360 > Randomdouble > 0) (3.4)
Once the angle is chosen, using the maximum value of the interval
is known from the user input, we can calculate the new xMax and yMax
which is the end coordinates of the interval using the following equations:
xMax = cos(angle)×Max M ovement (3.5)
30
Page 43
8/12/2019 Raid Alghamdi MCS 2012
http://slidepdf.com/reader/full/raid-alghamdi-mcs-2012 43/96
yMax = sin(angle)×Max M ovement (3.6)
After determining the xMax and yMax, we now can calculate the
new destination for a node that based on three main thingsthe angle, the
Max M ovement, and xMax and yMaxby adding the new x and y coordi-
nates to the previous coordinates following these equations:
New xCoordinate + = xMax > Randomdouble > 0 (3.7)
New yCoordinate + = yM ax > Randomdouble > 0 (3.8)
The speed in the custom generator is calculated based on four mainparameters, which are xCurrent, yCurrent, xOld, yOld, CurrentT and
NewMovementT . Since we have these parameters, we can calculate the time
for the current movement to reach the new position at exactly the specified
time with the calculated speed using this equation:
speed =
(xCurrent − xOld)2 + (yCurrent− yOld)2
(NewMovementT − CurrentT )
(3.9)
Finally, as described above, the movements commands can be for ei-
ther a node that does not cross the border(s) or a node goes across the border.
31
Page 44
8/12/2019 Raid Alghamdi MCS 2012
http://slidepdf.com/reader/full/raid-alghamdi-mcs-2012 44/96
Page 45
8/12/2019 Raid Alghamdi MCS 2012
http://slidepdf.com/reader/full/raid-alghamdi-mcs-2012 45/96
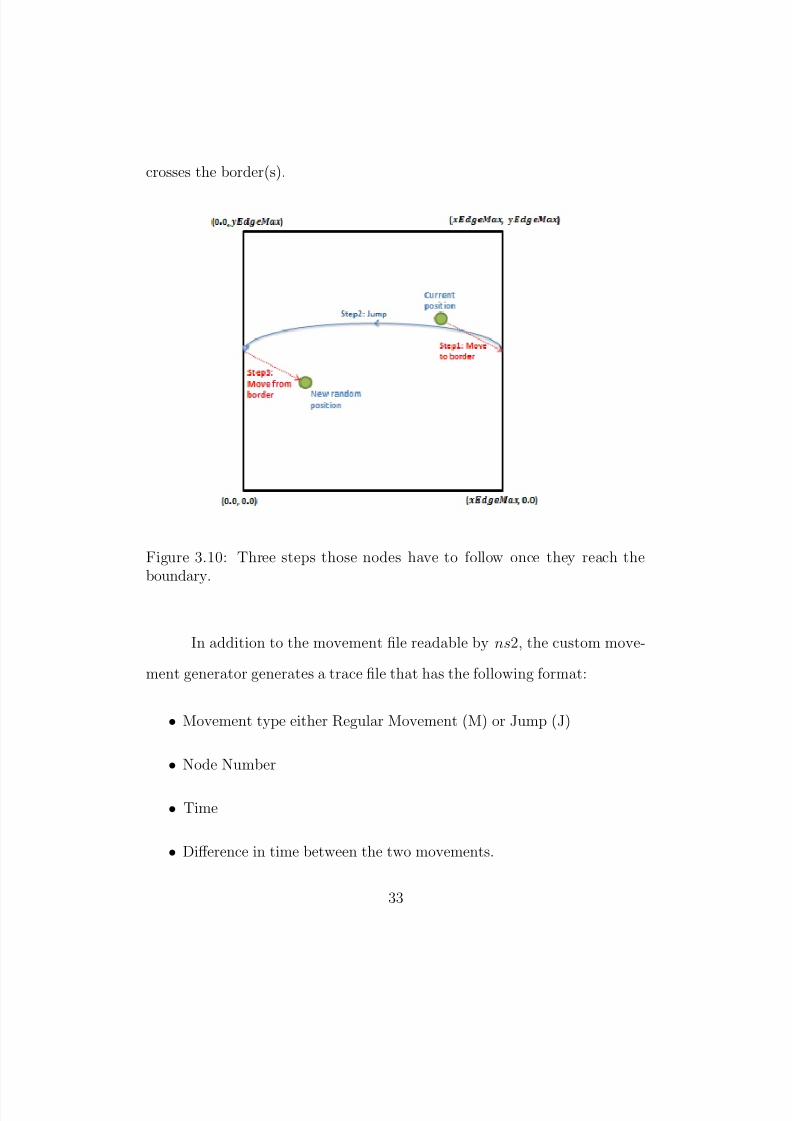
crosses the border(s).
Figure 3.10: Three steps those nodes have to follow once they reach theboundary.
In addition to the movement file readable by ns2, the custom move-
ment generator generates a trace file that has the following format:
• Movement type either Regular Movement (M) or Jump (J)
• Node Number
• Time
• Difference in time between the two movements.
33
Page 46
8/12/2019 Raid Alghamdi MCS 2012
http://slidepdf.com/reader/full/raid-alghamdi-mcs-2012 46/96
• Speed of the movement.
• Current xC oordinate
• Current yCoordinate
• Next xC oordinate
• Next yCoordinate
These parameters help to trace the movement while the simulation is running
by the Java code.
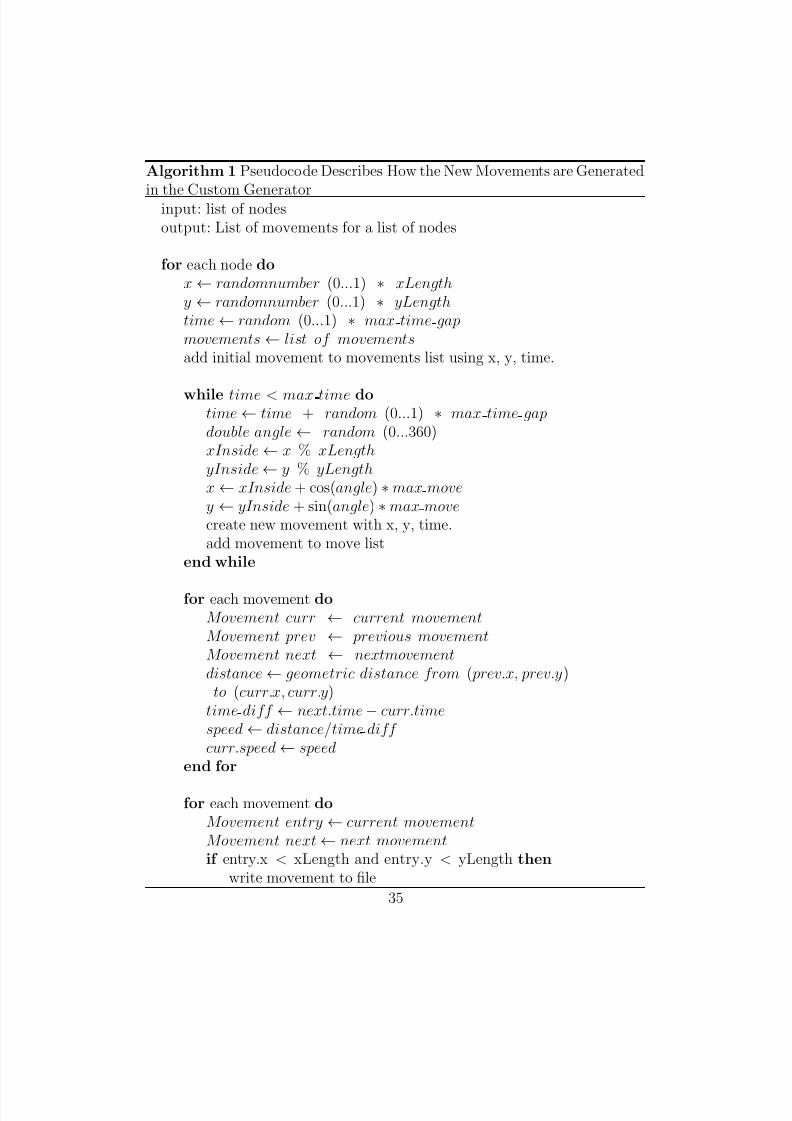
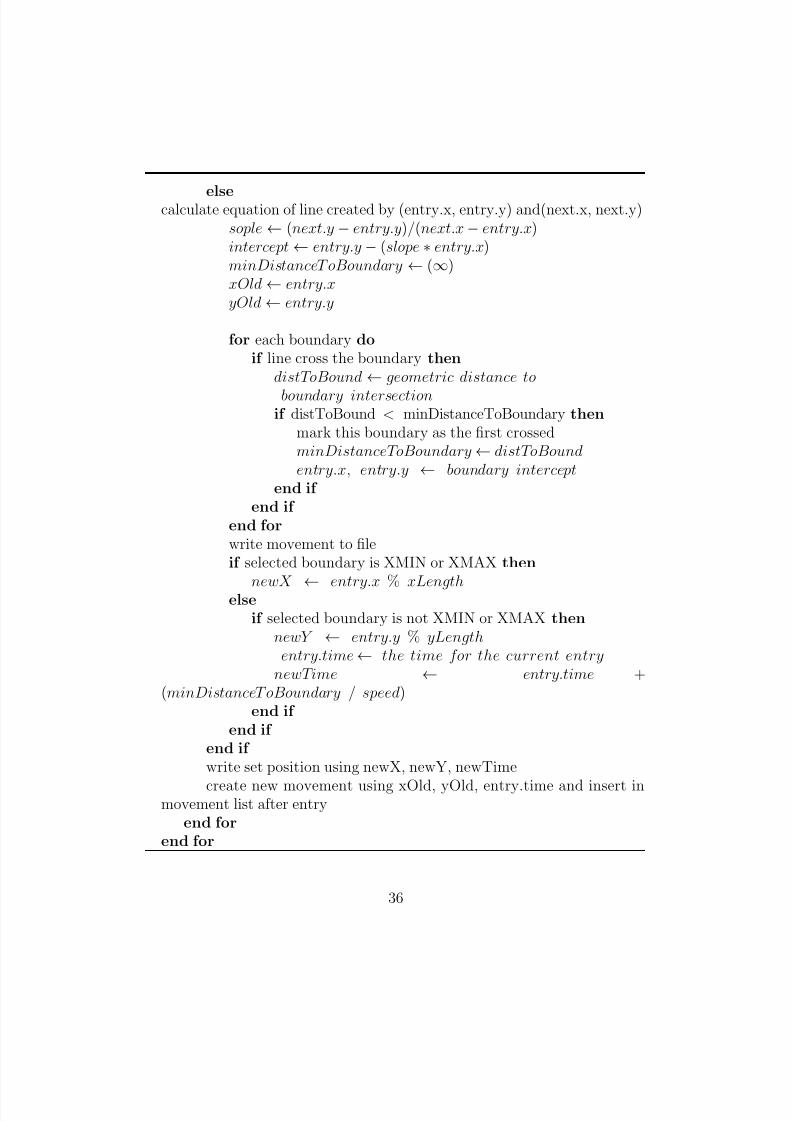
The following pseudocode describes how the new movements are gen-
erated in the custom generator:
34
Page 47
8/12/2019 Raid Alghamdi MCS 2012
http://slidepdf.com/reader/full/raid-alghamdi-mcs-2012 47/96
Algorithm 1 Pseudocode Describes How the New Movements are Generated
in the Custom Generatorinput: list of nodesoutput: List of movements for a list of nodes
for each node dox ← randomnumber (0...1) ∗ xLengthy ← randomnumber (0...1) ∗ yLengthtime ← random (0...1) ∗ max time gapmovements ← list of movementsadd initial movement to movements list using x, y, time.
while time < max time dotime ← time + random (0...1) ∗ max time gapdouble angle ← random (0...360)xInside ← x % xLengthyInside ← y % yLengthx ← xInside + cos(angle) ∗max movey ← yInside + sin(angle) ∗max movecreate new movement with x, y, time.add movement to move list
end while
for each movement doMovement curr ← current movementMovement prev ← previous movementMovement next ← nextmovementdistance ← geometric distance from ( prev.x, prev.y)
to (curr.x, curr.y)time diff ← next.time− curr.timespeed ← distance/time diff curr.speed ← speed
end for
for each movement doMovement entry ← current movementMovement next ← next movementif entry.x < xLength and entry.y < yLength then
write movement to file
35
Page 48
8/12/2019 Raid Alghamdi MCS 2012
http://slidepdf.com/reader/full/raid-alghamdi-mcs-2012 48/96
elsecalculate equation of line created by (entry.x, entry.y) and(next.x, next.y)sople ← (next.y − entry.y)/(next.x− entry.x)intercept ← entry.y − (slope ∗ entry.x)minDistanceT oBoundary ← (∞)xOld ← entry.xyOld ← entry.y
for each boundary doif line cross the boundary then
distToBound
←geometric distance to
boundary intersectionif distToBound < minDistanceToBoundary then
mark this boundary as the first crossedminDistanceToBoundary ← distToBoundentry.x, entry.y ← boundary intercept
end if end if
end forwrite movement to fileif selected boundary is XMIN or XMAX then
newX ← entry.x % xLengthelseif selected boundary is not XMIN or XMAX then
newY ← entry.y % yLengthentry.time← the time for the current entry
newTime ← entry.time +(minDistanceT oBoundary / speed)
end if end if
end if write set position using newX, newY, newTime
create new movement using xOld, yOld, entry.time and insert inmovement list after entry
end forend for
36
Page 49
8/12/2019 Raid Alghamdi MCS 2012
http://slidepdf.com/reader/full/raid-alghamdi-mcs-2012 49/96
Chapter 4
Investigating the Performance
In this Chapter, we tested the performance of network simulation using a
variety of tools, including the randomness tests and the delivery ratio calcu-
lations. We have used the quadrats count test, the variance to mean ratio
(VMR) test, and the confidence intervals from the tests to complete the
investigation.
4.1 Statistical Tests Used
There are three main tests used in this research to help us with the inves-
tigating part of the performance. This section describes the criteria and
methodology of each test to give a better understanding of each test sepa-
rately.
37
Page 50
8/12/2019 Raid Alghamdi MCS 2012
http://slidepdf.com/reader/full/raid-alghamdi-mcs-2012 50/96
4.1.1 Quadrats Count
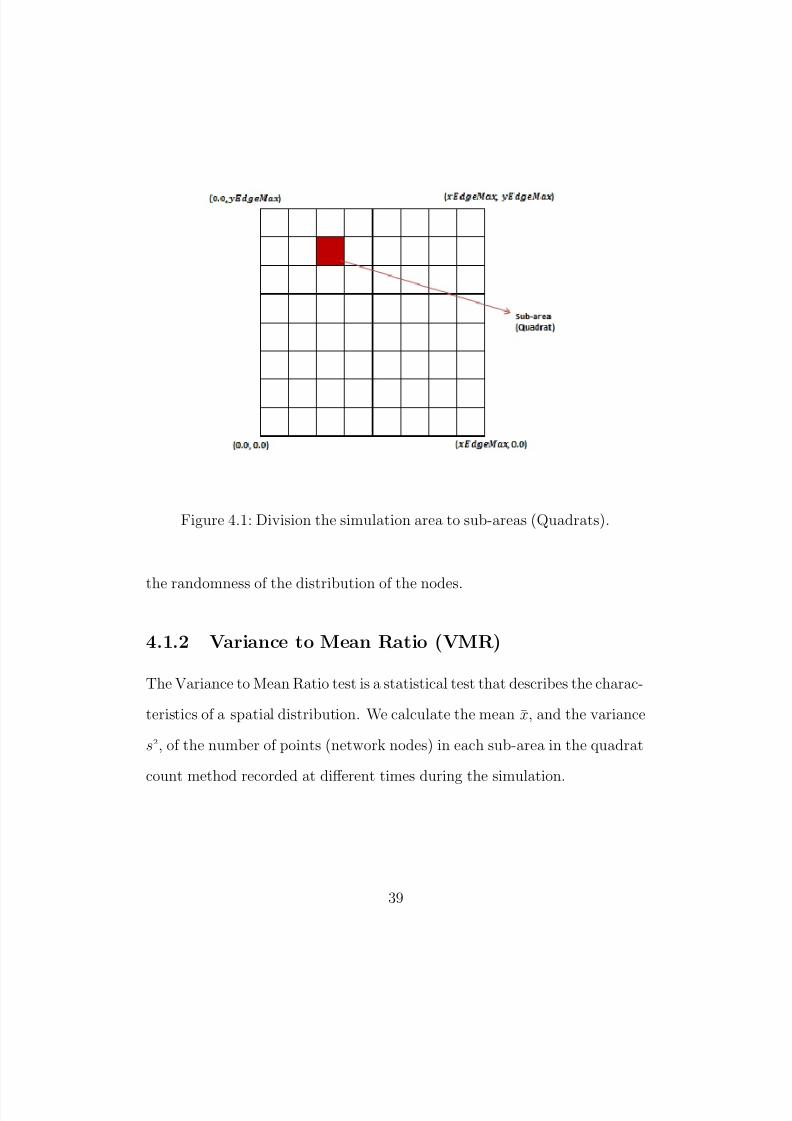
The quadrats count test is an established technique used for analyzing the
spatial point patterns, in our case network nodes, in an area by dividing
this area into a certain number of sub-areas and then counting the number
of points in each sub-area independently. Nevertheless, this technique does
not collect all x and y coordinates; rather, it treats each node as a point in
quadrat count calculations [30]. Moreover, the areas (quadrats) do not have
to be only squares, yet in our tests and experiments squares are the only
shapes used. Figure 4.1 represents how the whole simulation area is divided
and used in this test.
Each quadrat count represents the number of nodes in the area covered
by the square. Counting of the nodes in each quadrat is programmed in
Java. The Java program requires an input file generated by the ns2.This file
is generated during the simulation by sampling the node positions at regularintervals, 10s in our case, and writing time, node number, xCoordinate and
yCoordinate to the file. Then, the Java program reads this file, and based
on the position of each node locates a quadrat it belongs to and increases
by one the corresponding quadrat count. The Java code does that for all
samples with the same time stamp. Consequently, the count in each quadrat
represents the number of nodes in that quadrat. The Java program stores
all quadrat counts corresponding to the node positions deserved at different
times during the simulation (every 10s) for the future analysis. The Variance
to Mean Ratio (VMR) test can be then applied to these numbers to evaluate
38
Page 51
8/12/2019 Raid Alghamdi MCS 2012
http://slidepdf.com/reader/full/raid-alghamdi-mcs-2012 51/96
Page 52
8/12/2019 Raid Alghamdi MCS 2012
http://slidepdf.com/reader/full/raid-alghamdi-mcs-2012 52/96
x̄ =
m
i=1
xi
m (4.1)
s2 =
m
i=1
(xi − x̄)2
m− 1 (4.2)
Where:
• xi denotes the quadrat count for a square at i,
• m denotes the number of squares.
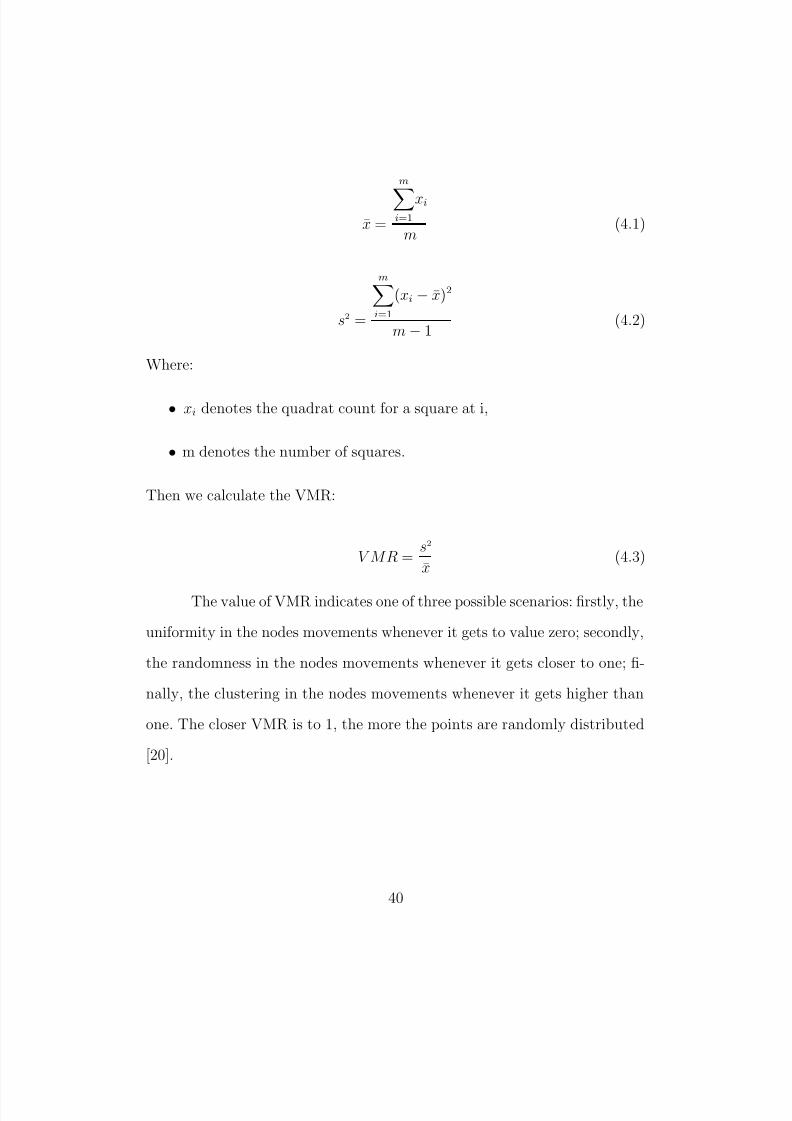
Then we calculate the VMR:
V MR = s2
x̄ (4.3)
The value of VMR indicates one of three possible scenarios: firstly, the
uniformity in the nodes movements whenever it gets to value zero; secondly,
the randomness in the nodes movements whenever it gets closer to one; fi-
nally, the clustering in the nodes movements whenever it gets higher than
one. The closer VMR is to 1, the more the points are randomly distributed
[20].
40
Page 53
8/12/2019 Raid Alghamdi MCS 2012
http://slidepdf.com/reader/full/raid-alghamdi-mcs-2012 53/96
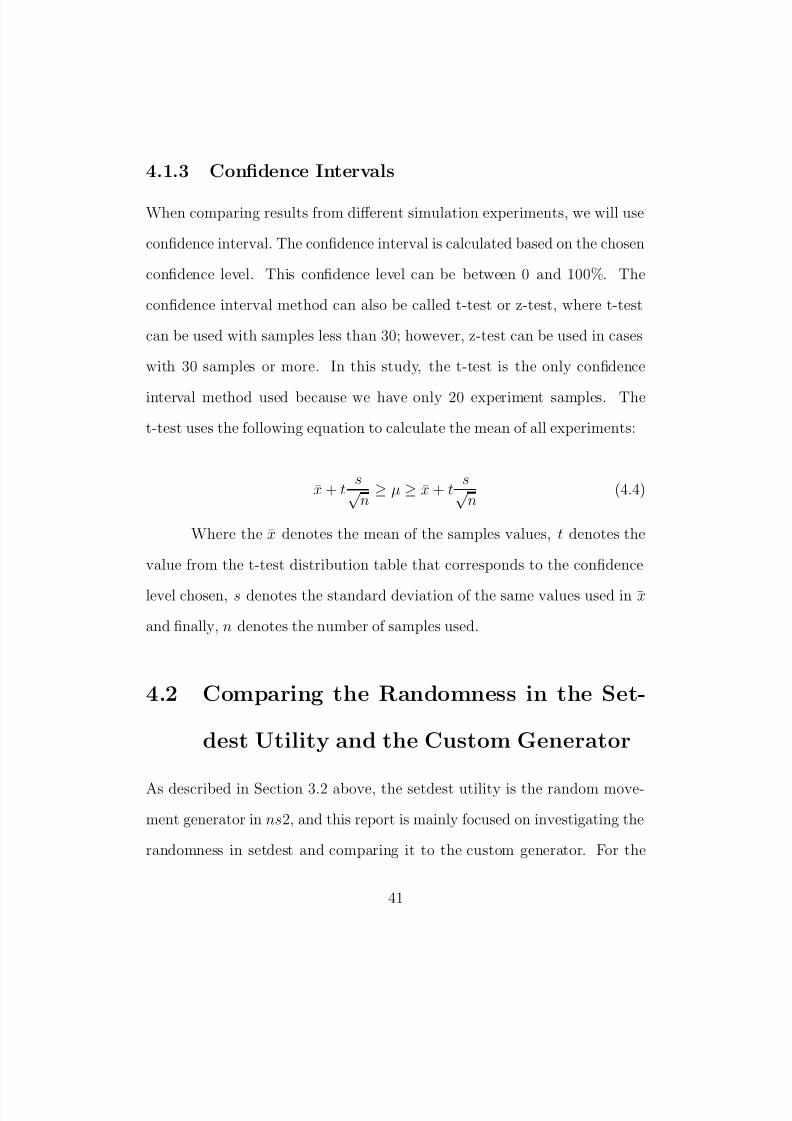
4.1.3 Confidence Intervals
When comparing results from different simulation experiments, we will use
confidence interval. The confidence interval is calculated based on the chosen
confidence level. This confidence level can be between 0 and 100%. The
confidence interval method can also be called t-test or z-test, where t-test
can be used with samples less than 30; however, z-test can be used in cases
with 30 samples or more. In this study, the t-test is the only confidence
interval method used because we have only 20 experiment samples. The
t-test uses the following equation to calculate the mean of all experiments:
x̄ + t s√
n ≥ µ ≥ x̄ + t
s√ n
(4.4)
Where the x̄ denotes the mean of the samples values, t denotes the
value from the t-test distribution table that corresponds to the confidence
level chosen, s denotes the standard deviation of the same values used in x̄
and finally, n denotes the number of samples used.
4.2 Comparing the Randomness in the Set-
dest Utility and the Custom Generator
As described in Section 3.2 above, the setdest utility is the random move-
ment generator in ns2, and this report is mainly focused on investigating the
randomness in setdest and comparing it to the custom generator. For the
41
Page 54
8/12/2019 Raid Alghamdi MCS 2012
http://slidepdf.com/reader/full/raid-alghamdi-mcs-2012 54/96
investigation portion, the quadrats count and Variance to Mean Ratio tests
have been used for this purpose.
To compare setdest to the custom generator, we run five experiments
for each generator using the following parameters. The simulation area is
1000×1000
• xEdgeMax = 1000,
• yEdgeMax = 1000,
The simulation time is 1000s and the number of nodes is 100.
Furthermore, there are some extra parameters required by the setdest utility:
• Pause time = 0,
• Maximum Speed = 20.
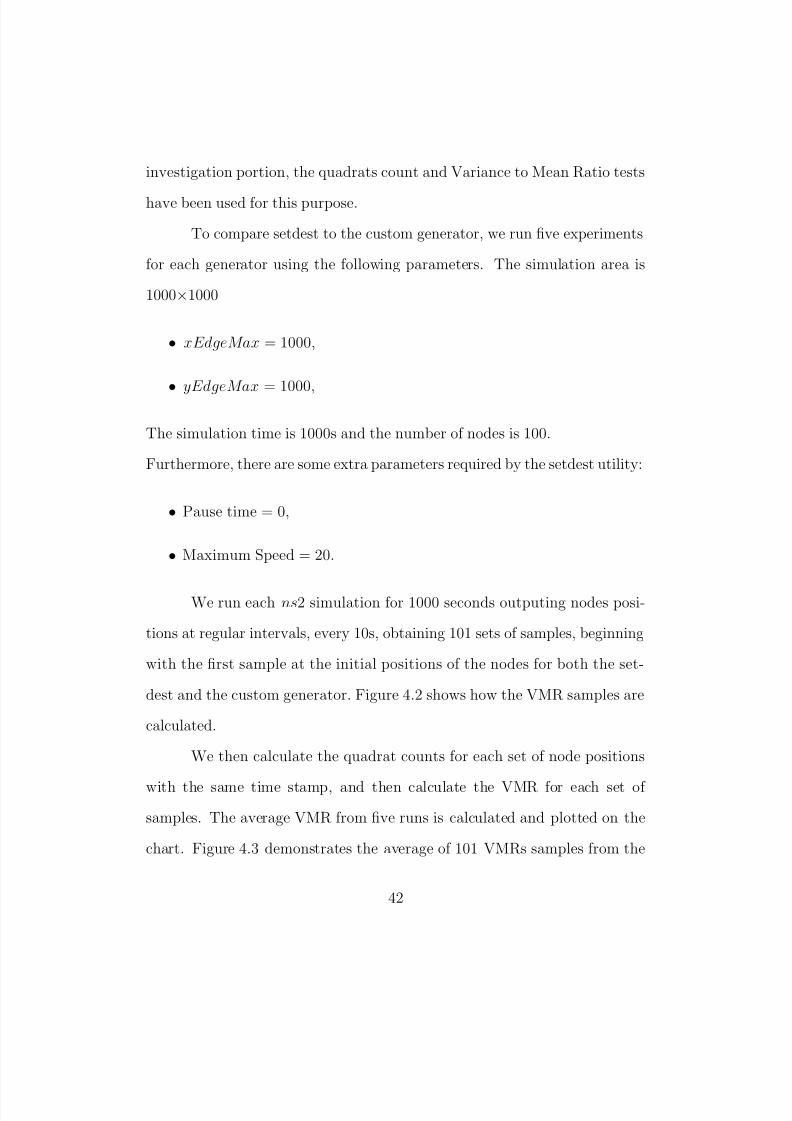
We run each ns2 simulation for 1000 seconds outputing nodes posi-
tions at regular intervals, every 10s, obtaining 101 sets of samples, beginning
with the first sample at the initial positions of the nodes for both the set-
dest and the custom generator. Figure 4.2 shows how the VMR samples are
calculated.
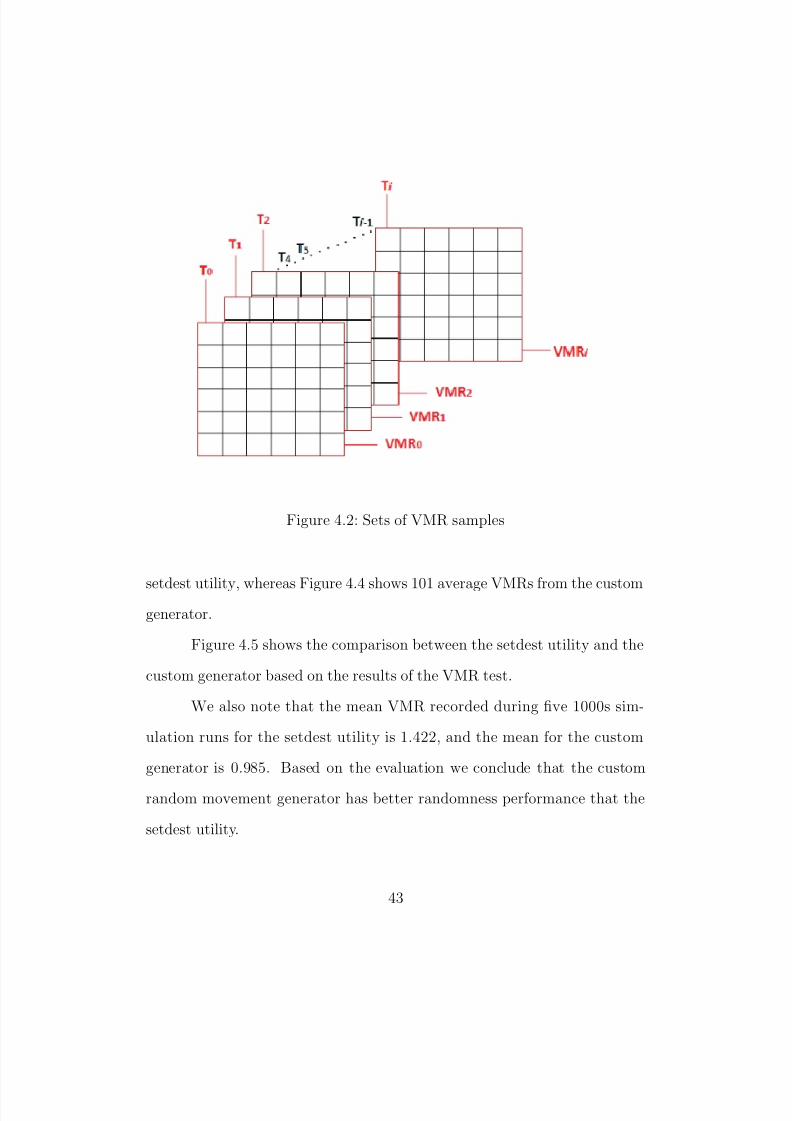
We then calculate the quadrat counts for each set of node positions
with the same time stamp, and then calculate the VMR for each set of
samples. The average VMR from five runs is calculated and plotted on the
chart. Figure 4.3 demonstrates the average of 101 VMRs samples from the
42
Page 55
8/12/2019 Raid Alghamdi MCS 2012
http://slidepdf.com/reader/full/raid-alghamdi-mcs-2012 55/96
Figure 4.2: Sets of VMR samples
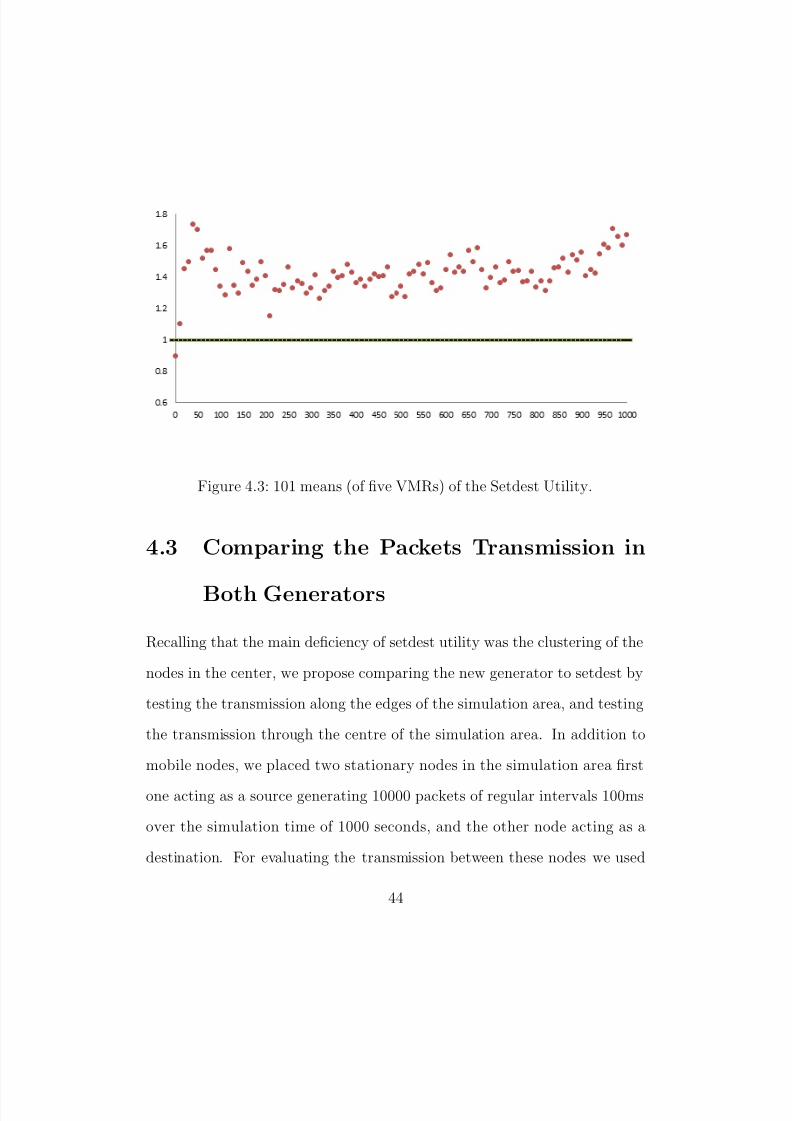
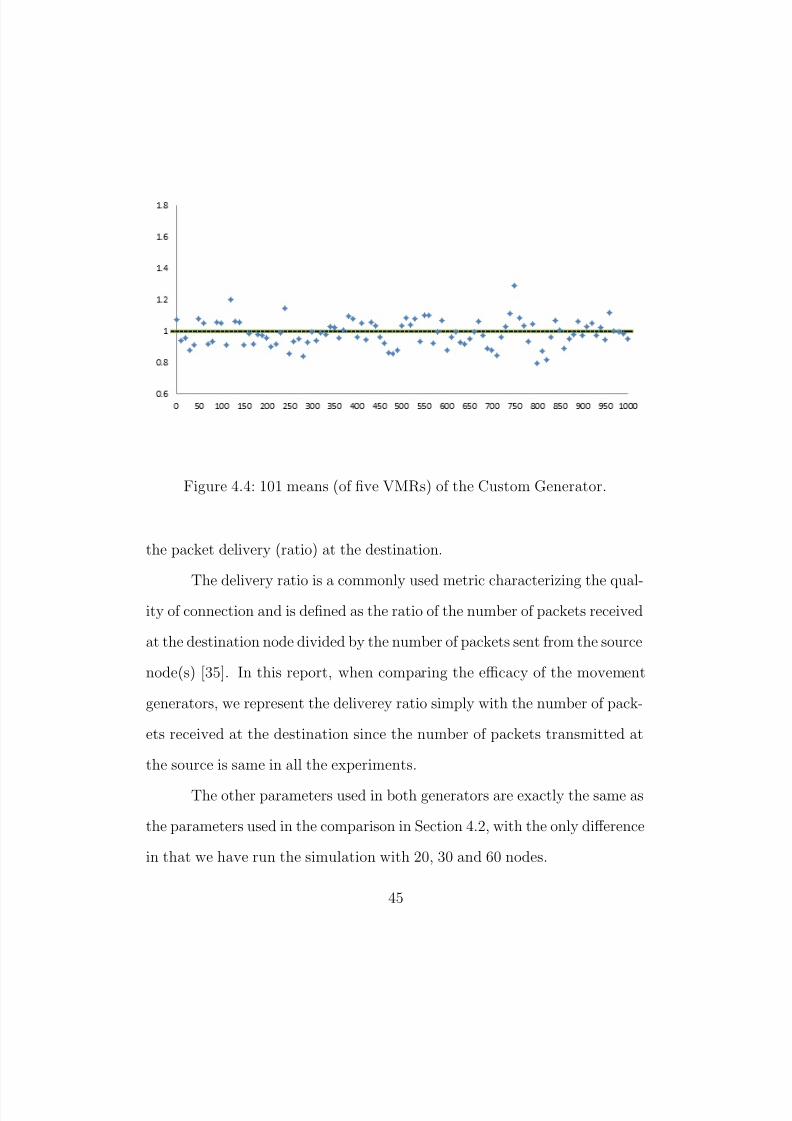
setdest utility, whereas Figure 4.4 shows 101 average VMRs from the customgenerator.
Figure 4.5 shows the comparison between the setdest utility and the
custom generator based on the results of the VMR test.
We also note that the mean VMR recorded during five 1000s sim-
ulation runs for the setdest utility is 1.422, and the mean for the custom
generator is 0.985. Based on the evaluation we conclude that the custom
random movement generator has better randomness performance that the
setdest utility.
43
Page 56
8/12/2019 Raid Alghamdi MCS 2012
http://slidepdf.com/reader/full/raid-alghamdi-mcs-2012 56/96
Figure 4.3: 101 means (of five VMRs) of the Setdest Utility.
4.3 Comparing the Packets Transmission in
Both Generators
Recalling that the main deficiency of setdest utility was the clustering of the
nodes in the center, we propose comparing the new generator to setdest by
testing the transmission along the edges of the simulation area, and testing
the transmission through the centre of the simulation area. In addition to
mobile nodes, we placed two stationary nodes in the simulation area first
one acting as a source generating 10000 packets of regular intervals 100ms
over the simulation time of 1000 seconds, and the other node acting as a
destination. For evaluating the transmission between these nodes we used
44
Page 57
8/12/2019 Raid Alghamdi MCS 2012
http://slidepdf.com/reader/full/raid-alghamdi-mcs-2012 57/96
Figure 4.4: 101 means (of five VMRs) of the Custom Generator.
the packet delivery (ratio) at the destination.
The delivery ratio is a commonly used metric characterizing the qual-
ity of connection and is defined as the ratio of the number of packets received
at the destination node divided by the number of packets sent from the source
node(s) [35]. In this report, when comparing the efficacy of the movement
generators, we represent the deliverey ratio simply with the number of pack-
ets received at the destination since the number of packets transmitted at
the source is same in all the experiments.
The other parameters used in both generators are exactly the same as
the parameters used in the comparison in Section 4.2, with the only difference
in that we have run the simulation with 20, 30 and 60 nodes.
45
Page 58
8/12/2019 Raid Alghamdi MCS 2012
http://slidepdf.com/reader/full/raid-alghamdi-mcs-2012 58/96
Figure 4.5: Comparison of the 101 means (of five VMR runs) of the SetdestUtility and the Custom Generator.
4.3.1 The Differences Between Both Generators in De-
livery Ratio Through the Centre
Since the simulation area is 1000x1000 and the test is through the centre, we
test the delivery ratio in the path between the points [(0,500) and (1000,500)]
with five samples (runs) and [(500,0) and (500,1000)] with another five sam-
ples (runs). Figure 4.6 shows the delivery ratio through the centre for both
the setdest and custom generator for the 20, 30 and 60 nodes.
By applying the confidence interval method on the output that is
shown in the Figure 4.5, and by using a confidence level (hypothesis) 95%
46
Page 59
8/12/2019 Raid Alghamdi MCS 2012
http://slidepdf.com/reader/full/raid-alghamdi-mcs-2012 59/96
Figure 4.6: Comparison of the number of packets delivered through the centreby setdest utility and the custom generator.
with 10 samples using the equation described in 4.1.3, we get the result detail-
ing any significant difference, and the results are displayed in the Table 4.1:
Table 4.1: The confidence interval results of the delivery ratio through thecentre for both generators.
60 Nodes 30 Nodes 20 Nodes
Setdest Utility9459.91 6724.79 2945.23
TO TO TO9731.89 8182.21 4811.97
Custom Generator9371.08 5150.65 1325.71
TO TO TO9610.52 6050.35 2448.29
47
Page 60
8/12/2019 Raid Alghamdi MCS 2012
http://slidepdf.com/reader/full/raid-alghamdi-mcs-2012 60/96
As shown in Table 4.1, there is no significant difference between the
setdest utility and the custom generator in the delivery ratio through the
centre while simulating the 60 nodes for 1000 seconds. However, there is
significant difference when using just 20 and 30 nodes, which suggests that
the delivery ratio through the centre in the setdest utility is higher than the
delivery ratio in the custom generator. The following section outlines the
comparison of the delivery ratio along the edges between both generators.
4.3.2 The Differences Between Both Generators in De-
livery Ratio Along the Edges
The other way of testing the delivery ratio in this report is transmitting
along the edges of the simulation area. Since the simulation area is square,
there are four edges and for each edge collect five samples (runs), which gives
a total of 20 samples (runs) for the edges. Each edge has the size of 1000.
Figure 4.7 shows the delivery ratio along the edges of the 20, 30 and 60 nodes.
As shown in Figure 4.7 above, there are some similarities in the de-
livery ratios. The confidence interval method used the t-test strategy de-
scribed in Section 4.1.3 above. Table 4.2 gives the confidence intervals and
demonstrates whether there is a significant difference between both genera-
tors transmitting packets along the edges.
The conclusion for Table 4.2 is that in the 20 nodes simulation for 1000
seconds there is no significant difference between both generators. However,
48
Page 61
8/12/2019 Raid Alghamdi MCS 2012
http://slidepdf.com/reader/full/raid-alghamdi-mcs-2012 61/96
Figure 4.7: Comparison of the number of packets delivered along the edgesby the setdest utility and the custom generator.
Table 4.2: The confidence interval results of the delivery ratio along the edgesfor both generators.
60 Nodes 30 Nodes 20 Nodes
Setdest Utility3664.29 478.07 193.97
TO TO TO4802.91 955.53 576.43
Custom Generator7933.68 1712.38 197.34
TO TO TO8238.22 2351.92 468.96
there is a significant difference in both the 30 and 60 nodes for a 1000 seconds;
this time, the customer generator has a better delivery ratio in both 30 and
49
Page 62
8/12/2019 Raid Alghamdi MCS 2012
http://slidepdf.com/reader/full/raid-alghamdi-mcs-2012 62/96
60 nodes scenarios.
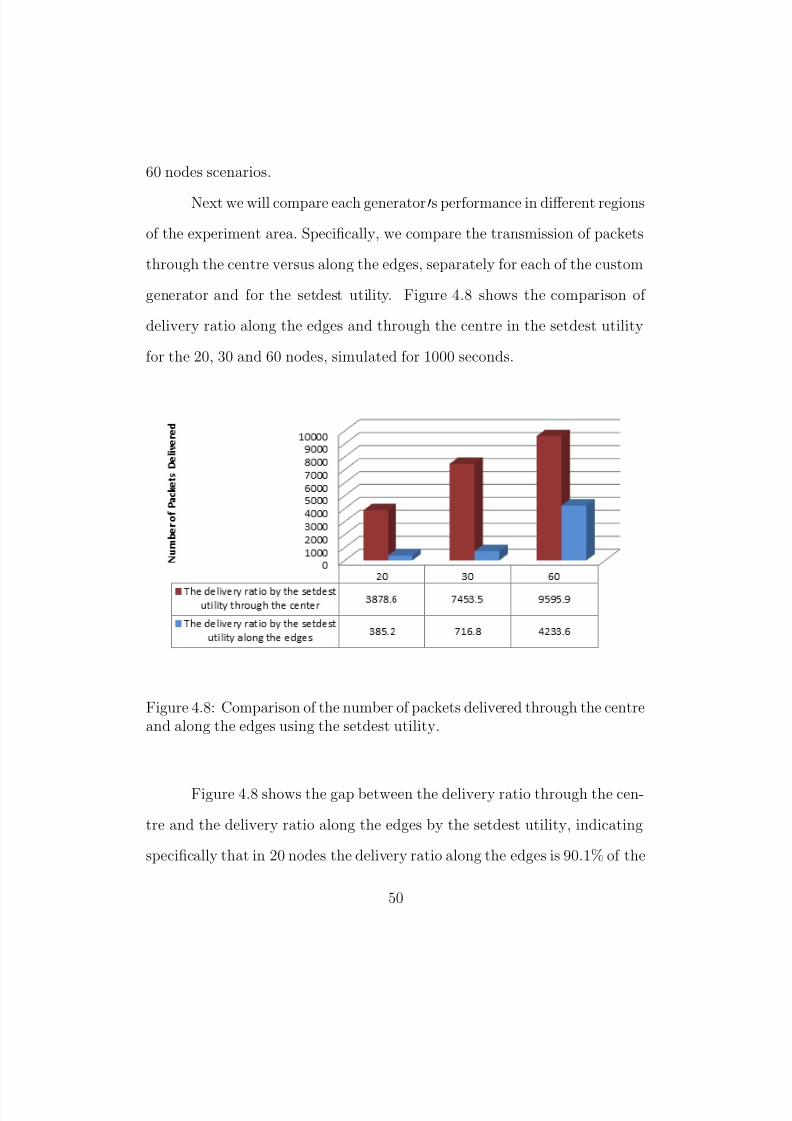
Next we will compare each generators performance in different regions
of the experiment area. Specifically, we compare the transmission of packets
through the centre versus along the edges, separately for each of the custom
generator and for the setdest utility. Figure 4.8 shows the comparison of
delivery ratio along the edges and through the centre in the setdest utility
for the 20, 30 and 60 nodes, simulated for 1000 seconds.
Figure 4.8: Comparison of the number of packets delivered through the centreand along the edges using the setdest utility.
Figure 4.8 shows the gap between the delivery ratio through the cen-
tre and the delivery ratio along the edges by the setdest utility, indicating
specifically that in 20 nodes the delivery ratio along the edges is 90.1% of the
50
Page 63
8/12/2019 Raid Alghamdi MCS 2012
http://slidepdf.com/reader/full/raid-alghamdi-mcs-2012 63/96
delivery ratio through the centre; furthermore, in 30 nodes the percentage is
90%. Finally, in 60 nodes the percentage is 55.9%.
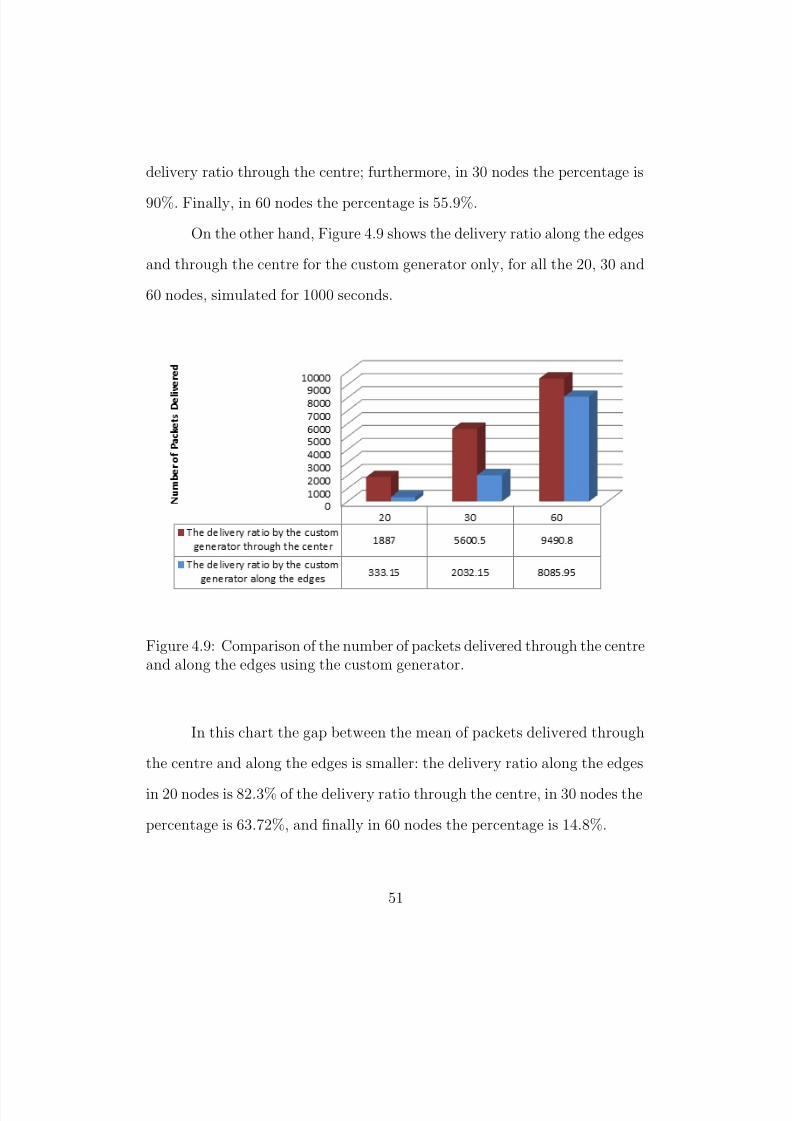
On the other hand, Figure 4.9 shows the delivery ratio along the edges
and through the centre for the custom generator only, for all the 20, 30 and
60 nodes, simulated for 1000 seconds.
Figure 4.9: Comparison of the number of packets delivered through the centreand along the edges using the custom generator.
In this chart the gap between the mean of packets delivered through
the centre and along the edges is smaller: the delivery ratio along the edges
in 20 nodes is 82.3% of the delivery ratio through the centre, in 30 nodes the
percentage is 63.72%, and finally in 60 nodes the percentage is 14.8%.
51
Page 64
8/12/2019 Raid Alghamdi MCS 2012
http://slidepdf.com/reader/full/raid-alghamdi-mcs-2012 64/96
Chapter 5
Conclusion
This study describes an investigation of the performance of the popular set-
dest utility used in the ns2 network simulator has been investigated. We
proposed and demonstrated the advantage of a new random motion genera-
tor for use in the ns2 simulator. Testing the new generator shows a marked
advantage over the standard setdest utility. Detailed results of our study and
recommendations are given in section 5.1, and the speculations about future
work are outlined in section 5.2.
5.1 Results of the work
We investigated the deficiency of setdest utility reported in the literature,
namely the non-randomness in node distribution and the clustering of the
nodes in the center. Our investigation using the quadrat count method re-
52
Page 65
8/12/2019 Raid Alghamdi MCS 2012
http://slidepdf.com/reader/full/raid-alghamdi-mcs-2012 65/96
sulted in the VMR value significantly greater than 1 indicating clustering of
the nodes. We also investigated the transmission rates in different regions
of a simulated network generated with a help of setdest utility. We compare
delivery ratios for transmissions through the center of the experimental area
versus transmissions along the edges of the area and found that there is a gap
(a difference) in the delivery ratios when sending data through different re-
gions. Based on these test results we conclude that the nodes generated with
setdest tend to cluster in the center for the experimental region. To remedythis problem we proposed, implemented, and tested a new random movement
generator based on the Boundless Simulation Area Mobility Model, which is
described in the literature as offering better performance. We then tested
the new movement generator using the quadrat count method and obtained
the VMR values much closer to one than those obtained when testing set-
dest indicating a better randomness performance than that achieved by the
setdest. We also tested the delivery ratio across different regions using a net-
work simulated with the help of the new movement generator and the results
were again better than those produced by the setdest utility in transmitting
packets: we found a smaller gap than in the case of the setdest once we
compared the delivery ratio through the center versus along the edges.
We recommend that the new movement generator to be used instead
of the setdest utility when randomness of mobile nodes distribution is a
requirement. The new generator will be particularly useful when comparing
the performance of different routing protocols for the use in MANETs.
53
Page 66
8/12/2019 Raid Alghamdi MCS 2012
http://slidepdf.com/reader/full/raid-alghamdi-mcs-2012 66/96
5.2 Future work
We suggest further testing of both generators using different statistical meth-
ods to obtain additional measures of their performance, since in our work we
relied on positions of the nodes captured in snapshots, rather than consid-
ering their dynamic paths. Furthermore, the custom movement generator
could be made into a utility and then distributed with ns2. This may be
possible since ns2 is an open source software. Finally, some different algo-
rithms (many more are described in the literature) could be used to build a
new movement generator which might give better performance than the ones
described in this report.
54
Page 67
8/12/2019 Raid Alghamdi MCS 2012
http://slidepdf.com/reader/full/raid-alghamdi-mcs-2012 67/96
Bibliography
[1] Ariyakhajorn, J., Wannawilai, P., & Sathitwiriyawong, C. (2006).
A Comparative Study of Random Waypoint and Gauss-Markov Mo-
bility Models in the Performance Evaluation of MANET, Commu-
nications and Information Technologies, 2006. ISCIT ’06. Interna-
tional Symposium on Sept 20- Oct. 18 , (pp.894-899). Bangkok. doi:
10.1109/ISCIT.2006.339866
[2] Bai, F., Sadagopan, N., & Helmy, A. (2003). Important: A framework to
systematically analyze the impact of mobility on performance of routing
protocols for adhoc networks. INFOCOM 2003. Twenty-Second Annual
Joint Conference of the IEEE Computer and Communications. IEEE
Societies,Vol. 2 , (pp. 825-835). doi: 10.1109/INFCOM.2003.1208920
[3] Williams, S.A., & Huang, D. (2006). A Group Force Mobility Model.
Paper presented at the 9th Communications and Networking Sim-
ulation Symposium, April 2-6. Retrieved on May 21, 2012 from
http://snac.eas.asu.edu/snac/document/GroupForceSimulation.pdf
55
Page 68
8/12/2019 Raid Alghamdi MCS 2012
http://slidepdf.com/reader/full/raid-alghamdi-mcs-2012 68/96
[4] Hong, X., Gerla, M., Pei, G., & Chiang, C-C. (1999). A group mo-
bility model for ad hoc wireless networks. MSWIM99Proceeding of the
2nd ACM international workshop on Modeling, analysis and simulation
of wireless and mobile systems , (pp.53-60). New York, NY: ACM. doi:
10.1145/313237.313248
[5] Haas, Z.J. (1997). A new routing protocol for the reconfigurable wire-
less networks. Universal Personal Communications Record, 1997. Con-
ference Record., 1997 IEEE 6th International Conference on 12-16 Oct.,
vol.2 , (pp.562-566). San Diego, CA. doi: 10.1109/ICUPC.1997.627227
[6] Caballero-Gil, P., Caballero-Gil, C., Molina-Gil, J., & Hernandez-Goya,
C. (2007). A simulation study of new security schemes in mobile Ad-hoc
NETworks. In R. Moreno Daz, R. Pichler, A. Quesada Arencibia, (Eds.)
EUROCAST 2007. LNCS, Vol. 4739, (pp. 7381). Heidelberg: Springer
[7] Camp, T., Boleng, J., Davies, V. (2002). A survey of mobility models
for ad hoc network research. Wireless Communications & Mobile Com-
puting: Special Issue on Mobile Ad Hoc Networking: Research, Trends
and Applications, 2(5), (pp.483502).
[8] Johnson, D., & Maltz, D. (1996). Dynamic source rout-
ing in ad-hoc wireless networks. Computer Communica-
tions Review - Proceedings of SIGCOMM ’96 .Retrieved on
May 21, 2012 from http://www.cs.colorado.edu/ rhan/C-
SCI 7143 Fall 2007/Papers/Johnson96 DSR.pdf
56
Page 69
8/12/2019 Raid Alghamdi MCS 2012
http://slidepdf.com/reader/full/raid-alghamdi-mcs-2012 69/96
[9] Tolety V. (1999). Load Reduction in Ad Hoc Networks Using Mo-
bile Servers . (Master’s thesis, Colorado School of Mines, Colorado,
1999). Retrieved from: http://citeseerx.ist.psu.edu/viewdoc/summary?
doi=10.1.1.18.9944
[10] Lin, G., Noubir, G., & Rajaraman, R. (2004). Mobility Models for Ad
Hoc Network Simulation. INFOCOM 2004. Twenty-third Annual Joint
Conference of the IEEE Computer and Communications Societies, Vol.
1. doi: 10.1109/INFCOM.2004.1354517
[11] Liang, B.; Haas, Z.J. (1999). Predictive distance-based mobility manage-
ment for PCS networks. INFOCOM ’99. Eighteenth Annual Joint Con-
ference of the IEEE Computer and Communications Societies, Vol.3 ,
(pp.1377-1384).
[12] Ray, S. (2003). Realistic mobility for MANET simulation . (Masters the-
sis, The University of British Columbia, 2003).
[13] Culpepper, B.J., & Tseng, H.C. (2004). Sinkhole intrusion indicators
in DSR MANETs. BROADNETS 04 Proceedings of First International
Conference on Broad band Networks , (pp. 681 688). Washington, DC:
IEEE Computer Society. doi: 10.1109/BROADNETS.2004.77
[14] Chiang C. (1998). Wireless Network Multicasting . (Ph.D. the-
sis, University of California, Los Angeles, 1998). Retrieved from:
http://citeseerx.ist.psu.edu/viewdoc/summary? doi=10.1.1.54.1026
57
Page 70
8/12/2019 Raid Alghamdi MCS 2012
http://slidepdf.com/reader/full/raid-alghamdi-mcs-2012 70/96
[15] Davies V. (2000). Evaluating Mobility Models Within an Ad Hoc
Network . (Masters thesis, Colorado School of Mines, Colorado,
2000). Retrieved from: http://citeseerx.ist.psu.edu/viewdoc/summary?
doi=10.1.1.18.4191
[16] Cavilla, A. L. (n.d). MANET extensions to ns2. Retrieved May 21, 2012
from http://lagarcavilla.org/publications/MANET extensions.pdf
[17] Bai, F., & Helmy, A. (2004). A Survey of Mobility Models
in Wireless Ad hoc Networks, in Wireless Ad Hoc and Sen-
sor Networks , (pp.1-29). Kluwer Academic Publishers. Available at
http://www.cise.ufl.edu/h̃elmy/papers/Survey-Mobility-Chapter-1.pdf
[18] Frangiadakis, N., Kyriakakos, M., Hadjiefthymiades, S., & Mer-
akos, L. (2003). Realistic mobility pattern generator: design and ap-
plication in path prediction algorithm evaluation. Personal, Indoor
and Mobile Radio Communications, 2002. The 13th IEEE Interna-
tional Symposium on 15-18Sept. 202 , Vol. 2, (pp. 765- 769). doi:
10.1109/PIMRC.2002.1047325
[19] Carbone, B. (2006). Routing Protocols for Interconnecting Cellular and
Ad Hoc Networks , (Masters thesis, Universite Libre De Bruxeles , Fac-
ulte des Sciences, Department d Informatique, 2006). Retrieved from
http://code.ulb.ac.be/dbfiles/Car2006mastersthesis.pdf
58
Page 71
8/12/2019 Raid Alghamdi MCS 2012
http://slidepdf.com/reader/full/raid-alghamdi-mcs-2012 71/96
[20] B. Houchmandzadeh, Neutral clustering in a simple experimental eco-
logical community Phys. Rev. Lett., 101 (2008), p. 078103
[21] Wikipedia, the free encyclopedia. (November 2009). Base Station. Re-
trieved May 21, 2011, from http://en.wikipedia.org/wiki/Base station
[22] Wikipedia, the free encyclopedia. (November 2010). Wire-
less Ad-hoc Network. Retrieved November 1, 2011, from
http://en.wikipedia.org/wiki/Wireless ad-hoc network
[23] Dalton, N.S., & Dalton, R.C. (2007). The theory of natural move-
ment and its application to the simulation of mobile ad hoc networks
(MANET). Proceedings of the Fifth Annual Conference on Communi-
cation Networks and Services Research , (pp. 359363). New Brunswick,
Canada: CNSR.
[24] Zhang, Y. & Li, W. (2002). An integrated environment for testing mo-
bile ad-hoc networks. Proceedings of the Third ACM International Sym-
posium on Mobile Ad Hoc Networking and Computing (MobiHoc ’02),
(pp.104-111). New York, NY: ACM.
[25] Hu, J., & Marculescu, R. (2004). DyAD: smart routing for networks-
on-chip. DAC04 The 41st Annual Design Automation Conference 2004,
(pp.260-263). New York, NY: ACM. doi:10.1145/996566.996638
[26] Choy, F., Buultjens, J., & Soni, R.H. (2005). The performance investiga-
tion of hybrid wireless ad hoc networks. Mobile Technology, Applications
59
Page 72
8/12/2019 Raid Alghamdi MCS 2012
http://slidepdf.com/reader/full/raid-alghamdi-mcs-2012 72/96
and Systems, 2005 2nd International Conference on 15-17 Nov. 2005,
(pp.6-11). doi: 10.1109/MTAS.2005.207138
[27] Issariyakul, T., & Hossain, E. (2008). Introduction to Network Simulator
NS2 . New York, NY: Springer Publishing Company. doi: 10.1007/978-
0-387-71760-9
[28] Roy, R. (2011). Handbook of mobile ad hoc networks for mobility models
(1st Edition). New York, NY: Springer Science Business Media. DOI:
10.1007/979-1-4419-6050-4
[29] Agrawal, D., & Zeng, Q. (2011). Introduction to wireless and mobile
systems (3rd Edition). Stamford, CT: Cengage Learning.
[30] Illian, J., Penttinen, A., Stoyan, H., & Stoyan, D. (2008). Statistical
analysis and modelling of spatial point patterns . West Sussex, England:
John Wiley & Sons Ltd.
[31] Peterson, L. L., & Davie, B. S. (2011). Computer Networks, Fifth Edi-
tion: A Systems Approach . San Fransisco, CA: Morgan Kaufmann Pub-
lishers Inc.Communication
[32] Xinmei Z., (2009). MANET In Urban Environment . (Master’s thesis,
University of New Brunswick, Fredericton, 2009).
[33] DeDourek J., (2012). (Internal Communication) University of New
Brunswick- Fredericton, NB Canada.
60
Page 73
8/12/2019 Raid Alghamdi MCS 2012
http://slidepdf.com/reader/full/raid-alghamdi-mcs-2012 73/96
[34] City of Fredericton, government site. Bus Route Maps. Retrieved July
10, 2012, from http://www.fredericton.ca
[35] Tang, K. & Gerla, M. (2001). MAC reliable broadcast in ad hoc net-
works, Military Communications Conference, 2001. MILCOM 2001.
Communications for Network-Centric Operations: Creating the In-
formation Force. IEEE , vol. 2, (pp. 1008-1013). doi: 10.1109/MIL-
COM.2001.985991
61
Page 74
8/12/2019 Raid Alghamdi MCS 2012
http://slidepdf.com/reader/full/raid-alghamdi-mcs-2012 74/96
Appendix A
RunningNodes class generates the nodes’ movements based on the Node class
shown in Appendix B
A.1 RunningNodes Class
import java.awt.Point;import java.awt.geom.Point2D;
import java.io.BufferedWriter;
import java.io.FileWriter;
import java.io.IOException;
import java.io.PrintWriter;
import java.sql.Time;
import java.util.ArrayList;
import java.util.List;
import java.util.Random;
/**
* This class contains a couple of algorithms indicating the moving
* patterns of the nodes.*
* @author
* @version 0.1
*/
62
Page 75
8/12/2019 Raid Alghamdi MCS 2012
http://slidepdf.com/reader/full/raid-alghamdi-mcs-2012 75/96
public class RunningNodes {
/** xLength is the Maximum X position */
private static int xLength;
/** yLength is the Maximum Y position */
private static int yLength;
/** The maximum for the random increment */
public static final int MAX_MOVEMENT = 150;
/** The Maximum initial time */
public static final int INI_TIME = 5;
/** The maximum time difference between Entries */
public static final int MAX_DIFF_IN_TIME = 15;
/** THe minimum time difference between Entries */
public static final int MIN_DIFF_IN_TIME = 5;
/** The closest distance to the boundary */
public static final double VALUE_TO_BOUNDRY = 0.0000000001;/** The format of setdest for the regular output */
public static final String SETDEST_FORMAT = "$ns_ at %14.10f"
+ " \"$node_(%d) setdest %14.10f %14.10f %14.10f\"\n";
/** The format of Setpos (JUMP) for the regular output */
public static final String SETPOS_FORMAT = "$ns_ at %14.10f "
+ "\"$node_(%d) setpos %14.10f %14.10f \"\n";
/** The format of setdest for the regular TraceFile */
public static final String STAT_FORMAT_M = ("\t M \t\t\t\t %d "
+ "\t %14.10f \t %14.10f \t %14.10f \t %14.10f \t %14.10f "
+ "\t %14.10f \t %14.10f \n");
/** The format of Setpos (JUMP) for the regular Trace file */
public static final String STAT_FORMAT_J = ("\t J \t\t\t\t %d "
+ "\t %14.10f \t 0.0000000000 \t 0.0000000000 \t %14.10f "+ "\t %14.10f \t %14.10f \t %14.10f \n");
/** The Number of nodes */
private int numberOfNodes;
/** The total simulation time */
private float runningTime;
/** List of the nodes */
private List<Node> nodesList;
/** Print writer for the regular output */
private PrintWriter writeToFile;
/** Print writer for the regular trace file */
private PrintWriter writeToFileStatistical;
/** Random number generator */
public static Random random = new Random();/** List of all available movements */
private List<MovementEnum> movements;
/**
63
Page 76
8/12/2019 Raid Alghamdi MCS 2012
http://slidepdf.com/reader/full/raid-alghamdi-mcs-2012 76/96
* Constructor
*
* @param numberOfNodes
* int number of nodes
* @param xLength
* int the Maximum X position
* @param yLength
* int the maximum Y position
* @param runningTime
* float the maximum time
*/
public RunningNodes(int numberOfNodes, int xLength, int yLength,
float runningTime) {
this.numberOfNodes = numberOfNodes;
RunningNodes.xLength = xLength;RunningNodes.yLength = yLength;
this.runningTime = runningTime;
// Add movements to the movement list
movements = new ArrayList<MovementEnum>();
// movements.add(MovementEnum.X_MOVEMENT);
// movements.add(MovementEnum.Y_MOVEMENT);
movements.add(MovementEnum.XY_MOVEMENT);
}
/**
* The method initializes the output generates the nodes and write to
* the files
*/public void start() {
init();
try {
run();
} catch (Exception e) {
e.printStackTrace();
}
stop();
}
/**
* Initialize each node by giving each of them a random x and y
* coordinates.* Also initialize the I/O object to write the result into the file.
*/
private void init() {
this.nodesList = new ArrayList<Node>();
64
Page 77
8/12/2019 Raid Alghamdi MCS 2012
http://slidepdf.com/reader/full/raid-alghamdi-mcs-2012 77/96
try {
// initialize buffered writer
writeToFile = new PrintWriter(new BufferedWriter(new FileWriter(
"CustomRandomGenerator")));
writeToFileStatistical = new PrintWriter(new BufferedWriter(
new FileWriter("StatInformation")));
// nodesList.add(new Node(-1, -1));
// nodesList.add(new Node(-1, -1));
// initialize nodes
for (int i = 0; i < numberOfNodes; i++) {
double x = Math.random() * (xLength - VALUE_TO_BOUNDRY);
double y = Math.random() * (yLength - VALUE_TO_BOUNDRY);Node node = new Node(x, y);
System.out.println("Created node with x,y: " + x + "," + y);
nodesList.add(node);
// write to the file
writeToFile.write("$node_(" + i + ")" + " set X_ " + x + "\n");
writeToFile.write("$node_(" + i + ")" + " set Y_ " + y + "\n");
writeToFile
.write("$node_(" + i + ")" + " set Z_ 0.000000000000" +
" "\n");
}
writeToFileStatistical.write("Movement Type" + "\t" + "NodeNumber"
+ "\t"+ " Time" + "\t\t\t" + "Difference In time" + "\t\t"
+ " Speed"+ "\t\t\t" + "Current X" + "\t\t\t" + "Current Y"
+ "\t\t\t"+ " Next X" + "\t\t\t" + " Next Y" + "\n");
} catch (IOException e) {
e.printStackTrace();
}
}
/**
* For each node this generates a list of entries which describes that
* node’s movement, once the entries are created it writes the output
** @throws Exception
* if there is an error writing to the files.
*/
private void run() throws Exception {
65
Page 78
8/12/2019 Raid Alghamdi MCS 2012
http://slidepdf.com/reader/full/raid-alghamdi-mcs-2012 78/96
for (int i = 0; i < numberOfNodes; i++) { // For each node
Node node = nodesList.get(i);
List<Entry> entries = new ArrayList<Entry>(); // Create entry list
double currentTime = random.nextDouble() * INI_TIME; // Random
// Initial
// time
// System.out.println("Node has x, y: " + node.getX() + "," +
// node.getY());
Point prevPoint = new Point(node.getX(), node.getY()); // Initial
// point
while (currentTime < runningTime) { // Until it reaches the Maximum
// running time
Point newPoint = movements.get(random.nextInt(movements.size())).getNewPoint(prevPoint); // Choose Random Movement and
// generates new position from that
// movement
Entry entry = new Entry(i, currentTime, newPoint); // Create the
// Entry for
// this
// movement
entries.add(entry);
prevPoint = new Point(entry.getX(), entry.getY());
currentTime += (random.nextDouble() *
(MAX_DIFF_IN_TIME - MIN_DIFF_IN_TIME))+ MIN_DIFF_IN_TIME; // Create the time
}
for (int j = 1; j < entries.size() - 1; j++) { // Calculate the
// speed for Entries
// 1 to n-2
double time = entries.get(j + 1).time - entries.get(j).time;
double distance = entries.get(j).getDistance(entries.get(j - 1));
entries.get(j).speed = distance / time;
}
if (entries.size() >= 0) { // Calculate the speed for the first
// EntryEntry first = entries.get(0);
double time = entries.get(1).time - first.time;
double distance = first.getDistance(node.getX(), node.getY());
first.speed = distance / time;
66
Page 79
8/12/2019 Raid Alghamdi MCS 2012
http://slidepdf.com/reader/full/raid-alghamdi-mcs-2012 79/96
}
if (entries.size() >= 1) { // Calculate the speed for the last Entry
Entry last = entries.get(entries.size() - 1);
double time = runningTime - last.time;
double distance=last.getDistance(entries.get(entries.size()-2));
last.speed = distance / time;
}
// Write out first line of movements
Entry second = entries.get(1);
entries.get(0).writeMove(node.getX(), node.getY(), second.getX(),
second.getY(), second.time);
// Write out movement for entries 1 to n-2for (int j = 1; j < entries.size() - 1; j++) {
Entry currEntry = entries.get(j);
Entry prevEntry = entries.get(j - 1);
Entry nextEntry = entries.get(j + 1);
currEntry.writeMove(prevEntry.getX(), prevEntry.getY(),
nextEntry.getX(), nextEntry.getY(), nextEntry.time);
}
Entry last = entries.get(entries.size() - 1);
Entry prev = entries.get(entries.size() - 2);
// Write out last movement
last.writeMove(prev.getX(), prev.getY(), xLength, yLength, runningTime);}
}
/**
* Stop the simulator, close I/O object.
*/
private void stop() {
// try {
writeToFile.close();
writeToFileStatistical.close();
// } catch (IOException e) {
// e.printStackTrace();// }
}
/**
67
Page 80
8/12/2019 Raid Alghamdi MCS 2012
http://slidepdf.com/reader/full/raid-alghamdi-mcs-2012 80/96
* The entry represents one movement of a node,
*
* @author Raid
*
*/
class Entry {
/**
* The number of the node to which this entry belongs
*/
private int nodeNumber;
/**
* The of this entry
*/
private double time;
/*** This is the X position of this node for this entry which may
* exists out side of the boundary
*/
private double x;
/**
* This is the Y position of this node for this entry which may
* exists out side of the boundary
*/
private double y;
/**
* This is the speed that the node will move from the previous
* location to the current location using the difference between
* the current time and the next one.*/
private double speed;
/**
* This method returns the x position of this node translated inside
* the boundary
*
* @return double x position inside the boundary
*/
private double getX() {
if (x < 0)
return x + xLength;else if (x > xLength)
return x - xLength;
else {
return x;
68
Page 81
8/12/2019 Raid Alghamdi MCS 2012
http://slidepdf.com/reader/full/raid-alghamdi-mcs-2012 81/96
}
}
/**
* This method returns the y position of this node translated inside
* the boundary
*
* @return double y position inside the boundary
*/
private double getY() {
if (y < 0)
return y + yLength;
else if (y > yLength)
return y - yLength;else {
return y;
}
}
/**
* This is the constructor for an entry
*
* @param nodeNumber
* int the is the index of the node
* @param time
* double the time of this entry
* @param p* Point this is X and Y position which may exists out of the
* boundary
*/
Entry(int nodeNumber, double time, Point p) {
this.time = time;
this.nodeNumber = nodeNumber;
this.x = p.x;
this.y = p.y;
}
/**
* This calculates the distance between this and the specified entry
** @param e
* Entry The previous entry to this entry
* @return double the distance between the two entries
*/
69
Page 82
8/12/2019 Raid Alghamdi MCS 2012
http://slidepdf.com/reader/full/raid-alghamdi-mcs-2012 82/96
double getDistance(Entry e) {
double x1 = e.getX();
double y1 = e.getY();
return Point2D.distance(x1, y1, x, y);
// return Math.sqrt(Math.pow((x-x1),2)+Math.pow((y-y1),2));
}
/**
* This calculates the distance between this and the specified x and y
* location
*
* @param x1
* double which is the x position* @param y1
* double which is the y position
* @return double the distance between the two positions
*/
double getDistance(double x1, double y1) {
return Point2D.distance(x1, y1, x, y);
}
/**
* This writes this entry as a line in the output files.This may
* generate more than one line of output if the node crosses the
* boundary as a result of this Entry. In this case the Entry is
* modified and this method is called recursively*
* @param x1
* double this is the X position of the previous Entry
* @param y1
* double this is the Y position of the previous Entry
* @param x3
* double this is the X position of the next Entry
* @param y3
* double this is the Y position of the next Entry
* @param nextTime
* double the time of next Entry
* @throws Exception
* if there is a write error*/
void writeMove(double x1,double y1,double x3,double y3,double nextTime)
throws Exception {
if (x == getX() && y == getY()) {
70
Page 83
8/12/2019 Raid Alghamdi MCS 2012
http://slidepdf.com/reader/full/raid-alghamdi-mcs-2012 83/96
// When this point is inside the boundary - Also the base case
// of the recursion
writeToFile.printf(SETDEST_FORMAT, time, nodeNumber, x, y, speed);
writeToFileStatistical.printf(STAT_FORMAT_M, nodeNumber,
time, nextTime - time, speed, x, y, x3, y3);
} else {
double m = (y - y1) / (x - x1); // Slope
// intersect with y axis Find which boundary we cross
double b = y - (m * x);
// Initialize the Min distance as infinity
double minDistanceToBoundry = Double.MAX_VALUE;BoundaryEnum boundary = BoundaryEnum.XMAX;
// For each boundary
for (BoundaryEnum bound : BoundaryEnum.values()) {
// Check if line cross the boundary
if (bound.crossesBoundary(x, y, m, b)) {
// IF so, calculate the distance to the boundary
if (bound.distanceTo(x1, y1, m, b) < minDistanceToBoundry) {
boundary = bound;
minDistanceToBoundry = bound.distanceTo(x1, y1, m, b);
}}
}
// This is the location at which the movement intersects the
// boundary
Point boundPoint = boundary.getBoundaryPoint(x1, y1, m, b);
// This is the first line of the jump which is giving a
// location to the boundary
writeToFile.printf(SETDEST_FORMAT, time, nodeNumber, boundPoint.x,
boundPoint.y, speed);
// This is where the node re-appear from
Point newPoint = boundary.getOppositePoint
(boundPoint.x, boundPoint.y);
71
Page 84
8/12/2019 Raid Alghamdi MCS 2012
http://slidepdf.com/reader/full/raid-alghamdi-mcs-2012 84/96
// the other side
double jumpTime = minDistanceToBoundry / speed;
double oldTime = time;
time = time + jumpTime;
// Write the first entry to the Trace file
writeToFileStatistical.printf(STAT_FORMAT_M, nodeNumber, oldTime,
time - oldTime, speed, boundPoint.x, boundPoint.y, newPoint.x,
newPoint.y);
writeToFile.printf(SETPOS_FORMAT, time, nodeNumber, newPoint.x,
newPoint.y); // This is the jump line written to the
// output file.
writeToFileStatistical.printf(STAT_FORMAT_J, nodeNumber, time,
newPoint.x, newPoint.y, getX(), getY());
// Update the x and y location of the entry after the jump
if (boundary == BoundaryEnum.XMAX || boundary == BoundaryEnum.XMIN)
x = getX();
else {
y = getY();
}
// Recurse
writeMove(newPoint.x, newPoint.y, x3, y3, nextTime);
}
}}
/**
* This Enumerator lists the four boundaries
*
* @author Raid
*
*/
public enum BoundaryEnum {
/**
* The Maximum X boundary
*/
XMAX {
@Override
public Point getOppositePoint(double x, double y) {
return new Point(0 + VALUE_TO_BOUNDRY, y);
72
Page 85
8/12/2019 Raid Alghamdi MCS 2012
http://slidepdf.com/reader/full/raid-alghamdi-mcs-2012 85/96
}
@Override
public boolean crossesBoundary(double x,double y,double m,double b)
{
return x > xLength;
}
@Override
public double distanceTo(double x, double y, double m, double b) {
double x2 = xLength;
double y2 = (m * x2) + b;
return Point2D.distance(x, y, x2, y2);
}
@Override
public Point getBoundaryPoint(double x,double y,double m,double b)
{
double x2 = xLength;
double y2 = (m * x2) + b;
return new Point(x2 - VALUE_TO_BOUNDRY, y2);
}
},
/**
* The Minimum X boundary*/
XMIN {
@Override
public Point getOppositePoint(double x, double y) {
return new Point(xLength - VALUE_TO_BOUNDRY, y);
}
@Override
public boolean crossesBoundary(double x,double y,double m,double b)
{
return (x < 0);
}
@Override
public double distanceTo(double x, double y, double m, double b) {
double x2 = 0;
double y2 = b;
73
Page 86
8/12/2019 Raid Alghamdi MCS 2012
http://slidepdf.com/reader/full/raid-alghamdi-mcs-2012 86/96
return Point2D.distance(x, y, x2, y2);
}
@Override
public Point getBoundaryPoint(double x,double y,double m,double b)
{
double x2 = 0;
double y2 = b;
return new Point(x2 + VALUE_TO_BOUNDRY, y2);
}
},
/*** The Maximum Y boundary
*/
YMAX {
@Override
public Point getOppositePoint(double x, double y) {
return new Point(x, 0 + VALUE_TO_BOUNDRY);
}
@Override
public boolean crossesBoundary(double x,double y,double m,double b)
{
return y > yLength;
}
@Override
public double distanceTo(double x, double y, double m, double b) {
if (Double.isInfinite(m))
return yLength - y;
double y2 = yLength;
double x2 = (y2 - b) / m;
return Point2D.distance(x, y, x2, y2);
}
@Overridepublic Point getBoundaryPoint(double x,double y,double m,double b)
{
if (Double.isInfinite(m))
return new Point(x, yLength - VALUE_TO_BOUNDRY);
74
Page 87
8/12/2019 Raid Alghamdi MCS 2012
http://slidepdf.com/reader/full/raid-alghamdi-mcs-2012 87/96
double y2 = yLength;
double x2 = (y2 - b) / m;
return new Point(x2, y2 - VALUE_TO_BOUNDRY);
}
},
/**
* The Maximum Y boundary
*/
YMIN {
@Override
public Point getOppositePoint(double x, double y) {return new Point(x, yLength - VALUE_TO_BOUNDRY);
}
@Override
public boolean crossesBoundary(double x,double y,double m,double b)
{
return y < 0;
}
@Override
public double distanceTo(double x, double y, double m, double b) {
if (Double.isInfinite(m))
return y;
double y2 = 0;
double x2 = -(b / m);
System.err.println(x + " " + y + " " + m + " " + b);
return Point2D.distance(x, y, x2, y2);
}
@Override
public Point getBoundaryPoint(double x,double y,double m,double b)
{
if (Double.isInfinite(m))
return new Point(x, 0 + VALUE_TO_BOUNDRY);
return new Point(-(b / m), 0 + VALUE_TO_BOUNDRY);
}
};
75
Page 88
8/12/2019 Raid Alghamdi MCS 2012
http://slidepdf.com/reader/full/raid-alghamdi-mcs-2012 88/96
/**
* Returns the other side of the boundary giving the specified x and y.
* NOTE: the x and y should be located on the boundary
*
* @param x
* double the x position
* @param y
* double the y position
* @return Point the location of the opposite side of the boundary
*/
public abstract Point getOppositePoint(double x, double y);
/**
* Returns the point at which the line segment specified be the given* parameters intersects this boundary
*
* @param x double the x position in side the boundary
* @param y double the y position in side the boundary
* @param m double which is the slope of the line
* @param b double which is the y intersects of the line
* @return point Returns the point at which the line segment
* specified be the given parameters intersects this boundary
*/
public abstract Point getBoundaryPoint(double x, double y, double m,
double b);
/*** This method determines if we cross the boundary or not.
*
* @param x double the x position inside the boundary
* @param y double the y position inside the boundary
* @param m double which is the slope of the line
* @param b double which is the y intersects of the line
* @return true if the specified line segment crosses this boundary,
* false otherwise.
*/
public abstract boolean crossesBoundary(double x, double y, double m,
double b);
/*** Calculate the distance to this boundary given the specified line segment
*
* @param x double the x position inside the boundary
* @param y double the y position inside the boundary
76
Page 89
8/12/2019 Raid Alghamdi MCS 2012
http://slidepdf.com/reader/full/raid-alghamdi-mcs-2012 89/96
* @param m double which is the slope of the line
* @param b double which is the y intersects of the line
* @return double the distance to the boundary
*/
public abstract double distanceTo(double x,double y,double m,double b);
}
/**
* describes how the a node can move on the plane. This is an abstract
* class,implementing subclass (classes) specify specific types of
* movements
*
* @author Raid
*
*/static abstract class Movement {
/**
* Giving a new x and y position for a node given the old x and y
* position.
*
* @param x double the X position inside the boundary
* @param y double the Y position inside the boundary
* @return Point new position which may be outside the boundary
*/
abstract Point getNewPoint(double x, double y);
}
/**
* This method to make the movement just in X coordinate
*
* @author Raid
*
*/
static class Xmovement extends Movement {
@Override
Point getNewPoint(double x, double y) {
double change = random.nextDouble() * MAX_MOVEMENT;
if (random.nextBoolean())
x += change;else
x -= change;
return new Point(x, y);
77
Page 90
8/12/2019 Raid Alghamdi MCS 2012
http://slidepdf.com/reader/full/raid-alghamdi-mcs-2012 90/96
}
}
/**
* This method to make the movement just in Y coordinate
*
* @author Raid
*
*/
static class Ymovement extends Movement {
@Override
Point getNewPoint(double x, double y) {
double change = random.nextDouble() * MAX_MOVEMENT;if (random.nextBoolean())
y += change;
else
y -= change;
return new Point(x, y);
}
}
/**
* This method to make the movement on both X and Y Coordinates
** @author Raid
*
*/
static class XandYmovement extends Movement {
@Override
Point getNewPoint(double x, double y) {
double angle = random.nextDouble() * 360;
double xMax = Math.cos(Math.toRadians(angle)) * MAX_MOVEMENT;
double yMax = Math.sin(Math.toRadians(angle)) * MAX_MOVEMENT;
x += random.nextDouble() * xMax;y += random.nextDouble() * yMax;
return new Point(x, y);
}
78
Page 91
8/12/2019 Raid Alghamdi MCS 2012
http://slidepdf.com/reader/full/raid-alghamdi-mcs-2012 91/96
}
/**
* Enum for all the possible movements
*
* @author Raid
*
*/
public enum MovementEnum {
X_MOVEMENT(new Xmovement()), Y_MOVEMENT(new Ymovement()),
XY_MOVEMENT(new XandYmovement());
private Movement move;
private MovementEnum(Movement move) {
this.move = move;
}
public Point getNewPoint(Point p) {
return move.getNewPoint(p.x, p.y);
}
public Point getNewPoint(double x, double y) {
return move.getNewPoint(x, y);
}
}
static private class Point {
double x;
double y;
Point(double x, double y) {
this.x = x;
this.y = y;
}
}
}
%\end{}
&\end{lstlisting}
79
Page 92
8/12/2019 Raid Alghamdi MCS 2012
http://slidepdf.com/reader/full/raid-alghamdi-mcs-2012 92/96
Appendix B
B.1 Node Class
Node class represents mobile nodes in the simulators
public class Node {
private double x;
private double y;
private double startTime;
private double speed;
/**
* Constructor
*
* @param x
* @param y
*/
public Node(double x, double y) {
this.x = x;
this.y = y;
}
/**
* @return the x
*/
public double getX() {
return x;
}
/**
* @param x
* the x to set
*/
public void setX(double x) {
this.x = x;
}
80
Page 93
8/12/2019 Raid Alghamdi MCS 2012
http://slidepdf.com/reader/full/raid-alghamdi-mcs-2012 93/96
/**
* @return the y
*/
public double getY() {
return y;
}
/**
* @param y
* the y to set
*/
public void setY(double y) {
this.y = y;
}
/**
* @return the startTime*/
public double getStartTime() {
return startTime;
}
/**
* @param startTime
* the startTime to set
*/
public void setStartTime(double startTime) {
this.startTime = startTime;
}
/**
* @return the speed*/
public double getSpeed() {
return speed;
}
/**
* @param speed
* the speed to set
*/
public void setSpeed(double speed) {
this.speed = speed;
}
/*
* (non-Javadoc)*
* @see java.lang.Object#toString()
*/
@Override
81
Page 94
8/12/2019 Raid Alghamdi MCS 2012
http://slidepdf.com/reader/full/raid-alghamdi-mcs-2012 94/96
public String toString() {
return "Node [x=" + x + ", y=" + y + ", startTime=" + startTime
+ ", speed=" + speed + "]";
}
}
\end{}
82
Page 95
8/12/2019 Raid Alghamdi MCS 2012
http://slidepdf.com/reader/full/raid-alghamdi-mcs-2012 95/96
Vita
Candidate’s full name: Raid Abdullah Alghamdi
Universities attended: Al Baha University, Al Baha City, Kingdomof Saudi Arabia, 2003-2007, Bachelor of Computer Science.
University of New Brunswick, Fredericton,NB, Canada, 2011, Diploma in UniversityTeaching.
University of New Brunswick, Fredericton, NB,
Canada, 2010 - 2012, Masters in ComputerScience.
Publications: Ahmed Alghamdi, Raid Alghamdi, JohnDeDourek, and Przemyslaw Pochec,Store-and-Forward Protocol Advantage in aM2ANET Network, AFIN 2012, (The FourthInternational Conference on Advances inFuture Internet), Rome, Italy, pp. 42-47,August 19-24, 2012.
Page 96
8/12/2019 Raid Alghamdi MCS 2012
http://slidepdf.com/reader/full/raid-alghamdi-mcs-2012 96/96
Raid Alghamdi, John DeDourek, and
Przemyslaw Pochec, New Random MotionGenerator for Wireless Mobile NetworkSimulator ns2, ICCNDT 2012, (TheInternational Conference on Computing,Networking and Digital Technologies), Sanad,Bahrain, pp. 212-218, November 11-13, 2012.
Raid Alghamdi, John DeDourek, andPrzemyslaw Pochec, Modeling Motion inWireless Mobile Network Simulation NS2,accepted for ICN 2013, (The Twelfth
International Conference on Networks),Seville, Spain, January 27 - February 1, 2013.
Conference Posters: Ahmed Alghamdi, Raid Alghamdi, andMohammed Alzaylaee, Network Simulation,Eighth Annual Research Exposition 2011 for theFaculty of Computer Science at University of New Brunswick, Fredericton, NB Canada,April 8, 2011.
Raid Alghamdi, Movement Generator forMobile Network Simulation, Ninth AnnualResearch Exposition 2012 for the Faculty of Computer Science at University of NewBrunswick, Fredericton, NB Canada,April 10, 2012.