150
Field Research Study November 2014 67 Fife Avenue Harare, Zimbabwe Rail Services From A Customer & Railway Operator‘s Perspective

Field Research Study November 2014
6 7 F i f e A v e n u e H a r a r e , Z i m b a b w e Z
Rail Services From A Customer & Railway Operator‘s Perspective

1
TABLE OF CONTENT
Page
LIST OF FIGURES 3
LIST OF TABLES 4
LIST OF ANNEXURE 5
ACRONYMS 6
EXECUTIVE SUMMARY 7
1. INTRODUCTION 8
1.1 Background 8
1.2 Purpose 9
1.3 Problem Statement 9
1.4 The Champion 11
2. STUDY OBJECTIVES 11
3. RESEARCH HYPOTHESIS 12
4. RESEARCH METHODOLOGY 13
5. FINDINGS, ANALYSIS AND OUTCOMES 14
5.1 Infrastructure Assessment 14
A. SADC regional transport infrastructure 14
B. Hinterland connectivity and network coverage 16
C. Road network density 17
D. Railway System 17
E. Comparison 18
F. Port Infrastructure 18
5.2. Market Demand Assessment 20
A. Zambia key commodities assessment 20
B. Zimbabwe key commodities assessment 27
C. Botswana key commodities assessment 33
D. Mozambique key commodities assessment 35
E. South Africa key commodities assessment 40
5.3 Analysis of Customer responses to questionnaires 42
A. Summary of Findings: 43
B. Additional evaluation of customer perception 44
5.4 Analysis of responses from Railway Operators 46
Rail Services from A Customer’s & Railway Operator Perspective
2
5.5 Outcome of the research findings in relation to the shortest route 48
principle
6. RE-IMAGINING RAIL SERVICE DELIVERY 49
A. Client focused service delivery strategy 49
B. Supply chain systems view 50
C. Alternative logistics strategies enabling
multi-modal coordination 50
D. Functional specialisation 52
E. Implementation of the SARA Marketing Policy 53
7. CONCLUSION AND RECOMMENDATIONS 54
A. Conclusion 54
B. Recommendations 56

3
LIST OF FIGURES
Figures Page
Figure 1.1 Railway Operators 10
Figure 2.1 Regional Transport Corridors 15
Figure 2.2 Road rail network 17
Figure 2.3 Ports servicing both road and rail 19
Figure 3.1 Copper mining and exploration activity Zambia and DRC 21
Figure 3.2 Copper export route options 21
Figure 3.3 Fertilizer import route options 23
Figure 3.4 Sulphur import route options 23
Figure 3.5 Sugar export route options 24
Figure 3.6 Zimbabwe coal production planned (left) and speculative (right) 27
Figure 3.7 Tobacco export route options 29
Figure 3.8 Cotton export route options 30
Figure 3.9 Botswana coal production planned (left) and speculative (right) 33
Figure 3.10 Port of Maputo aerial view 35
Figure 3.11 Port of Beira aerial view 36
Figure 3.12 Port of Durban aerial view 40
Figure 6.1 Client focus- Client logistics requirements analysis 49
Figure 6.2 Alternative freight distribution concepts 51
Figure 6.3 Conceptual views of logistics hubs in Southern Africa 52
Figure 7.1 Service level requirements process 58

Rail Services from A Customer’s & Railway Operator Perspective
4
LIST OF TABLES
Tables Page
Table 2.1 Corridor Distances 15
Table 3.1 Rates for commodity for corridor from and to Zambia 25
Table 3.2 Market share of Zambia and DRC key import and export commodities 25
Table 3.3 Profile of Zimbabwe‟s key import and export commodities 31
Table 3.4 Rail/road rates per commodity per corridor
of Zimbabwe key commodities 32
Table 3.5 Cost of Containerizes cargo per railway 32
Table 3.6 Profile of Maputo corridor key import and export commodities 38
Table 3.7 Profile of Limpopo corridor key import and export commodities 39
Table 3.9 Port of Durban Aerial view 40
Table 4.1 Aggregate evaluation of railway service provision 45

5
LIST OF ANNEXURE
Annexure Page
Annexure A.1 SARA Marketing Policy 60
Annexure A.2 Terms of reference of the Rail optimization Committee
and Consultant 67
Annexure A.3 Railway Operator Questionnaire 72
Annexure A.4 Customer Service Delivery Questionnaire 76
Annexure A.5 Zambia Chamber of Mines presentation 81
Annexure A.6 Zambia Market study survey data 88
Annexure A.7 Zimbabwe Market study Survey 91
Annexure A.8 Mozambique Market Study Survey 98
Annexure A.9 South Africa Market study Survey 102
Annexure A.10 Analysis of Customer responses 107
Annexure A.11 Analysis to the responses of the Railway Operator Questionnaire 131

Rail Services from A Customer’s & Railway Operator Perspective
6
ANCRONYMS APP Active Power Project
BBR Beitbridge Bulawayo Railways
BR Botswana Railways
CFB Caminhos de Ferro de Benguela
CFL Caminhos de Ferro de Luanda
CFM Caminhos de Ferro de Mocamedes
CFM Caminhos de Ferro de Mozambique
CMG Corridor Management Group
EU European Union ISO International Standards Organisation JOC Joint Operation Centre
NRZ National Railways of Zimbabwe
RA Railway Administrations
RAHCO Reli Asset Holding Company
SADC Southern African Development Community
SARA Southern African Railways Association
SNCC Societe Nationale des Chemins de fer du Congo
SR Swaziland Railways
TEU Twenty-foot equivalent unit TNHL Transnamib Holdings Limited
TFR Transnet Freight Rail
TAZARA Tanzania Zambia Railway Authority
ZRL Zambia Railways Limited
7
EXECUTIVE SUMMARY The efficiency of transport logistics is a critical platform for supply chain integration,
trade and economic growth and places growing importance on connectivity between
production centres, transit hubs and consumption centres. Existing supply chain
solutions in southern Africa are however characterised by operational inefficiency,
high logistics costs and long transit times.
There is concern amongst SARA members, specifically the rail operators, that
the distribution/share of transit rail traffic to/from the SADC hinterland through
the ports, to/from overseas markets, is not being fairly shared between the rail
systems of the region. Railways believe that they can offer convenient and
relatively cheaper transportation services if they align themselves with the
market.
Addressing operational and service deficiencies is only part of the solution in
rehabilitating customer perception and restoring confidence to the rail sector. A more
holistic strategy aligned with dynamic and emergent customer needs is required to
effectively begin to affect supply chain patterns and client logistics strategies. The
findings of this report highlight that the inability to put the clients needs at the focus of
rail service strategies is glaring in its omission, and has contributed in the general
dissatisfaction with rail service providers.
More importantly framing the competitive dynamics of regional surface transport as
simply a modal choice between road and rail, fails to recognise the complexity of
optimising service delivery around complex supply chains with often conflicting
logistics requirements. A closer look at key client considerations uncovers a different
view, which is not limited to modal choice but rather emphasises the logistics
challenges characterised by a variety of determinants including:
Service reliability
Time sensitivity
Cost efficiency
Operational flexibility
Security
Rail Services from A Customer’s & Railway Operator Perspective
8
1. INTRODUCTION
1.1 Background
The old adage that form follows function has played a significant role in framing the
competitive dynamics of the transportation and logistics industry in the SADC region.
Historically the comparative advantages of rail transport in moving heavy bulk cargo
over long distances, led to major investment in rail and port systems. While rail
friendly cargo from mining and agriculture customers remains a key pillar to the
regions economy, the development of road networks better equipped to compete in
the more time-sensitive transport markets has progressively impacted on the
competitiveness of rail services.
Rail services in Southern Africa inspire general dissatisfaction with existing and
potential clients alike. Customers bemoan poor service quality and operational
performance, and increasingly perceive road haulage as a better transport option.
Poor service reliability, long transit times and inadequate customer focus are
commonly cited as challenges clients face in securing rail service. In addition rail
services lack many modern amenities such as real-time tracking that are widely
standardised across other transport modes.
Addressing operational and service deficiencies is only part of the solution in
rehabilitating customer perception and restoring confidence to the rail sector. A more
holistic strategy aligned with dynamic and emergent customer needs is required to
effectively begin to affect supply chain patterns and client logistics strategies.
In 2001 SARA developed and ratified a SARA Marketing Policy (Annexure A.1) that
gives direction on how SARA members should move transit traffic equitably along
corridors. Item 3 of the SARA Marketing Policy stated how transit traffic would be
distributed along corridors, based on the shortest geographical route principle,
efficiency and customer choice but the key being the shortest route principle. It is
against the backdrop of how the RAs are implementing the Marketing Policy as and
when its suit them, which has brought a bone of contention among SARA members
especially along the Plumtree and Beitbridge corridors.

9
1.2 Purpose
The comparative advantages of Southern Africa‟s rail transportation systems vary
both in terms of the level of infrastructure investment and service delivery. Against a
backdrop of sustained regional growth, the long-term competitiveness of rail
transport corridors is dependent on the ability of service providers to leverage unique
inherent benefits, offering innovative and sustainable solutions that meet dynamic
logistics and transportation needs.
When the Board formed the Rail Optimization Committee (Terms of Reference -
Annexure A.2) it was not only to look at the shortest route principle but also on the
loss of rail market share. The purpose of this submission is to inform the Southern
African Railways Association (SARA) in identifying and characterising existing
market needs, decision drivers in corridor and modal selection and key challenges
experienced by customers seeking to move goods to and from the SADC hinterland
through regional ports to overseas markets. In addition the report incorporates rail
operator views on service provision, and it is envisioned that this document will
provide a reference point, framing strategic decisions geared towards aligning
railway industry players with the SADC‟s freight and logistics market.
1.3 Problem Statement
There is concern amongst SARA members, specifically the rail operators (figure 1.1
shows key regional rail operators), that the distribution/share of transit rail traffic
to/from the SADC hinterland through the ports, to/from overseas markets, is not
being fairly shared between the rail systems of the region. Railways believe that they
can offer convenient and relatively cheaper transportation services if they align
themselves with the market.

Rail Services from A Customer’s & Railway Operator Perspective
10
Figure 1.1 – Regional Rail Operators
The SARA Board wants to identify and address the underlying problem of lost rail
market share so that the usage of rail transport systems in the region can be
optimized for the benefit of all. The challenge focuses on the ability to articulate the
role played by each corridor in an integrated transport system that facilitates logistics
and supply chain optimisation. To this end the Board set up a Committee to
spearhead a field research study to establish;
1. The customer‟s perception on quality of services currently provided by railway
operators
2. The challenges customers face when dealing with the railways leading to loss
of market share to road
3. The distribution of market share between rail and road for both export and
import international traffic
4. The business volume projections and the future demand for railway services
5. The RAs‟ retrospective of competitiveness service delivery
6. The challenges encountered in pursuit of the service delivery.
In addition and arising from the findings of that research the committee is required to
advise on, inter alia, the following issues:
1. Strategies to be adopted by the railways in order to improve rail
competitiveness and increase market share in chosen markets, and

11
2. Equitable share of traffic between corridors, based on the assumption that
some corridors remain underutilized i.e. there is excess rail capacity on all or
some of the corridors.
1.4 The Champion
The Rail Optimisation Committee that was established in May 2013 by the SARA
Board requested the service of a consultant to carry out a field research on the
market demand and competitiveness of rail as surface transport in Southern Africa.
SARA is a Not for Profit regional association consisting of railway organisations in
the SADC region together with industry stakeholders and associates (customers,
suppliers etc.). SARA seeks to promote the railway industry as a top performer and
mode of choice in the surface transport sector.
A field research study was commissioned in response to growing concern among
SARA members regarding the competitiveness of rail services to address transit and
international traffic demand within the SADC region.
2. STUDY OBJECTIVES
The primary objective of this study is to establish equitable share of traffic between
corridors according to acceptable economic viability and conditions of the route. The
secondary objective is to equip SARA with an objective view relating to service
performance and competitiveness, enabling stakeholders to develop robust and
responsive strategies that will enhance the competitive position of the rail transport
sector. This relies on, on-the-ground customer and operator perspectives to:
• Generate objective client-focused baseline information on regional freight and
logistics within SADC
• Evaluate transportation and logistics competitive dynamics of surface modes
serving hinterland markets within SADC
• Develop an overview of the challenges and limitations exacerbating the
decline in rail market share
• Identify strategic opportunities to optimise performance and enhance the rail
service offering.

Rail Services from A Customer’s & Railway Operator Perspective
12
3. RESEARCH HYPOTHESIS
The problem faced by regional railways (SARA Members) is loss of business/traffic
to road due to lack of competitiveness in terms of total logistics service provision as
perceived by its customers. This has resulted in rail market share shrinking from in
excess of 80% in the mid-eighties, to current levels of below 10% of the traffic on
offer.
In general the rail transport system currently operates well below the design
capacity. All the regional transport routes or corridors outside South Africa
essentially compete for the same traffic from the landlocked countries. Traffic
includes exports and imports of mining, general and agricultural goods from and to
Botswana, Zimbabwe, Zambia, Malawi and the Democratic Republic of Congoin the
region of approximately 3 Mtpa (million tonnes per annum). Imports of manufactured
goods, mainly from South Africa are estimated at around 6 Mtpa.
Addressing underlying problems affecting rail competitiveness would conceivably
unlock latent rail demand to the extent that SARA members/corridors will battle to
cope with the volumes on offer. Some of the problems attributable to underlying
problems are limited investment and institutional framework a situation that needs
urgent redress. In the medium term then and once service level issues are redressed
priority should shift to ensuring that every available capacity on all the corridors is put
to maximum use and the respective railways‟ revenue performance will inevitably
rebound.
The assumption to the foregoing which the research seeks to establish is that the
customers in certain traffic categories have resorted to using road purely due to poor
total transport and logistics service offering by the railways. As such this has
impacted on customer confidence on rail sector. The research therefore seeks to
establish the following:
i. The real reasons for loss of traffic by rail to road
ii. Whether customers will indeed revert to rail once those problems are
fixed, and consider railways as the mode of choice
iii. To what extend will type of cargo and port play a role in the route choice
iv. What would be the natural role of the two modes of transport on the
market i.e. rail and road
v. What do the railways believe are the real reasons for loss of market share

13
vi. Are railways willing and able to address the core problems as seen by
customers
vii. If indeed the long-term challenge faced by SARA railways is capacity, is
there a case for targeting specific types of international traffic in preference
to others; if so to what benefit
viii. What other strategies do railways need to consider in order to cope with
the projected growth in volumes over the next four years.
4. RESEARCH METHODOLOGY
The research method was determined by the Terms of Reference as given by the
Rail Optimization Committee. The sample size was based on the north-south corridor
covering DRC, Zambia, Zimbabwe, Botswana, Mozambique and South Africa. The
north-south corridor included the following, Beitbridge, Beira, Limpopo, Ressano
Garcia and Plumtree SARA corridors. The stratification was based on key rail friendly
commodities looking at their historical, planned and speculative performance in
relation to route / corridor choice.
The stratification was based on key rail friendly commodities looking at their
historical, planned and speculative performance in relation to route / corridor choice
The research methodology used in gathering this data was a mixed method
(qualitative and quantitative).
The approach used to gather the data initially was questionnaires. One was
distributed by e-mail to RAs (Annexure A.3) to complete and the customer
questionnaire (Annexure A.4) that was to be distributed to RAs‟ top 5 customers.
This was followed by face-to-face interviews with identified key customers within the
sample size based on modified customer service questionnaire. The field research
results were complemented by perusal of pertinent historical literature from internal
and external sources
The premise is to establish innovative rail services aligned with logistical market
needs which will enhance regional trade and transit traffic, offering a convenient and
cost effective surface transport solution for regional supply chains.
5. FINDINGS, ANALYSIS AND OUTCOMES
The customers considered the consultant as neutral to whom they could open up of
their experiences with the railways. During the face-to-face interviews the customers
were candid in answering the questions and giving their honest opinion on services
offered by railway. It was observed that no export or import trains run directly from or
to DRC because most DRC traffic is transhipped in Zambia in the Copper-belt. The
distributions of customers‟ responses were as below;
6 from Zambia
1 from DRC
19 from Zimbabwe
13 from Mozambique
7 from South Africa
1 from Botswana
2 from Swaziland
Responses of the operator questionnaire were received from nine of the ten RAs
namely BBR, BR, CFM, NRZ, SNCC, SR, TFR, TNHL and ZRL.
5.1 Infrastructure Assessment
A. Spatial setting – SADC regional transport infrastructure
The dominant corridors serving the SADC region are largely developed from legacy
trade and transport routes linked to port infrastructure. Today port developments
continue to play a critical role as gateways supporting both inbound and outbound
logistics supply chains. Figure 2.1 indicates key transportation corridors across
Southern Africa, together with the associated anchor ports.
15
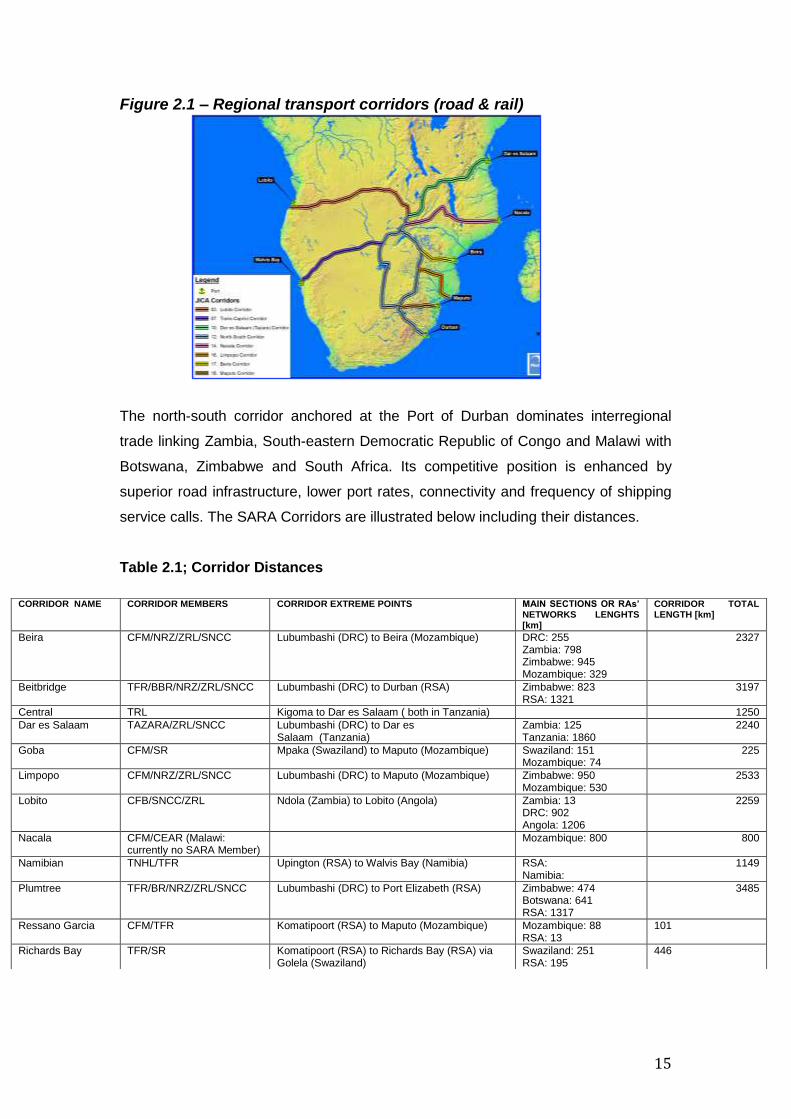
Figure 2.1 – Regional transport corridors (road & rail)
The north-south corridor anchored at the Port of Durban dominates interregional
trade linking Zambia, South-eastern Democratic Republic of Congo and Malawi with
Botswana, Zimbabwe and South Africa. Its competitive position is enhanced by
superior road infrastructure, lower port rates, connectivity and frequency of shipping
service calls. The SARA Corridors are illustrated below including their distances.
Table 2.1; Corridor Distances
CORRIDOR NAME CORRIDOR MEMBERS CORRIDOR EXTREME POINTS MAIN SECTIONS OR RAs’ NETWORKS LENGHTS [km]
CORRIDOR TOTAL LENGTH [km]
Beira CFM/NRZ/ZRL/SNCC Lubumbashi (DRC) to Beira (Mozambique) DRC: 255 Zambia: 798 Zimbabwe: 945 Mozambique: 329
2327
Beitbridge TFR/BBR/NRZ/ZRL/SNCC Lubumbashi (DRC) to Durban (RSA) Zimbabwe: 823 RSA: 1321
3197
Central TRL Kigoma to Dar es Salaam ( both in Tanzania) 1250
Dar es Salaam TAZARA/ZRL/SNCC Lubumbashi (DRC) to Dar es Salaam (Tanzania)
Zambia: 125 Tanzania: 1860
2240
Goba CFM/SR Mpaka (Swaziland) to Maputo (Mozambique) Swaziland: 151 Mozambique: 74
225
Limpopo CFM/NRZ/ZRL/SNCC Lubumbashi (DRC) to Maputo (Mozambique) Zimbabwe: 950 Mozambique: 530
2533
Lobito CFB/SNCC/ZRL Ndola (Zambia) to Lobito (Angola) Zambia: 13 DRC: 902 Angola: 1206
2259
Nacala CFM/CEAR (Malawi: currently no SARA Member)
Mozambique: 800 800
Namibian TNHL/TFR Upington (RSA) to Walvis Bay (Namibia) RSA: Namibia:
1149
Plumtree TFR/BR/NRZ/ZRL/SNCC Lubumbashi (DRC) to Port Elizabeth (RSA) Zimbabwe: 474 Botswana: 641 RSA: 1317
3485
Ressano Garcia CFM/TFR Komatipoort (RSA) to Maputo (Mozambique) Mozambique: 88 RSA: 13
101
Richards Bay TFR/SR Komatipoort (RSA) to Richards Bay (RSA) via Golela (Swaziland)
Swaziland: 251 RSA: 195
446

Rail Services from A Customer’s & Railway Operator Perspective
16
In Beira, Beitbridge, Dar es Saalam, Limpopo and Plumtree corridor distances the
SNCC distance is not included as it was observed that no export or import trains run
directly from or to DRC as most DRC traffic is transhipped in Zambia in the Copper-
belt. Through infrastructure development plan for Southern Africa two projects are
underway to augment the regional economic and international trade and these are
Trans-Kalahari and Lobito corridors.
The Trans-Kalahari corridor is 1,900km anchored at the port of Walvis Bay and links
Namibia with Botswana and South Africa. The governments of Botswana and
Namibia jointly developed the corridor, which consists of a tarred road as well a rail
line from Walvis Bay to Gobabis. There are plans to extend the rail link along the full
length of the corridor.
The Lobito corridor is 2,149km in length and it includes the Benguela rail, which is
anchored at the port of Lobito. Both road and rail infrastructure along the corridor
have planned rehabilitation schemes that will provide shorter hinterland distances
from the Copperbelt and facilitate access to western market
Alternate routes through Beira and Maputo in Mozambique, Walvis Bay in Namibia
and Dar es Salaam in Tanzania, Lobito in Angola play an increasing role in regional
trade. In many cases these options boast shorter hinterland distances from key
production and urban nodes, however their primary status as feeder ports in some
instances offers suboptimal shipping connectivity.
B. Hinterland connectivity and network coverage
The ability to meet the demands of regional growth and expanding populations
across Southern Africa is linked to the development of pervasive transportation
networks and adaptive multi-modal logistic solutions. The rapid pace of economic
growth and urbanisation over the last decade has so far outpaced investment in
infrastructure and this is particularly evident in the railway sector. From an
operational point of view, with the exception of the South Africa‟s dedicated bulk
railway lines, the Southern African regional freight transport sector is characterised
by long distances, relatively low volumes and therefore relatively high railway tariffs.

17
C. Road network density
Key urban centres in Southern Africa are connected by regional trunk road
infrastructure. South Africa in particular has a high-density road network
characterised by high quality inter-urban road links. Zimbabwe‟s urban centres are
connected by moderate density road network, and its central location in SADC is
critical to regional and international trade. In Mozambique road links provide
connectivity between regional economic centres and gateway ports. Road links in
Botswana, Namibia, Swaziland, Angola, Tanzania and Zambia are of relatively lower
density connecting key urban and production centres, however significant investment
has been earmarked particularly in Zambia, towards extending road quality and
connectivity. In DRC more needs to be done in terms of Infrastructure development
in this regard.
Figure 2.2 – Road (left) and rail (right) networks
D. Railway System
SADC railways have a unified cape gauge of 1067mm (TRL line has a gauge of
1000m) which enables network continuity and regional integration from South-
eastern DRC and Tanzania (TAZARA line) to South Africa connecting 11 countries.
Rail coverage is relatively low with the exception of South Africa, which has 40% of
Africa‟s operating network and carries 70% of the continent‟s rail traffic. Railways in
the region are mainly freight railways.

Rail Services from A Customer’s & Railway Operator Perspective
18
E. Comparison
The road network is more pervasive (see figure 2.2 - left) in comparison to rail and
dominates the transport sector in most Southern African countries transporting
80%<of freight and passenger traffic. Greater density and broader network continuity
across regional borders facilitates service flexibility, responsiveness and better point-
to-point logistics solutions. These positive network effects coupled with a lack of
appreciation of total logistics services and infrastructure have contributed declining
rail traffic.
Few new railway lines have been constructed in recent years to expand capacity and
augment connectivity. Capacity of the existing railway network specifically north of
the Limpopo is artificially suppressed as a result of hot spots requiring rehabilitation
and maintenance. Tactical interventions such as the introduction of modern signalling
systems would further increase rail throughput delaying the need for capital intensive
new line developments.
F. Port Infrastructure
The key ports and port clusters serving the Southern African hinterland offer a range
of maritime services, serving as gateways to global markets for both import and
export cargo. Maritime traffic is concentrated in the southeast at the Port of Durban,
which plays a significant role in regional supply chains.
Key ports include;
• Tanzania ports (Dar es Salaam);
• Mozambique ports (Nacala, Beira, Maputo);
• Durban cluster (Durban and Richards Bay);
• South central cluster (Port Elizabeth, Ngqura);
• Cape Town cluster (Cape Town and Saldanha); and
• Namibia ports (Walvis Bay and Luderitz)
• Angola port (Lobito)
19
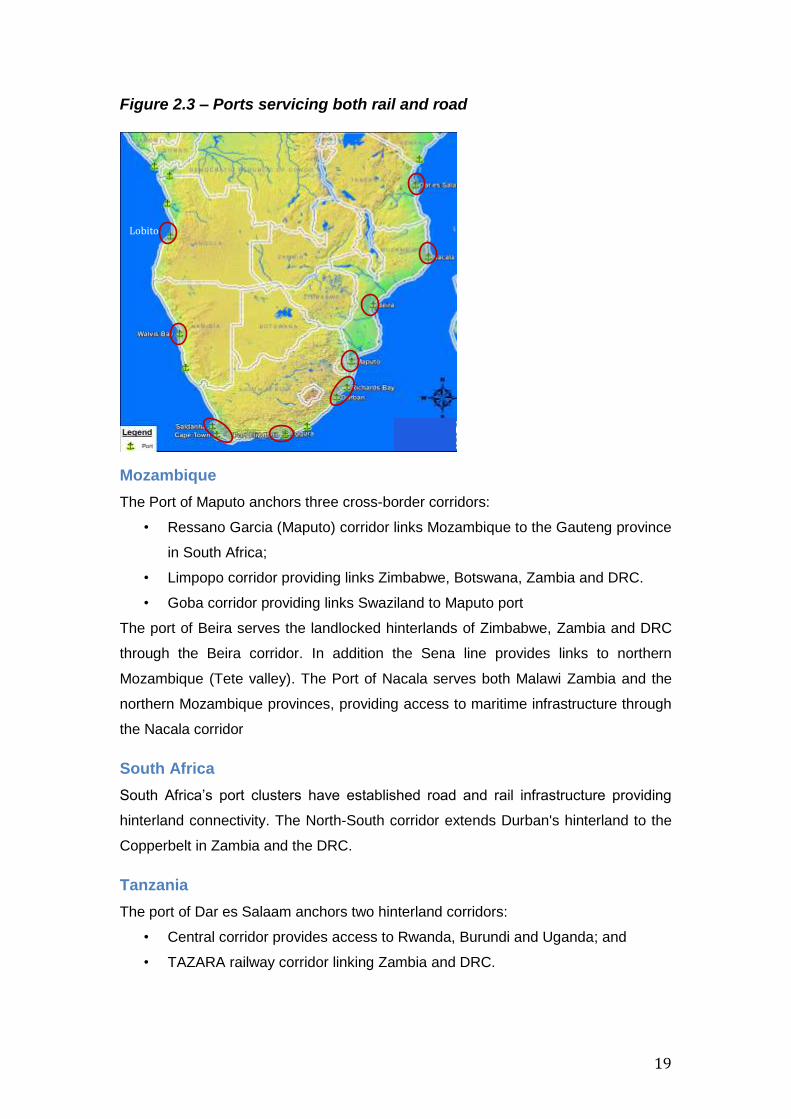
Figure 2.3 – Ports servicing both rail and road
Mozambique
The Port of Maputo anchors three cross-border corridors:
• Ressano Garcia (Maputo) corridor links Mozambique to the Gauteng province
in South Africa;
• Limpopo corridor providing links Zimbabwe, Botswana, Zambia and DRC.
• Goba corridor providing links Swaziland to Maputo port
The port of Beira serves the landlocked hinterlands of Zimbabwe, Zambia and DRC
through the Beira corridor. In addition the Sena line provides links to northern
Mozambique (Tete valley). The Port of Nacala serves both Malawi Zambia and the
northern Mozambique provinces, providing access to maritime infrastructure through
the Nacala corridor
South Africa
South Africa‟s port clusters have established road and rail infrastructure providing
hinterland connectivity. The North-South corridor extends Durban's hinterland to the
Copperbelt in Zambia and the DRC.
Tanzania
The port of Dar es Salaam anchors two hinterland corridors:
• Central corridor provides access to Rwanda, Burundi and Uganda; and
• TAZARA railway corridor linking Zambia and DRC.
Lobito

Rail Services from A Customer’s & Railway Operator Perspective
20
Namibia
Walvis Bay is Namibia‟s main commercial port and anchors the Trans-Caprivi
corridor, providing access into Northern Botswana and Zambia and possible
connectivity to DRC.
Angola
The port of Lobito is the main gateway port for Angola with mainly rail connectivity to
the DRC and to new mining developments in the Northwest of Zambia. The rail
connectivity from both DRC and Zambia is yet to be developed to link with Angolan
rail network.
5.2. Market Demand Assessment
A. Zambia key commodities assessment
For detailed information about Zambia market please refer to Annexure A.5 and A.6.
Copper
Copper is a high-value, low-volume commodity beneficiated and exported as copper
concentrate or cathodes to increase the value to weight ratio.
Production/Demand
762Kt of copper was produced in 2013. Forecast annual production is expected to
double over the next 5 years (1.5Mt) owing to new mining investments. This included
First Quantum Mines new mine with a capacity of 300 Mt per annum, scheduled to
come online in 2015. Figure 3.1 below illustrates copper mining activity concentrated
along the Copperbelt in Zambia and the DRC. DRC produced 960Kt in 2013 however
this is forecast to increase to 2Mtpa over the next 5years.

21
Figure 3.1: Copper mining and exploration activity – Zambia and DRC
Tariffs and charges
Trucking is the primary mode for handling both concentrate and cathodic copper.
Although security remains a key concern with road haulage, good transit time is
achieved at competitive charges ofUS$95 per tonne.
Route Options
Competition of the copper belt trade shows significant overlap due to corridor
connectivity and copper trade characteristics. The relatively high price of beneficiated
copper is able to absorb logistics costs over relatively long distances.
Figure 3.2 Copper export route options
1.7Mt

Rail Services from A Customer’s & Railway Operator Perspective
22
Figure 3.2 illustrates routing options for copper export to international markets.
Durban is able to leverage the agglomeration of services and shipping connectivity to
be competitive regardless of the extensive hinterland distances. Road dominates
copper transport to the Port of Durban.
Export through Beira has the benefit of higher value back-haul cargo, which includes
fertilizer, sulphur, re-agents and container cargo. The road rate of the aforesaid
commodities of US$130/150 per tonne is acceptable to the customers. Export
through the port of Dar es Salaam is hindered by poor service on the TAZARA
railway line and significant port congestion.
Fertilizer
Production/Demand
Current fertilizer demand in Zambia amounts to 400Kt per annum and this is
expected to rise to 500Kt in 2015 buoyed by as rapid growth in the agriculture sector.
Imports are dominated by one customer, who accounts for over half of Zambia‟s
fertilizer import – 240Kt per year.
Tariffs and charges
Charges for trucking which is the primary mode of transportation are considered high
at US$78/t (backhaul to Beira).
Route options
Imports are transported from Dar es Salaam, Beira and Durban however notable
dissatisfaction has be voiced regarding port congestion at the Port of Dar es Salaam
and poor service on the TAZARA line. Combined rail market share is estimated at
roughly 20%.

23
Figure 3.3 Fertilizer import route options
Sulphur
Demand for sulphur is high and continues to grow as more mining capacity comes
online.
Production/Demand
Zambian annual sulphur imports amount to roughly 240Kt. Coupled with sulphur
imports earmarked for the DRC (+260Kt per annum) the combined annual demand
for sulphur exceeds 500Kt, and high demand is expected to persist over the next two
years until the commissioning of Sentinel smelter (expected 2015) which will
commence production of sulphuric acid for First Quantum Mines.
Route considerations
Sulphur is considered a rail friendly commodity however it is transported as bulk by
both road and rail. Most of the sulphur is consolidated at depots in Ndola and then
trucked to final destination on the copper belt and DRC.
Figure 3.4 Sulphur import route options

Rail Services from A Customer’s & Railway Operator Perspective
24
Sugar
Sugar is a moderate value commodity with wide ranging applications in the food and
beverages industry.
Production/Demand
Zambia Sugar produces 420Kt of sugar per annum mainly for domestic consumption,
and is the only player in a small export market exporting 150Kt annually. A forecast
increase in total production to 500Kt in 2015 is likely to have a marginal impact on
export volumes going forward.
Tariffs and charges
Charges for trucking which is the primary mode of transportation are considered high
even with the backhaul to Beira.
Route Options
The final market destination for Zambia sugar exports is the European Union (EU).
Both road and rail are used as follows:
• Beira – 100kt by road. Sugar is backhauled in trucks used for fertilizer
imports; and
• Durban – 50kt using road and rail, 80/20 modal split respectively. Volumes
are disproportionately skewed towards road haulage as a result of higher
railage rates.
Figure 3.5 Sugar export route options
Rail Road rates/charges per tonne for Zambia key commodities
25
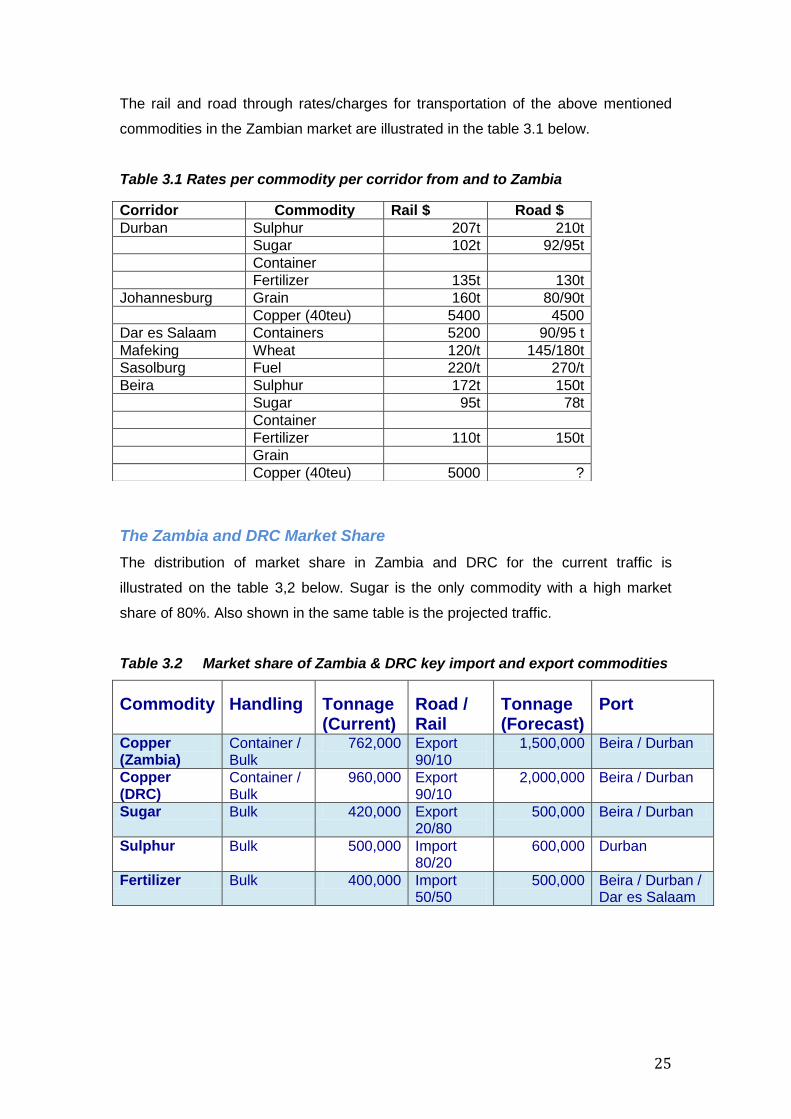
The rail and road through rates/charges for transportation of the above mentioned
commodities in the Zambian market are illustrated in the table 3.1 below.
Table 3.1 Rates per commodity per corridor from and to Zambia
The Zambia and DRC Market Share
The distribution of market share in Zambia and DRC for the current traffic is
illustrated on the table 3,2 below. Sugar is the only commodity with a high market
share of 80%. Also shown in the same table is the projected traffic.
Table 3.2 Market share of Zambia & DRC key import and export commodities
Commodity Handling Tonnage (Current)
Road / Rail
Tonnage (Forecast)
Port
Copper (Zambia)
Container / Bulk
762,000 Export 90/10
1,500,000 Beira / Durban
Copper (DRC)
Container / Bulk
960,000 Export 90/10
2,000,000 Beira / Durban
Sugar Bulk 420,000 Export 20/80
500,000 Beira / Durban
Sulphur Bulk 500,000 Import 80/20
600,000 Durban
Fertilizer Bulk 400,000 Import 50/50
500,000 Beira / Durban / Dar es Salaam
Corridor Commodity Rail $ Road $
Durban Sulphur 207t 210t
Sugar 102t 92/95t
Container
Fertilizer 135t 130t
Johannesburg Grain 160t 80/90t
Copper (40teu) 5400 4500
Dar es Salaam Containers 5200 90/95 t
Mafeking Wheat 120/t 145/180t
Sasolburg Fuel 220/t 270/t
Beira Sulphur 172t 150t
Sugar 95t 78t
Container
Fertilizer 110t 150t
Grain
Copper (40teu) 5000 ?
Rail Services from A Customer’s & Railway Operator Perspective
26

B. Zimbabwe
For detailed information about Zimbabwean market please refer to Annexure A.7.
Coal
Coal is a high value, low volume commodity used in a variety of sectors including
power generation, iron and steel production and cement manufacturing.
Production/Demand
Zimbabwe‟s coal production is anchored on domestic thermal demand, supplying
85% of the Zimbabwean market. Coal reserves are estimated at 1.0bn tonnes and
total inferred inventory coal resources are estimated at 2.1bn tonnes. Hwange
Colliery is Zimbabwe's major operating coalmine and has seen declining production
from a peak of 5.9Mtpa. Production target for 2013 is 2.5Mtpa.
There are limited exports of coking coal to regional markets including Zambia (coking
coal for copper smelting), DRC and South Africa.
Figure 3.6 Zimbabwe coal production – Planned (left) and Speculative (right)
Production expansion at Hwange is targeting export of up to 2Mtpa of coking coal.
Other coal reserves have been identified however potential production volumes are
unknown.
2.2Mt
0.3Mt ?

Rail Services from A Customer’s & Railway Operator Perspective
28
Ferrochrome
Ferrochrome is mined and processed in Zimbabwe but some exported as ore.
Production/Demand
Exports have declined from a peak of 300Kt to 130Kt in 2013 mainly due to adverse
economic condition affecting operational liquidity. Investment is required to revitalise
production, with available capacity for up to 540Ktpa.
Ferrochrome export target is 90Kt in 2014 and this is forecast to increase to 120Kt
over the next three years.
Route options
Ferrochrome exports are transported by rail and shipped through the port of Maputo.
Tariffs/Charges
The rate of ferrochrome is on rail is USD28.05t
Tobacco
Tobacco is considered a high-value cash crop and until recently Zimbabwe was one
of the major global exporters.
Production/Demand
At peak Zimbabwe produces 236Kt of tobacco primarily for export (+96%). Current
production level are estimated at 175Kt, however production is forecasted to
increase as a result of an increasing number of farmers growing tobacco at the
expense of other less profitable agricultural products.
Tariffs/charges
Rate for tobacco on transported to Maputo on rail wagons is USD104.18t.
Route options
Key export markets include Belgium, China and South Africa. Tobacco is
containerised exported primarily through Beira and Durban. Both rail and road
transport is used along the Durban route, however road transport is used to Beira.
29
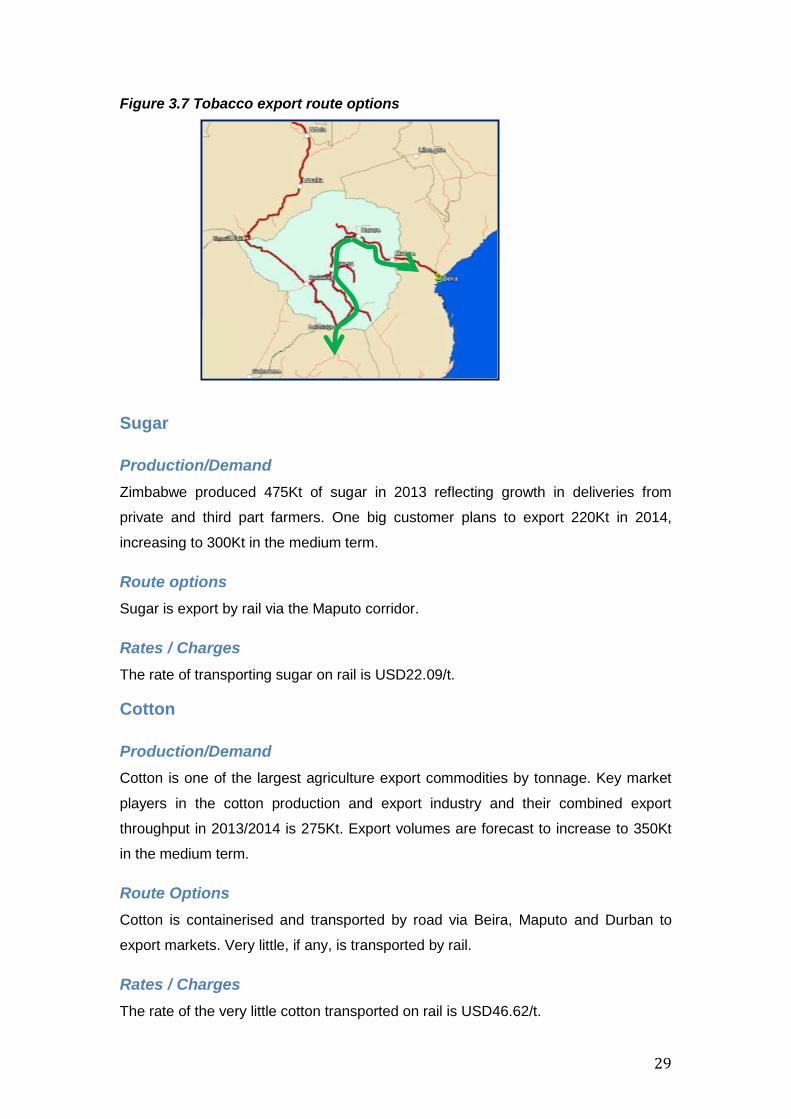
Figure 3.7 Tobacco export route options
Sugar
Production/Demand
Zimbabwe produced 475Kt of sugar in 2013 reflecting growth in deliveries from
private and third part farmers. One big customer plans to export 220Kt in 2014,
increasing to 300Kt in the medium term.
Route options
Sugar is export by rail via the Maputo corridor.
Rates / Charges
The rate of transporting sugar on rail is USD22.09/t.
Cotton
Production/Demand
Cotton is one of the largest agriculture export commodities by tonnage. Key market
players in the cotton production and export industry and their combined export
throughput in 2013/2014 is 275Kt. Export volumes are forecast to increase to 350Kt
in the medium term.
Route Options
Cotton is containerised and transported by road via Beira, Maputo and Durban to
export markets. Very little, if any, is transported by rail.
Rates / Charges
The rate of the very little cotton transported on rail is USD46.62/t.

Rail Services from A Customer’s & Railway Operator Perspective
30
Figure 3.8 Cotton export route options
Rail Road rates/charges per tonne for Zimbabwe key commodities
The rail and road through rates/charges for transportation of the abovementioned
commodities in the Zimbabwean market are illustrated in the table below.

31
Table 3.3; Profile of Zimbabwe’s key import and export commodities
Commodity Handling Rail / Road
Tonnage (Current)
Export / Import
Tonnage (Forecast)
Port Origin / Destination
Sugar bulk Rail 220,000 Rail 100
300,000 Maputo EU
Cotton Lint container Road 274,000 Road 100
350,000 Beira/Maputo China
Chrome Bulk Rail 90,000 Rail 100
120,000 Maputo China
Tobacco container Road 2,400 export 4,000 Durban EU
Tobacco container road 2,400 export 4,000 Beira China
Tobacco container rail/road 5,000 export 50/50
10,000 Durban EU
Wheat Bulk rail /road 60,000 import 80/20
100,000 Beira Germany / Russia
Maize Bulk rail/road 2,000,000
import 50/50
Zambia/South Africa
Sulphur Bulk rail 12,000 import 50/50
Durban
sulphuric acid
tankcars rail/road 12,700 import 70/30
RSA
Bauxite Bulk road 5,400 import70/30 Mozambique
Phosphate rock
Bulk rail/road 32,000 local 90/10 Nyazura
Gypsum Bulk rail/road 10,000 local/ export30/70
Harare
A/Nitrate Bulk rail 50,000 import 30/70
Beira/Durban
Ammonia tankcars rail/road 5,000 import 50/50
RSA
MOP Bulk rail/road 4,000 import 50/50
Beira India / China
SOP Bulk rail/road 4,000 import Beira India / China
MOP Bulk rail/road 4,000 import Beira India / China
SOP Bulk rail/road 4,000 import Beira India / China
Rice Bulk rail/road import Beira Vietnam / Pakistan
Fertilizer Bulk rail 30,000 import Durban RSA
Granite Bulk rail export 15 wagons /
week
Beira Italy
Containers TEU Rail/Road 6000 Beira/Durban
Bulk Pipeline Import/local Beira/Chiredzi Noczim except direct
imports by Engen

Rail Services from A Customer’s & Railway Operator Perspective
32
Table 3.4 Rail/road rates per commodity per corridor of Zimbabwe key
commodities
Rail freight price differentials The table 3.5 below illustrates rail freight price differentials that usually influence a
client's choice of route to the port. The commodity applied is 40' ISO containers used
in general international traffic. Whichever way one looks at it, NRZ charges appear to
be on the pricy side. The sea freight charges are based on the average of leading
shipping lines. On the sea freight charges Beira is expensive but on the overall its is
cheaper.
Table 3.5 Cost of containerized cargo per RA
Corridor Commodity Rail $ Road $
Limpopo Ferrochrome 28.05t
Chrome ore 33.57t
Sugar 22.09t
Fertilizer 44.65t
Beira Granite 54.44t
Tobacco in wagons 104.18t
Cotton 46.62t
Fuel 61.07t
Beira Wheat 46.88t
Beira/Limpopo Containers (light) 6m 800.40 pteu
Containers (light 12m 1648.80 pteu
Containers (Heavy) 6m 1526.00 pteu
Containers (Heavy) 12m 1832 pteu
Grain 56.82t
Destination Details Port NRZ Cost
CFM Cost
TFR Cost
Sea Freight
Total Cost
NRZ Cost (%)
NRZ Cost as % of Beira Route
CFM Cost (%)
TFR Cost (%)
Harare - Ningbo (China) Durban $1,832 $1,820 $460.00 $4,112 44.55 69.03 44.26
Harare - Ningbo (China) Beira $624 $930 $1,100 $2,654 23.51 23.51 35.04
Harare - Ningbo (China) Maputo $1,648 $1,108 $460 $3,216 51.24 62.09 34.45
Harare - Shanghai (China) Durban $1,832 $1,820 $460 $4,112 44.55 69.03 44.26
Harare - Shanghai (China) Beira $624 $930 $1,100 $2,654 23.51 23.51 35.04
Harare - Shanghai (China) Maputo $1,648 $1,108 $460 $3,216 51.24 62.09 34.45
Harare - Xingang (China) Durban $1,832 $1,820 $460 $4,112 44.55 67.75 44.26
Harare - Xingang (China) Beira $624 $930 $1,150 $2,704. 23.08 23.08 34.39
Harare - Xingang (China) Maputo $1,648 $1,108 $520 $3,276 50.31 60.95 33.82

33
Botswana
Production/Demand
Botswana has one of the largest untapped coal reserves in the world mainly in the
south east of the country estimated at over 212 billion tonnes, 77% of which is
speculative. There is potential to become a significant coal producer with an export
industry of at least 36Mtpa, growing to as much as 115Mtpa.
Figure 3.9 Botswana coal production – Planned (left) and Speculative (right)
Morupule Colliery is Botswana‟s only operational coalmine however a number of
projects are in various stages of development including the Mmamabula with an
anticipated throughput of 16Mtpa. In 2012 Botswana started exporting Grade A
washed coal to the SADC region (South Africa, Zimbabwe and Namibia)
Tariffs and charges
Transportation costs account for a substantial share of the delivered price of coal and
in some instances up to 70%.
Route Options
A variety of route options have been proposed as export corridors for Botswana coal,
and these range from expansion projects using existing infrastructure (Transnet coal-
line extension and capacity enhancement) to new infrastructure projects that include
the Trans-Kalahari rail line to Walvis Bay and a new railway line to a purpose built
deep-sea port at Techobanine, Mozambique. More recently the development of a
new port at Chongoene, Mozambique, together with proposed upgrades of the
Limpopo corridor have also been sighted as a potential options for export coal from
Botswana.
36Mt
115Mt

Rail Services from A Customer’s & Railway Operator Perspective
34
In November 2012 a trial run was conducted in partnership with African Energy,
Morupule Coal Mine, Grindrod Mozambique Limitada and Vitol Coal South Africa,
proving the feasibility of transporting 1300t of coal from Morupule, through Zimbabwe
to the Maputo Coal Terminal.

35
Mozambique
Mozambique‟s geostrategic location along southern Africa‟s astern coastline has
growing benefits to the region in light of increased trade with Asian markets. The port
of Maputo is Mozambique‟s largest port and benefits from being the closest port to
the Gauteng industrial hub as well as the Mpumalanga and Limpopo mining and
agricultural regions. It compliments South Africa‟s ports in accommodating regional
demand. Port operations include dry, bulk, containers, break bulk , liquid bulk and
ship repair services. Development plans are being driven by growth in both container
and dry bulk volumes. Growth is however contingent on the development of rail
logistics solutions to meet freight demand.
Figure 3.10 Port of Maputo Aerial view
The Port of Beira is Mozambique‟s second largest port plays a key role as a regional
transit port with the multi-modal Beira corridor servicing Zambia, Zimbabwe, Malawi
and the DRC. Operations include containers, break bulk cargo and liquid bulk.
Developments include establishing a new coal terminal to accommodate an increase
in coal exports from the Tete province. The port is an estuarial port with draft and
navigational restriction that necessitate regular dredging. Cornelder de Mocambique
– a joint venture between CFM and Cornelder holdings, manages Port operations.
Rail Services from A Customer’s & Railway Operator Perspective
36
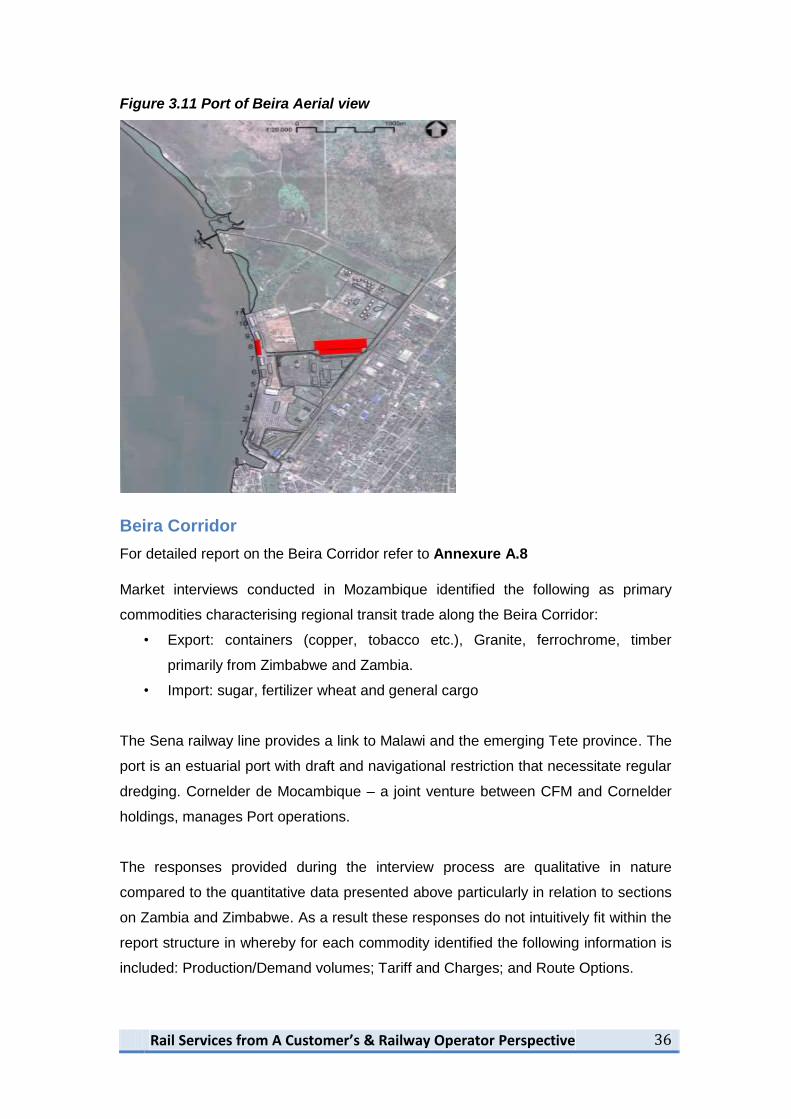
Figure 3.11 Port of Beira Aerial view
Beira Corridor
For detailed report on the Beira Corridor refer to Annexure A.8
Market interviews conducted in Mozambique identified the following as primary
commodities characterising regional transit trade along the Beira Corridor:
• Export: containers (copper, tobacco etc.), Granite, ferrochrome, timber
primarily from Zimbabwe and Zambia.
• Import: sugar, fertilizer wheat and general cargo
The Sena railway line provides a link to Malawi and the emerging Tete province. The
port is an estuarial port with draft and navigational restriction that necessitate regular
dredging. Cornelder de Mocambique – a joint venture between CFM and Cornelder
holdings, manages Port operations.
The responses provided during the interview process are qualitative in nature
compared to the quantitative data presented above particularly in relation to sections
on Zambia and Zimbabwe. As a result these responses do not intuitively fit within the
report structure in whereby for each commodity identified the following information is
included: Production/Demand volumes; Tariff and Charges; and Route Options.
37
Key findings show disparity in modal split for outbound (export) and inbound (import)
traffic. The swing is significant with export dominated by road in some instances
(90%:10%) and imports dominated by rail (85%:15%). This is not uniform across all
organisations interviewed however it highlights the need for a larger comprehensive
sample size to better characterise the nature of modal split along the Beira corridor.
Key customer considerations affecting modal choice include the ability to meet
shipping targets and although tariffs are considered to be cheaper in some instances,
the rail service responsiveness (transit times) are not competitive in relation to road
haulage. Other key constraints attributed to the loss in rail market share include the
absence of real-time tracking leading to poor communication with clients and
stakeholders, In addition inadequate rolling stock and the lack of sufficient shunting
locomotives at the port is noted as an inevitable cause to delays in port related
operations.
The Port of Beira was historically designed for rail traffic and as such is not optimally
suited for the current influx in road freight. Operationally there is an overwhelming
preference for rail as a primary mode of transport servicing both inbound and
outbound freight at the port. The port however undergoing expansion and there is an
opportunity to strategically align hinterland rail development to optimise integration
with port infrastructure. This would facilitate the development of holistic integrated
logistics systems better suited to meet client needs.
Ressano Garcia (Maputo) Corridor
Market interviews identified the following primary commodities characterising
regional transit trade along the Maputo Corridor:
• Export: containers (copper, tobacco etc.), Granite, ferrochrome, timber
primarily from Zimbabwe and Zambia.
• Import: sugar, fertilizer wheat and general cargo
The Maputo corridor connects South Africa‟s Gauteng Province to Mozambique‟s
port of Maputo, and provides an alternative trade route for South Africa‟s
Mpumalanga and Limpopo provinces. Coinciding infrastructure developments
including the upgrade of the port of Maputo and development of the N4 highway from
Pretoria to the Mozambican border at Lebombo – Ressano Garcia have enhanced
the competitiveness of this particular trade route both in terms of freight cost and
transit time.
Rail Services from A Customer’s & Railway Operator Perspective
38
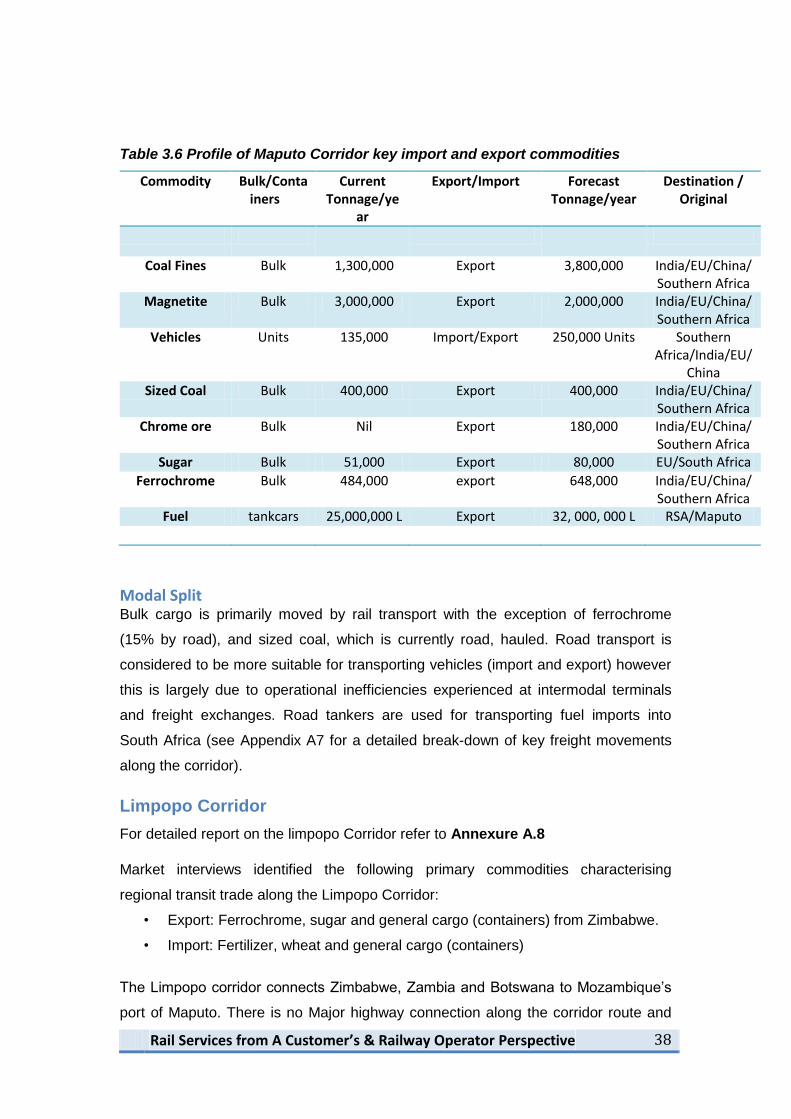
Table 3.6 Profile of Maputo Corridor key import and export commodities
Commodity Bulk/Containers
Current Tonnage/ye
ar
Export/Import Forecast Tonnage/year
Destination / Original
Coal Fines Bulk 1,300,000 Export 3,800,000 India/EU/China/Southern Africa
Magnetite Bulk 3,000,000 Export 2,000,000 India/EU/China/Southern Africa
Vehicles Units 135,000 Import/Export 250,000 Units Southern Africa/India/EU/
China Sized Coal Bulk 400,000 Export 400,000 India/EU/China/
Southern Africa Chrome ore Bulk Nil Export 180,000 India/EU/China/
Southern Africa Sugar Bulk 51,000 Export 80,000 EU/South Africa
Ferrochrome Bulk 484,000 export 648,000 India/EU/China/Southern Africa
Fuel tankcars 25,000,000 L Export 32, 000, 000 L RSA/Maputo
Modal Split Bulk cargo is primarily moved by rail transport with the exception of ferrochrome
(15% by road), and sized coal, which is currently road, hauled. Road transport is
considered to be more suitable for transporting vehicles (import and export) however
this is largely due to operational inefficiencies experienced at intermodal terminals
and freight exchanges. Road tankers are used for transporting fuel imports into
South Africa (see Appendix A7 for a detailed break-down of key freight movements
along the corridor).
Limpopo Corridor
For detailed report on the limpopo Corridor refer to Annexure A.8
Market interviews identified the following primary commodities characterising
regional transit trade along the Limpopo Corridor:
• Export: Ferrochrome, sugar and general cargo (containers) from Zimbabwe.
• Import: Fertilizer, wheat and general cargo (containers)
The Limpopo corridor connects Zimbabwe, Zambia and Botswana to Mozambique‟s
port of Maputo. There is no Major highway connection along the corridor route and

39
as such all cargo traffic opts for rail as their sole mode of transport (see Annexure A7
for a detailed break-down of key freight movements along the corridor).
Table 3.7 Profile of Limpopo Corridor key import and export commodities
Commodity Bulk/Containers
Current Tonnage/year
Export/Import
Forecast Tonnage/year
Destination / Original
ferrochrome bulk 121,000 export 162,000 EU/China/Zimbabwe
sugar bulk 226,000 Export 280,000 EU/Zimbabwe
Wheat bulk 55,000 import 60,000 EU/Brasil/China/Zimbabwe
Fertiliser bulk 10,300 Import 60,000
General containers 132 Units Import/export
200 Units Zimbabwe/EU/China
General containers - import 500 Units Zimbabwe/EU/China
Fuel tankcars 120,000,000 L Import 170,000,000 L Zimbabwe/Botswana/Middle East

Rail Services from A Customer’s & Railway Operator Perspective
40
South Africa
Market interviews conducted in South Africa identified the following as primary
commodities characterising regional transit trade: containers, fuel, sulphur, fertilizer
and general cargo.
For detailed report on the South Africa market refer to Annexure A.9
The Port of Durban is the dominant gateway port for interregional trade, servicing
Botswana, Zambia, Zimbabwe, Malawi, Mozambique and the DRC.
Figure 3.12 Port of Durban Aerial view
The responses provided during the interview process are qualitative in nature
compared to the quantitative data presented above particularly in relation to sections
on Zambia and Zimbabwe. As a result these responses do not intuitively fit within the
report structure in whereby for each commodity identified the following information is
included: Production/Demand volumes; Tariff and Charges; and Route Options.
Key findings support the view that road transport is increasingly the mode of choice –
75:25 modal split indicatively in favour of road. In South Africa the decline of rail
market share is largely attributed to inefficiencies attributed to Transnet‟s monopoly
position coupled with high tariffs and capacity constraints. Although the legacy rail
network is well integrated with port infrastructure and industrial clusters, there is a
perception among customers that rail services and proposed future investments are
primarily geared towards bulk industries (mining) characterised by large clients with
significant bargaining power and regular freight loads. Against this backdrop road

41
services are considered to be more flexible and better suited to meet a wider variety
of transport needs.
Transnet identifies some inefficiency within its operations however internally the
decline in market share is largely attributed to capacity constraints forcing freight to
road. As such Transnet‟s strategy to reverse modal shift involves investment in
rolling stock to increase rail availability coupled with a corridor-based approach with
multimodal terminals providing an interface between road and rail.

5.3 Analysis of Customer responses to questionnaires
The analysis below was based on the responses from the customer service
questionnaire distributed by the railway operators to their top 5 customers The
detailed analysis report is attached as Annexure A.10. Included in the report is the
current market share and traffic projection for the next 4 years.
Resources available for the current traffic
Most customers did not indicate the resources they require from railways to move the
current traffic but indicated that their demands were not met when required. The
customers also indicated that railways do not supply the type of wagons required for
specific commodity. Railways were considered inefficient even when service
agreements were signed. Trucks were considered to be always available and
flexible.
Rating of Rail Services
Unavailability of rail resources when required left customers with no choice but to opt
for road. Most customers highlighted long transit times that negatively affected the
whole supply chain. The train schedules in terms of exports were indicated as not
synchronized with shipping times and the tariffs were considered to be high.
Furthermore rail services were considered to be inflexible. It was highlighted that rail
service costing did not include road services at terminal and the sea freight leg for
overseas shipment.
Road is considered to offer a one stop shop, hence it was faster, more predictable
and flexible. While railway logistics were theoretically the mode of choice in terms of
seamless services across borders, bulk movement and safety, reality on the ground
was different because of poor transit times. Of specific concern was customer care
where rail personnel were considered to lack knowledge of the whole supply chain
logistics and customer queries were not attended timely and adequately.

43
Determinants of mode of choice
The customers indicated that their choice of transport mode is influenced by transit
times, predictability, flexibility and arrival of cargo at the port in time for shipment.
Other factors that the customers consider choosing the traffic export route are;
Main determinant factor is the cost effectiveness of the route i.e. from
production (source) to consumption (market destination)
The capacity of the port in terms of handling equipment, berthing constraints,
shipping lines‟ choice of port of call.
Existence or otherwise of non-physical barriers at the ports e.g. cumbersome
documentation, rigid working hours, and the attitude of customs officials when
processing export documentation e.g. non weekend working, delays in
document processing, customs delays at certain ports.
Shortest geographical route: to port and to market destination
Port capacity both in terms of cargo handling and calling vessels.
Customer relationship
Customer care from railways as a service provider is below standard. The following
were highlighted: bureaucracy, poor customer care in terms of communication skills,
professionalism of marketing personal, lack of appreciation and knowledge of total
logistics solutions. Customers complained that railways do not consider their
preferred type of rolling stock as they end up supplied with the alternative. These
points were not only mentioned but were emphasized by all customers.
Summary of Findings: Salient point from customer views
The following conclusions consist of a summary of the above corridor findings:
• SARA member organizations share common resources within defined
corridors: Rail and road network systems connecting to common regional
ports. Therefore there should be no perceived competition, instead there is
co-opetition (collaboration and competition), because they all serve the same
purpose to facilitate inter-regional and international trade;
• Most customers are using road more than rail out of necessity because of
poor service provision and operation performance. The majority of key
customers interviewed in both Zambia and Zimbabwe support this;
• Poor performance by the railways is the root cause for the loss of market
share, rather than the lack of cargo to move on rail. As a result of years of lost
customer confidence, it is not guaranteed that even if the railways were to
make good their hot buttons or hot spots, cargo will come on rail;

Rail Services from A Customer’s & Railway Operator Perspective
44
• Railway operations and services are inconsistent, are based on “hit or miss”
strategies;
o Lack of timeous provision of appropriate wagons and locomotive
power on demand;
o Long transit times taken from point A to point B, regardless of distance
travelled
• A dearth of “one stop shop” and seamless service, and customer are forced
to deal with different and non-collaborating entities. There is no single
“authority” to provide customers with what they need;
• Some railways senior executives are never visible to their customers, leaving
the burden to their middle –to- lower level managers to “deal with it”, yet most
of these managers are not empowered to make on the spot decisions, e.g. To
the contrary, on the customer‟s side decisions are made at the point of
contact, be it lower, middle or top management;
• Lack of collaboration with customers who have rail infrastructure sites or
depots and rail friendly cargo to consolidate consignments into block trains,
which would avoid the necessity of breaking trains in sections throughout the
route. This results in customer cargo getting delayed and /or lost in transit;
• Lack of cargo real-time tracking systems to ensure customers are
continuously and consistently informed of the whereabouts of their cargo
while en-route from origin to destination. Most customers feel that once their
cargo is handed over to the railways, it goes “ into a black box”; which is not
the case with road transport operators;
• Railway services are characterised by high rates and demurrage charges,
both of which have the negative impact of “pushing” clients and their cargo to
road;
• Failure by the railways to set own minimum service standards which they
should adhere to;
Additional evaluation of customer perception
Due to lack of information from the two groups (railway operators and customers),
the Optimization Committee found it necessary to source additional data for a
consistent analysis and, further for trustable recommendations. Table 4.1 below
consolidates these findings expressed by customer when presented with a series of
questions related to the performance of regional rail services. Appendix A.4 & A.5
provide detailed findings captured from interviews with clients.

45
The table further highlights key themes influencing logistics strategies for a range of
industries and commodity classes. Although performances across different routes
and corridors differ, what is clear is the widespread dissatisfaction with rail services.
Table 4.1 Aggregate evaluation of railway service provision
Service related questions Client Perception
i. Factors driving decline
in rail market share
Service reliability
o Inconsistency of service
Service quality
o Loss of skills in key managerial and service position
o Minimal consideration for client service requirements
o Limited and out-dated market intelligence
o Poorly aligned services relative to market demands
o Freight rates are not commensurate with service provided
Competition through substitution
o Road haulage is a close substitute to rail
o Multiple players and intense competition in the trucking
industry
Service efficiency and time responsiveness
o Long and unpredictable transit times
o Poor operational performance
Lack of investment
o Poorly maintained aging infrastructure
o Deplete rolling stock (locomotives and wagons)
Collapsed signalling systems
ii. Key determinants in
route selection
Competitive pricing and cost effectiveness
o Aggregate logistics costs (Origin–destination)
Distance (shortest route) and transit time
Maritime services
o Port connectivity
o Frequency of shipping calls
o Shipping lines
Port capacity and handling capabilities
o Availability of handling equipment

Rail Services from A Customer’s & Railway Operator Perspective
46
Service related questions Client Perception
o Navigation and berthing constraints
Operational inefficiencies
o Onerous and cumbersome processes and documentation
o Customs and trade facilitation
o Restrictions on working hours
o Document processing delays
iii. Customer appetite to
consider rail as mode of
choice once short-
comings have been
addressed
Complete loss of confidence in rail operations
Evidence of a sustainable recovery strategy
Requirement for improved marketing and commercial
understanding
iv. Changes required to
attract customers to use
rail
Cultural change and revamped operational strategies
o Client focus
o Appropriate resources geared towards meeting client needs
Value added services
o Facilitate one-stop-shop pricing strategy
o Contiguous rail operational authority
Investment in infrastructure and services
o Infrastructure rehabilitation and modernisation
o Modernisation of rolling stock
Operational improvement
o Improvement in transit time and wagon turn-around times
o Service flexibility
Consideration of strategic partnerships with other stakeholders
(e.g. private terminal providers, clearing agents, funding
agencies)
5.4 Analysis of responses from Railway Operators per corridor
The rail operator analysis was based on the responses to the questionnaire
distributed by the Committee (Annexure A.3). Responses to the railway operator
questionnaire were received from nine of the ten RAs. The detailed report is attached
as Annexure 6. The following was highlighted.

47
Beira
Commodities on the corridor are granite, fertilizer, grain, tobacco and containers
among others.
Beitbridge
Commodities on this corridor are containerised general cargo, copper, sulphur,
fertilizer, grain, sugar and Fuel.
Dar es Salaam
Commodities on this corridor are copper, sulphur, fertilizer, diesel and steel.
Goba
Main Commodities are hematite and sugar
Limpopo
Commodities are raw sugar, diesel, ferro-chrome, wheat, anhydrous ammonia.
Namibian
Commodities on this corridor are Containerised cargo, maize and Ammonium nitrate.
Plumtree
Main commodities carried are fuel, salt, soda ash, containerised cargo and coal.
Ressano Garcia
Main commodities on Ressano Garcia are magnetite, coal, containerised cargo, rock
phosphate, maize and fertilizer.
Richards Bay
Coal is the main commodity on this corridor.
Nacala
Main commodities carried are fertilizer, containers and tobacco.
The railways acknowledged that some of the following; aging rolling stock, bad track
condition, poor signalling and telecommunication, security and vandalism of railway
equipment affect their service delivery. These contribute to increased time at
interchange and the total transit time. Most RAs do not have service level
agreements with their customers. Most railways in the region are operating=< 25% of
their line capacity. Collaboration with road is at minimal level except where there is
Rail Services from A Customer’s & Railway Operator Perspective
48
consolidation of traffic especially in Zambia for DRC traffic. Very few CMGs are
functional thereby affecting the seamless service to be offered along corridors. The
railways hardly use the backhaul strategy that road utilises to get more business at
very low rates. The railways incur more cost of hauling empty wagons hence the
passing own of this cost to customers resulting in uncompetitive rates on the loaded
direction.
5.5 Outcome of the research findings in relation to the shortest route Principle The findings of this research clearly confirm the observation that traffic is available
and customers are willing to move their cargo predominantly by rail provided service
standards and landed cost to market are competitive. This is supported by the
verbatim evidence of large volume of exports but it is clearly an imperative given that
Regional exports still consist of semi-processed mining and agricultural products.
Volume growth in bulk commodities such as coal, copper, Ferro chrome, sugar and
tobacco, to name a few, and their increasing demand on the international market
point to the inevitability of pressure on rail to put its act together and reform.
This is underscored by the heavy rail-based investments in new corridors, supported
by international finance, witnessed in recent years. These new corridors namely the
Lobito, Trans-Kalahari and the Nacala corridors are projects spearheaded under
SADC and also on bilateral country trade agreements.
It is against this background there is widespread acknowledgement of the high cost
to the society of road transport resulting in direct fiscal pressures for road repairs and
maintenance, and the indirect cost due to road carnages and environmental damage.
The outcome from the findings is that SARA members will be under increasing
pressure from their government and industry to become relevant and play their
central role in serving the region at the right cost and at competitive service levels.

49
6. RE-IMAGING RAIL SERVICE DELIVERY
Client focused service delivery strategy
The inability to put the clients needs at the focus of rail service strategies is glaring in
its omission, and this is widely echoed throughout the study findings. More
importantly framing the competitive dynamics of regional surface transport as simply
a modal choice between road and rail, fails to recognise the complexity of optimising
service delivery around complex supply chains with often conflicting logistics
requirements. A closer look at key client considerations uncovers a different view,
which is not limited to modal choice but rather emphasises the logistics challenges
characterised by a variety of determinants including:
Service reliability
Time sensitivity
Cost efficiency
Operational flexibility
Security
Client focused service delivery affords a holistic view aimed at meeting a customer
requirements. This ensures that the rail service offering is aligned with market needs,
and is designed to meet, not dictate stakeholder expectations.
Figure 6.1 Client focus – Client logistics requirements analysis
The adoption of a holistic client focused view translates into inherently different
approaches to service delivery, ensuring critical and desired performance objectives
are defined. Figure 5.1 illustrates a process aimed at putting client requirements at
the centre of service design within a railway context. Critically the process identifies
Client Requirements Analysis
Requirements Capture Stakeholder Objectives
Definition of Capability Requirement
Client & Stakeholder Engagement
Market Intelligence
Strategic Demand Analysis & Forecasting
Logistics Capability Requirement Baseline
Rail Service Concept of Operation

Rail Services from A Customer’s & Railway Operator Perspective
50
key input characteristics driving demand, and this is paramount in building a baseline
of smart market information and data on which to base service and operational
parameters.
Supply chain systems view
The dominance of road haulage in comparison to rail is not limited to southern Africa.
Developed countries similarly rely extensively on road transport as the primary
means of transporting freight (70% of US freight is road hauled) however broader
integration of different transport modes (road, rail rivers and canals) leverages the
attributes of each modal option, to provide efficient and effective integrated transport
systems.
Figure 2.2 in Section 2 illustrates difference in road and rail network density when
considered as stand-alone solutions. Transport density overall is enhanced when the
two modes are viewed in tandem. Multi-modal concepts however leverage the
competitive advantages of each mode – rails long-haul economics and roads
versatility and point-to-point connectivity – providing optimised transportation and
logistics solutions for regional supply chains. Cooperative competition fostered along
multimodal corridors has clear benefits including improved coordination and planning
between modes, enabling the improved optimisation of infrastructure and capacity.
Services are therefore delivered on a best-fit principle without cannibalising market
share at the expense of a particular mode or route.
Alternative logistics strategies enabling multi-modal coordination
Transport integration can be accelerated through the development of an integrated
regional system of multi-modal logistics hubs that provide interfaces for consolidation
and distribution of freight. The attraction of these facilities can be further enhanced
by the provision of value added logistics services such as integrated customs
processing and clearance, as well as access to third party logistics providers (3PLs).
A hybrid approach involving the development of de-centralised logistics hubs
servicing regional economic centres connected through prioritised dedicated multi-
modal economic corridors, would go a long way towards transforming the competitive
fortunes of railway services. Larger centralised terminals with regional coverage,
optimised for regional distribution, could further enhance logistics. On the surface
these may appear radical however freight villages and inland port networks facilitated

51
through private and public partnerships, have transformed supply chains in various
economies and rail services play a pivotal role.
Logistics hubs are traditionally anchored to a maritime port via a dedicated high
capacity transport corridor, extending the ports reach inland. This leverages one of
the key competitive advantages of railway transport i.e the ability to rapidly discharge
cargo from the port precinct alleviating congestion caused by road trucks.
Consequently the development of inland logistics hubs pushes railways to the
forefront, providing high capacity dedicated links between regional ports and inland
hubs and terminals.
Figure 6.2 Alternative Freight distribution concepts
The benefits of developing logistics hubs include:
Reduced congestion at ports through dedicated connections to inland
consolidation and distribution areas;
Trade facilitation through strategic investment in multi-modal transport
assets;
Economies of scale through centralised consolidation and distribution;
Port Inland area
Port
Transport corridor
Inland corridor
Captive hinterland

Rail Services from A Customer’s & Railway Operator Perspective
52
Promotion of value added services; and
Platform for Integrating and optimising maritime and inland freight transport
systems.
Figure 6.3 Conceptual view of logistics hubs in southern Africa
There is a strategic opportunity for SARA to be actively involved in outlining a holistic
development framework through private and public engagement, leading to the
development of a regional system of logistics hubs that strategically optimises the
role played by rail service providers in domestic and regional transit freight
movement. Integration with highway infrastructure at logistics hubs and terminals will
encourage the utilisation of trucks for inbound logistics, as well as distribution to
dispersed locations over shorter distances. This leverages the competitive
advantages offered by both road and rail services. Figure 5.3 conceptually illustrates
a regional network of logistics hubs linked to port systems on the eastern and
western coastline. Logistics hubs would also encourage consolidation of cargo
providing scale economies while simultaneously allowing the running of optimum
block trains between key nodes in the system.
Functional specialisation There is scope for freight specialisation targeting specific key clients seeking to
transport rail friendly commodities with customised services that leverage the
competitive advantages of railways. This may effectively simplify rail operator‟s
services allowing then to achieve consistency and higher levels of customer
satisfaction. Service differentiation also discourages customers from making decision
Maputo
Harare
Lilongwe Lusa
ka
Gaborone
Johannesburg
Victoria
Falls
Ndola
Beira

53
purely on the basis of cost. The dominance of the north-south corridor is largely
driven by Durban‟s shipping connectivity, allowing the hinterland corridor to remain
competitive regardless of the long surface distance. Transnet‟s coal (Ermelo-
Richards Bay) and iron-ore (Sishen-Saldanha) lines offer specialised services
optimised for specific commodities and as such are able to provide clients with a
distinct service offering.
Implementation of the SARA Marketing Policy
There is need to revisit the SARA Marketing Policy with emphasises on item 2 and 3
as these could be one of the reasons for perceived loss of market share to road. The
revenue sharing section in the Policy is silent on asset owner. Customers are not
given the right to alternative route option resulting in customers opting for road
transport.
7. CONCLUSION AND RECOMMENDATIONS
Conclusion
During interviews the customers were asking the following questions;
i. Who is SARA, what does is stands for and since it was established, what has
it accomplished to help RAs to maintain, retain or increase their market
share? Unless SARA is there for the purpose of “Holding meetings about
meetings”
ii. What has the railways to offer to show to customers why they should shift
from road to rail
iii. With current capacity and resources the railways are failing to efficiently move
the traffic offered to them
Therefore answering of the abovementioned questions would assist RAs in identify
their shortcomings in providing railway services to their customers.
Service availability and reliability enable businesses to strategize, plan and optimise
logistic supply chains thereby enabling businesses to eke out greater efficiencies
resulting in reducing waiting times, and limited storage and inventory costs. There is
a concerted view that efficient planning would dramatically improve regional rail
services, facilitating responsive service provision that considers market demand,
client production cycles, and seasonality. Most customer experiences portray railway
service providers as dismissive and inadequately engaged with the market at both
strategic and operational levels. Customer needs are poorly understood and
consequently services provided do not competitively respond to the logistics
challenges. Customers consider railways as focusing only on transportation instead
of providing total logistics solution.
The lack of investment in core infrastructure both in terms of maintenance and
modernisation, disincentives private sector investment in rail friendly consolidation
and distribution facilities. Similarly the absence of service level agreements that
contractually stipulate acceptable service levels, and mechanisms for recourse in the
event of breach does not instil confidence leaving customers exposed to bearing the
costs of delays and inefficiencies. Overall customers expressed the need for a
55
systemic review of rail strategies, coupled with concerted and deliberate market
engagement, allowing service providers to better position rail services in a dynamic
market.
Rail trials demonstrating transit time and service capabilities have been conducted
aimed at courting market interest, however this has not been supported by broader
transformative actions by rail service providers. As a result customers have
reservations about the sustainability of touted benefits. There are no guarantees to a
swift change in market perception and customers continue to prefer service levels
provided by road hauliers. Customers however do recognise the need for robust
alternative surface transport to road dominance and this presents unanticipated
avenue for the rail sector to strategically re-invent itself and align with regional
logistics supply chain needs. Greater competition from rail would also stimulate multi-
modal transport integration and service innovation, enabling regional products and
services to competitively reach global markets.
Customers are highly concerned with the level of contact and professionalism of
railway personnel. This is evidenced by the lack of visibility of rail executive
management in interaction with customers. Railways are said to have nothing to offer
in terms of customer service, except high rates and demurrage charges, both of
which have the negative impact of “pushing” clients and their cargo to road.Failure by
the railways to set own minimum service standards they can adhere tom.There are
customers who are rail friendly but are always let down by the railway authorities
themselves. As a result these customers take their business to road, because in their
justified opinion, the railways are their own enemies, as they “ throw” away business
to the competition, resulting in perceived loss of market share
Some railways senior executives are never visible to their customers, leaving the
burden to their middle –to- lower level managers to “deal with it”, yet most of these
managers are not empowered to make on the spot decisions, e.g. if a customer asks
for a special or negotiated rate for definite and sizable rail friendly commodity, this
has to be decided by some member or members of EXCO, which takes time to give
the necessary feedback to the client to enable informed decisions to be made. To the
contrary, on the customer‟s side decisions are made at the point of contact, be it
lower, middle or top management.

Rail Services from A Customer’s & Railway Operator Perspective
56
Lack of cargo real-time tracking systems to ensure customers are continuously and
consistently informed of the whereabouts of their cargo while en-route from origin to
destination. Most customers feel that once their cargo is handed over to the railways,
it goes “into a black box”; which is not the case with road transport operators
Recommendations
The recommendations below are based on organizational strategy, for competitive
advantage and define organizational strategy as the process by which organization
leverage their valuable resources towards the right activities to achieve competitive
advantage, improve performance and create value within a competitive environment.
Based on the views and opinions gleaned from most customers on the ground, the
following minimum suggestions are recommended:
1. Value Addition i. In order to attract and retain reasonable market share of rail friendly
cargo, there is need for a change of mind set and/or paradigm shift, in Rail authorities‟ approach to doing business, by avoiding being an extension of the government, and start running their business on the basis of the value preposition where performance is measured in terms of unique service offering, cost effectiveness, efficiency, customer satisfaction etc which will impact on overall business improvement and the bottom line.
2. Improving rail competitiveness i. With the resources currently available, and in order to provide
meaningful service to customers, and improve competitiveness in order to attract back to rail some lost clients, railways should set minimum service standards which they must adhere to, such as:
• Resource allocation, transit time, and other services that guarantee the quality of the output
• Each customer‟s consignment should be treated as a project and must be implemented according to:
• Agreed scope • Schedule and deliverables with gate reviews • Budget (within cost) • Quality of delivery within constrains
ii. It should be remembered that, if the minimum service standard is not met then market confidence is lost
3. Culture of Service Excellence
i. Take ownership – avoid excuses and culture of blame. ii. Ratify all initiatives and policies and procedures agreed upon iii. Joint market of services in a corridor by targeting major customers
with rail friendly in a corridor to build and instil customer confident iv. Adopt and implement the commercial information management
system developed by SARA v. Consider customer consultative forums at organisational and/or
corridor level
4. Regaining of the lost market share

57
Option 1 Establishment of a company to manage international traffic
i. It is proposed that a structure to manage international traffic be established under SARA‟s strategic guidance. The advantage of such a set up would be to encourage the Railways to act together as opposed to competing with each other.
ii. For such a structure to be able to compete effectively to regain traffic lost to road it must, of necessity, be able to focus and respond to market needs in terms of cost and service levels on one-stop-shop basis, with minimum bureaucracy at a profit (a market driven organisation).
iii. Formation of a company or a Business Development Unit (BDU) under the Board or Secretariat to handle all international cargo and to which all SARA members have a shareholding; the basis of which can be determined as a separate exercise
iv. Such a company of BDU would operate on performance-basis through working agreements with member railways, leased resources i.e. equipment, facilities and operating personnel to avoid duplication of investment.
v. Return to members will be a dividend to shareholders regardless of which route traffic is directed.
Option 2 Establishment of an Inter Railway Business Unit under SARA Board or Secretariat
i. International traffic must be handled under one Unit, there must be one central coordinating center for this traffic stream. This will be a one stop shop/service. This Unit will engage each railway along the corridors and put together one commercial/transport agreement to the customer.
ii. This concept relates to other ideas about forming a company owned by all the railways and mandated to handle international traffic.
iii. The non-functional of CMGs would be addressed iv. This will foster an integrated planning approach v. Resource sharing along corridors for targeted traffic would be
strengthened
5. Route Choice i. It should be noted that customers‟ corridor route choice is determined
by the provision of a total logistics solution, based on through-corridor efficiency, and among other things i.e. resource availability, storage and handling facilities, operations capability, communication, safety and landed cost of goods (in short a seamless, efficient and cost effective service provision);
ii. Clearly the real issue that will preoccupy SARA in the medium to long term has to be one of inadequate capacity hence the need to ensure that ALL corridors are capacitated to play their meaningful role.
iii. What this means in the short term is that the organisation can ill afford to precipitate any shrinkage in capacity on some corridors through artificial conditions not based of competitive cost and quality service; all that it does is to force customers to abandon rail altogether to the detriment of exporters and, ultimately, the economies they seek to benefit.
iv. The issue of the shortest route will be affected once the new routes, (Lobito, Nacala and TransKalahari) become operational

Rail Services from A Customer’s & Railway Operator Perspective
58
v. The SARA Marketing Policy needs to be reviewed in line with the TOR of the Company or Business Unit
6. Capacity building
i. Consider offering continuous professional development programmes in marketing, customers services, communication skills, etc to key staff
ii. Identify skills shortage and offer training at Regional level iii. SARA should seek to improve dialogue with customers on
international traffic by encouraging rail authorities to engage key stakeholders/customers at their regional policy forum to hear from their clients, so as to understand their needs in advance of any strategic plans and service offering
iv. In order for the railways to attract and recapture some lost market share, they must be prepared to enter into strategic partnerships with other stakeholders like clearing agents, freight forwarders, container terminal depot operators (for consolidation of cargo), willing investors, revenue authorities; and be willing to enter into Service Level Agreements with major customers.
v. SARA and RAs to jointly lobby Governments to implement the Pemba resolution and the Brazzaville Declaration
i. It is recommended that it be based on the following service level
requirements process, as shown in Figure 7.1 below:
Figure 7.1 Service Level Requirements Process (Paulk et al, (1993); CMM
Maturity Levels)
Negotiated agreement to capture and instill
confidence of the client
Disciplined process, by establishing guidelines for
managing sustainable service offering
Standard, consistent process, by establishing a formal communicated and
documented modus operandi Set quantitative goals which
are measurable, achievable, which will help to set an
improved ability to predict sustainable performance, based on agreed cost and
schedule complianceContinuously improving process, by making the
service level offering the " standard operating
procedure", focused on overall continuous
improvement to maintain competitive advantage

59
ANNEXURE
Annexure A.1
MARKETING POLICY
1. GENERAL
1.1 Background to the policy This is a formal policy document governing the interaction between the Southern African Railways on the marketing of rail services.
1.2 Objectives of policy
The marketing policy sets out:
A common understanding and agreement on underlying marketing principles;
Ways in which marketing process should take place in order to ensure increased rail market share, competitiveness and long term viability by providing one-stop, cost effective, seamless, predictable service to users of International goods transport throughout all the railways of the SARA region and beyond.
1.3 Scope
This policy applies to the market of all international rail service, for goods and passengers traffic, consigned on more than one railway in the Southern African region and the adjacent one metre gauge rail network.
1.4 General policy, specific implement implementation
This policy is to be used: -
To review and align the marketing/commercial aspects of Business Agreements negotiated specifically between the railways.
To implement improved marketing processes within corridors.

61
2. REVENUE SHARING PRINCIPLES (APPLICABLE PER CORRIDOR ONLY)
Railways could determine railage deemed appropriate or market related on traffic destined to or traversing their railway lines. In the event where quoted rates given at the prerogative of the railways were not acceptable to customers and/or in terms of the agreement between the railways involved, the following alternatives could apply: - 2.1 Equity in allocating railage income
2.1.1 Definition
A non-differentiated through rate, from origin to destination, shared pro-rata between the railways effecting the service, based on agreed work performance factors, after taking into consideration relevant compensation for railways executing terminal services.
2.1.2 Application
Railage income is shared between railways, allocating 2.5% each to the origin and destination railways, and 95% between all the participating railways based on their respective net ton-kilometres for the traffic conveyed. Problems and issues noted with regard to the application of the equity principle are appended as Annexure A to this document.
2.1.3 Background to principle
In order to ensure that traffic is considered by rail, it is imperative that railage should be either market related, considering world market prices, or competitive taking into account competition from alternative modes of transport.
2.1.4 Force of this principle
This principle where applied should override the use of the Official Tariff Books.
2.1.5 Rates increases
For existing business allocated on the basis of the equity principle, when increases are agreed with customers, allocation of the revised railage income is maintained on the basis of the equity principle. No one railway may increase its share unilaterally.
2.2 Haulage
In order to support the objective of increased rail market share, a railway may be compensated on a fixed basis for the hauling of traffic on behalf of another railway or authorized agent. In such event

Rail Services from A Customer’s & Railway Operator Perspective
62
railage collected from the customer, from origin to destination, is retained by the originating railway. 2.2.1 Application
Fixed compensation to a railway for services rendered would be subject to mutual agreement between the relevant railways.
2.3 Wheelage
Contributing to a seamless, predictable service, and addressing the needs of customers, trains of the originating railway may be consigned via or to the lines of another railway, utilizing the rolling stock of such originating railway. The intermediate or destination railway is compensated on a fixed basis an access fee and relevant services rendered. Railage collected from the customer, from origin to destination, is retained by the originating railway.
2.3.1 Application
Wheelage to a railway for services rendered would be subject to mutual agreement between the railways involved.
3. ROUTING OF INTERNATIONAL TRAFFIC (APPLICABLE PER CORRIDOR
ONLY) In order to address the needs of customers and the interests of railways,
unless otherwise agreed to by the railways involved, international traffic would be quoted and routed based on the shortest geographical rail route from origin to destination, subject to customer preference, route efficiency, cost, safety, and any governmental or inter-railway agreements that may be in force. Implementation of the principle would have to be on a corridor-by-corridor basis in view of varying prevailing circumstances in the different corridors.
4. RATES QUOTATIONS
4.1 Time Frame
Requests for rate quotations on new business must be given to the requesting railway by all the affected railways within 48 hours from receiving the enquiry. Enquiries and responses can be by phone, fax, e-mail or other medium. In exceptional circumstances, should extensive negotiations with a customer be required, the time frame for such a quotation would be effected in accordance with the agreement of the customer concerned. 4.2 Consultations
In order to support responses to the customer for new business within the time frame, consultation between the railways is encouraged. 4.3 No part quotations Serving the interest of all railways, a railway should not quote on part of the journey, which can be totally completed by rail. Where the customer could transship the traffic at an earlier or later point so as to avoid using the rail

63
services for another carrier, the railway receiving the enquiry provides a quote for the complete journey by the rail. Exceptional circumstances would be agreed upon between the railways. 4.4 Rail consultation and other logistics providers Where a request for a part quotation is received from a rail consultant or other logistics provider, and in extreme circumstances one has to be provided, the quotation is never lower than is offered to the designated railway.
5. ONE STOP SERVICE (ONE RATE, ONE INVOICE, ONE PAYMENT. IE.
COLLECTION OF EACH OTHER’S REVENUE)
One railway is designated to be the point of contact with the customer, normally the first railway receiving the enquiry from the customer. There is one contract between the designated railway and the customer, covering the services of all participating railways, including the collection of revenue. Each corridor would have to agree on which member could best perform this function, together with guidelines and mechanisms to control default on remittances to the other railways. The designated railway issues one consignment note and invoice for the complete through railage income, and collects all the income on behalf of all railways. The split of income between the railways is not shown to the customer.
6. CUSTOMER CARE FEEDBACK AND INFORMATION
Customer care reports are prepared after specific visits and summarised at least once every quarter by the customer-contact railway, and also provided promptly to other railways participating in the corridor. Feedback from the customer on rate quotations would be provided by the other railways.
7. VISITS TO CUSTOMERS IN OTHER COUNTRIES
Visits to customers in other countries by any staff from another railway should be well coordinated with the local railway. Normally booth the designated and the visiting railway see the customer, unless otherwise agreed. Each such visit, if not accompanied by the designated railway, is reported on by the visitor to the customer-contact railway.
8. STRATEGIC ALLIANCES
To be able the provision of extended services, e.g. freight logistics solutions, railways may enter into strategic alliances with other service providers.
9. JOINT PROMOTIONS
Joint promotions (e.g. stands at trade fairs and exhibitions) should be attended where possible by all participating railways. If a railway does not attend, it can supply promotional materials relevant to the event taking place.
10. MARKET RESEARCH AND INTELLIGENCE
Railways rely heavily on accurate information to develop specific marketing strategies. Sufficient resources shall be dedicated by each railway to gather

Rail Services from A Customer’s & Railway Operator Perspective
64
market information in support of marketing efforts. Such information shall be extended to other railways. Trade fairs and other opportunities to gather market intelligence should be monitored by the local railway and advised to other railways.
11. TRAINING IN MARKETING
In order to support their mutual objectives, the railways shall establish uniform and consistent curriculum for training staff in the marketing of their services.
12. CLIENT PAIRING
Marketing efforts in each railway specifically focuses on opportunities for back-loading in order to achieve more competitive rates through increased asset utilisation.
13. EQUIPMENT HIRE
Application of equipment hire would be done in accordance with and in support of the objective of this policy.
14. PRACTICAL IMPLEMTATION
14.1 Implementation of this policy
Each railway implements and maintains up-to-date its processes and systems in support of the policy objectives. All other railway agreements should be in conformity with this policy.
14.2 Effectiveness and performance measures
Corridor Management Group coordinators shall include in their analyses of corridor performance, measures being undertaken to ensure effective implementation of the Marketing Policy (e.g. relevant back-loading percentages, effects on market competitiveness, speed of responses to customers, traffic gained/lost and reasons etc.) to determine whether the objectives of the policy are being achieved.
15. MARKETING POLICY MAINTENANCE
15.1 Revision of this policy This policy will be revised annually or as and when necessary. The foregoing notwithstanding, any railway may propose amendments. Supporting motivation should accompany the request to be considered appropriately by SARA and its relevant committees.
****************************

65
ANNEX A 1. EQUITY APPLICATION
In applying an equity principle, alternative modus operandi could be considered as follows: 1.1 Determine a market related rate for the throughout distance, irrespective of
cost structures of different Railways. The market related rate is afforded to Railways in accordance with the marketing policy i.e. after considering compensation to Railways doing Terminal services, the balance is afforded on the basis of a Railway‟s work performance (example net ton km).
1.2 Equity rate for the total distance is market related, but a standard minimum
charge, regarded as a “best practice rate “ for the region should at least be honored in the quotation by a Railway of railage for a throughout journey.
1.3 Equity rate is market related, but considering that railways may have different
cost structures, any railway not agreeable to the Equity rate on this basis may submit annually its minimum rate per commodity per corridor, in order to facilitate quotation by a railway of railage from origin to destination. However , in order to ensure that this is done in a consistent manner , a standard model is used to determine:
(a) the appropriate costs: and (b) the quantum of such costs in each Railway which would serve as that
Railway‟s “minimum rate per commodity per corridor” and which could then be used for the purpose of quotation for a throughout journey.
2. THE EQUITY PRINCIPLE : FACTORS TO BE CONSIDERED
2.1 Cost differentiation
Impact of distance (longer distance implies relative lower operating cost)
Topography (necessitating different train composition)
Corridors
Fleet differentiation
Inflation rate in different countries (not necessarily off-set by weakening exchange rates)
Capacity utilisation (excess vs shortage ) 2.2 Subsidies being received from Government for services rendered 2.3 Statutory requirements and national policy 2.4 Privatisation 2.5 Mutual trust 2.6 Marketing capacity/capability of all Railways
***********************

Rail Services from A Customer’s & Railway Operator Perspective
66

67
Annexure A.2
1. Terms of Reference of the Rail Optimization Committee a. Establish Regional transport demand patents in order to:
i. Determine rail market share by route etc
ii. Understand the key drivers of modal choice, by customers, between
road and rail
iii. Establish why rail demand trends are on the slide, and
iv. Determine priority actions needed to reverse the trend and grow rail
market share
b. Establish current status of the various SARA rail corridors, their utilisation
levels, efficiencies and challenges both from a market and railway
perspective
c. Establish the basis of current traffic routing over the major corridors and
rail systems
d. Evaluate whether the SARA Marketing Policy achieved the objectives for
which it was developed considering that it has been in place for over 10
years now but has, to date had little or no real impact in reversing this
negative trend. If need be review to update it in pursuit of expanding
railway market share, and
e. Recommend solutions for the short, medium and long term.
2. Terms of Reference for the Consultant
1. Problem Statement
There is concern amongst SARA members, specifically the rail operators, that the
distribution/share of transit rail traffic to/from the SADC hinterland through the ports,
to/from overseas markets, is not being fairly shared between the rail systems of the
region. Railways believe that they can offer convenient and relatively cheaper
transportation services if they align themselves with the market.
In seeking to resolve the problem of service realignment the SARA Board
simultaneously wants to identify and address the underlying problem of lost rail
Rail Services from A Customer’s & Railway Operator Perspective
68
market share so that the usage of rail transport systems in the region can be
optimized for the benefit of all. It is in this regard that a questionnaire was developed
for customers to give feedback and their views on quality of services currently
provided by railway operators, and give projections of future demand for railway
services and the challenges they face when dealing with the railways.
2. RESEARCH HYPOTHESIS
The assumption is that customers are using road more than rail. Based on this
assumption will;
ix. Cargo come on rail when railways fixes the constrains in their service
provision
x. The modes of transport continue competing i.e. road and rail
3. OBJECTIVES OF CARRYING A FIELD STUDY
The purpose of carrying out a field study is to identify the underlying problem of why
railways lost market share and how the railways can optimize railway services. The
objectives of carrying out the field study are:
3.1 To gather data that will be used to determine the market share of
specific commodities as given in table 1 on different SARA corridors
3.2 Reasons of modal spilt
3.3 To identify strategic issues that RAs could adopt to improve the railway
services within the resources currently available
3.4 To draw up of a final report for the Rail Optimisation Committee that
highlights strategic issues for gaining market share
4. SCOPE OF WORK
SARA requires the service of a Consultant to gather data in Democratic Republic of
Congo, Zambia and Zimbabwe;
4.1 To streamline the customer questionnaire designed by the Committee
and make it focused
4.2 Gather data from selected customers, sector association, shipping
agencies and freight forwarders in different countries on the specific
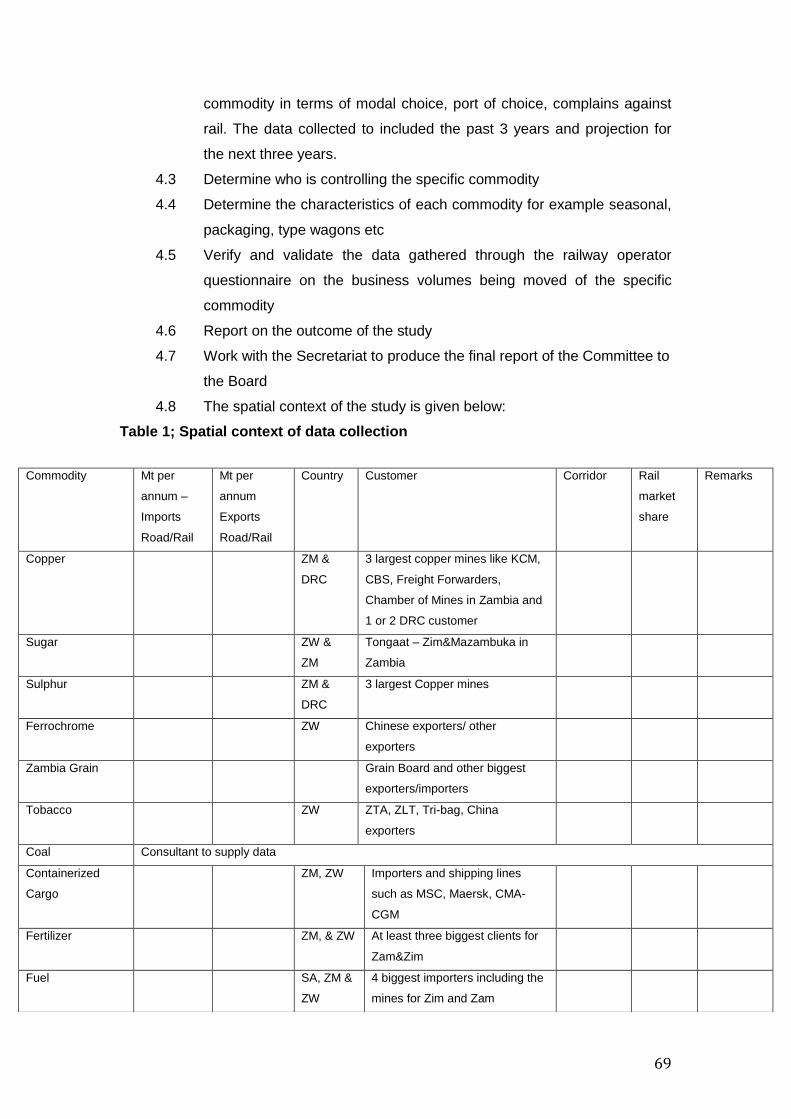
69
commodity in terms of modal choice, port of choice, complains against
rail. The data collected to included the past 3 years and projection for
the next three years.
4.3 Determine who is controlling the specific commodity
4.4 Determine the characteristics of each commodity for example seasonal,
packaging, type wagons etc
4.5 Verify and validate the data gathered through the railway operator
questionnaire on the business volumes being moved of the specific
commodity
4.6 Report on the outcome of the study
4.7 Work with the Secretariat to produce the final report of the Committee to
the Board
4.8 The spatial context of the study is given below:
Table 1; Spatial context of data collection
Commodity Mt per
annum –
Imports
Road/Rail
Mt per
annum
Exports
Road/Rail
Country Customer Corridor Rail
market
share
Remarks
Copper ZM &
DRC
3 largest copper mines like KCM,
CBS, Freight Forwarders,
Chamber of Mines in Zambia and
1 or 2 DRC customer
Sugar ZW &
ZM
Tongaat – Zim&Mazambuka in
Zambia
Sulphur ZM &
DRC
3 largest Copper mines
Ferrochrome ZW Chinese exporters/ other
exporters
Zambia Grain Grain Board and other biggest
exporters/importers
Tobacco ZW ZTA, ZLT, Tri-bag, China
exporters
Coal Consultant to supply data
Containerized
Cargo
ZM, ZW Importers and shipping lines
such as MSC, Maersk, CMA-
CGM
Fertilizer ZM, & ZW At least three biggest clients for
Zam&Zim
Fuel SA, ZM &
ZW
4 biggest importers including the
mines for Zim and Zam
Rail Services from A Customer’s & Railway Operator Perspective
70
5 DELVERABLES
The Consultant/s will be required to produce a complete report on behalf of the
Committee.
6 TERMS OF REFERENCE
6.1 To Conduct a research that addresses the stated objectives
6.2 Clearly outline the underlying assumptions of the hypothesis
6.3 Collect high level of quality data as stated in the scope of work
6.4 Consider the analysis already done for general customer and rail
operator
6.5 To obtain government‟s position on railway services in the three
countries
6.6 To indicate other sources of secondary data
6.7 Determine the current market share of the specific commodity
6.8 Determine customer‟s preference of mode of choice and reasons
6.9 Determine customer‟s port preference and route
6.10 Determine production levels and business growth of the specific
commodity per country
6.11 Determine if there is scope to increase the rail market share
6.12 Determine the modal split of copper in terms of route
6.13 To also consider Botswana and Tanzania as options of cargo routing
6.14 To identify strategic issues to improve the rail market share
7 EXPECTED OUTCOME
The Consultant shall produce the following;
7.1 A come up with a report on the outcome of the research
7.2 Any recommendations for further studies or initiatives for railways to
increase the market
7.3 Produce the final report for the Committee
7.4
8 SCHEDULE
The project is expected to be complete within eighteen days. Consultant shall
provide progress reports summarizing progress in this work, outlining problems, and
constraints encountered and presenting issues for the Committee‟s decision as
required.

71
7.1 Produce the initial draft report of the study 7 days after the notice to
proceed with the above scope of work
7.2 Produce the final draft report 2 day after the submission of comments by
Committee members
7.3 To integrate the input from the Secretariat and the final study report to
produce the final Rail optimization report 7 days after the final study
report submission
7.4 Present the report to the Committee for final approval 2 days after the
submission of the final report

Rail Services from A Customer’s & Railway Operator Perspective
72
Annexure A.3 Rail Operator Questionnaire OBJECTIVE In an effort to boost railway market share through improved service delivery to customers, the SARA Board appointed a Committee (Railway Optimization Committee). The Committee is tasked with investigating causes of the decline in railway market share and come up with recommendations to regain lost market share on all corridors. The Committee therefore wishes to collect corridor baseline information from railway operators and customers to enable it to generate appropriate recommendations based on facts. Questionnaires for Operators and Customers are different. It is expected that recommendations to be generated will contribute towards resolving the continuous decline in railway market share.
CONFIDENTILITY Information submitted by railway operators shall be treated as strictly confidential and will only be used by the Committee to carry out the exercise as assigned by the SARA Board. Under no circumstances will the name of the operator be mentioned as the results will be presented in a generalized format.
INSTRUCTIONS 1. Complete a separate questionnaire for each corridor.
2. Completed questionnaire should be emailed to the SARA Executive Director
on [email protected] by the 27th of August.
3. Any queries pertaining to this questionnaire should be directed to the SARA
Executive Director.
List of Railway Corridors i. Beira Corridor
ii. Beitbridge Corridor
iii. Dar es Salaam Corridor
iv. Limpopo Corridor
v. Lobito Corridor
vi. Maputo Corridor
vii. Nacala Corridor
viii. Plumtree Corridor
ix. Richards Bay Corridor
x. TransNamib Corridor
xi. TRC Corridor
1. Country .................................
2. Railway Operator .................................
3. Corridor...................................

73
4. Corridor members...................................................................................
Origin ............................................. Destination ..............................................
5. Date of interview .........................
6. Interviewer .......................................................
7. Name of Interviewee and Title...............................
8. Operational Issues
a. Which are the major commodities (top 5) on the corridor for both road
and rail?
b. List the top 5 major customers on the corridor
i. ..................................... ii. ................................. iii............................
iv. .................................... v. ....................................
c. What is the potential business volume on the corridor?
(i) Import
(ii) Export
d. What is the current business volume (all commodities) by rail?
(i) Import
(ii) Export
e. What is the state of competition from road on the corridor? - Comment
f. Are there any collaborative opportunities between road and rail on the
corridor in terms of intermodal operations?
g. Is there balance of traffic in both directions (Return load/Backhaul)?
Y/N
If Yes state traffic direction
h. What are the challenges confronting the railways on the corridor?
i. How long is the corridor section on your network in kilometres?

Rail Services from A Customer’s & Railway Operator Perspective
74
j. What is the design capacity of your portion of the corridor (given in i
above) in terms of trains per day in both directions?
k. What proportion of design capacity is being utilised?
l. What are the contributory factors?
m. How many interchange points does the corridor have? State their
location.
n. What interchange arrangements are in place?
(i) Single/Joint inspections
(ii) Loco through working
(iii) Crew through working
o. Do you have service level agreements with
(i) Contiguous railways?
(ii) Some customers
p. Do you believe that its necessary to have service level agreements
among neighbouring railways? Please explain.
q. Is there a through working timetable for international traffic/trains to
destination?
r. Do you have an organisational cargo tracking information system?
Y/N
If Yes give brief description and state whether it is linked to customers.
s. Is capacity adequate? (i) Locos Y/N (ii) Wagons Y/N (iii) Track
Y/N
Comment
t. Are the Corridor Management Groups (CMGs) functional? If not what
are the reasons? Comment.
9. Marketing and Commercial Issues
a. How do you determine your tariffs?
(i) Cost-plus
(ii) Market based
(iii) Marginal costing

75
(iv) Any other ...................................................
Comment:
b. What factors do you consider to arrive at tariffs for various
commodities for international traffic in particular?
c. Are your tariffs predetermined? (tariff schedule/negotiated)
d. Do you have service level agreements with some customers? Y/N
If Yes how have they affected service delivery?
e. Is your quotation system centralised? Y/N.
How long does it take for your organisation to provide quotations on international traffic?
f. How long does it take to get quotations from other corridor members?
g. Are you able to quote through rates to customers (One Stop Service)?
h. To what extent do you engage in joint marketing of railway services on
the corridor?
i. What in your view are the strengths and weaknesses of the current
SARA Marketing Policy?
(i) Strengths
(ii) Weaknesses
j. How can the current SARA marketing strategy be improved to
promote growth in railway market share?
k. What measures should be taken to improve railway competitiveness?
l. Are there any challenges beyond the railways on the corridor? How in
your view should they be addressed if any?

Rail Services from A Customer’s & Railway Operator Perspective
76
Annexure A.4 Customer service delivery questionnaire A. BRIEF BACKGROUND
Railways recognise the critical role they play through providing transportation services to the economy. A number of factors have mitigated against the railways‟ ability to effectively play this role resulting in the provision of inadequate services to customers. These include inadequate capacity, cumbersome commercial procedures and failure to optimise on available resources in some cases. This undesirable situation calls upon the railways to review their operating procedures and resource requirement planning for them to be responsive to market needs. Railways believe that they can offer convenient and relatively cheaper transportation services if they align themselves with the market. It is in this regard that it has become necessary to carry out a survey which will form the basis of service realignment. We therefore request your company, as one of the major railway users to submit your input to the railway service realignment process by completing the questionnaire below. B. CONFIDENTILITY
Information submitted by railway operators shall be treated as strictly confidential and will only be used by the Committee to carry out the exercise as assigned by the SARA Board. Under no circumstances will the name of the operator be mentioned as the results will be presented in a generalized format. C. INSTRUCTIONS
4. Complete a separate questionnaire for each corridor.
5. Completed questionnaires should be emailed to the Acting SARA Executive
Director on [email protected] by the 20th September 2014.
6. Any queries pertaining to this questionnaire should be directed to the SARA
Acting Executive Director
10. Country .................................
11. Corridor...................................
12. Date of interview .........................
13. Interviewer .......................................................
14. Customer Name................................
15. Name of interviewee and Title...............................
16. Do you own or have right of use to a private siding or private sidings?
Yes/No

77
17. If “Yes” in 7 above what is the wagon holding capacity of the siding (s)?
18. Indicate the products you transport and their monthly tonnage
a. .................... ..........................
b. .................... ..........................
c. .................... ..........................
d. .................... ..........................
e. .................... ..........................
19. Complete the following table
Rail Road Total Origin Destination Export Import Total
20. List the products in 9 above by monthly tonnage & their transportation
requirements (in tonnes) by mode (Road and Rail)
Product Monthly Tonnage Transport
Requirements Rail Road a. b. c. d. e.
21. What type of resources do you require from railways?
i. Locomotives ii. Wagons iii. Tarpaulins iv. All
22. Indicate in terms of monthly requirements your wagon needs
Wagon Type Quantity High Sided Iron Drop Sided Iron Flatbed
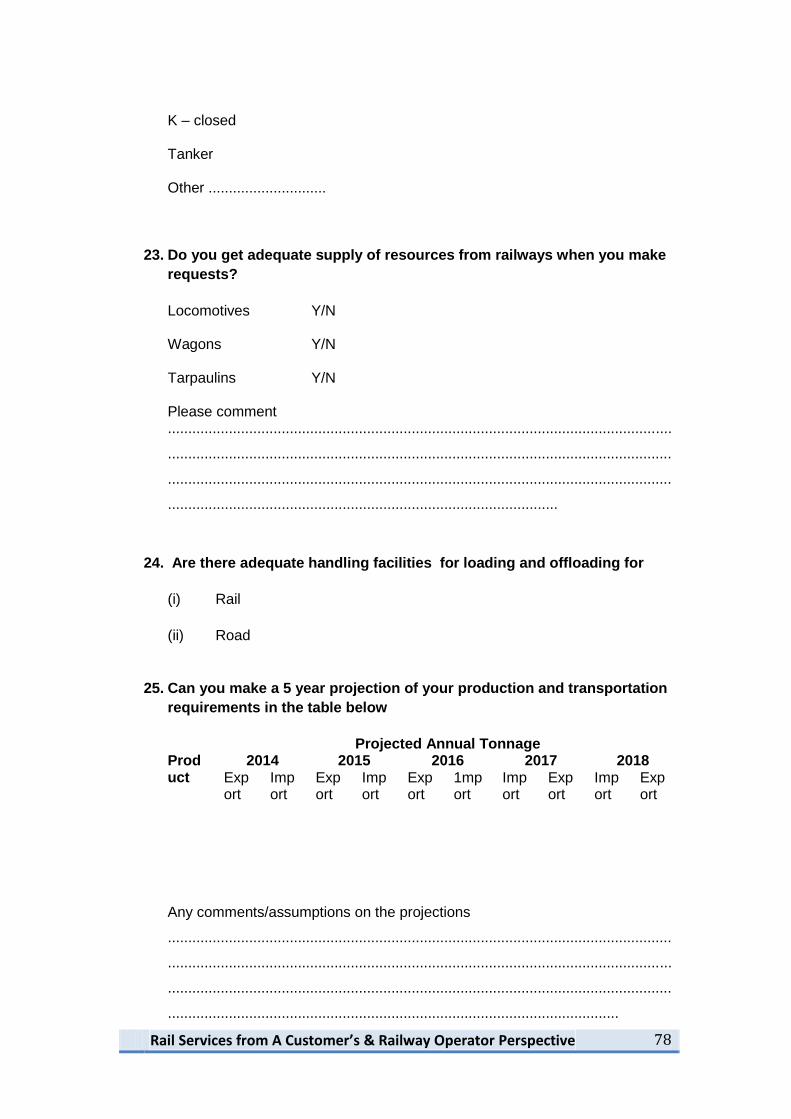
Rail Services from A Customer’s & Railway Operator Perspective
78
K – closed Tanker Other .............................
23. Do you get adequate supply of resources from railways when you make
requests?
Locomotives Y/N Wagons Y/N Tarpaulins Y/N Please comment ............................................................................................................................
............................................................................................................................
............................................................................................................................
................................................................................................
24. Are there adequate handling facilities for loading and offloading for
(i) Rail
(ii) Road
25. Can you make a 5 year projection of your production and transportation
requirements in the table below
Projected Annual Tonnage Product
2014 2015 2016 2017 2018 Export
Import
Export
Import
Export
1mport
Import
Export
Import
Export
Any comments/assumptions on the projections
............................................................................................................................
............................................................................................................................
............................................................................................................................
...............................................................................................................

79
26. How do you rate railways services against other transport modes you
use in terms of:
Excellent Good Poor Fair Very Poor
Tariffs
Capacity
Predictability
Transit
Safety
Convenience
Any other additional issues you may need railways to attend to
............................................................................................................................
............................................................................................................................
27. Can you rank the variables in 17 above according to their importance to
you?
28. What factors do you consider when making a choice between using
road and rail?
............................................................................................................................
............................................................................................................................
............................................................................................................................
29. Are there any potential benefits of using railway transport? Y/N
If Yes list them ............................................................................................................................
............................................................................................................................
30. Are there benefits in using in using road?
If Yes list them ............................................................................................................................
............................................................................................................................
31. Do you experience any frustrations when using or trying to access
railway services? Y/N
If Yes list them

Rail Services from A Customer’s & Railway Operator Perspective
80
............................................................................................................................
............................................................................................................................
32. What in your view should railways change in order to improve service
delivery?
............................................................................................................................
............................................................................................................................
33. Any other pertinent comments/information you may wish to provide?
…………………………………………………………………………………………
…………………………………………………………………………………………
…………………………………………………

81
Annexure A.5 Zambia Chamber of Mines Presentation
13th November 2014
Mr. Jackson Sikamo - President, Zambia Chamber of Mines
“Giving back to Zambia”
1
“advancing the interests of our members, local
communities, the country and all stakeholders while
promoting sustainable and responsible mining ”
MISSION STATEMENT
2

Rail Services from A Customer’s & Railway Operator Perspective
82
TYPICAL PRODUCTION PROFILE
2yrs -20yrs
1 2 3 4
1 Mine Exploration - 7-10 years
2 Mine Development- 5-10 years
3 Mine Operation 2-20 years
4 Mine Closure 2-10 years
7-10yrs 5yrs -10yrs 2yrs -10yrs
Production
Time
3
Source: ICMM (International Copper Study Group from 1996 onwards (Copper Bulletin March 2012 & April 2013; Yearbook 2006; Statistical Yearbook 2008), US Geological Survey Annual Mineral Reports 1963-1995
Copper production
National ownership Private ownership Private ownership
Share of global production (Percentage.)
Copper production (Tonnes.)
0
100,000
200,000
300,000
400,000
500,000
600,000
700,000
800,000
0%
2%
4%
6%
8%
10%
12%
14%
16%
1963 1967 1971 1975 1979 1983 1987 1991 1995 1999 2003 2007 2011
Zambia Coper Production
Zambia percentage share of global copper production
Zambia copper production

83
MAJOR INVESTMENT PROJECTS 2000 TO DATE (US$12.4BN)
Mopani KCM Lubambe FQM Lumwana Kansanshi
US$2.24bn US$ 2.9bn US $ 0.49bn US$2.23bn US $2bn US$2.54bn
5
EMPLOYMENT STATUS
DIRECT EMPLOYEES CONTRACTED LABOUR OTHER(specify)
Mopani
10,000 10,000
Konkola
7,000 9,000
Lumwana
1,882 2,054
Kansanshi
4,781 3,731 5407 (on the expansion
projects)
Albidon 63(due to care and maintenance of mine)
Lubambe
1,200 1,000
Chibuluma
602 345
Chambishi Metals
741 147
Chambishi Copper Smelter
1,600 400
NFCA
1,064 1,219
TOTAL
28,870 27,896 5407
GRAND TOTAL 62,173 6

Rail Services from A Customer’s & Railway Operator Perspective
84
Type of Employment Copperbelt North-Western Total
Direct employment, mining
companies
16,800 3500 20,300
Direct employment, contractors 23,800 12,100 35,900
Indirect employment, service
providers
1,200 2,000 3,200
Indirect employment, goods
providers
4,200 - 4,200
Indirect employment, social
spending
6,500 3,100 9,600
Induced employment 53,000 21,500 74,500
Total 105,500 42,200 147,700
Of which indirect and induced 64,900 26,600 91,500
Implied multiplier 2.60 2.71 2.63
Total as share of total employment 15.9% 14.8
Source: Company data and OPM’s calculations
EMPLOYMENT
7
EMPLOYMENT CREATION (EXPATRIATE RATIO)
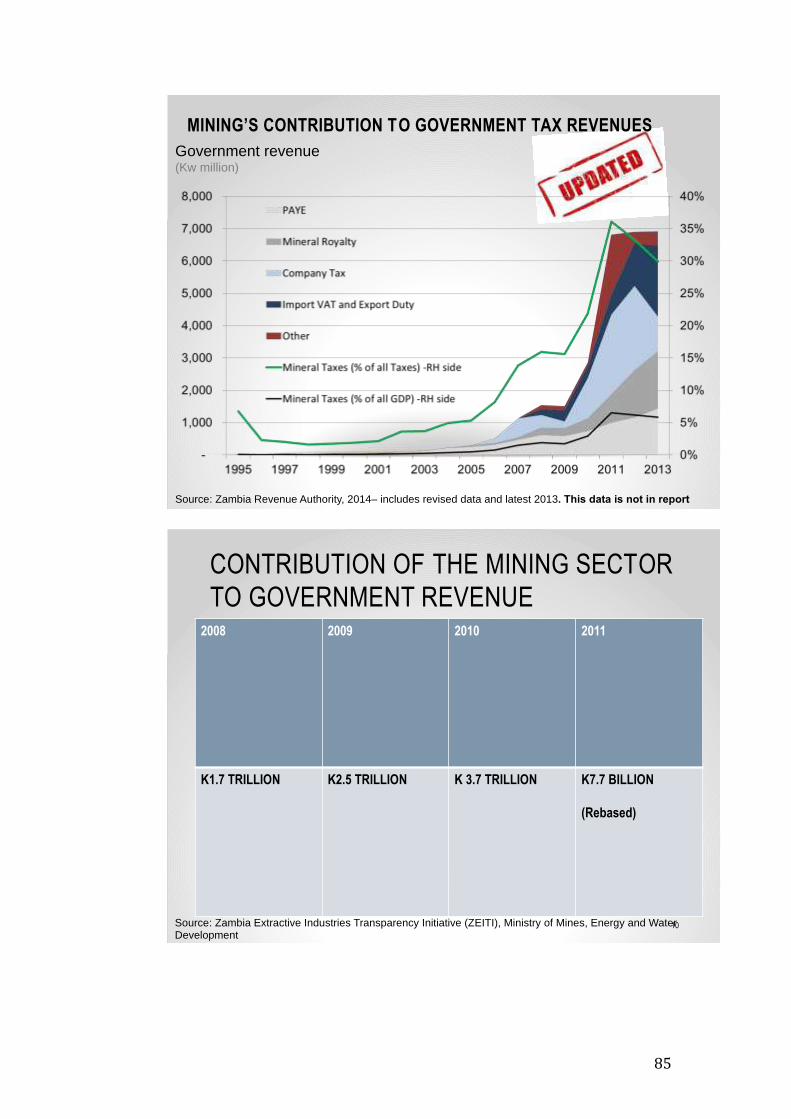
85
MINING’S CONTRIBUTION TO GOVERNMENT TAX REVENUES
Source: Zambia Revenue Authority, 2014– includes revised data and latest 2013. This data is not in report
Government revenue (Kw million)
2008 2009 2010 2011
K1.7 TRILLION K2.5 TRILLION K 3.7 TRILLION K7.7 BILLION
(Rebased)
10
CONTRIBUTION OF THE MINING SECTOR
TO GOVERNMENT REVENUE
Source: Zambia Extractive Industries Transparency Initiative (ZEITI), Ministry of Mines, Energy and Water Development
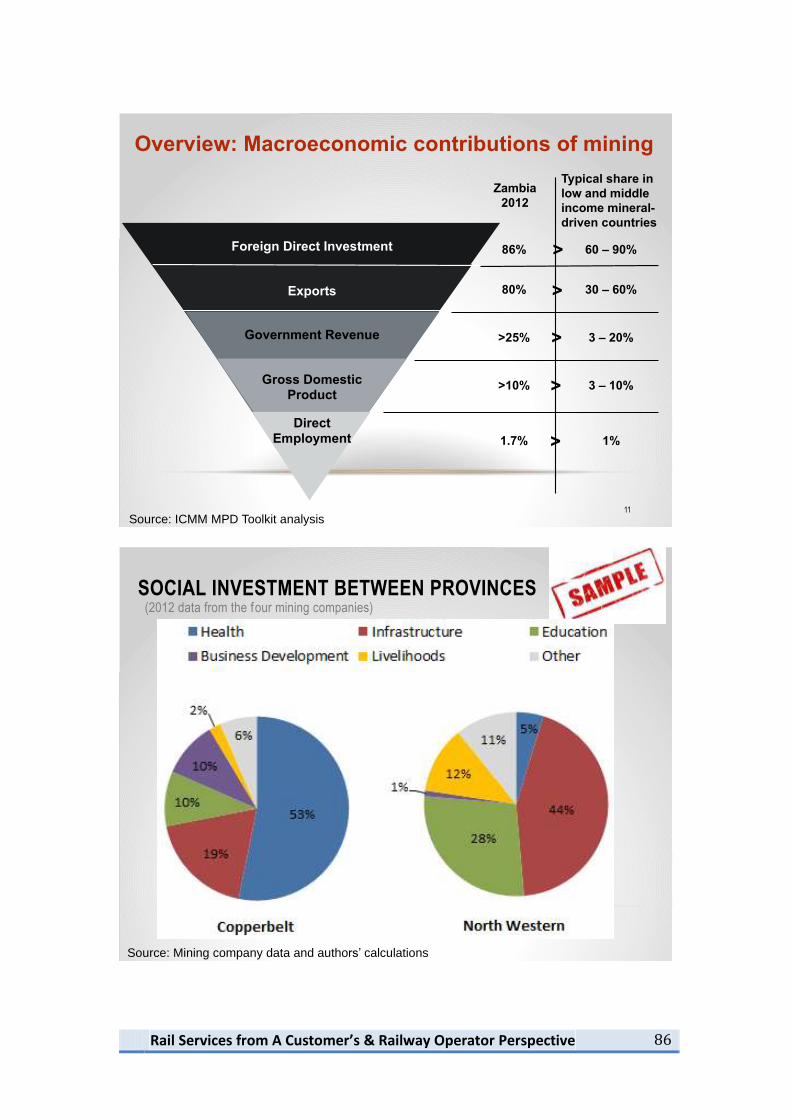
Rail Services from A Customer’s & Railway Operator Perspective
86
Overview: Macroeconomic contributions of mining
Foreign Direct Investment
Exports
Government Revenue
Gross Domestic Product
Direct
Employment
Zambia
2012
Typical share in
low and middle
income mineral-
driven countries
86% 60 – 90%
80% 30 – 60%
>25% 3 – 20%
>10% 3 – 10%
1.7% 1%
>
>
>
>
Source: ICMM MPD Toolkit analysis
>
11
SOCIAL INVESTMENT BETWEEN PROVINCES
Source: Mining company data and authors’ calculations
(2012 data from the four mining companies)
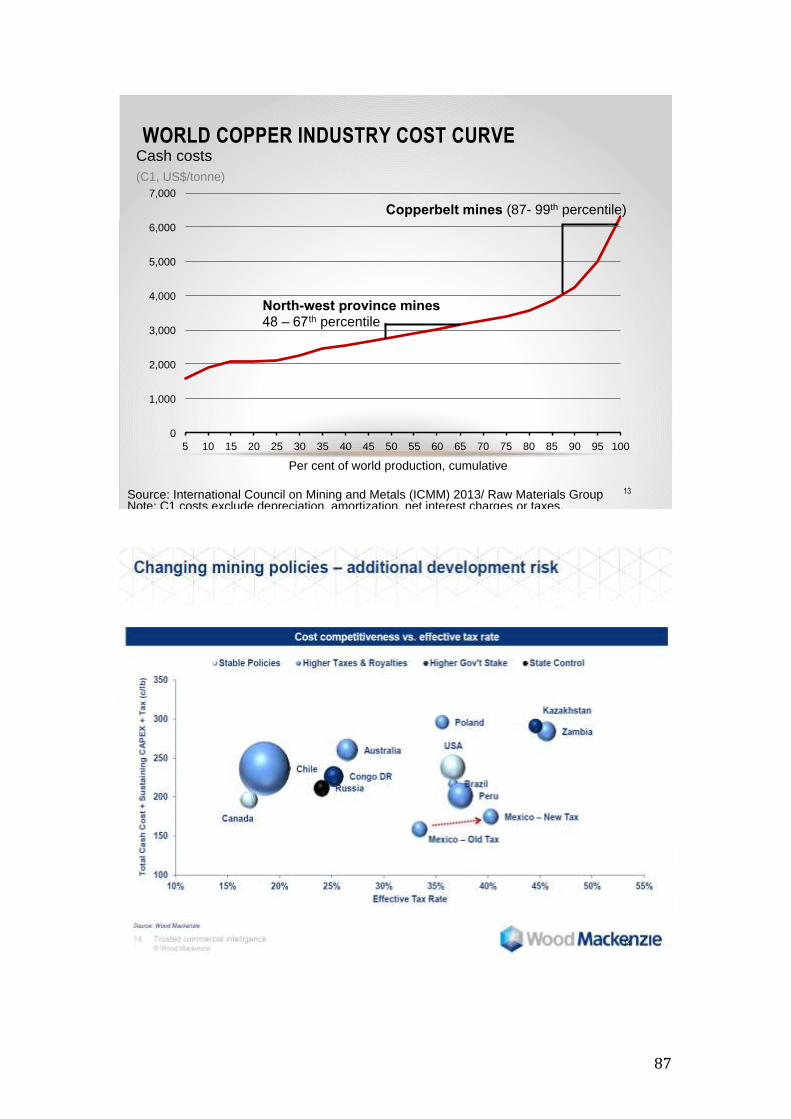
87
WORLD COPPER INDUSTRY COST CURVE
0
1,000
2,000
3,000
4,000
5,000
6,000
7,000
5 10 15 20 25 30 35 40 45 50 55 60 65 70 75 80 85 90 95 100
Per cent of world production, cumulative
Source: International Council on Mining and Metals (ICMM) 2013/ Raw Materials Group Note: C1 costs exclude depreciation, amortization, net interest charges or taxes.
Cash costs
(C1, US$/tonne)
North-west province mines 48 – 67th percentile
Copperbelt mines (87- 99th percentile)
13
14

Rail Services from A Customer’s & Railway Operator Perspective
88
Annexure A.6 Zambia market study survey data Ground truth market survey as seen by the major rail customers.
Copper Source: Mr Jackson Musimo 13/11/2014 Position: President of Zambia Chamber of Mines, and General Manager Chibuluma Mines, Metorex Group Reality Tree:
Zambia produced 762K/tons in 2013 and the definitive forecast of growth to
1.5m/t /year in within the next 5 years., supported by new mining investments,
with one new mine Sentinel a part of First Quantum Mines, coming on line in
mid 2015, with a capacity of 300K/t /year
Miners would be comfortable with a rate of $100 per ton to Beira, conditional
to a 10 day transit time, availability of appropriate wagons or containers,
sustainable service e, safety of cargo, continuous communication/feedback,
port capacity, including handling, storage and calling vessels
Road transport is currently charging $95/ ton and their transit time is good,
although security remains of concern.
Beira has the benefit of return lords in terms of Zambian fertilizer, sulphur,
Gen. container cargo, and re-agents, for which customers are pre3pared to
pay up to $ 130/150 per ton.
Beira also has the benefit of the poor service offering by Tazara and their
disappointment with the congestion at Dar port.
Railway operators should plan their resource availability and service offering
long term in line with miners‟ long term production plans which normally runs
between 2 to 20 years of life production per the mine‟s life cycle.
Mine prefer to deal with only one authority with decision making power, able
to provide a seamless service,: Production to Final market destination.
DRC production 2013 960Kt and the forecast for next 5 years is 2Mt
Sugar Source: Zambia Sugar: Richard Chiponda, Logistics Manager, Mazabuka 5/11/2014 Ground Truth:
ZS is the only player in the sugar export market in the country. Tot5al production currently 420ktpa, planned 500ktpa from 2015to 2017
Of total production 150Ktpa goes to the EU market via Durban and Beira, with 100Kt going via Beira by road because of availability of trucks ex fertilizer imports, which are backhauled at US$78/t.
50Kt goes to Durban by both road and rail 80/20% split respectively because of rail higher rates
Rate transit times, rates and service inconsistence are an issue.

89
Fertilizer Source: Mr Kwazi-Operations Director Nyiombo Investments, Lusaka, 6/11/2014 Vans Mupeta-Marketing Manager Nitrogen Chemicals Zambia Kafue, 10/11/2014 Zambia consumes 350k to 400kt annually and expected to rise to 500Ktpa from 2015-2017, due to growth of the Agriculture sector. Key players are: Nyiombo Investments accounting for 240ktpa of total market, the balance being shared by: NCZ (Nitrogen Chemicals Zambia); Greenbelt Fertilizers, Profert, Omnia. Zambia Fertilizers, and Export Traders. Currently comes via Dar, Beira and Durban. However customers are not happy with the Dar route due to Tazara operations constraints and Dar port Congestion. While there are transit time concerns on the Beira route the best trail are achieving currently is 20 to 25 % of market share.
Sulphur Source: Chris Chipimo MD Bridge Shipping, Ndola Zambia, Priscilla Phiri Depot Manager SAMFUEL – handles Sulphur for Transchem in Ndaola, for FQM (First Quantum Mine). Ground Truth: The combined demand for Sulphur is 200k to240Ktpa for both Zambia and DRC; product is moved in bags and/or bulk. This is a rail friendly product and rail is the customer-preferred mode. However, rail service offering leaves a lot to be desired: shortages of appropriate wagons (closed), lack of shunts when required to clear loads, while clients get charged demurrage, lack of communication, long transit time, etc.. Rail used to carry 60 to 70% of available cargo, but due to poor service offering, shortage of wagons etc., this share is gradually going down and currently stands at 50/50. The major players in this market are: Transchem who supply First Quantum Mines (the biggest Consumer),andTradimex who supply the DRC. Most of the Sulphur is moved to depots in Ndola and then Road hauled to final destination. Sulphur demand is expected to remain high for the next 2 years until Sentinel Smelter comes alive , expected 2015 and start producing own sulphuric acid and for the First Quantum mines.
Conclusions – Major stakeholders views: Clients do not see the need to invest in their loading and unloading facilities;
Customers do not feel motivated to promptly release wagons upon loading
and unloading;
The railways don‟t have enough client preferred specialized wagons such as
covered( K) or flat or DSI;
Some of the high cost of rail operations are due to inefficiencies;
It is not possible for railways to satisfy the needs of all the clients – especially
those with non-rail friendly cargo;
Most clients have reduced on their inventory levels and are not stocking as
much as they used to do in the past, and are mo0re and more relying on on/in
time delivery from service providers;

Rail Services from A Customer’s & Railway Operator Perspective
90
In most dealings with clients there are no service level agreements offered by
railways to clients;
Some clients are not happy at all about the current climes and demurrage
handling and settlement procedures;
Clients are usually not part of some critical railway meetings/ or where
strategic logistics requirements issues are discussed;
Some clients feel that once their cargo is handed over to the railways, it goes
into a “ Black Box”; and
The non-flexible and uncompetitive approach to pricing is making the railways
unattractive.
Recommendations: The railways must incentivize clients to invest in their handling facilities and
hence improve on wagon turnaround times;
Clients must be rewarded for the quick release of wagons as opposed to
using demurrage as source of revenue, which is counter productive;
The railways must consider going into partnerships with investors willing to
collaborate with them in the provision of wagons and locomotives as well as
consolidation points to facilitate a one stop shop concept;
Railways must become more operationally efficient in order to lower their
costs and become more price competitive;
Railways must focus on increasing their market share by concentrating on
rail friendly cargo such as , Sulphur, Sugar, Fertilizer, Copper, containers,
cement and grains;
Railways must improve on transit times, as clients have reduced on their
inventory holding levels, Some are relying on JIT;
Rail must consider seriously going into service level agreements with key
customers, which will help to rebuild confidence in their service offering and
measure their performance and increase market share;
The railways must shift burden of settling claims to insurance companies by
taking insurance, like road does;
Railways must continually strive to understand the customers‟ needs by
inviting clients some corridor clients to their EXCO or Board meetings. Brief
presentations by clients would help to make decision makers understand the
client‟s requirements to enable the authorities to plan accordingly;
Railways must ensure that clients are kept informed about the movement of
their cargo en-route from origin to destination, just like freight forwarders do;
and
Railways must adhere to the SARA Joint Marketing Policy of through pricing
in order to be flexible and competitive.
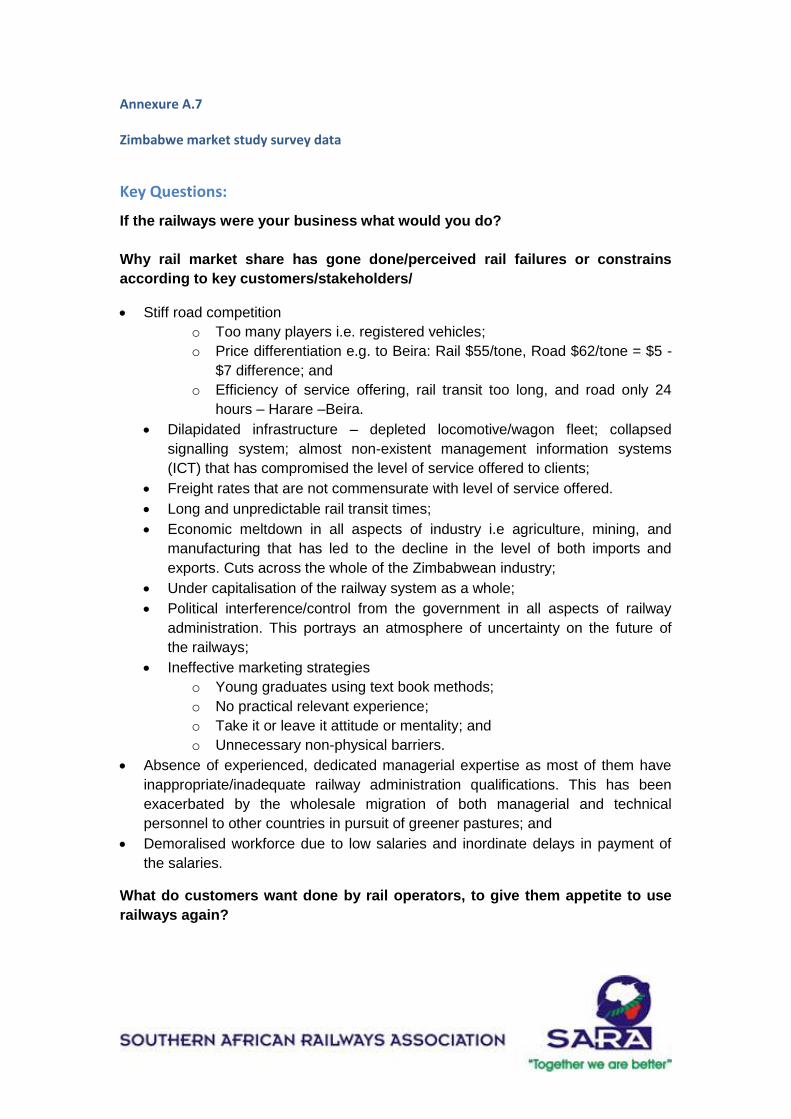
Annexure A.7 Zimbabwe market study survey data
Key Questions:
If the railways were your business what would you do?
Why rail market share has gone done/perceived rail failures or constrains
according to key customers/stakeholders/
Stiff road competition
o Too many players i.e. registered vehicles;
o Price differentiation e.g. to Beira: Rail $55/tone, Road $62/tone = $5 -
$7 difference; and
o Efficiency of service offering, rail transit too long, and road only 24
hours – Harare –Beira.
Dilapidated infrastructure – depleted locomotive/wagon fleet; collapsed
signalling system; almost non-existent management information systems
(ICT) that has compromised the level of service offered to clients;
Freight rates that are not commensurate with level of service offered.
Long and unpredictable rail transit times;
Economic meltdown in all aspects of industry i.e agriculture, mining, and
manufacturing that has led to the decline in the level of both imports and
exports. Cuts across the whole of the Zimbabwean industry;
Under capitalisation of the railway system as a whole;
Political interference/control from the government in all aspects of railway
administration. This portrays an atmosphere of uncertainty on the future of
the railways;
Ineffective marketing strategies
o Young graduates using text book methods;
o No practical relevant experience;
o Take it or leave it attitude or mentality; and
o Unnecessary non-physical barriers.
Absence of experienced, dedicated managerial expertise as most of them have
inappropriate/inadequate railway administration qualifications. This has been
exacerbated by the wholesale migration of both managerial and technical
personnel to other countries in pursuit of greener pastures; and
Demoralised workforce due to low salaries and inordinate delays in payment of
the salaries.
What do customers want done by rail operators, to give them appetite to use
railways again?

Rail Services from A Customer’s & Railway Operator Perspective
92
A total revamping of railway operations by way of fine tuning their operational
strategies and culture in general, in order to meet movement deadlines
expected by their customers
o No hit and miss strategy or procedures: road can meet movement
deadlines to meet shipping requirements as expected by their
customers, while rail cannot in most cases;
o Rate/tariffs should be commensurate to service offered; and
o Resources should be geared to the needs of the customers because
this is where the constraints are and not on the cargo per se.
Complete rehabilitation of railway infrastructure vis-a-vis signalling system,
actual track, workshops and freight terminals: consolidation required and is
necessary at one centralised place;
Introduce dynamic and proactive marketing methods as opposed to the
hitherto textbook approach currently experienced;
Expeditiously facilitate the much talked about „one stop shop/pricing strategy‟
under one operations authority amongst all the contiguous railways in the
region;
Immediate acquisition of suitable locomotives and appropriate rolling stock:
through collaboration with funding or investment partners;
Improvement in transit and wagon turn-around times. This sometimes is
counterproductive e.g. if a wagon takes 60 days to turnaround Harare – Beira
– Harare it means that the wagon is used 6 times a year i.e. 60 x 6 = 360
days. The situation becomes worse if more wagons are involved. This is
inefficiency at its (best);
Consider application of attractive, promotional and competitive rates that
should be commensurate with the level of service provided.
Intensify manpower training in order to enhance the levels of service offered
to customers;
Consider entering into strategic partnerships with other stake holders like
clearing agents, container handlers and ZiMRA, investment/funding partners
to provide a one stop shop under one authority that would provide all the
services required and expected by the customers including own shunting
locos, staff, ICT etc.
Consider application of tariff incentives in all instances that involve large
volumes of cargo;
Avoid using demurrage as a revenue generation tool. Maximum flexibility
should always be exercised when dealing with customers. It is observed that
the railways use demurrage as a source of revenue yet it is not part of their
core business thus punishing customers while covering themselves against
unnecessarily long transit times taken with customer cargo, by saying that
(we do not guarantee transit times);
o This is being inflexible like the railway permanent way itself;
o The railways put a durawall around themselves by providing service
which is not tailored to customer needs; and
o An example of the demurrage saga is given of a Marondera (75km ex
Harare) siding situation where the shunting is provided from Harare as
and when the railways feels it fit to do so and in the meantime the

93
customer is being punished by being charged demurrage for the
railways‟ non provision of shunting services. This is typical on NRZ
lines.
If railway shortcomings, constrains or hot buttons were fixed, and a seamless,
efficient and sustainable service offering were provided, would customers go
back to using rail as their transport mode of choice? Customers heads of
argument:
A general question was raised by some customers on the role and effect of
SARA on rail service provision along the different corridors
Not guaranteed unless and until such time as the railways are able to match
the service levels provided by road, because:
o There has been total loss of confidence in railway operations;
o It is possible that rail can perform as much as or better than road e.g.
Manyame Milling Company in Marondera made a trial run of a 20
wagon train of wheat operated by CFM all the way from Beira to
Marondera, whereby that train performed faster than road. Yet the
railways does not make this sustainable;
o Need for one operating authority instead of a multitude of non
collaborative authorities;
o The railways take clients/customers for granted by not considering
that the customer‟s needs are not the railway‟s need except where
they should meet in terms of:
Shorter/faster transit times;
Efficient operations e.g. like ZiMRA revenue collection system
which is Real Time i.e. as it happens;
Use of appropriate ICT processing system of documents and
not manually as is in most cases; and
Must be in a position to have revamped their systems to meet
modern transportation and logistics trends.
Carry out vigorous and sustained marketing.
What determines customers’ choice of traffic export route choice?
Main determinant factor is the cost effectiveness of the route i.e. from
production (source) to consumption (market destination)
The capacity of the port in terms of handling equipment, berthing constraints,
shipping lines‟ choice of port of call.
Existence or otherwise of non-physical barriers at the ports e.g. cumbersome
documentation, rigid working hours, and the attitude of customs officials when
processing export documentation e.g. non weekend working, delays in
document processing, customs delays at certain ports.
Shortest geographical route: to port and to market destination
Port capacity both in terms of cargo handling and calling vessels.
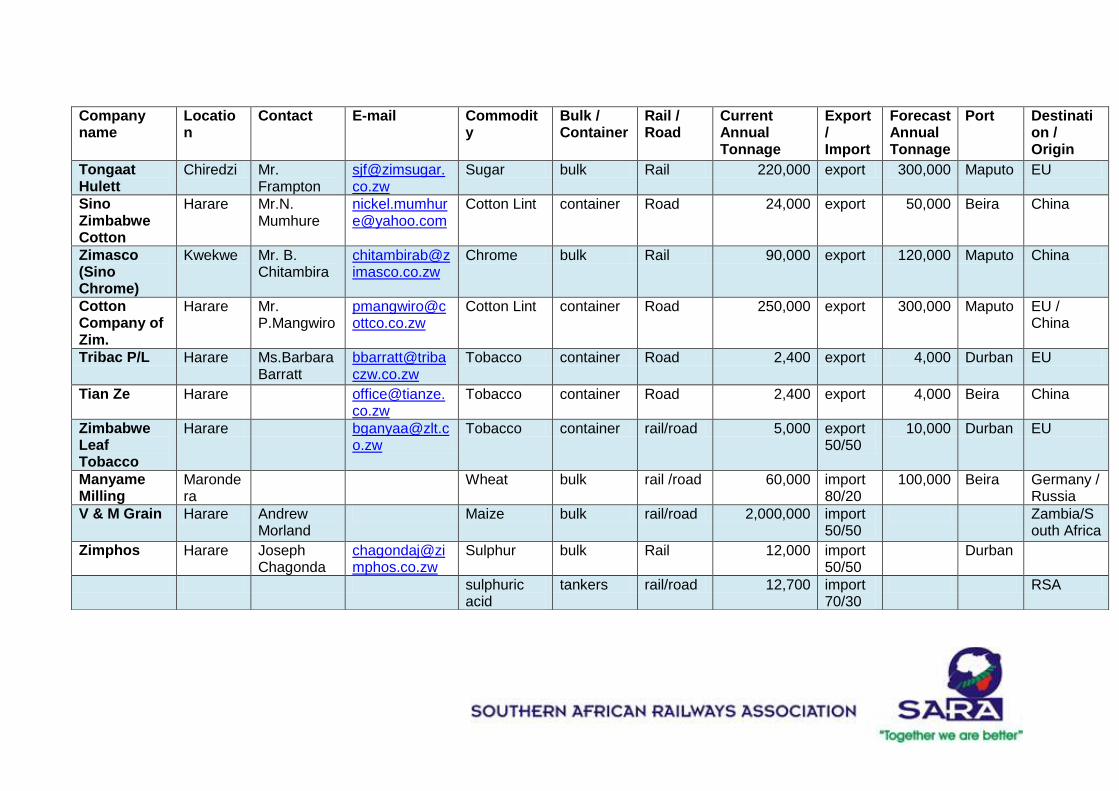
Company name
Location
Contact E-mail Commodity
Bulk / Container
Rail / Road
Current Annual Tonnage
Export / Import
Forecast Annual Tonnage
Port Destination / Origin
Tongaat Hulett
Chiredzi Mr. Frampton
Sugar bulk Rail 220,000 export 300,000 Maputo EU
Sino Zimbabwe Cotton
Harare Mr.N. Mumhure
Cotton Lint container Road 24,000 export 50,000 Beira China
Zimasco (Sino Chrome)
Kwekwe Mr. B. Chitambira
Chrome bulk Rail 90,000 export 120,000 Maputo China
Cotton Company of Zim.
Harare Mr. P.Mangwiro
Cotton Lint container Road 250,000 export 300,000 Maputo EU / China
Tribac P/L Harare Ms.Barbara Barratt
Tobacco container Road 2,400 export 4,000 Durban EU
Tian Ze Harare [email protected]
Tobacco container Road 2,400 export 4,000 Beira China
Zimbabwe Leaf Tobacco
Harare [email protected]
Tobacco container rail/road 5,000 export 50/50
10,000 Durban EU
Manyame Milling
Marondera
Wheat bulk rail /road 60,000 import 80/20
100,000 Beira Germany / Russia
V & M Grain Harare Andrew Morland
Maize bulk rail/road 2,000,000 import 50/50
Zambia/South Africa
Zimphos Harare Joseph Chagonda
Sulphur bulk Rail 12,000 import 50/50
Durban
sulphuric acid
tankers rail/road 12,700 import 70/30
RSA

95
Bauxite bulk Road 5,400 Import70/30
Mozambique
Phosphate rock
bulk rail/road 32,000 local 90/10
Nyazura
Gypsum bulk rail/road 10,000 local/ export30/70
Harare
Sable Chemicals
Kwekwe K. Samhungu
A/Nitrate bulk Rail 50,000 import 30/70
Beira / Durban
Ammonia tankcars rail/road 5,000 import 50/50
RSA
ZFC LTD Harare C. Kainga MOP bulk rail/road 4,000 import 50/50
Beira India / China
SOP bulk rail/road 4,000 import Beira India / China
Windmill Harare T. Ngwenya [email protected]
MOP bulk rail/road 4,000 import Beira India / China
SOP bulk rail/road 4,000 import Beira India / China
IETC P/L Harare J. Patel Rice bulk rail/road import Beira Vietnam / Pakistan
Omnia Fertilizer
Harare Simba Gwamba
Fertilizer bulk Rail 30,000 import Durban RSA
Granite Blocks
Harare Granite bulk Rail export 15 wagons /week
Beira Italy
International Containers
Harare Containers TEU Rail/Road
6000 Beira / Durban

Rail Services from A Customer’s & Railway Operator Perspective
96
Notes:
a) Sino -Zim owns 3 strategic business units: Sino Cotton, Sino Cement and Sino Chrome; b) Ferrochrome/chrome ore production forecast increase is incremental due to increased output at Lalapanzi mine; c) Most companies in Zimbabwe could not reveal historical performance because it was erratic, however they optimistic that the future is promising
and therefor production could increase substantially. But are suspicious of giving away straight estimates; d) Maize is imported by a number of players: Manyame Milling, National Foods, Victoria Foods e) All commodity forecast projections are averaged between 10% and 100% in some instances in the next 3 years
Fuel Distorted by blending
Bulk Pipeline Import/local
Beira / Chiredzi
Noczim except direct imports by

97
Cost analysis – Rail freight (40’ ISO containers – 2 TEUs
Journey Details Port NRZ Cost CFM Cost TFR Cost Sea Freight Total Cost NRZ Cost (%)
NRZ Cost as % of Beira Route
CFM Cost (%)
TFR Cost (%)
Harare - Ningbo (China) Durban $1,832.00
$1,820.00
$460.00 $4,112.00 44.55 69.03 44.26
Harare - Ningbo (China) Beira $624.00 $930.00 $1,100.00 $2,654.00 23.51 23.51 35.04
Harare - Ningbo (China) Maputo $1,648.00
$1,108.00 $460.00 $3,216.00 51.24 62.09 34.45
Harare - Shanghai (China) Durban $1,832.00
$1,820.00
$460.00 $4,112.00 44.55 69.03 44.26
Harare - Shanghai (China) Beira $624.00 $930.00 $1,100.00 $2,654.00 23.51 23.51 35.04
Harare - Shanghai (China) Maputo $1,648.00
$1,108.00 $460.00 $3,216.00 51.24 62.09 34.45
Harare - Xingang (China) Durban $1,832.00
$1,820.00
$460.00 $4,112.00 44.55 67.75 44.26
Harare - Xingang (China) Beira $624.00 $930.00 $1,150.00 $2,704.00 23.08 23.08 34.39
Harare - Xingang (China) Maputo $1,648.00
$1,108.00 $520.00 $3,276.00 50.31 60.95 33.82
Notes
a) The above table illustrates rail freight price differentials that usually influence a client's choice of route to the port.
b) The commodity applied is 40' ISO containers used in general international traffic.
c) Whichever way one looks at it, NRZ charges appear to be on the pricy side.
d) The sea freight charges are based on the average of leading shipping lines.

Rail Services from A Customer’s & Railway Operator Perspective
98
Annexure A.8 Mozambique (Beira & Limpopo) market study survey data The interviews identified the following as primary commodities characterising regional transit trade: Export: containers (copper, tobacco etc.), Granite, ferrochrome, timber primarily from Zimbabwe and Zambia. Import: sugar, fertilizer wheatand general cargo The Port of Beira is Mozambique‟s second largest port and plays a key role as a regional transit port with the multi-modal Beira corridor servicing Zambia, Zimbabwe and the DRC. The Sena railway line provides a link to Malawi and the emerging Tete province. The port is an estuarial port with draft and navigational restriction that necessitate regular dredging. Port operations are managed by Cornelder de Mocambique – a joint venture between CFM and Cornelder holdings. The responses provided during the interview process are qualitative in nature compared to the quantitative data gleamed during earlier interviews in other countries (Zimbabwe and Zambia). As a result these responses do not intuitively fit within the report structure in which for each commodity identified the following information is included: Production/Demand volumes; Tariff and Charges; and Route Options. The table below highlights key findings, which show disparity in modal split for outbound (export) and inbound (import) traffic. The swing is significant with export dominated by road in some instances (90%:10%) and imports dominated by rail (85%:15%). This is not uniform across all organisations interviewed however it highlights the need for a larger comprehensive sample size to better characterise the nature of modal split along the Beira corridor. Key customer considerations affecting modal choice include the ability to meet shipping targets and although tariffs are considered to be cheaper in some instances, the rail service responsiveness (transit times) are not competitive in relation to road haulage. Other key constraints attributed to the loss in rail market share include the absence of real-time tracking leading to poor communication with clients and stakeholders, inadequate rolling stock and the lack of sufficient shunting locomotives at the port, inevitably causing delays to port related operations. The Port of Beira was historically designed for rail traffic and as such is not optimally suited for the current influx in road freight. Operationally there is an overwhelming preference for rail as the dominant mode for both inflow and discharge of the port.The port is currently undergoing expansion and there is an opportunity to strategically align hinterland rail development to optimise integration with port infrastructure. This would facilitate the development of holistic logistics system better suited to meet client needs.
Corridor Route: Beira Corridor, serving the hinterland: Zimbabwe, Zambia and DRC (Congo), as well as Malawi
Port: Beira Commodities: Containers ( copper, tobaccoetc), Fertilizer, Wheat, Granite, Sugar (
Containers and Granite are mainly for exports from Zambia and Zimbabwe, while the other cargo is for imports for Zimbabwe, Zambia, DRC and Malawi)
Mode of transport: Rail and road

99
1.1Customers and their views There are six (including the port operator) major customers at Beira. Here are their views and perception about rail service:
Customer
Person Interviewed
Date Interviewed
Contact Details
Commodities handled
Comments
Manica Mozambique
NicolauCacoMaquina ( Commercial manager)
18/12/2014
+258 825017950
Containers, ferts, sugar, wheat ferrochrome
Mainly in transit from and to Zimbabwe and Zambia
No tonnages given because the GM was on leave
Modal split 85% Rail,15% road for imports
90% Road and 10% rail for exports
Reason for modal split is that although rail rates are cheaper than road, exports have shipping targets to meet, which rail cannot, as they take too long transit time. ie 14 days from Harare and up to 25 days from Zambia. Hence road is favoured 90%.As for exports, because there are no strict deadlines, rail is favoured 85%. However, the shortage of appropriate wagons is another rail constraint, resulting in the choice of road. Another issue is lack of communication with clients by rail officials, customers in Beira have to rely on their customers in Zimbabwe and Zambia for any cargo movement information
MGS –Moz Global Services
MavoEddisson- CEO
19/12/2014
+258 826031542 Email:
Ferts, containers, ferrochrome, sugar, wheat, tallow, timber
Mostly transit from to Zambia and Zimbabwe. Modal split:
Mainly by rail 88% especially exports to overseas markets because of shipping deadlines.
Modal choice is determined by customer in origination and

Rail Services from A Customer’s & Railway Operator Perspective
100
destination country Problems with rail
service is three fold-poor transit times, complete lack of communication with customer, and shortage of wagons for loading imported cargo, resulting in customer incurring shipping demurrage charges and/or storage at the port
Tonnages handled could not be provided as computers were down, however, they promise to provide the figures end of December when back from holiday
MSC- Mediterranean Shipping ( Moz)
TimoteoSamunda ( Branch manager)
22/12/2014
+258 843800006, email: [email protected]
Containers only
Both exports and imports containers are handled.
Could not give total containers handled to/from other countries except that 1752 containers units were handled for Zimbabwe only during period January to November 2014.
Modal split is 3o% rail and 70% road. Reason is poor transit time, shortage of wagons and adequate shunting especially when ships have docked, resulting in delays to ships departure which affects other maritime operations elsewhere, as well as demurrage to customers. It must be note that shipping lines are not in the business of demurrage charges, but providing international shipping service and connectivity
Mocargo Mozambique
N/A No information could be obtained as directors had gone on holiday
SDS AMI N/A Directors on holiday.. No information could be obtained

101
Cornelder de Mozambique
17 to 18/12/2014
See separate comments and write-up in italics below:
Cornelder Views: Verbatim:
OrlandoGuilherme Belo, Operations Director for Cornelder de Mocambique, a 67%:33% JV between the Dutch company Cornelder Holdings and CFM, that manages the port of Beira. Again, Eng. Belo welcomed the survey being carried out while expressing the now familiar scepticism that he had received many proposals to improve the rail networks before (he has been at the port for 25 years). He said the Government had made a big mistake in awarding a concession of the Sena line (Beira to Tete Province) to the Indian company Rites as this was when things started to deteriorate on the rail network. He advised that Beira was designed for rail traffic and in the early days 95% of the cargo passing through the port came or went by rail; he would therefore much prefer to have increased rail bound freight as this is much easier to handle. Four years ago the port handled 45 roadtruck movements per day and this has now increased to 800 movements a day. However, the port is not suited to this road traffic, there is no safe place for the trucks to park outside the port so they all remain inside creating terrible congestion and hampering operations. This being said, the port is expanding, two new gantries were added last year to make a total of four, the container terminal is being doubled in size (the work underway) and there will be 600 metres of new quays for general cargo. With regular dredging the port, in theory, could take a panamax vessel but it usually handles regular container ships of up to 200 metres carrying around 5,000 TEU’s. He would be able to handle any cargo on offer very efficiently; if it was all copper and destined for the same ship it would be stored in one secure block to make for quick and easy loading. In addition, by keeping customers advised of the imports Beira was handling he could help ensure full back loads by rail and rail would know which agents to approach to secure the contracts. He agreed with the view that customers should acquire own shunt locomotive as this would avoid having to wait for CFM to position the train (they are currently using main line locos to shunt wagons!) which would be the only delaying factor in accessing the port. Customers are welcome on a tour of the port to see for themselves how it operates and the services provided, including and it appeared to be a very well-run and secure operation.
1.2 General Customers‟ Comments;
Poor transit times on rail Complete lack of communication on cargo whereabouts-wagons/cargo cannot be
traced Shortage of appropriate wagons when ships dock, thus delaying ship discharge Switching cargo or containers to other wagons without advising customers or freights
agents, several times these charges cause damage to cargo on arrival at destination, and the blame is put on the customer or their agents
Urgent need for collaboration and co-operation between customers( freights agents, railway operator ( CFM) and Cornelder)
Rail Services from A Customer’s & Railway Operator Perspective
102
Annexure A. 9 South Africa market study survey data
The interviews identified the following as primary commodities characterising regional transit trade: containers, fuel, sulphur, fertilizer and general cargo. The Port of Durban is the dominant gateway port for interregional trade, servicing Botswana, Zambia, Zimbabwe, Malawi, Mozambique and the DRC. The responses provided during the interview process are markedly qualitative in nature compared to the quantitative data gleamed during earlier interviews in other countries (Zimbabwe and Zambia). As a result these responses do not intuitively fit within the report structure in which for each commodity identified the following information is included: Production/Demand; Tariff and Charges; and Route Options. Key findings support the view that road transport is increasingly the mode of choice – 75:25 modal split indicatively in favour of road. In South Africa the decline of rail market share is largely attributed to inefficiencies attributed to Transnet‟s monopoly position coupled with high tariffs and capacity constraints. Although the legacy rail network is well integrated with port infrastructure and industrial clusters, there is a perception among customers that rail services and proposed future investments are primarily geared towards bulk industries (mining) characterised by large clients with significant bargaining power and regular freight loads. Against this backdrop road services are considered to be more flexible and better suited to meet a variety of transport needs. Transnet identifies some inefficiency within its operations however internally the decline in market share is largely attributed to capacity constraints forcing freight to road. As such Transnets strategy to reverse modal shift involves investment in rollingstock to increase rail availability coupled with a corridor-based approach with multimodal terminals providing an interface between road and rail. Commodity Copper is a high-value, low-volume commodity beneficiated and exported as copper
concentrate or cathodes to increase the value to weight ratio.
Production/Demand
762Kt of copper was produced in 2013. Forecast annual production is expected to double
over the next 5 years (1.5Mt) owing to new mining investments. This included First Quantum
Mines new mine with a capacity of 300 Mt per annum, scheduled to come online in 2015.
Figure 3.1 below illustrates copper mining activity concentrated along the copperbelt in
Zambia and the DRC. DRC produced 960Kt in 2013 however this is forecast to increase to
2Mtpa over the next 5years.

103
Tariffs and charges
Trucking is the primary mode for handling both concentrate and cathodic copper. Although
security remains a key concern with road haulage, good transit time is achieved at
competitive charges – US$95 per tonne.
Route Options
Competition of the copper belt trade shows significant overlap due to corridor connectivity
and copper trade characteristics. The relatively high price of beneficiated copper is able to
absorb logistics costs over relatively long distances.
Corridor Route:North South Corridor/and Maputo Corridor, serving the hinterland: Countries Serviced: Botswana, Democratic Republic of Congo, Malawi, Mozambique,
Zambia and Zimbabwe Port: Durban Commodities: Containers, Fertilizer, Sulphur,General Cargo, Fuel, Vehicles Mode of transport: Rail, Road

Rail Services from A Customer’s & Railway Operator Perspective
104
2. Customers and their views Here are their views and perception about rail service:
Customer Company Type
Person Interviewed
Contact Details Commodities Handled
Comments
Concargo Logistics, Forwarding and Clearing
Shane Korsten +27219309160 [email protected]
Fertilizer, Sulphur, Fuel, Containers , General Cargo
Serve Botswana, DRC, Malawi, Mozambique, Zambia and Zimbabwe utilizing intermodal mix of rail and road.
Intermodal split is at 20% Rail and 80% Road in General for import and export of the commodities handled.
Tonnages for specific materials cannot be supplied as written permission is required.
Rail is used for the movement of goods inside South Africa. This is supported by a legacy system of having well serviced rail sidings at industrial areas where sulphur, fertilizer and fuel are produced. These are then moved to the interim warehouse facilities owned by the company,where they are up lifted mainly by road and partly by rail
Rail is not favourable as it is operated by Transnet, which is seen to be inefficient. The efficiency of Transnet is 60-70%. Furthermore the tariffs are high. Furthermore Transnet will serve only to Zimbabwe and Mozambique. Non through working by same operator or same locos and crews from origin to destination has negative impact, which results in increased costs to customers due to change over delays , and poor transit times
CSIR Logistics Research
Nadia Viljoen +27128412000 [email protected]
Logistics Research
Research has shown that Transnet monopoly operation has resulted in great inefficiencies. However it must be stressed that Transnet is still the most superior operator in the SADC region.
The intermodal rail system operates best within South Africa and Transnet has begun to structure its business to focus on corridors, which is supposed to improve efficiencies but is not really. It tends to work best for large clients within South Africa and not for cross border operations
Road vs Rail modal split is at 65:35 respectively, because of perceived rail inefficiencies
Use of rail haulage is best decided by distance and volumes to be transported. When there is a high volume of goods to move over a long distance, it is best to use rail. However when the distance is relatively short (less than 500km) and the goods to be transported are of a low volume, road should be considered.
It is relatively difficult to get space/slots to transport goods on a train regardless of the commodity type. No plausible reason is given by Transnet
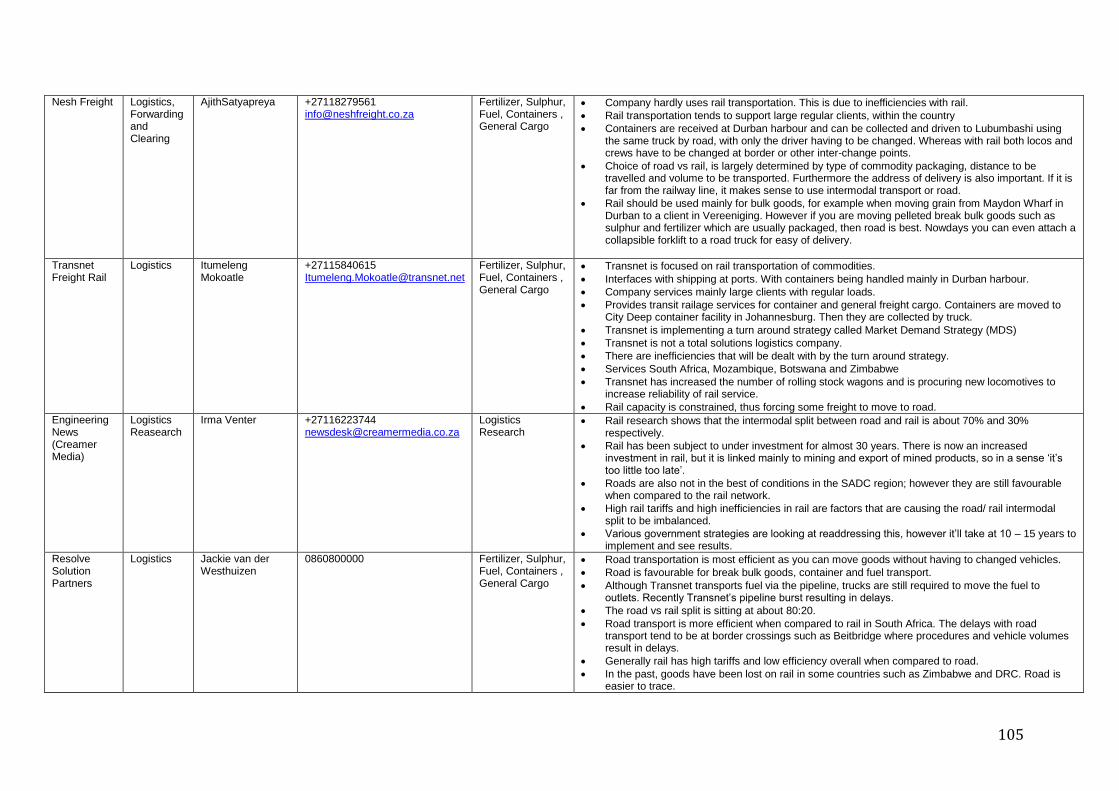
105
Nesh Freight Logistics, Forwarding and Clearing
AjithSatyapreya +27118279561 [email protected]
Fertilizer, Sulphur, Fuel, Containers , General Cargo
Company hardly uses rail transportation. This is due to inefficiencies with rail.
Rail transportation tends to support large regular clients, within the country
Containers are received at Durban harbour and can be collected and driven to Lubumbashi using the same truck by road, with only the driver having to be changed. Whereas with rail both locos and crews have to be changed at border or other inter-change points.
Choice of road vs rail, is largely determined by type of commodity packaging, distance to be travelled and volume to be transported. Furthermore the address of delivery is also important. If it is far from the railway line, it makes sense to use intermodal transport or road.
Rail should be used mainly for bulk goods, for example when moving grain from Maydon Wharf in Durban to a client in Vereeniging. However if you are moving pelleted break bulk goods such as sulphur and fertilizer which are usually packaged, then road is best. Nowdays you can even attach a collapsible forklift to a road truck for easy of delivery.
Transnet Freight Rail
Logistics Itumeleng Mokoatle
+27115840615 [email protected]
Fertilizer, Sulphur, Fuel, Containers , General Cargo
Transnet is focused on rail transportation of commodities.
Interfaces with shipping at ports. With containers being handled mainly in Durban harbour.
Company services mainly large clients with regular loads.
Provides transit railage services for container and general freight cargo. Containers are moved to City Deep container facility in Johannesburg. Then they are collected by truck.
Transnet is implementing a turn around strategy called Market Demand Strategy (MDS)
Transnet is not a total solutions logistics company.
There are inefficiencies that will be dealt with by the turn around strategy.
Services South Africa, Mozambique, Botswana and Zimbabwe
Transnet has increased the number of rolling stock wagons and is procuring new locomotives to increase reliability of rail service.
Rail capacity is constrained, thus forcing some freight to move to road.
Engineering News (Creamer Media)
Logistics Reasearch
Irma Venter +27116223744 [email protected]
Logistics Research
Rail research shows that the intermodal split between road and rail is about 70% and 30% respectively.
Rail has been subject to under investment for almost 30 years. There is now an increased investment in rail, but it is linked mainly to mining and export of mined products, so in a sense „it‟s too little too late‟.
Roads are also not in the best of conditions in the SADC region; however they are still favourable when compared to the rail network.
High rail tariffs and high inefficiencies in rail are factors that are causing the road/ rail intermodal split to be imbalanced.
Various government strategies are looking at readdressing this, however it‟ll take at 10 – 15 years to implement and see results.
Resolve Solution Partners
Logistics Jackie van der Westhuizen
0860800000 Fertilizer, Sulphur, Fuel, Containers , General Cargo
Road transportation is most efficient as you can move goods without having to changed vehicles.
Road is favourable for break bulk goods, container and fuel transport.
Although Transnet transports fuel via the pipeline, trucks are still required to move the fuel to outlets. Recently Transnet‟s pipeline burst resulting in delays.
The road vs rail split is sitting at about 80:20.
Road transport is more efficient when compared to rail in South Africa. The delays with road transport tend to be at border crossings such as Beitbridge where procedures and vehicle volumes result in delays.
Generally rail has high tariffs and low efficiency overall when compared to road.
In the past, goods have been lost on rail in some countries such as Zimbabwe and DRC. Road is easier to trace.
2. General Comments Summary
Rail transportation is inefficient when compared to road transportation. With
rail transport having an efficiency of around 60%. Modal split in South Africa for road and rail is at about 70:30 split. Modal split changes once goods are moved to Botswana, DRC, Malawi,
Mozambique, Zambia and Zimbabwe Rail is best used for large volumes over a long distance and with regular
volumes. Rail tariffs are high with the service not being very efficient. Value for money
is low on rail. Road transportation is most favourable, more especially for break bulk cargo,
liquid bulk and container traffic. Fertilizer and sulphur are generally packaged in pallets and thus are considered break bulk.

107
Annexure A. 10
Analysis of customer responses FINDINGS AND ANSLYSIS OF CUSTOMER SERVICE DELIVERY BY RAILWAYS IN A CORRIDOR 1. BACKGROUND
There is concern amongst SARA members, specifically the rail operators, that the
distribution/share of transit rail traffic to/from the SADC hinterland through the
ports, to/from overseas markets, is not being fairly shared between the rail
systems of the region. Railways believe that they are offering convenient and
relatively cheaper transportation services to the market yet their market share
has dwindled over the years from the highs of +60-75% in the mid eighties to a
current of +/- 15% due to market perception of poor service and lack
competitiveness.
In seeking to resolve the problem of service realignment the SARA Board
simultaneously wants to identify and address the underlying problem of lost rail
market share so that the usage of rail transport systems in the region can be
optimized for the benefit of all. It is in this regard that a questionnaire was
developed for customers to give feedback and their views on the reasons for the
drop in rail market share and what, in their view, railway organizations needs to
do to restore market confidence and grow market share. At the same time
railways need to obtain a good feel of volume projections of future demand for
railway services and the challenges customers face when dealing with the
railways.
Each railway administration was to identify its top 5 customers engaged in
import/export business and distribute a customer service delivery
questionnaire. The customers were to be identified by active SARA members
and the stratified sample size came out at 50 customers.
Rail Services from A Customer’s & Railway Operator Perspective
108
2. RESEARCH RESULTS
The research results would need to be complemented by further findings and
clarifications , where necessary, from interviewing of some customers moving
import/export cargo along specific corridors, perusal of pertinent historical
literature/documentation from internal and external sources and analysis of the
data gathered from railway operators through questionnaires and interviews.
2.1 Respondents
Respondents were received from customers of the active railway SARA members
using the following corridors: Beitbridge, Beira, Goba, Limpopo, Namibia,
Plumtree and Richards Bay. Total customers who responded were 27.
2.2 Distribution of the Respondents
The distribution of the response per corridor is shown in table 1 below. 48%
(24) of the sample size (50) responded. National Railways of Zimbabwe (NRZ)
had the highest number of customer responses.
Table 1: Distribution of responses
Corridor Active SARA members in a corridor
Railways whose Customers responded
No of customers that responded
Beira CFM,NRZ& ZRL NRZ 3
Beitbridge NRZ, BBR, TFR, SNCC& ZRL NRZ &ZRL 8
Dar es Salaam TAZARA& ZRL 0 0
Goba SR& CFM SR 1
Limpopo NRZ, CFM& BR, ZRL NRZ 5
Namibia TNHL& TFR TNHL 2
Plumtree TFR, BR, NRZ& ZRL BR & NRZ 3
Richards Bay SR& TFR SR 2
Ressano Gracia CFM& TFR 0 0
Local traffic NRZ NRZ 3
Total 10 Railways 5 Railways 27 customers

109
2.3 Findings and Analysis
The findings were grouped according to themes derived from the research
questions and the corridors the customers use to transport their import/export
freight and the country they operate from. For exports traffic the origin was the
country of registration for the exporting company whilst for imports the
destination is the source market for imports. . Based on the questionnaire the
following indicators were identified as giving the feedback being sort from
customers on rail service quality and traffic volume projections for the next four
years.
i. Availability of appropriate facilities e.g. sidings and loading and off
loading facilities
ii. Products exported and imported
iii. Distribution of traffic volumes
iv. Resources required and availability
v. Volumes projections for the next four years
vi. Rating of rail services
vii. Comparison of rail to road
viii. Determinants of mode of choice
ix. Relationship with Service Provider
x. Suggestions to improve services by rail
The analysis was based on these indicators.
2.3.1The Research
Most railway administrations had problems in getting their top five customers
respond to the questionnaire. Most RAs indicated that the resistance of
customers was partly due to a general feeling of distrust in regards to railway
administrations re confidentiality and the fact that most customers were aligned
to and satisfied with road services for their imports and/or exports needs. The
questionnaire was also considered too long, requiring consultations with more
than one department. Hence customers felt that it was a cumbersome document
to complete. The manner in which some of the questions were completed
portrayed lack of seriousness of customers as some questions were half
completed and there were contradictions noted especially on question 13 and
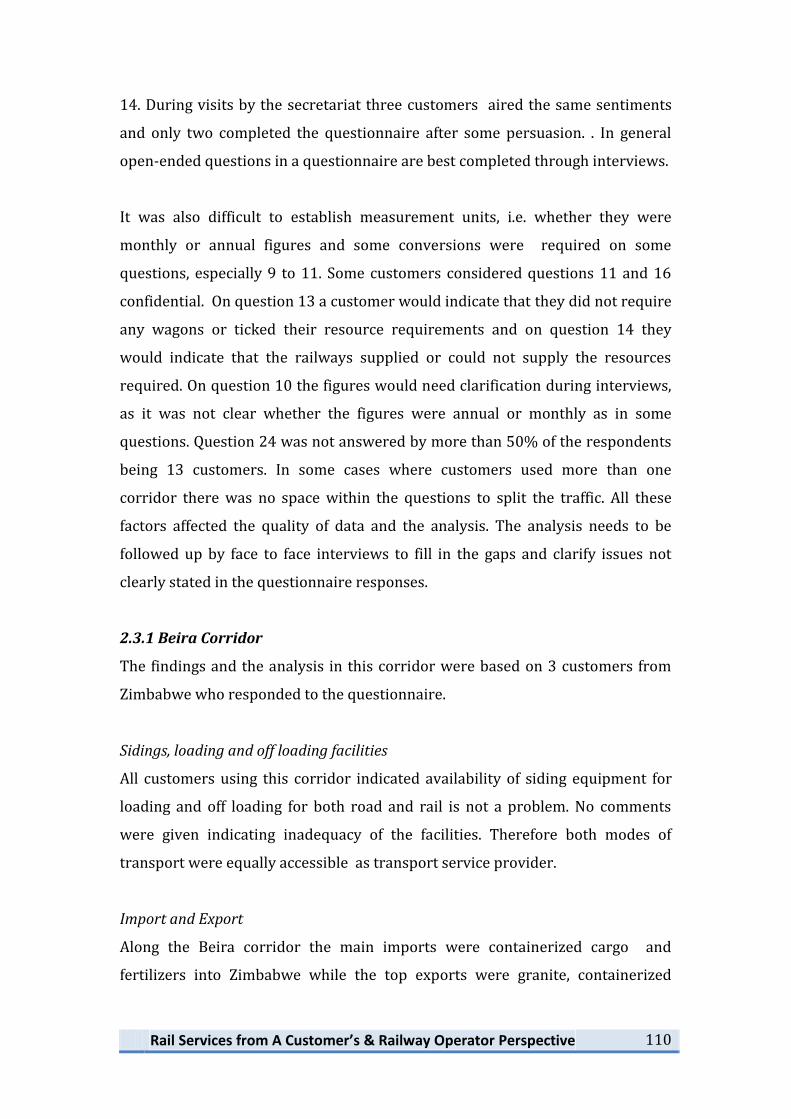
Rail Services from A Customer’s & Railway Operator Perspective
110
14. During visits by the secretariat three customers aired the same sentiments
and only two completed the questionnaire after some persuasion. . In general
open-ended questions in a questionnaire are best completed through interviews.
It was also difficult to establish measurement units, i.e. whether they were
monthly or annual figures and some conversions were required on some
questions, especially 9 to 11. Some customers considered questions 11 and 16
confidential. On question 13 a customer would indicate that they did not require
any wagons or ticked their resource requirements and on question 14 they
would indicate that the railways supplied or could not supply the resources
required. On question 10 the figures would need clarification during interviews,
as it was not clear whether the figures were annual or monthly as in some
questions. Question 24 was not answered by more than 50% of the respondents
being 13 customers. In some cases where customers used more than one
corridor there was no space within the questions to split the traffic. All these
factors affected the quality of data and the analysis. The analysis needs to be
followed up by face to face interviews to fill in the gaps and clarify issues not
clearly stated in the questionnaire responses.
2.3.1 Beira Corridor
The findings and the analysis in this corridor were based on 3 customers from
Zimbabwe who responded to the questionnaire.
Sidings, loading and off loading facilities
All customers using this corridor indicated availability of siding equipment for
loading and off loading for both road and rail is not a problem. No comments
were given indicating inadequacy of the facilities. Therefore both modes of
transport were equally accessible as transport service provider.
Import and Export
Along the Beira corridor the main imports were containerized cargo and
fertilizers into Zimbabwe while the top exports were granite, containerized
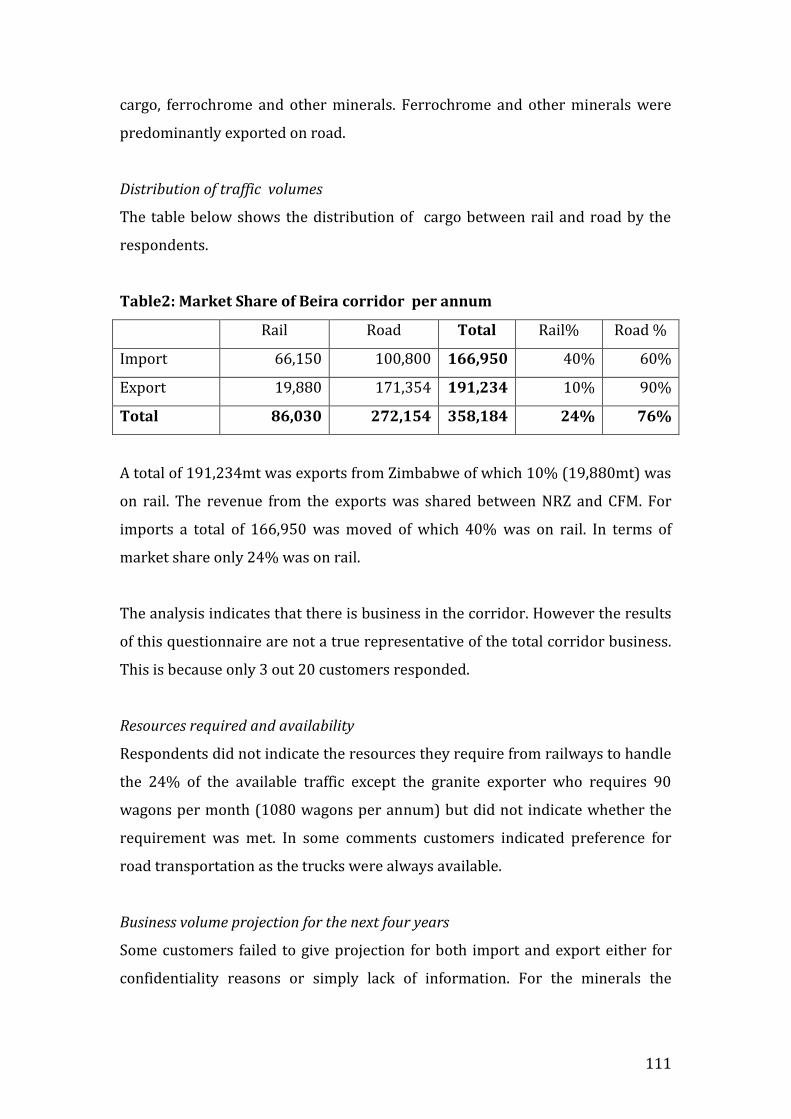
111
cargo, ferrochrome and other minerals. Ferrochrome and other minerals were
predominantly exported on road.
Distribution of traffic volumes
The table below shows the distribution of cargo between rail and road by the
respondents.
Table2: Market Share of Beira corridor per annum
Rail Road Total Rail% Road %
Import 66,150 100,800 166,950 40% 60%
Export 19,880 171,354 191,234 10% 90%
Total 86,030 272,154 358,184 24% 76%
A total of 191,234mt was exports from Zimbabwe of which 10% (19,880mt) was
on rail. The revenue from the exports was shared between NRZ and CFM. For
imports a total of 166,950 was moved of which 40% was on rail. In terms of
market share only 24% was on rail.
The analysis indicates that there is business in the corridor. However the results
of this questionnaire are not a true representative of the total corridor business.
This is because only 3 out 20 customers responded.
Resources required and availability
Respondents did not indicate the resources they require from railways to handle
the 24% of the available traffic except the granite exporter who requires 90
wagons per month (1080 wagons per annum) but did not indicate whether the
requirement was met. In some comments customers indicated preference for
road transportation as the trucks were always available.
Business volume projection for the next four years
Some customers failed to give projection for both import and export either for
confidentiality reasons or simply lack of information. For the minerals the
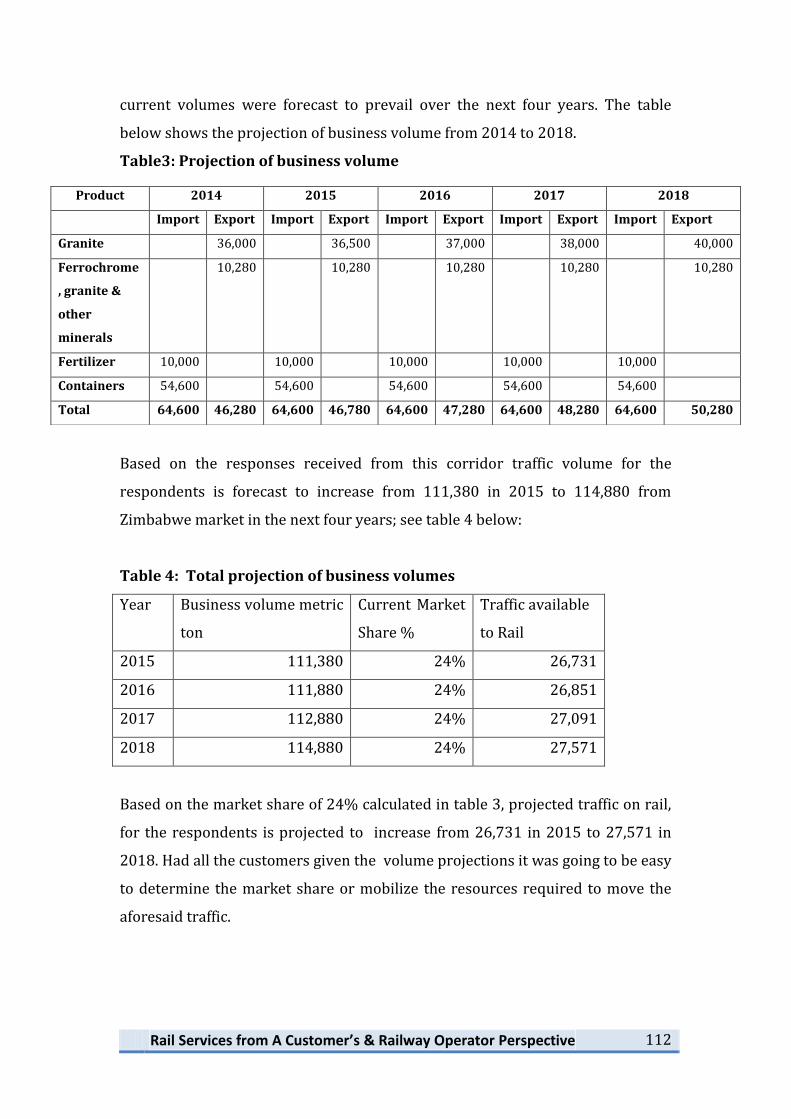
Rail Services from A Customer’s & Railway Operator Perspective
112
current volumes were forecast to prevail over the next four years. The table
below shows the projection of business volume from 2014 to 2018.
Table3: Projection of business volume
Based on the responses received from this corridor traffic volume for the
respondents is forecast to increase from 111,380 in 2015 to 114,880 from
Zimbabwe market in the next four years; see table 4 below:
Table 4: Total projection of business volumes
Year Business volume metric
ton
Current Market
Share %
Traffic available
to Rail
2015 111,380 24% 26,731
2016 111,880 24% 26,851
2017 112,880 24% 27,091
2018 114,880 24% 27,571
Based on the market share of 24% calculated in table 3, projected traffic on rail,
for the respondents is projected to increase from 26,731 in 2015 to 27,571 in
2018. Had all the customers given the volume projections it was going to be easy
to determine the market share or mobilize the resources required to move the
aforesaid traffic.
Product 2014 2015 2016 2017 2018
Import Export Import Export Import Export Import Export Import Export
Granite 36,000 36,500 37,000 38,000 40,000
Ferrochrome
, granite &
other
minerals
10,280 10,280 10,280 10,280 10,280
Fertilizer 10,000 10,000 10,000 10,000 10,000
Containers 54,600 54,600 54,600 54,600 54,600
Total 64,600 46,280 64,600 46,780 64,600 47,280 64,600 48,280 64,600 50,280
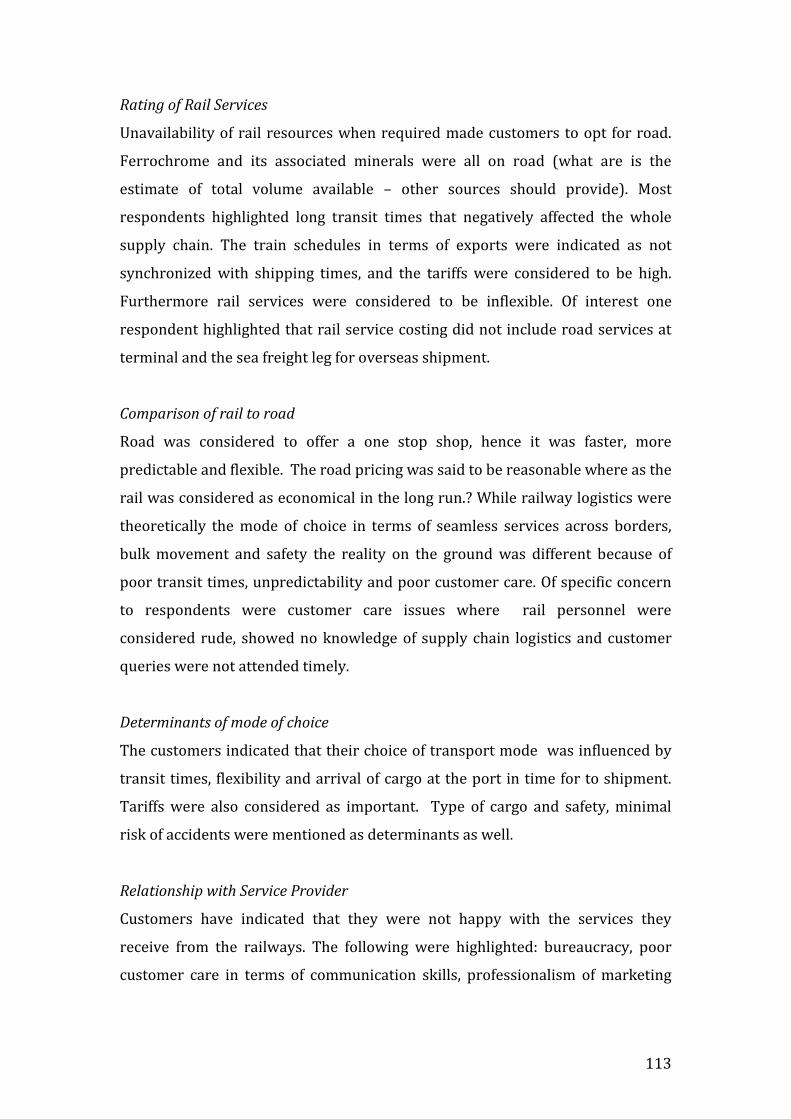
113
Rating of Rail Services
Unavailability of rail resources when required made customers to opt for road.
Ferrochrome and its associated minerals were all on road (what are is the
estimate of total volume available – other sources should provide). Most
respondents highlighted long transit times that negatively affected the whole
supply chain. The train schedules in terms of exports were indicated as not
synchronized with shipping times, and the tariffs were considered to be high.
Furthermore rail services were considered to be inflexible. Of interest one
respondent highlighted that rail service costing did not include road services at
terminal and the sea freight leg for overseas shipment.
Comparison of rail to road
Road was considered to offer a one stop shop, hence it was faster, more
predictable and flexible. The road pricing was said to be reasonable where as the
rail was considered as economical in the long run.? While railway logistics were
theoretically the mode of choice in terms of seamless services across borders,
bulk movement and safety the reality on the ground was different because of
poor transit times, unpredictability and poor customer care. Of specific concern
to respondents were customer care issues where rail personnel were
considered rude, showed no knowledge of supply chain logistics and customer
queries were not attended timely.
Determinants of mode of choice
The customers indicated that their choice of transport mode was influenced by
transit times, flexibility and arrival of cargo at the port in time for to shipment.
Tariffs were also considered as important. Type of cargo and safety, minimal
risk of accidents were mentioned as determinants as well.
Relationship with Service Provider
Customers have indicated that they were not happy with the services they
receive from the railways. The following were highlighted: bureaucracy, poor
customer care in terms of communication skills, professionalism of marketing

Rail Services from A Customer’s & Railway Operator Perspective
114
personal, lack of appreciation and knowledge of total logistics solutions. These
points were not only mentioned but emphasized by all respondents.
Issues to improve services by rail
Customers raised the following as requiring attention in order to improve rail
services through;
Availing rolling stock on request
Predetermining and adhering to set transit times
Synchronizing train and shipping schedules
Improving on customer care
Installing a regional cargo tracking system
Establishing one stop shop for cross border traffic and offer
quotations within 3 hours
Railways to offer total logistics solution as opposed to transportation
Considering flexible market related pricing that takes cognizance of
back loads
Appreciating and understanding industry cost structures for its
customers especially agriculture and mining
Making railway services more predictable and reliable
2.3.2 Beitbridge Corridor
The findings and the analysis in this corridor were from only 8 customers who
responded out of a sample of 25; hence it is not reflective of the total corridor
and the analysis focused on NRZ and ZRL. One of the customers also used the
Beira corridor. Statistics were also received from Zimbabwe Tobacco Association
(ZTA) on tobacco exports.
Sidings, loading and off loading facilities
All customers indicated that they were satisfied with the siding and facilities for
loading and off loading for road and rail. The customers however indicated that
the designs of the siding were meant primarily for rail. The capacity was
adequate for the current and projected business. One customer indicated that
they used manual labour for loading on rail.

115
Import and Export
The customers who completed questionnaires imported mining chemicals,
fertilizers and associated chemicals, fuels, containerized cargo, clinker, and
exported copper, cathodes and copper concentrate, timber and cotton. ZTA is
not a major customer of rail and all tobacco was exported as containerized or
break-bulk on road.
Distribution of business volume
Of the customers interviewed that use the Beitbridge corridor the total imports
by rail were 69% (299,414) and exports were 91% (119,400).
Table 5: Market Share along Beitbridge Corridor
Rail Road Total Rail% Road %
Import 299,414 136,800 436,214 69% 31%
Export 119,400 12,000 131,400 91% 9%
Total 418,814 148,800 567,614 74% 26%
The current market share of rail is 74% and is based on the traffic moved by rail
for 7 of the 8 customers. One customer from Zambia did not state the business
volumes moved as it was considered confidential. How do we treat this info re
market share?
Resources required and availability
The resources necessary to handle the cargo, namely wagons, locomotives,
wagon labels, tarpaulins and ropes, were considered inadequate. Some
customers provided their own tarpaulins to meet own requirements. Shortage of
rolling stock had forced customers to put some of their cargo on road. Shortage
of fuel on rail has also affected the flow of traffic.
Business volume projection for the next four years
Increase in business volumes is expected with import of clinker expected to
begin in 2016 thereby giving the railways enough time to plan for this traffic.
Some customers failed to give projection for both imports and exports, as it was

Rail Services from A Customer’s & Railway Operator Perspective
116
either confidential or there was lack of information. Timber was exported from
Zimbabwe to Zambia. Copper export and imports of chemicals for Zambia were
expected to increase by 8 -10% in the next four years. The table below shows the
projection of business volume from 2014 to 2018.
Table6: Projection of business volume
According to the current market share of 74% business volume is expected to
grow by 13% (80,040) from 634,419mt in 2015 to 714,459mt in 2018 and this is
shown in table 7 below:
Table 7: Total projection of business volumes
Year Business volume
metric ton
Current Market
share %
Traffic available to
rail
2015 634,419 74% 469,470
2016 712,239 74% 527,057
2017 714,459 74% 528,700
2018 714,459 74% 528,700
According to the current market share the traffic on rail will increase from
469,470mt in 2015 to 528,700mt in 2018. Had all the customers given the
business volume projections it was going to be easy to determine the market
Product 2014 2015 2016 2017 2018
Import Export Import Export Import Export Import Export Import Export
Clinker 15,000 15,000 20,000
Containers 164,724 163,848 163,848 163,848 163,848
Timber 10,500 12,000 10,800 12,000 12,000
Fertilizer 217,000 342,440 400,620 400,800 400,800
Copper 60,000 64,800 64,800 65,400 66,000
Fuels 8,011 8,011 8,011 8,011 8,011
Chemicals 24,000 25,920 26,160 26,400 26,400
Tobacco 8,750 15,000 20,000 20,000 20,000
Cotton 2,400 2,400 2,400 2,400 2,400
Total 413,735 81,650 540,219 94,200 613,639 95,600 614,059 100,400 614,059 100,400

117
share or mobilize the resources. The table above shows that there is growth in
business volumes and railways need to prepare themselves to move this traffic.
Rating of Rail Services
In general rail performance in this corridor received negative comments.
Respondents highlighted the long transit times that distort the entire supply
chain, the poor maintenance of wagons rendering them unfit on regulated
networks, resulting in delayed deliveries. Shortage of fuel and speed restrictions
on some sections of the network due to non-maintenance had also been said to
worsen the performance of railways. The railways did not stick to train
schedules making them unpredictable and unreliable. All in all the lack of
capacity and resources affected the production of some customers, as they had to
wait for inputs.
The performance of railways was also affected by poor customer care. Most
customers in the corridor complained about poor responses to their queries,
bureaucracy, unprofessionalism by some marketing personnel and lack of
appreciation of the total logistics in the supply chain. The customers also raised
the issue of compensation on loss or/and damaged cargo.
Comparison of rail to road
The railways were considered more suitable for bulk and high-risk goods.
Customers had different opinions on the security and safety,transit times,
flexibility, predictability and reliability,some preferring road and others opting
for rail. Overall there was unanimity on the point that road services were faster,
more flexible and cheaper. Some customers indicated that Beitbridge corridor
was more expensive compared to other corridors and road. The customers also
commented that some railways priced the rail out of business by not considering
road as alternative mode of transport available to customers if they set tariffs
high.

Rail Services from A Customer’s & Railway Operator Perspective
118
Determinants of mode of choice
The following were considered as determinants, type of product, capacity, price,
flexibility, lead time and customer’s choice. These were favourable to rail except
cost and flexibility. One customer who uses both Beira and Beitbridge indicated
that he might move all his traffic to Beira unless the Beitbridge corridor
members change their attitude towards customers and reduce tariffs.
Relationship with Service Provider
Customer relations along the corridor were considered poor. Customers were
not being updated on cargo position along the corridor or being provided with
an accurate delivery or lead-time. The complaints of poor customer care was as
per the Beira corridor. The interaction of customers and rail employees across
the region showed unmotivated workforce and unskilled marketing personnel.
Issues to improve rail services
The following were highlighted as requiring attention to improve rail services
by:
Signing Customer Service Charter to improve customer relations
Improving reliability and availability of rolling stock.
Removing of bottlenecks along the corridor
Establishing one stop shops for transit traffic
Appreciating and understanding each industry’s cost structure
Providing and maintaining train schedules and synchronizing the
schedules with shipping times
Ensuring that agreements with customers are attained
Improving locomotive wagon ratios and increasing wagon supply across
the region
Using Information and Communication Technologies as communication
and decision making tool
Considering market prices when coming up with rates
Motivating and recruiting qualified marketing personnel

119
2.3.3 Limpopo Corridor
The 4 customers who responded to the questionnaire were all from Zimbabwe.
The analysis is not a full representative of the corridor business.
Sidings, loading and off loading facilities
All customers indicated that had sidings with off loading and off loading facilities
for both road and rail.
Import and Export
The commodities exported by these customers were raw sugar, ferrochrome,
ores, reductants and imports were fuels, fertilizer, lime and coal from Botswana.
Distribution of business volume
Table 8: Market Share along Limpopo Corridor
Rail Road Total Rail% Road
Import 96,000 21,600 117,600 82% 18%
Export 790,000 - 790,000 100% -
Total 886,000 21,600 907,600 98% 2%
The current rail market share from data gathered from this corridor is 98%
(886,000mt of 907,600mt)
Resources required and availability
Of the 4 customers only three indicated their resource requirements as 40
tankers and 1,100 high-sided iron wagons per month. Most of the customers
indicated that the supply of the required resources was erratic and unreliable
due to breakdowns and shortage of fuel.
Business volume projection for the next four years
Mineral production was expected to increase in the next four years and sugar
was expected to increase by 10000mt. The sugar production and export volumes
would dependent on rainfall partners and international market trends.
Production of ferrochrome is expected to increase between 72,000 to 96,000mt

Rail Services from A Customer’s & Railway Operator Perspective
120
per annum as from 2015. Fuel importation by rail is expected to increase as well.
These projections show that there would be business for the railways.
Table 8: Projection of business volume
Imports are expected to increase from 96,000mt in 2014 to 117,600 by 2018 and
exports would increase from 750,000mt to 910,000mt by 2018.
Table 9: Total projection of business volumes
Year Business volume
metric ton
Current market
share %
Projected traffic on
rail
2015 896,000 98% 878,080
2016 967,600 98% 948,248
2017 977,600 98% 958,048
2018 1,027,600 98% 1,007,048
As per table 9 above business projection will increase from 896,000mt in 2015
to 1,027,600mt in 2018. Based on the current rail market share of 98% the
business volume on rail is expected to grow by 19% (128,968mt) from
846,000mt in 2015 to 1,007,048mt in 2018 as shown in table 9 above. Had all
the customers responded to the questionnaire it was going to be easy to
determine the market share or mobilize the resources. The table above shows
that there is growth in business volumes and railways need to prepare
themselves to move this traffic.
Product 2014 2015 2016 2017 2018
Import Export Import Export Import Export Import Export Import Export
Sugar 570,000 560,000 610,000 620,000 670,000
Ferrochrome 180,000 240,000 240,000 240,000 240,000
Coal 72,000 72,000 72,000 72,000 72,000
Fuels 24,000 24,000 45,600 45,600 45,600
Total 96,000 750,000 96,000 800,000 117,600 850,000 117,600 860,000 117,600 910,000
121
Rating of Rail Services
In rating the rail services according to tariffs, capacity, convenience, transit,
predictability and safety most of the customers rated predictability as very poor
and capacity. Transit times was not an issue but required to be improved.The age
and constant breakdown of rolling stock affected the quality of service.
Comparison of rail to road
On Limpopo corridor most customers considered rail as cheap but unreliable
and unpredictable. Most customers said road was faster, predictable, reliable and
flexible but costly.
Determinants of mode of choice
Rail was the most preferred mode of transport in terms of cost and convenience.
Relationship with Service Provider
It was indicated that there was need to improve communication between the
railways and customers and use internet was recommended.
Issues to improve services by rail
Railways need to improve on;
Maintenance of locomotives regularly to reduce breakdowns
Reliability by replacing or refurbish rolling stock
Transit times
Supply of wagons as and when requested
Add ICT in the value chain
2.3.4 Plumtree Corridor
The findings and the analysis in this corridor were based on 2 customers from
Botswana and one Zimbabwe.

Rail Services from A Customer’s & Railway Operator Perspective
122
Sidings, loading and off loading facilities
All customers indicated that had sidings with off loading and off loading facilities
for both road and rail. The capacity and design were inadequate for the current
and projected business.
Import and Export
Coal was exported to South Africa, Zimbabwe and Zambia from Botswana and r
fuel was imported in Botswana.
Distribution of business volume
The distribution of the business volumes between the road and rail is shown in
the table below. The import of coal into Zimbabwe is included in the export from
Botswana customer.
Table 10: Market Share along Plumtree Corridor
Rail Road Total Rail % Road %
Import 213,960 13,440 227,400 94% 6%
Export 301,800 114,840 416,640 72% 28%
Total 515,760 128,280 644,040 80% 20%
The above table shows that the rail market share is 80% (515,760)of the traffic
from the 3 customers totalling 644,040mt.
Resources required and availability
Resources required are tankers and both high and drop sided iron wagons. 1000
tankers are required per month and 46,500 wagons per month for coal. Wagons
and tankers have been supplied when requested.
Business volume projection for the next four years
No projections were given for the fuels. It is projected that mining operations
would expand to meet the demand of coal in the region and the customer
considers the railways as strategic partners to manage the increased business
volume. Railways are then expected to offer competitive rates.

123
Coal traffic is projected to grow from 52% from 312,000mt to 600,000mt in the
next four years as per table 11 below:
Table11: Projection of business volume
Table 12: Total projection of business volumes
Year Business volume metric ton Current rail market share
%
Projected traffic on rail
2015 400,000, 80% 320,000
2016 450,000 80% 360,000
2017 500,000 80% 400,000
2018 600,000 80% 480,000
The table 12 above shows the projected rail traffic on the basis of the current rail
market share of 80%.
Rating of Rail Services
The rating of rail services was dependent on the commodity where one customer
indicated that safety was good the other with high-risk commodity ranking
safety as poor. Customers expected seamless rail services across the region.
Comparison of rail to road
The type of commodities, fuels and coal required bulk movement hence they all
preferred rail. Road is considered faster flexible but lack capacity for bulk
movement and its costly for low value bulk commodities.
Determinants of mode of choice
The determinants for transport mode of choice were bulk movement, cost,
convenience and transit times.
Product 2014 2015 2016 2017 2018
Import Export Import Export Import Export Import Export Import Export
Coal 312,000 400,000 450,000 500,000 600,000
Total
Rail Services from A Customer’s & Railway Operator Perspective
124
Relationship with Service Provider
Railways were considered as professionally run but would expect a customer
centered approach to improve railway services.
Issues to improve services by rail
To improve rail services customers expected railways to review the way they do
business by:
Offering competitive rates
Improving wagon turn around times
Providing adequate, fit for purpose rolling stock
Instil a more customer centered approach towards customers
Develop and implement a more long term strategic marketing strategy
Providing rail seamless service in the region
Opening up rail operations to competition
Adopting ICT for communication and decision making
Addressing missing links
2.3.5 Namibia Corridor
The findings and the analysis in this corridor were based on two major
customers of TNHL.
Sidings, loading and off loading facilities
All customers owned the sidings and have off loading and loading facilities for
both road and rail. The capacity was adequate for the current and projected
business.
Import and Export
Imported goods were food stuffs like maize, wheat, sugar, rice and mahangu and
the exported goods were minerals, fuel, fertilizers and sulphuric acid.

125
Distribution of business volume
Table 13: Market Share along Namibia Corridor
Rail Road Total Rail% Road %
Import 60,000 65,280 125,280 48% 52%
Export 7,392 - 7,392 100% -
Total 67,392 65,280 132,672 51% 49%
Current business volume available for road and rail is 132,762mt. Rail has 51%
of the current market share.
Resources required and availability
The following resources were required per month for the current traffic, 50
drop-sided iron wagons, 29 flatbed wagons, 245 K-closed, 27 fuel tankers, 90
acid tankers and 31 fertilizer tankers. The resources are not always available
when requested. One customer has cargo that requires FZ wagons and railways
are not supplying.
Business volume projection for the next four years
Table14: Projection of business volume
Imports are expected to grow from 313,858mt to 319,858mt by 2018 and
exports will remain the same.
Product 2014 2015 2016 2017 2018
Import Export Import Export Import Export Import Export Import Export
Wheat 44,000 44,000 45,700 46,700 47,600
Maize 30,000 30,600 31,200 31,800 32,400
Fuel 12,818 12,818 12,818 12,818 12,818
Sulphur 216,000 216,000 216,000 216,000 216,000
Fertilizers 11,040 11,040 11,040 11,040 11,040
Minerals 25,200 25,200 25,200 25,200 25,200
Mixed load 9,264 9,264 9,264 9,264 9,264
Total 313,858 34,464 314,458 34,464 316,758 34,464 318,358 34,464 319,858 34,464

Rail Services from A Customer’s & Railway Operator Perspective
126
Table 15: Total projection of business volumes
Projected traffic on rail is expected to increase by 2,754mt from 2015 to 2018.
Rating of Rail Services
There was a mixed perception on the rating of the rail services. What was
common from both customers was unpredictability. On ranking the rail services
against other modes of transport all customers indicated that tariffs, capacity
and predictability were important when rating services on offer.
Comparison of rail to road
On comparing rail to road as the mode of choice for transportation of goods
tariffs, availability, reliability and safety would be considered.Road was
considered as being reliable and available. Because of poor services and lack of
resources rail is no longer the transport mode of choice.
Determinants of mode of choice
Determinants considered for rail would be capacity, predictability, safety and
cost where as road flexibility, reliability, faster and cheap would be considered.
Relationship with Service Provider
On all the responses no comment was made on customer relationship.
Issues to improve services by rail
Railways were requested to improve on reliability and supply of resources upon
request.
Year Business volume metric
ton
Current market share % Projected Traffic on Rail
201 348,922 51% 177,950
2016 351,222 51% 179,123
2017 352,822 51% 179,970
2018 354,322 51% 180,704

127
2.3.6 Richards Bay Corridor
The findings and the analysis in this corridor were based on 2 major customers
of SR.
Sidings, loading and off loading facilities
All customers have access to sidings and have loading and off loading facilities
for road and rail. The capacity is adequate for the current and projected fuel
volumes.
Import and Export
Imports on this corridor are wheat and fuels.
Distribution of business volume
Table 16: Market Share along Richards Bay Corridor
Rail Road Total Rail% Road
Import 9,212 35,243 44,455 21%% 79%
Total 9,212 35,243 44,455 21% 79%
Current business volume available for road and rail is 44,455mt. Rail has 21%
(9,212) of the current market share.
Resources required and availability
The resources required for the current traffic were 160 bottom discharge
wagons and 160 tankers per month. Supply of resources was lower than what
was required and the services were below expectation..
Business volume projection for the next four years
No projection was given for wheat as the customer was still new in business.
Table17: Projection of business volume
Product 2014 2015 2016 2017 2018
Import Export Import Export Import Export Import Export Import Export
Wheat No projections as the customer is new in business
Fuel 52,350 40,813 45,710 45,939 46,169
Total 52,350 40,813 45,710 45,710 46,169
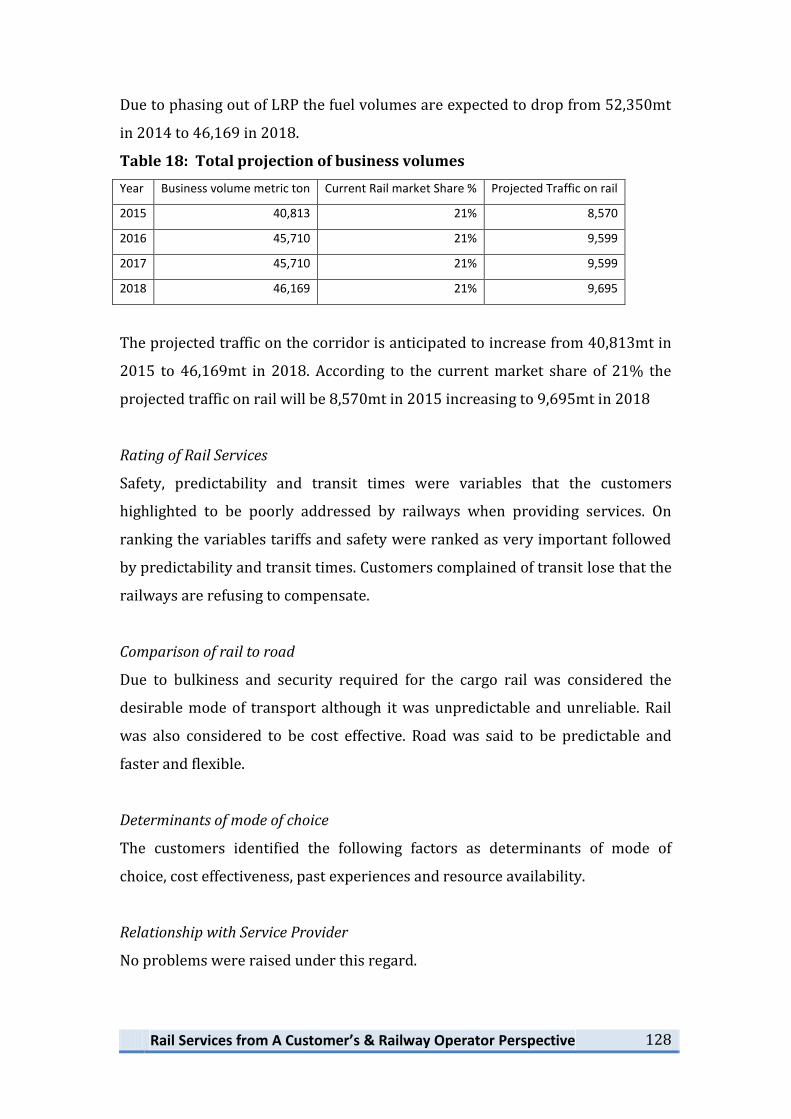
Rail Services from A Customer’s & Railway Operator Perspective
128
Due to phasing out of LRP the fuel volumes are expected to drop from 52,350mt
in 2014 to 46,169 in 2018.
Table 18: Total projection of business volumes
Year Business volume metric ton Current Rail market Share % Projected Traffic on rail
2015 40,813 21% 8,570
2016 45,710 21% 9,599
2017 45,710 21% 9,599
2018 46,169 21% 9,695
The projected traffic on the corridor is anticipated to increase from 40,813mt in
2015 to 46,169mt in 2018. According to the current market share of 21% the
projected traffic on rail will be 8,570mt in 2015 increasing to 9,695mt in 2018
Rating of Rail Services
Safety, predictability and transit times were variables that the customers
highlighted to be poorly addressed by railways when providing services. On
ranking the variables tariffs and safety were ranked as very important followed
by predictability and transit times. Customers complained of transit lose that the
railways are refusing to compensate.
Comparison of rail to road
Due to bulkiness and security required for the cargo rail was considered the
desirable mode of transport although it was unpredictable and unreliable. Rail
was also considered to be cost effective. Road was said to be predictable and
faster and flexible.
Determinants of mode of choice
The customers identified the following factors as determinants of mode of
choice, cost effectiveness, past experiences and resource availability.
Relationship with Service Provider
No problems were raised under this regard.

129
Issues to improve services by rail
Railways were requested to improve on turnaround times and reduce in-transit
losses. Railways were expected to ensure that the tarpaulins were clean and
intact. Railways were to ensure that contracts with customers have not lapsed.
Railways were requested to inspect their tarpaulins for cleanness and intact
before supplying to customers to minimize transit losses.
2.4 Recommendations and Conclusion
The data gathered through the customer questionnaire was not conclusive on its
own to resolve service realignment problem. The above analysis would require
to be complemented by review of other literature available on railway
operations including the analysis from the railway operator questionnaire.
The analysis was not a reflection of the total corridor business as few customers
in a corridor responded. The outcomes given above can give the railways a
starting point in improving services and become a competitive alternative to
road services.
2.4.1 Recommendation
i. It is important that corridors use the CMG platform to implement joint
planning and marketing and increase the market share. With the current
resources the corridor should set targets on tonnage to move and
percentage to increase the market share
ii. SARA developed a MYSQL database for commercial information sharing
across the region and RAs could implement it for tracking cargo and be
able to answer customers’ queries on cargo locations along the corridor.
The database is ready for roll out
iii. The outcomes and the analysis above can be used as a starting point in
improving rail services and become a competitive alternative to road
services
iv. In the Zimbabwean market the information derived from the
questionnaires can be used by NRZ and other railways in the corridor to
identify business opportunities and improve their service delivery
v. The railways could consider refresher courses on marketing and
customer care to improve service provision and customer relationships
vi. Railways could also consider and implement the regional resource
sharing framework to improve on availability of resources in a corridor.
vii. SARA has ratified a number of policy frameworks, safety, technical and
operational standards that railways should use to ensure compliance in

Rail Services from A Customer’s & Railway Operator Perspective
130
the region and reduce delays through condemning of rolling stock on
other networks

131
Annexure A.11
Analysis of Rail operator Questionnaire ANALYSIS OF RESPONSES TO THE RAILWAY OPERATOR AND CUSTOMER SERVICE DELIVERYQUESTIONNAIRES 1. BACKGROUND
There is concern amongst SARA members, specifically the rail operators, that the distribution/share of transit rail traffic to/from the SADC hinterland through the ports, to/from overseas markets, is not being fairly shared between the rail systems of the region. Railways believe that they can offer convenient and relatively cheaper transportation services if they align themselves with the market. In seeking to resolve the problem of service realignment the SARA Board simultaneously wants to identify and address the underlying problem of lost rail market share so that the usage of rail transport systems in the region can be optimized for the benefit of all. It is in this regard that two questionnaires (here enclosed) were designed for railway operators and customers to give feedback respectively on challenges they were facing for the first ones and their views on the quality of rail services for the second. Questionnaires to customers were sent through RAs: each railway administration was to identify its top 5 customers and distribute them the customer service delivery questionnaire.
2. METHODOLOGY
The analysis of responses per corridor was done separately for the railway operators and customers. Actually, the analysis includes;
i. The quality of responses, ii. The findings, iii. The data analysis itself, iv. The comments & observations, and v. The recommendations and/or conclusion.
Due to lack of information from the two groups (railway operators and customers), the Optimization Committee found opportune to request an external consultancy for a period of fourteen days in order to get more data for a consistent analysis and, further for trustable recommendations. 2.1 Analysis of responses from Railway Operators
2.1.1 Rates of responses
Responses to the Railway Operator Questionnaire were received from nine of the ten Railway Administrations and, for nine of the eleven corridors which exist in the region. The rates of responses are summarised in the below template which figures‟ explanation is given thereafter.
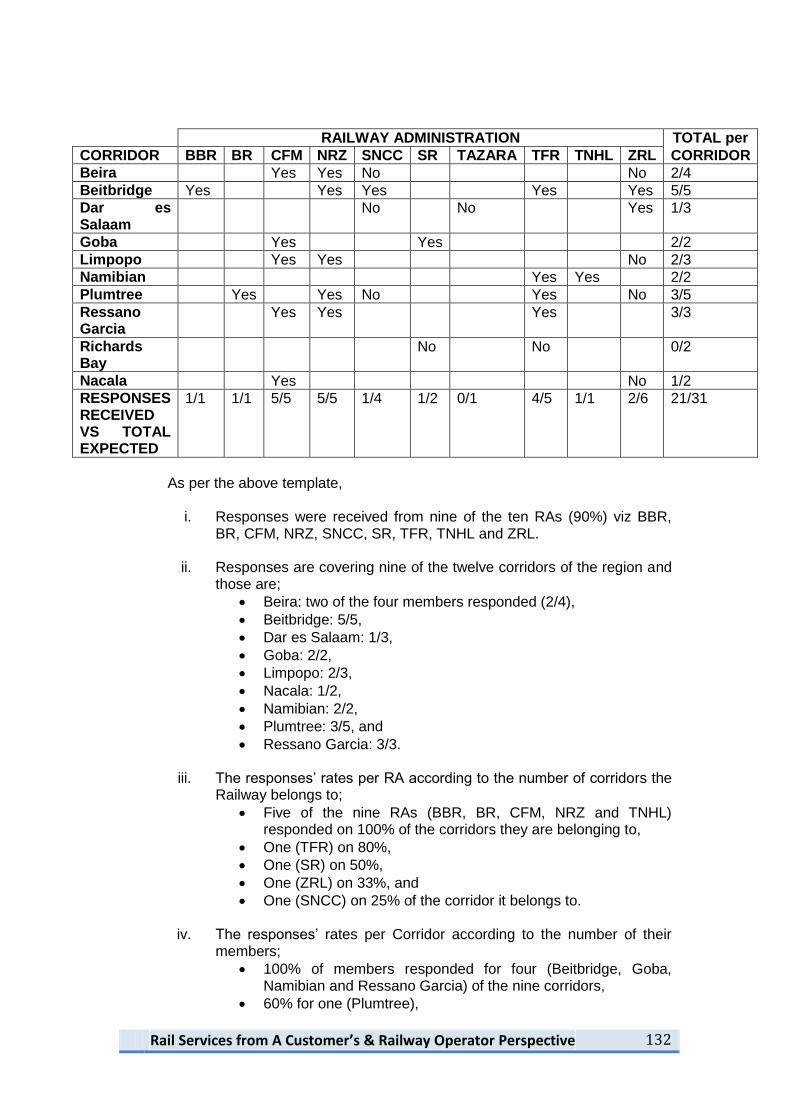
Rail Services from A Customer’s & Railway Operator Perspective
132
RAILWAY ADMINISTRATION TOTAL per
CORRIDOR BBR BR CFM NRZ SNCC SR TAZARA TFR TNHL ZRL CORRIDOR
Beira Yes Yes No No 2/4
Beitbridge Yes Yes Yes Yes Yes 5/5
Dar es Salaam
No No Yes 1/3
Goba Yes Yes 2/2
Limpopo Yes Yes No 2/3
Namibian Yes Yes 2/2
Plumtree Yes Yes No Yes No 3/5
Ressano Garcia
Yes Yes Yes 3/3
Richards Bay
No No 0/2
Nacala Yes No 1/2
RESPONSES RECEIVED VS TOTAL EXPECTED
1/1 1/1 5/5 5/5 1/4 1/2 0/1 4/5 1/1 2/6 21/31
As per the above template,
i. Responses were received from nine of the ten RAs (90%) viz BBR, BR, CFM, NRZ, SNCC, SR, TFR, TNHL and ZRL.
ii. Responses are covering nine of the twelve corridors of the region and
those are;
Beira: two of the four members responded (2/4),
Beitbridge: 5/5,
Dar es Salaam: 1/3,
Goba: 2/2,
Limpopo: 2/3,
Nacala: 1/2,
Namibian: 2/2,
Plumtree: 3/5, and
Ressano Garcia: 3/3.
iii. The responses‟ rates per RA according to the number of corridors the Railway belongs to;
Five of the nine RAs (BBR, BR, CFM, NRZ and TNHL) responded on 100% of the corridors they are belonging to,
One (TFR) on 80%,
One (SR) on 50%,
One (ZRL) on 33%, and
One (SNCC) on 25% of the corridor it belongs to.
iv. The responses‟ rates per Corridor according to the number of their members;
100% of members responded for four (Beitbridge, Goba, Namibian and Ressano Garcia) of the nine corridors,
60% for one (Plumtree),

133
50% for two (Beira, Nacala),
33% for one (Dar es Salaam), and
0% for one (Richards Bay) of the nine corridors.
v. The total number of responses received is 21 of the 31 which were expected: the proportion is of 67.74%.
2.1.2 Analysis per Corridor
2.1.2.1 Beira
On the four RAs constituting the Corridor (CFM, NRZ, ZRL and SNCC), only 50% responded (CFM and NRZ). Quality of responses Good in general with some exceptions for customers‟ names which are different and the utilisation of the design track line capacity which is given in a unit of measurement different from the one to be compared to. Findings, data analysis and observations They have been listed as per the questions;
Commodities carried are Granite, Fertilizer, Wheat and Containers
No commun customers for the two RAs (DPSA, Medlog, PHI, Dynvet/Zimphos, Omnia Ferts, Crodum Ent for NRZ and MA, Granito de Mozambique, Beira Grain Terminal, Mocargo, MSC for CFM)
Potential Business: 14897T Import and 7088T Export from NRZ only
Current Monthly Business: 12800T Import and 7500T Export for NRZ (Total of 20300T) while CFM indicated 19255T as total for both directions
Competition from the road very stiff due to shortage of equipment and track bad condition
No collaboration with road
No Backhaul
Same challenges faced on the two RAs: Long Terminal and Transit times, Thefts or pilferages, documentation, Equipment‟s shortage, Poor Infrastructure (Track, S & T) condition, etc.
Proportion of the line design capacity in utilisation: 25% for NRZ and not known for CFM as the two parameters were given in different units of measurement
Existing interchange arrangements: Joint Inspection
Service Level Agreements: between RAs and between them and the Customers
Through working timetable for international traffic: contradiction between the two; No for NRZ and Yes for CFM

Rail Services from A Customer’s & Railway Operator Perspective
134
Existing organisational cargo tracking information system: Yes for both RAs, but not linked to Customers
No capacity adequacy for Rolling Stock and Infrastructure for both RAs
The CMG is functional
The predetermined tariff (based among others on the state of the economy and the market price) can be negotiated with Customers
Less than 48 Hours for quotation for international traffic with one stop shop
Joint Marketing meetings twice per quarter or when necessary
SARA Marketing Policy (SMP) strengths: Joint Marketing Strategy, Equity and Shortest Route Principles
SMP‟s Weaknesses: SARA is not in a position to enforce implementation of agreed policies
Measures to improve railway competitiveness: Joint Marketing, competitive rates, terminal and transit times‟ minimisation, improvement of communications, one stop shop, etc.
The solution should be the dialogue on the corridor
Challenges beyond RAs: theft and pilferage of vulnerable cargo, bad condition of infrastructure including track, workshops, S & T, and shortage of equipment including locomotives, wagons and mobile plants.
The solution should come from Governments‟ investments and subsidies
Recommendations
RAs should be encouraged for all initiatives taken for the relaunch of the corridor
They should now try to target some major customers especially in Zambia and DRC and plan joint marketing visits to them: this will show the commitment of each RA before the customers instead of individuals who may not be reliable.
2.1.2.2 Beitbridge
All the five RAs composing the Corridor (TFR, BBR, NRZ, ZRL and SNCC), responded Quality of responses Not good as it is shown here below: some data cannot be used due to incoherence Findings, data analysis and observations They have been listed as per the questions;
Commodities carried are General Goods, Copper, Sulphur, Fertilizer, Grain, Sugar and Fuel

135
Commun customers for TFR, BBR and ZRL (Transchem, Tradimex, Freightmax, Bridge Shipping, ETC Agro and SA Cargo); NRZ and SNCC have other names
By having different customers as PPC, GMB and Coal Brick for NRZ and Edouard Mulumba for SNCC, it is likely that;
NRZ reported only on goods originating or destining to Zimbabwe,
There is almost nothing which is carried by rail to and from DRC
Potential (Annual) Business: 500000 to 750000T Import and 30000 to 72000T Export
1200000T in Export and the double in Import from BBR are not realistic when compared to the figures from other RAs and to the current ones: the discrepancy is too big that the figures cannot be reliable
Current Business: deep disparity of figures between the RAs. Yearly, for TFR 17000T are coming from the North and 400000T from them to the North; ZRL are importing and exporting respectively 280000T and 60000T while according to BBR, tonnages transiting via Zimbabwe are 108000T to the South and 348000T to the North. Figures from NRZ are too low to be considered (3324T incoming and 33192T outgoing)
The analysis of the annual figures shows that;
Of the 400000T from South to North, 52000T are destined to Zimbabwe, 280000T to Zambia and the rest 68000T (348000-280000) to DRC, but on the ground, the 68000T of DRC do not appear in statistics!
From North to South, to the 60000T from Zambia, Zimbabwe is adding 48000T while TFR are receiving 17000T instead of 108000T! There is no consistency in the figures
Competition from the road is real and tangible at such extent that for some commodities like Copper, the rail market share is around 5%.
The road is the mode of choice on this corridor mainly due to lack of dialogue between RAs with as consequences high rates, no one stop shop, long terminal and transit delays, etc.
There is collaboration with road especially in Zambia, to avoid TFR wagons to proceed to SNCC
No Backhaul
Same challenges faced on the five RAs: Long Terminal and Transit times, Thefts or pilferages, documentation, Equipment‟s shortage, Poor Infrastructure (Track, S & T) condition, high rates, no coordination on the corridor, State owned RAs are less business oriented.
The solution should be found in the dialogue between RAs to overcome challenges which are under their control

Rail Services from A Customer’s & Railway Operator Perspective
136
Proportion of the line design capacity in utilisation: 30 to 40% as average for the corridor due to the same reasons as above
Existing interchange arrangements: Joint Inspection in general and, Locomotives and Crew through working at some borders
This is an encouraging sign for the business
Service Level Agreements: between RAs and between them and the Customers
No through working timetable for international traffic on the corridor
There are individual organisational cargo tracking information system that are not, unfortunately, linked to Customers except for TFR who are linked to Customers only for containerised traffic
Inadequate capacity of Rolling Stock and Infrastructure for three of the RAs (NRZ, ZRL and SNCC), adequate capacity of Locomotives and track for TFR and BBR, and adequate capacity of wagons only for TFR
The CMG is not functional and therefore, no coordination of the business on the corridor
This is the main cause of weakness of the rail compared to the road for the challenges under the control of RAs
The predetermined tariff (based among others on the state of the economy and the market price) can be negotiated with Customers
It takes less than 48 Hours for individual quotation for international traffic and there is no one stop shop
Reluctance is mostly from TFR who do not cooperate
No Joint Marketing meetings
SARA Marketing Policy (SMP) strengths: Joint Marketing Strategy, Equity and Shortest Route Principles
SMP‟s Weaknesses: SARA is not in a position to enforce implementation of agreed policies
Measures to improve railway competitiveness: Joint Marketing, competitive rates, terminal and transit times‟ minimisation, improvement of communications, one stop shop, etc.
Challenges beyond RAs: theft and pilferage of vulnerable cargo, bad condition of infrastructure including track, workshops, S & T, and shortage of equipment including locomotives, wagons and mobile plants.
The solution should come from Governments‟ investments and subsidies
Recommendations
All RAs on the Beitbridge Corridor could strive together, in a coordinated way, to recover the rail market share by approaching mining people in Zambia and DRC
137
Figures sent out by RAs should be first seriously examined before being released
The dialogue between RAs should be their first concern: they should resume the CMG meetings with the support of the JOC activities. This could therefore allow;
The conversion of bilateral agreements to a corridor agreement,
The setting up of through working timetable for international traffic on the corridor, one stop shop, joint inspections, locomotives & Crew through working, etc. for the improvement of the business
The standardization of the cargo tracking information system on the corridor (RFID)
2.1.2.3 Dar es Salaam
Only one (ZRL) of the three (SNCC, ZRL and TAZARA) RAs forming the Corridor, responded Quality of responses Not good as it is shown here below: some data cannot be used due to inconsistency Findings, data analysis and observations They have been listed as per the questions;
Commodities carried are Copper, Sulphur, Fertilizer, Diesel and Steel
Customers are KCM, IMPALA, NYIOMBO, MM STEEL and PMme Fuels
Potential Annual Business: 3000000T Import and 2000000T Export
Current Annual Business: 60000T Import and same at Export
The gap is very big between the potential and the current. This shows that the estimation of the potential is not reliable
Competition from the road is too high: only 12% of the market share for the rail
There is no collaboration with road
There is backhaul
Poor Signalling and Infrastructure, Old wagons
Proportion of the line design capacity in utilisation: 25%
Existing interchange arrangements: Joint Inspection in general
Service Level Agreements: with other RAs and not with Customers
No through working timetable for international traffic on the corridor
Individual organisational cargo tracking information system not linked to Customers
Rail Services from A Customer’s & Railway Operator Perspective
138
Inadequate capacity of Rolling Stock and Infrastructure
The CMG is irregularly meeting
The predetermined tariff can be negotiated with Customers
It takes less than 48 Hours for individual quotation and up to 72 hours to get quotation from other RAs for international traffic and there is no one stop shop
No Joint Marketing meetings
SARA Marketing Policy (SMP) strengths: Joint Marketing Strategy, Equity and Shortest Route Principles
SMP‟s Weaknesses: SARA is not in a position to enforce implementation of agreed policies
Measures to improve railway competitiveness: Joint Marketing, competitive rates, terminal and transit times‟ minimisation, improvement of communications, one stop shop, etc.
Challenges beyond RAs: theft and pilferage of vulnerable cargo, bad condition of infrastructure including track, workshops, S & T, and shortage of equipment including locomotives, wagons and mobile plants.
The solution should come from Governments‟ investments and subsidies
Recommendations
Budgets should be more realistic and not based on non-existing cargo
2.1.2.4 Goba
Both the RAs composing the Corridor (CFM and SR) responded Quality of responses Good in general except for some data as shown here below Findings, data analysis and observations They have been listed as per the questions;
Main Commodities carried are Hematite and Sugar
Commun customers for both RAs are Swaziland Sugar Association and Salgaocar
Potential Annual Business: expressed in the Swazi Currency, and therefore could not be converted in Tons
Current Business: disparity of figures between the RAs. Yearly, for SR 14070T are imported and 1527000T exported, while for CFM, it is 13000T at Import and 1200000T at Export
The analysis of the annual figures shows that 327000T of Hematite from SR are not traversing the CFM network!
No real competition from the road except for general goods at Import
There is no collaboration with road

139
No Backhaul
Challenges faced on the RAs: Rigid operating procedures between RAs, sluggish approach to investment, language barrier, Government support, low volumes offered
Proportion of the line design capacity in utilisation: about 60% as average for the corridor due to the reasons here above
Existing interchange arrangements: Joint Inspection and, Locomotives and Crew through working
Service Level Agreements: between RAs and between SR and the Customers (it should be a problem of language for the CFM response as they have joint marketing activities)
Through working timetable for international traffic on the corridor
SR has an organisational cargo tracking information system while CFM has not
Adequate capacity of Rolling Stock and Infrastructure for both RAs
The CMG is functional
This is the main strength of the corridor and resolves most of the problems they should be facing if they were not meeting
The predetermined tariff can be negotiated with Customers
It takes less than 48 Hours for the individual RA and up to 72 Hours from the other Railway to quote international cargo and there is a one stop shop
There are Joint Marketing meetings
SARA Marketing Policy (SMP) strengths: Joint Marketing Strategy, Equity and Shortest Route Principles
SMP‟s Weaknesses: SARA is not in a position to enforce implementation of agreed policies
Measures to improve railway competitiveness: Joint investment in infrastructure and key assets, Minimizing transit delays, Improvement of communications
Challenges beyond RAs: Legislation, Government Policies, Uneven playing field, Transport of commodities with environmental impact on communities.
Recommendations
Figures sent out by RAs should be more reliable
Governments should increase their investments in the Railways

Rail Services from A Customer’s & Railway Operator Perspective
140
2.1.2.5 Limpopo
Only two (CFM and NRZ) of the four RAs composing the Corridor (CFM, NRZ, ZRL and SNCC) responded Quality of responses Not good as it is shown here below: some data cannot be used due to incoherence Findings, data analysis and observations They have been listed as per the questions;
Commodities carried are Raw Sugar, Diesel, Ferro-Chrome, Wheat, Anhydrous Ammonia
Commun customers for both RAs are Zimasco, Zim Sugar and Strauss Logistics
Potential Monthly Business: figures only from NRZ, 6000T Import and 21700T Export
Current Monthly Business: 9000T Import and 30000T Export for NRZ, and 7700T to NRZ and 22500T from NRZ for CFM.
The analysis of the figures shows that;
The potential is less than the current showing that either the market offered more than expected or the potential was not updated with the clients
The current shows that NRZ are importing more than what is transiting by CFM and CFM is carrying to the port less than what NRZ are exporting. This may be interpreted as there is a surplus from road, handed over to rail in import at the Border Point, and the same in export where some load is handed over by rail to road at the same Border. The other way of thinking is that figures from one or both RAs are not true as there is road haulier on this corridor
No competition from road
No collaboration with road
No Backhaul
Challenges faced by both RAs: Long Terminal and Transit times, Thefts or pilferages, documentation, Equipment‟s shortage, Poor Infrastructure (Track, S & T) condition
Daily proportion of the line design capacity in utilisation: 6 trains for NRZ and 2 for CFM!
The figure from CFM seems to be more realistic than the one from NRZ
Existing interchange arrangements: Joint Inspection
Service Level Agreements: between RAs and between NRZ only and the Customers
141
No through working timetable for international traffic on the corridor
This is in contradiction to the commitment of RAs in the CMG‟s activities!
Organisational cargo tracking information system only for NRZ and not linked to Customers
Inadequate capacity of Rolling Stock and Infrastructure for the two RAs
The CMG is functional
The predetermined tariff can be negotiated with Customers
It takes less than 24 Hours for individual quotation or from the other RA for international traffic and there is one stop shop
Twice Joint Marketing meetings per quarter or when necessary
SARA Marketing Policy (SMP) strengths: Joint Marketing Strategy, Equity and Shortest Route Principles
SMP‟s Weaknesses: SARA is not in a position to enforce implementation of agreed policies
Measures to improve railway competitiveness: Joint Marketing, competitive rates, terminal and transit times‟ minimisation, improvement of communications, offer of better service delivery, etc.
Challenges beyond RAs: theft and pilferage of vulnerable cargo, line on CFM side prone to flooding during rainy season resulting in traffic diversion to other routes, transport of commodities with environmental impact on communities.
Recommendations
Figures sent out by RAs should be more reliable
To improve the business on the corridor;
RAs could set up through working timetables for international traffic
CFM should endeavour to acquire a wagon tracking system and sign agreements with customers
2.1.2.6 Namibian
Both RAs (TFR and TNHL) forming the corridor responded to the questionnaire Quality of responses Not good as it is shown here below: some data cannot be used due to incoherence Findings, data analysis and observations They have been listed as per the questions;
Commodities carried are Containers, Maize and (Ammonium Nitrate)
Rail Services from A Customer’s & Railway Operator Perspective
142
Customers are completely different: these are Veekos, Dynvet and Gordonia Mills for TFR, and Rossing Uranium, Sasol, Afrox, Feedmaster and Namib Mills for TNHL
It is likely there is one stop shop so that each RA can deal with customers on behalf of the other when goods are originating from its country. But, it is not the case, there is no one stop shop.
Potential Annually Business: Nil from Namibia to SA and 42200T from SA to Namibia according to TFR, and 5000000T from SA to Namibia and 600000T from Namibia to SA according to TNHL
Very big gap between the figures received from the two Railways. The high potential for TNHL may find its explanation in the fact that customers prefer now to carry their goods through ports (Walvis Bay or Luderitz) rather than using the formal rail line linking the two countries
Current Annually Business: same as the potential here above for TFR, and 200000T Import and 100000T Export for TNHL
The analysis of the figures shows that the gap is as big between the potential and the current as from TNHL‟s data: figures are not realistic unless some customers did not fulfil their initial commitment
Rail still have a competitive advantage despite the quite huge and massive road competition
There is collaboration with road
No Backhaul for TFR and backhaul for TNHL
There is contradiction between the two RAs: TFR response could be the right one as goods carried in the two directions are different and therefore, require different wagon types
Challenges faced by both RAs: Decrease of import loads and almost no export for TNHL due to high rates, long transit times and inadequate asset capacity
Proportion of the line design capacity in utilisation: 14% which represent 2 trains per week and this is due to the challenges above
Existing interchange arrangements: Joint Inspection, locomotives and Crew through working
Service Level Agreements: between RAs and between themselves and the Customers
Through working timetable for international traffic on the corridor
Organisational cargo tracking information system for both RAs but only the TFR one is linked to the Customers for tracking of containers only
Capacity of Rolling Stock and Infrastructure: adequate for TFR and inadequate for TNHL
RAs meet on bilateral basis
They should be sensitised to meet on CMG basis

143
The predetermined tariff can be negotiated with Customers
It takes 1 day to TNHL and 7 to 14 days to TFR to quote for international traffic and there is no one stop shop
No Joint Marketing meetings
SARA Marketing Policy (SMP) strengths: Consistent customer engagements through customer care feedback and customer visits
SMP‟s Weaknesses: the document is unknown in some RAs like TNHL
Measures to improve railway competitiveness: Explore possible ways of going up against competition i.e. attract alternative traffic, Need of a regional costing model, Cut down on tariffs during slack periods, Have joint corridor marketing events and customer days.
Challenges beyond RAs: Lack of an integrated planning approach, No transparency in the challenges experienced, Ageing infrastructure and staff, No enough investment.
Recommendations
Figures sent out by RAs should be more reliable
To improve the business on the corridor;
RAs could be sensitised to meet on a CMG basis instead of bilateral
RAs could review their high rates and minimize the quoting time for international traffic
2.1.2.7 Plumtree
Three (TFR, BR and NRZ) of the five RAs (+ ZRL and SNCC) forming the corridor responded to the questionnaire Quality of responses Not good as it is shown here below: some data cannot be used due to incoherence Findings, data analysis and observations They have been listed as per the questions;
Main commodities carried are Fuel, Salt, Soda Ash, Containers and Coal
Customers are: Fuel Companies (Engen, Shell and Sasol), Botswana Ash, Morupule Colliery
Potential Annually Business: North to South, 89200T according to NRZ and 796300T as per TFR. South to North, 500000T according to TFR and 338600T as per NRZ. No data from BR.
Interpreting the data here above, it can be noted that;
Most of the southbound cargo is from Botswana while the northbound one is going beyond Botswana

Rail Services from A Customer’s & Railway Operator Perspective
144
Current Annually Business: Southbound, 346300T-5960T according respectively to TFR and NRZ. Northbound, 406000T-262000T as per TFR and NRZ. BR is receiving and sending from/to both sides respectively 1390000T and 675000T
The analysis of the figures shows that;
That the gap is so big between the potential and the current as from TFR and NRZ‟s data: figures are not realistic unless some customers did not fulfil their initial commitment to bring goods to the rail
BR is receiving (1390000T) more than NRZ southbound tonnage (5960T) and TFR northbound cargo (406000T) put together. The same, BR is sending (675000T) out more than what NRZ northbound tonnage (262000T) and TFR southbound cargo (346300T).
Gaps are so big that all the figures are not reliable
Competition from road is very hard
There is collaboration with road
No Backhaul for most commodities except Anthracite and Copper
Challenges faced: Competition from road (or low traffic volumes), Inadequate Assets, Customers‟ accessibility
Proportion of the line design capacity in utilisation: varying from 50 to 100% according to the network due to challenges above
Existing interchange arrangements: Joint Inspection everywhere, locomotives through workingat TFR-BR border only
Service Level Agreements: between the three RAs and between only two (TFR and NRZ) of them and the Customers
Through working timetable for international traffic on the corridor only between TFR and BR
Organisational cargo tracking information system for all the RAs but only TFR is linked to the Customers for tracking of containers only
Capacity of Rolling Stock and Infrastructure: adequate for BR and inadequate for NRZ. No comment from TFR
RAs meet on bilateral basis
They should be sensitised to meet on CMG basis
The predetermined tariff can be negotiated with Customers
To quote for international traffic, it takes up to two days for own or from the other RA for BR and NRZ while TFR takes one to two weeks and there is no one stop shop
There are Joint Marketing meetings
145
SARA Marketing Policy (SMP) strengths: Consistent customer engagements through customer care feedback, customer visits, Joint marketing, Traffic monitoring, Collaboration through bilateral meetings and Pooling of resources
SMP‟s Weaknesses: SARA is not in the position to enforce implementation of agreed policies
Measures to improve railway competitiveness: Explore possible ways of going up against competition i.e. attract alternative traffic, Improved network through working, Customer route preference, Adherence to service standards.
Challenges beyond RAs: Lack of an integrated planning approach, No transparency in the challenges experienced, Ageing infrastructure and staff, No enough investment.
Recommendations
Figures sent out by RAs should be more reliable
To improve the business on the corridor;
RAs could be sensitised to meet on a CMG basis instead of bilateral
SARA should play a more visible role by lobbying Governments to effect some changes and also ensure parity amongst RAs
2.1.2.8 Ressano Garcia
All the three (CFM, TFR and NRZ) RAs forming the corridor responded to the questionnaire. Actually NRZ is not part of this corridor but as they filled a questionnaire for traffic between Harare and Beitbridge, one of the possible route we could align that traffic was this corridor: that is what we did. Quality of responses Not good as it is shown here below: some data cannot be used due to incoherence Findings, data analysis and observations They have been listed as per the questions;
Main commodities carried are Magnetite, Coal, Containers, Rock Phosphate, Maize and Fertilizer
CommunCustomer is one for TFR and CFM, Foskor; all the rest are different: Glencore, Grindrod, Medlog, Exxaro, Omnia Fertilizer and Sappi
Potential Annual Business: from Maputo to Beitbridge, Nil for TFR, 223700T for NRZ and no data for CFM; from Beitbridge to Maputo, 2500000T (Coal) for TFR, Nil for NRZ and no data for CFM.
Interpreting the data here above, it can be noted that;
There are some contradictions in Import and Export unless goods from/to Zimbabwe are either taking another route (Durban or Richards Bay) or originating from SA like Maize

Rail Services from A Customer’s & Railway Operator Perspective
146
Current Annually Business: in Import; Nil for TFR, 206000T for NRZ and 20000T for CFM; and in Export, 5800000T (Coal & Magnetite) for TFR, 62T for NRZ and 4300000T for CFM
The analysis of the figures shows that;
The nil of TFR in import confirms that the traffic to Zimbabwe is originating from SA. TFR does not confirm the 20000T from CFM which may push us to think that it can be a local good.
For export, the gap between TFR and CFM figures is so big that they have to be checked and find where the gap of about 1500000T is from
The competition from road is high
There is no collaboration with road
No Backhaul
Challenges faced: Shortage of Rolling Stock, Terminal and Transit delays, Bad track, Theft/Loss of goods in Transit
Proportion of the line design capacity in utilisation: varying from 30 to 70% according to the network due to challenges above
When analysing the actual numbers of trains, 20 trains are running between TFR and CFM according to TFR while, for CFM, those are 7?
Existing interchange arrangements: Joint Inspection and locomotives & Crew through workingat TFR-CFM border
Service Level Agreements: only between TFR and CFM. CFM have no agreement with the Customers
Through working timetable for international traffic on the corridor only between TFR and CFM
Organisational cargo tracking information system for only TFR and NRZ. The TFR system is linked to the Customers for tracking of containers only
Capacity of Rolling Stock and Infrastructure: adequate for TFR and CFM and inadequate for NRZ.
RAs meet on JOC basis
The predetermined tariff can be negotiated with Customers
To quote for international traffic, it takes up to one hour for NRZ while TFR takes one to two weeks and there is no one stop shop according to TFR. No data on CFM quotation time
There are Monthly or twice per quarter Joint Marketing meetings
SARA Marketing Policy (SMP) strengths: Consistent customer engagements through customer care feedback, customer visits, Joint marketing Strategy
147
SMP‟s Weaknesses: SARA is not in the position to enforce implementation of agreed policies
Measures to improve railway competitiveness: Explore possible ways of going up against competition i.e. attract new business, Competitive rates, Better transit times.
Challenges beyond RAs: Lack of an integrated planning approach, No transparency in the challenges experienced, Security for vulnerable cargo.
Recommendations
Figures sent out by RAs should be more reliable
To improve the business on the corridor, RAs could;
Have an integrated planning approach,
Be transparent in the challenges experienced,
Secure vulnerable cargo,
Reduce their quotation delays for new business, and
Have a one stop shop.
2.1.2.9 Richards Bay
No data has been received from the two RAs (SR and TFR) constituting the corridor 2.1.2.10 Nacala
Information was received only from CFM (CDN). The corridor comprises CFM and ZRL (through CEAR that is no more SARA Member). Quality of responses Not good as it is shown here below: some data cannot be used due to incoherence Findings, data analysis and observations They have been listed as per the questions;
Main commodities carried are Fertilizer, Containers and Tobacco.
Customers are: Bakhresa G.M., Bollore, Transcargo and Donadar
Potential Annual Business: Export 700000T and Import 450000T.
Current Annual Business: in Import 360000T and in Export, 120000T
The analysis of the figures shows that;
The gap between the potential and the current is big and can find its explanation in the non-observance of some clients of their commitment
There is competition from road but the market share is still on the advantage of rail (60%)
There is no collaboration with road

Rail Services from A Customer’s & Railway Operator Perspective
148
There is Backhaul
Challenges faced: track poor condition, Bad wagons‟ rotation
Proportion of the line design capacity in utilisation: 25%
No-existing interchange arrangements: Single Inspections
Service Level Agreements: with contiguous RAs and with Customers
No Through working timetable for international traffic on the corridor
No organisational cargo tracking information system
Adequate capacity of Rolling Stock and Infrastructure
CMG not functional
The predetermined tariff can be negotiated with Customers
To quote for international traffic, it takes 1 to 3 days and there is one stop shop.
There are Joint Marketing meetings
SARA Marketing Policy (SMP) strengths: No comment linked to the subject (existence of a natural profound port)
SMP‟s Weaknesses: No comment related to the subject (No enough connection with others for the use as corridor)
Measures to improve railway competitiveness: Improve the quality of the customer‟s service delivery.
Challenges beyond RAs: No comment
Recommendations
Figures sent out by RAs should be more reliable
To improve the business on the corridor, RAs could;
Have an integrated planning approach,
Be transparent in the challenges experienced,
Secure vulnerable cargo,
Reduce their quotation delays for new business, and
Have a one stop shop.
2.2 Recommendations and Conclusion
The final conclusion can consist in a summary of the above corridor recommendations,
RAs should be encouraged for all initiatives taken on their respective corridors for the improvement of the rail market share

149
They should target now some major customers especially and plan joint marketing visits to them: this will show the commitment of each RA before the customers instead of individuals who may not be reliable.
All RAs on all Corridors could strive together, in a coordinated way, to recover the rail market share by seeking for new business starting in the region (Mozambique, DRC, Zambia, Botswana, etc.)
Figures sent out by RAs should be first seriously examined before being released for more reliability
Governments should increase their investments in the Railways and set up policies to increase the rail market share to decongest roads
RAs should endeavour to acquire a wagon tracking system and sign agreements with customers
RAs should review their high rates and minimize the quoting time for international traffic
SARA should play a more visible role by lobbying Governments to effect some changes and also ensure parity amongst RAs
On all corridors, the dialogue between RAs should be their first concern: they should either resume the CMG meetings with the support of the JOC activities where CMGs are not meeting or convert their bilateral meetings in CMGs‟ meetings.
This should contribute to the improvement of the business by allowing;
the setting up of;
o Through working timetable for international traffic on corridors,
o One stop shop,
o Joint inspections,
o Locomotives & Crew through working, etc.
o An integrated planning approach,
o Security of vulnerable cargo,
The standardization of the cargo tracking information system by adopting the RFI


