Railway Wheel Flat and Rail Surface Defect Detection by Time-Frequency Analysis
Bo Liang*, Simon Iwnicki, Gu Feng, Andrew Ball, Van Tung Tran, Robert Cattley
School of Computing and Technology, University of Huddersfield, Queensgate Huddersfield HD1 3DH, UK [email protected]
Damage to the surface of railway wheels and rails commonly occurs in most railways and, if not detected at an early stage, can result in rapid deterioration and possible failure incurring high maintenance costs. If detected at an early stage these maintenance costs can be minimised. This paper presents an investigation into the use of time-frequency analysis of vibrations in railway vehicles for early detection of wheel flats and rail surface defects. Time-frequency analysis is a useful tool for identifying the content of a signal in the frequency domain without losing information about its time domain characteristics. Three commonly used time-frequency analysis techniques: Short-Time-Fourier-Transform (STFT); Wigner-Ville Transform (WVT); and Wavelet Transform (WT) are investigated in this work.
1. Introduction With the recent significant increases of train speed and axle load, forces on both vehicle and track due to wheel flats or rail surface defects has increased and critical defect sizes at which action must be taken are reduced. This increases the importance of early detection and rectification of these faults. Partly as a result of this, dynamic interaction between the vehicle, the wheel, and the rail has been the subject of extensive research in recent years. Wu and Thompson (2002) suggested a simplified dynamic model of wheel and rail, which was used for prediction of the wheel and rail impact force and noise in frequency domain. Pieringer et al (2008) developed a fast time domain model for wheel and rail interaction. In this research, rail and wheel are described as linear systems using impulse-response functions. The model enables the calculation of the vertical contact force generated by the small scale roughness of rail and wheel. Mazilu (2007) presented a numerical model to predict the wheel/rail dynamic interaction occurring due to wheel flats. His model treated the rail as an infinite Euler beam supported on a continuous foundation with two elastic layers representing the subgrade. The vehicle is represented by a simplified model consisting of two elastically connected masses and non-linear Hertzian wheel/rail contact is considered. Newton and Clark (1999) used a more complex model with the aim of studying the wheel flat and rail impact forces. In their work non-linear elastic Hertzian wheel and rail contact is modelled through an elastic element placed between the wheel and the rail. Belotti et al (2006) presented a method of wheel flat detection using a wavelet transform method. In their study, a series of accelerometers were put under rail bed to detect the impact force caused by wheel flat and the signals were analysed based on the wavelet property of variable time-frequency resolution. It is claimed that the method is able to detect and to quantify the wheel-flat defect of a test train at different speeds. Jia and Dhanasekar (2007) carried out similar research to detect wheel flats using a wavelet approach. However both researchers only used wavelet decomposition of vibration signals and did not carry out wavelet spectrum analysis of the vibration signal. Wei et al (2012) have recently reported a real-time wheel defect monitor system based on fiber bragg grating sensors. The sensors measure the rail strain response upon wheel and rail interaction and the frequency component alone reveals the quality of the interaction. The advantage of fiber bragg grating system is that it is free from electromagnetic interference sensitivity. However, due to the fact the sensor has to be glued on to the rail its reliability and durability is still under investigation. It is also apparent from the literature review that no proper time-frequency analysis has yet been reported for detection of wheel
DOI: 10.3303/CET1333125
Please cite this article as: Liang B., Iwnicki S., Feng G., Ball A., Tran V.T., Cattley R., 2013, Railway wheel flat and rail surface defect detection by time-frequency analysis, Chemical Engineering Transactions, 33, 745-750 DOI: 10.3303/CET1333125
745
flats and rail surface defects despite the fact that time-frequency analysis method has been widely used for bearing, gearbox and electric motor fault identification (Polyshchuk, 2002, Wang, 2008, Baydar, 2001, and Javier, 2009). In these examples time-frequency analysis has been shown to be a very effective tool for identifying the content of a signal in the frequency domain without losing its characteristics in the time domain. In many applications it is interesting to find the frequency content of a signal locally in time. That is, the way in which the signal parameters (frequency content etc.) evolve over time. Such signals are called non-stationary. For a non-stationary signal s(t), the standard Fourier Transform is not useful for analysing the signal. Information which is localized in time such as spikes and high frequency bursts cannot be detected from the standard Fourier Transform. This paper presents an investigation into the use of time-frequency analysis of vibrations for the detection of railway wheel flats and rail surface defects. The following section of the paper are arranged as follows: in section 2, the basic time-frequency theories are given; in section 3, time-frequency vibration signal analysis for wheel and rail defects are presented and finally the conclusion are shown in section 4.
2. Time-frequency analysis techniques The most commonly used time-frequency presentation is the Short-Time-Fourier-Transform (STFT), which was originated from the well-known Fourier transform. Time-localization can be achieved by first windowing the signal so as to cut off only a well-localized slice of s(t) and then taking its Fourier Transform. The STFT of a signal s(t) can be defined as
(1)
Where and denote the time of spectral localization and Fourier frequency, respectively, and h( -t) denotes a window function. However the STFT has some problems with dynamic signals due to its limitations of fixed window width. Another well-known time-frequency representation is the Wigner-Ville distribution. The Wigner distribution was developed by Eugene Wigner in 1932 to study the problem of statistical equilibrium in quantum mechanics and was first introduced in signal analysis by the French scientist, Ville 15 years later. It is commonly known in the signal processing community as the Wigner-Ville Transform (Qian, 2002). Given a signal s(t), its Wigner-Ville transform is defined by
(2)
The Wigner-Ville transform essentially amounts to considering inner products of copies of of the original signal shifted in time-dominancy with the corresponding reversed copies . Simple geometrical considerations show that such a procedure provides insights into the
time-frequency content of the signal. From the definition of equation (2) it can be seen that the calculation of Wigner-Ville transform requires infinite quantity of the signal, which is impossible in practice. One of practical methods is to add a window h( ) to the signal. That leads to a new version of the Wigner-Ville transform as follows:
(3)
Which is called pseudo-Wigner–Ville (PWV) representation. However , there is a well-known drawback for using Wigner-Ville distribution. The interference or cross-terms exist between any two signals due to the fact the Wigner-Ville transform is a bilinear transform. For example, if a signal consists of signal 1 and signal 2, the Wigner-Ville transform of the signal is
) (4)
Where is called the cross term Wigner-
Ville distribution of signal 1 and signal 2. The cross-term phenomenon is shown in Figure 1 by one of artificial signals created to demonstrate the effect. The artificial signal lasts about 250ms, which is three pieces of signal added together (two signals with same frequency 200Hz but in different time intervals and one signal with 800 Hz in time 120-130ms). All three signals amplitudes are modulated by Gaussian function. It can be seen that there are three cross-terms between any two of three signals in the Wigner-Ville distribution. In order to get rid of the cross-term a smoothed pseudo Wigner-Ville transform can be used. Figure 2 presents the smoothed pseudo Wigner-Ville transform (SPWVT) for the same artificial signal. It demonstrates that the cross-terms are swept out completely.
746
Finally another relatively new time-frequency analysis technique is the wavelet transform (WT). Fourier analysis consists of breaking up a signal into sine waves of various frequencies. Similarly, wavelet analysis is the breaking up of a signal into shifted and scaled versions of the original (or mother) wavelet. One major advantage afforded by wavelets is the ability to perform local analysis. Because wavelets are localized in time and scale, wavelet coefficients are able to localize abrupt changes in smooth signals. Also the WT is good at extracting information from both time and frequency domains. However the WT is sensitive to noise. For a signal s(t), the WT transform can be given as
(5)
Where (t- /x) is the mother wavelet with a dilation x and a translation which is used for localization in frequency and time.
Figure 1 The Wigner-Ville representation of an artificial signal (left) and the smoothed Wigner-Ville representation of the artificial signal (right)
3. Time-frequency vibration and noise signal analysis for wheel and rail defectsA series of experiments has been carried out on a roller test rig (Iwnicki, 1998) pictured in Figure 2. The roller rig consists of four rollers supported in yoke plates incorporating the rollers supporting bearings. The roller motion is provided by servo hydraulic actuators which are connected directly to the rollers supporting yoke plates, these actuators being controlled by a digital controller which allows the inputs to follow defined waveforms or measured track data. The bogie vehicle parameters were selected to represent those of a typical high speed passenger coach (the BR Mk4 passenger coach). The wheel profile is machined scaled versions of BR P8 profile and the rollers have a scale BS 110 rail profile with no rail inclination. The roller rig can be used to demonstrate the behaviour of a bogie vehicle under various running conditions and acquire nominal data from the vehicle responses. There are 5 accelerometers installed on each side of the roller rig indicated (two on the wheel bearing seats, two on the roller bearing sets and one on the bogie). A reference signal obtained from a magnetic sensor was then used to synchronize time domain averaging of both the vibration and acoustic signals. The signals were sampled at 12 kHz. A wheel flat with 2 mm long, 1 mm wide and 0.1 mm in deep were produced on one wheel. A rail surface defect with a size of 2mm x 2 mm and 0.2 mm deep was also produced on one of the four rollers. The typical impact pulses generated by wheel flats and roller surface defect are shown in Figure 3. Due to the fact that the defect size of roller is larger than wheel flat, the impact vibration caused by roller defect is bigger than the impact caused by wheel flat in this instance. Since the wheel diameter is slightly smaller than twice roller diameter, the wheel flat vibration and roller surface defect vibration are not completely synchronized.
-1
0
1
2
Am
plitu
de
Analysed signal in time
WVD of above signal
Time [ms]
Fre
quen
cy [
kHz]
50 100 150 200 2500
0.2
0.4
0.6
0.8
1
-1
0
1
2
Am
plitu
de
Analysed signal in time
SPWVD of above signal
Time [ms]
Fre
quen
cy [
kHz]
50 100 150 200 2500
0.2
0.4
0.6
0.8
1
747
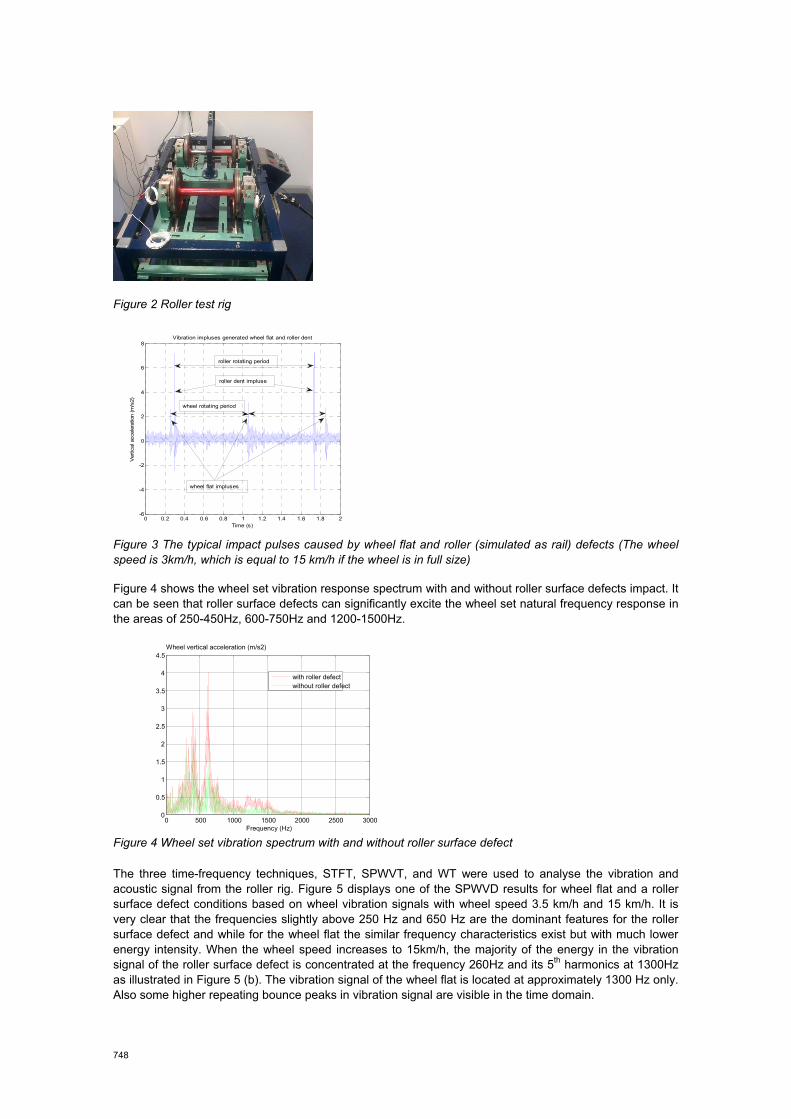
Figure 2 Roller test rig
Figure 3 The typical impact pulses caused by wheel flat and roller (simulated as rail) defects (The wheel speed is 3km/h, which is equal to 15 km/h if the wheel is in full size) Figure 4 shows the wheel set vibration response spectrum with and without roller surface defects impact. It can be seen that roller surface defects can significantly excite the wheel set natural frequency response in the areas of 250-450Hz, 600-750Hz and 1200-1500Hz.
Figure 4 Wheel set vibration spectrum with and without roller surface defect
The three time-frequency techniques, STFT, SPWVT, and WT were used to analyse the vibration and acoustic signal from the roller rig. Figure 5 displays one of the SPWVD results for wheel flat and a roller surface defect conditions based on wheel vibration signals with wheel speed 3.5 km/h and 15 km/h. It is very clear that the frequencies slightly above 250 Hz and 650 Hz are the dominant features for the roller surface defect and while for the wheel flat the similar frequency characteristics exist but with much lower energy intensity. When the wheel speed increases to 15km/h, the majority of the energy in the vibration signal of the roller surface defect is concentrated at the frequency 260Hz and its 5th harmonics at 1300Hz as illustrated in Figure 5 (b). The vibration signal of the wheel flat is located at approximately 1300 Hz only. Also some higher repeating bounce peaks in vibration signal are visible in the time domain.
0 0.2 0.4 0.6 0.8 1 1.2 1.4 1.6 1.8 2-6
-4
-2
0
2
4
6
8
Time (s)
Vibration impluses generated wheel flat and roller dent
Ver
tical
acc
eler
atio
n (m
/s2)
wheel rotating period
roller rotating period
roller dent impluse
wheel flat impluses
0 500 1000 1500 2000 2500 30000
0.5
1
1.5
2
2.5
3
3.5
4
4.5
Frequency (Hz)
Wheel vertical acceleration (m/s2)
with roller defectwithout roller defect
748
In order to compare the effects of different time-frequency techniques, the same vibration signals above are also analysed by STFT and WT. Figure 6 presents the STFT results. It can be seen that the STFT can reveal similar information to the SPWVT but with slightly lower resolution. The WT representations are shown in Figures 7. Despite the slightly coarse results for the WT distribution, they present much better localised vibration information in both time and frequency domain.
4. ConclusionsIn this research, a series of experiments was carried out on a roller rig and the vibration signals generated by the wheel flats and rail surface defects were analysed by three time-frequency transforms (SPWVT, STFT and WT). It was demonstrated that all three time-frequency methods can present proper time-frequency information for vibration generated wheel flat and rail surface defect. The SPWVT gives a better representation with a compromise of time and frequency resolutions while the WT shows good localizations in both time and frequency axes.
(a) (b)
Figure 5 SPWVT of wheel vibration caused by wheel flat and roller surface defect ((a) wheel speed=3.5km/h and (b) wheel speed=15km/h)
(a) (b)
Figure 6 STFT of wheel vibration caused by wheel flat and roller surface defect ((a) wheel speed=3.5km/h and (b) wheel speed=15km/h))
-4-20246
Am
plit
ud
e (
m/s
2)
Wheel vertical vibration (speed=3.5km/h)
SPWVD of above signal
Roller rotation (degree)]
Fre
qu
en
cy [k
Hz]
20 40 60 80 100 120 140 1600
0.5
1
1.5
2
2.5
3
rail surface defect wheel flat
-10
0
10
20
Am
plit
ud
e (
m/s
2)
Wheel vertical vibration (speed=15km/h)
SPWVD of above signal
Roller rotation (degree)
Fre
qu
en
cy [k
Hz]
20 40 60 80 100 120 140 1600
0.5
1
1.5
2
2.5
3
rail surface defectwheel flat
-4-20246
Am
plit
ud
e (
m/s
2 )
Wheel vertical vibration (speed=3.5km/h)
STFT of above signal
Roller rotation (degree)
Fre
qu
en
cy [k
Hz]
20 40 60 80 100 120 140 1600
0.5
1
1.5
2
2.5
3
rail surface defect wheel flat
-10
0
10
20
Am
plit
ud
e (
m/s
2)
Wheel vertical vibration (speed=15km/h)
STFT of above signal
Roller rotation (degree)
Fre
qu
en
cy [k
Hz]
20 40 60 80 100 120 140 1600
0.5
1
1.5
2
2.5
3
rail surface defect wheel flat
749
(a) (b)
Figure 7 WT of wheel vibration caused by wheel flat and roller surface defect ((a) wheel speed=3.5km/h and (b) wheel speed=15 km/h)
ReferenceBaydar, N. and Ball, A., 2001, A comparative study of acoustic and vibration signals in detection of gear
failure using Wigner-Ville distribution, Mechanical Systems and Signal Processing, 15, 1091-1107. Belotti, V., Crenna, F., Michelini, R. C., and Rossi, G. B. (2006), Wheel-flat diagnostic tool via wavelet
transform, Mechanical Systems and Signal Processing, 20, 1953-1966. Choi, H., and Williams, W. J., 1989, Improved time-frequency representation of multicomponent signals
using exponential kernels, IEEE. Trans. Acoustics, Speech, Signal Processing, 37, 872-871. Iwnicki, S. & Wickens, A.H., 1998, Vehicle system dynamics: International Journal of Vehicle Mechanics
and Mobility, 30, 759-772. Javior, A. Rosero, Romeral, L., and Julian, and Ortega, A., 2009, Short-circuit detection by means of
empirical mode decomposition and Wigner-Ville distribution for PMSM running under dynamic condition, IEEE Trans. On Industry Electronics, 56, 1171-1180.
Jia, S., and Dhanasekar, M., 2007, Detection of rail wheel flat using wavelet approaches, Structural Health Monitoring, 6, 121-131.
Mazilu, T., 2007, A dynamic model for the impact between the wheel flat and rail, U.P.B. Science Bulletin, series D, 69, 131-144.
Newton, S.D., and Clark, R.A., 1999, An investigation into the dynamic effects on the rail of wheel flats on railway vehicles, Journal of Mechanical Engineering Science, 21, 869-878.
Pieringer, A., and Kropp, W., 2008, A fast time-domain model for wheel/rail interaction demonstrated for the case of impact forces caused by wheel flats, Proceedings of Acoustics 08 Paris, Paris.
Polyshchuk, V.V., Choy, F. K., and Braun, M. J., 2002, Gear fault detection with Time-frequency based parameter NP4, International Journal of Rotating Machinery, 8, 1176-1188.
Qian, S. (2002), Introduction to time-frequency and wavelet transforms, Prentice Hall, London. Wang, C., Zhang, Y., and Zhong, Z., 2008, Fault diagnosis for diesel valve trains based on time–frequency
images, Mechanical system and signal processing, 22, 1981-1993. Wei, C., Xin, Q., and Chong, W.H., 2012, Real-time train wheel condition monitoring by fiber bragg grating
sensors, International Journal of Distributed Sensor Networks, 4, 568-581. Wu, T.X., and Thompson, D.J., 2002, A hybrid model for the noise generation due to railway wheel flats,