95
RAISIN REGION CONSERVATION AUTHORITY
ST, LAWRENCE BEACHES STUDY
FINAL REPORT
MARCH 1992
@ Recycled paper
Prepared by:
Richard Eo Pilon, P.Eng. Water Resources Coordinator
and
Stephen Bo Karl, BoAoAo Water ~uality Coordinator

ACKNOWLEDGEMENTS
The authors of this report would like to thank the following individuals and organisations for their contributions towards this final St. Lawrence Beaches Report;
the staff of the Raisin Region Conservation Authority
1991 summer students Katherine Baker and Kevin Sills
the staff at the Ministry of the Environment Laboratories in Kingston, Ontario, particularly Mr. David Ferguson, Laboratory Supervisor, and Mr. Arthur Ley, Microbiologist, Southeastern Region.
the 'technical steering committee, representing the Ministry of the Environment, the Ministry of Agriculture and Food, the Ministry of Natural Resources, the Eastern Ontario Health Unit, the St. Lawrence Parks Comrmission, /
and the Raisin Region Conservation Authority.
the parks staff who collected and recorded data on a daily basis
EXECUTIVE SUMMARY
This final report represents the overall conclusion of a two year study to assess and identify those bacterial sources affecting rural St. Lawrence River beaches within the Raisin Region Conservation Authority watershed. The study encompassed water quality testing programs at affected beaches and along relevant upstream tributaries, a study of goose and gull populations and their impacts at three of the affected parks, as well as a survey of agricultural operations within a specific study zone.
Each park beach was found to have its own combination of bacterial sources. Generally these sources of bacterial pollution, either individually or in combination, include point sources such as sewage treatment plants and stormwater runoff culverts, and non- point sources including agricultural activity, goose and gull feces, and faulty septic systems. ,
This report concludes with a number of recommended remedial measures intended to eliminateheduce the sources of bacteria currently/potentially affecting the park beaches studied. The costs of these remedial actions and the .strategies for implementation will be included in a separate document, referred to as a C l e a n Up R u r a l B e a c h e s (CURB) P l a n .

TABLE OF CONTENTS Page
ACKNOWLEDGEMENTS ..................................... i EXECUTIVE SUMMARY .em...................e............. ii TABLE OF CONTEWTS .................................... iii TABLE OF EXHIBITS ~ . o e . . . m o . . m o e . o . o . e . e o . o o e o o e . o e . o ~ v
INTRODUCTION TO THE RURAL BEACHES PROGRAM
1.1 The Rural Beaches Program ......................... 1 1.2 Conclusions from 1990 St. Lawrence Rural Beaches
Summary Report .................................... 1 1.3 Objectives for the 1991 Study ...................... 2 STUDY AREA
2.1 Study Area ........................................ 4 2.2 Tributaries .................................. 4
3 . METHODOLOGY AND PROCEDURES
Background Information .......................... .. . 5 Water Sampling .................................... 5 Storm Water Runoff Sampling ....................... 6 Before and After Beach Sampling ................... 6 Sediment Sampling ................................. 6 Geese and Gull Droppings Study .................... 6 Park Activities ................................... 7 ~gricultural operation Survey ...................... 7 Rural Residential Sewage Systems ..,............... 7 Related Projects .................................. 7
4. RESULTS
Background Information ............................ 8 Water Sampling .................................... 8 Storm Water Runoff Sampling ....................... 10 Before and After Beach Sampling ................... 10 Sediment Sampling ................................. 11 Geese and Gull Droppings Study .................... 12 Park Activities ................................... 12 ~gricultural operation Survey ..................... 13
iii

5 . CONCLUSIONS
5.1 Beaches 5.1.1 Crysler Park ............................. 14 5.1-2 Farran Park ............................. 14 5.1.3 . Woodlands Park (day use) ................ 14
I ................ 5.1.4 Woodlands Park (camping) 15
5.1.5 Mille Roches Park ....................... 15 5.1.6 Lakeview Heights Park ................... 15
I .................... 5.1.7 Charlottenburgh Park 16 .......................... 5.1.8 Lancaster Park 16
5.1.9 Glengarry Park ........................... 16 I 5.1.10 Alexandria Park ......................... 16
5.2 Tributaries ............................ 5.2.1 Finney Creek 16
I ............................ 5.2.2 Raisin River 17
5.2.3 Hoople Creek .......,.................... 17
6. RECOMMENDED REMEDIAL MEASURES
6.1 Parks 6.1.1 6.1.2 6.1.3 6.1.4 6.1.5 6.1.6 6.1.7 6.1.8 6.1.9 6.1.10
Crysler Park ............................ 18 Farran Park ............................. 18 ................ Woodlands Park (day use) 19 ................ Woodlands Park (camping) 19 ....................... Mille Roches Park 20 Lakeview Heights Park ................... 20 .................... Charlottenburgh Park 20 .......................... Lancaster Park 21 ......................... Glengarry Parks 21 ......................... Alexandria Park 21
6.2 Tributaries 6.2.1 Finney Creek ............................ 22 6.2.2 Raisin River ............................ 22 6.2.3 Hoople Creek .............................. 23
................ 6.3 Clean Up Rural Beaches (CURB) Plan 23
7. REFERENCES

TABLE OF EXHIBITS
Figure 1 St. Lawrence Beaches Study Area
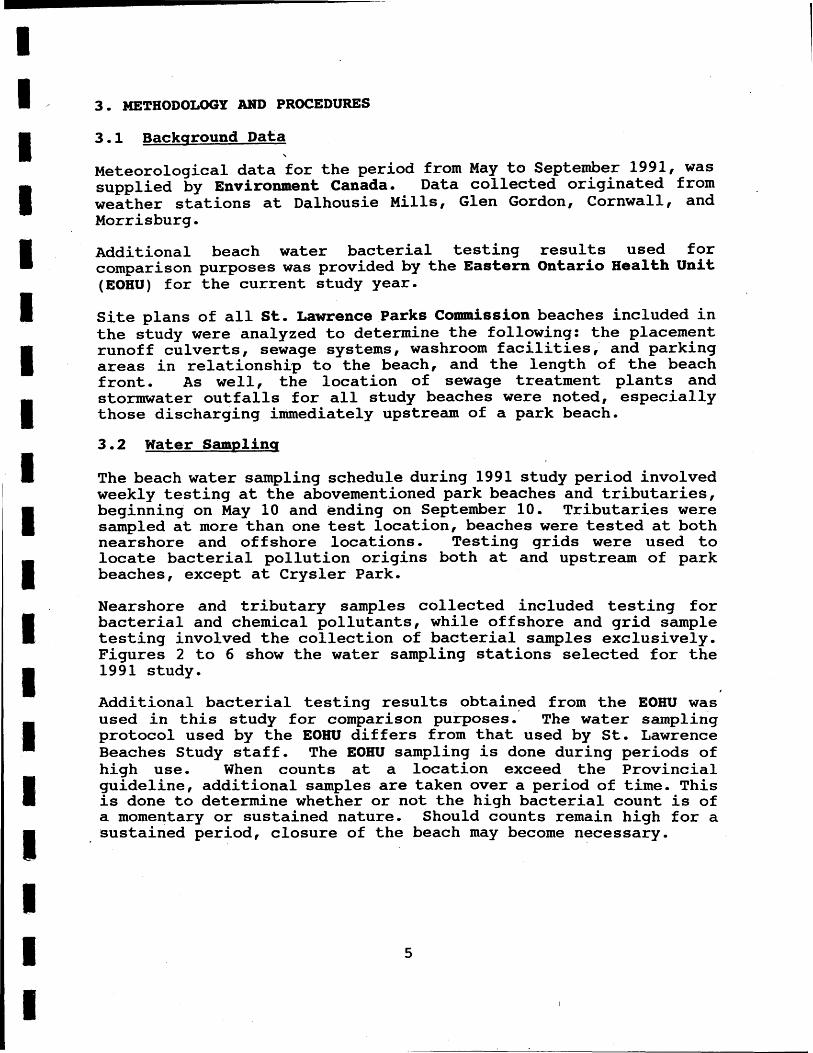
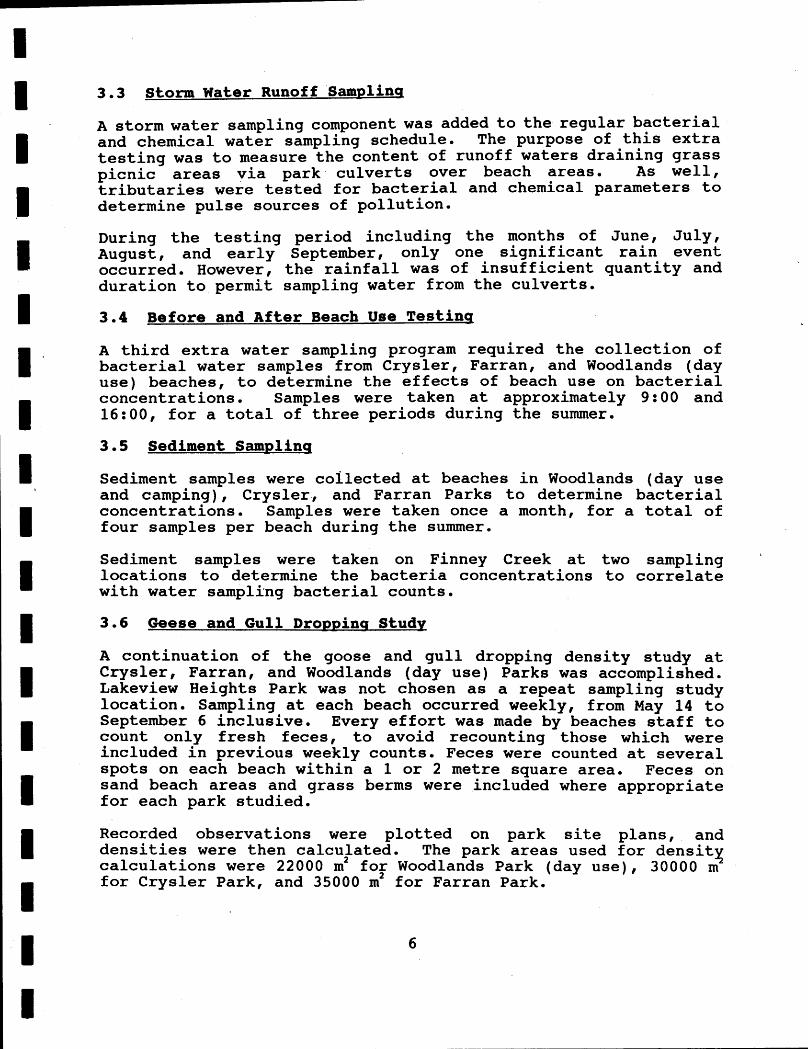
Figure 2 1991 sampling stations - Map 1 Figure 3 1991 Sampling stations - Map 2
I
Figure 4 1991 Sampling stations - Map 3 Figure 5 1991 Sampling stations - Map 4
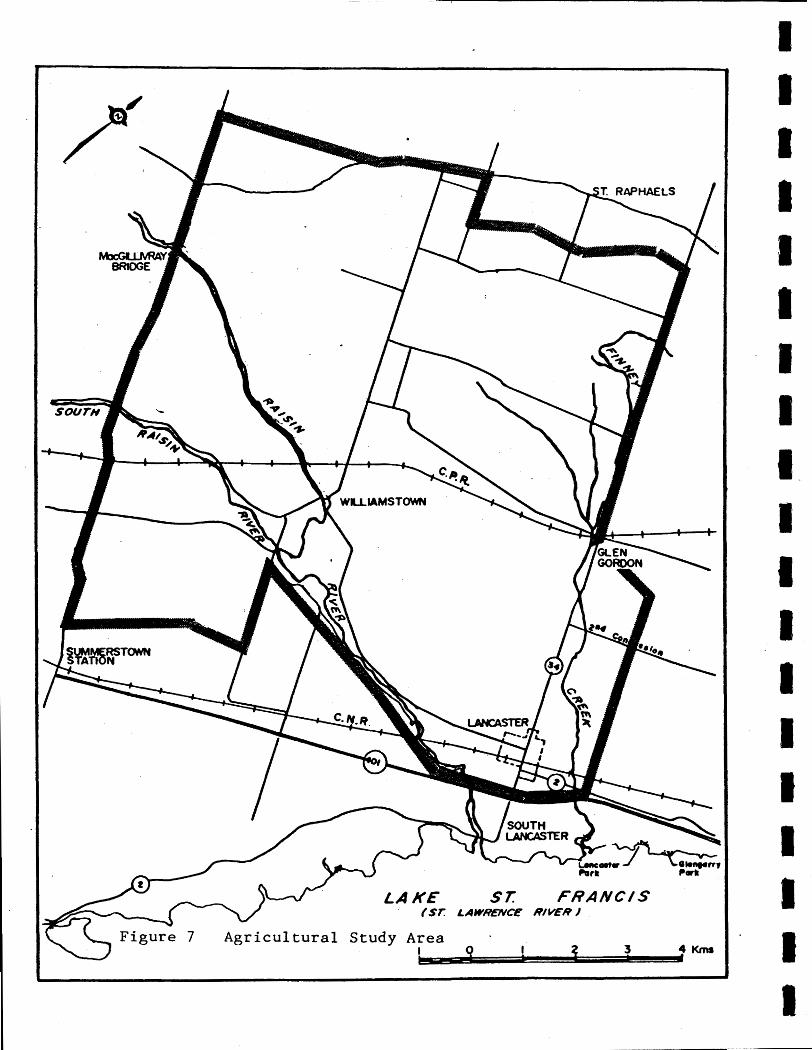
Figure 6 1991 Sampling stations - Map 5 Figure 7 ~gricultural study Area
Figure 8 ~aximum ~ i r Temperature and Rainfall - Cornwall 1991
Fecal ~oliform ~evels at Beach Stations - 1991
Fecal ~oliform ~evels at ~ributary stations - 1991 Figure 27 to 34
Phosphorus Levels at ~ributary Stations - 1991 Figure 35 to 37
Before and After Beach Use Fecal Coliform Counts for Crysler, Farran, and woodlands Day Use Park Beaches - 1991
Fecal ~oliform and ~.coli Densities in Sediment from Selected Park Beaches - 1991
Figure 42 Gull Dropping ~ensities - 1991 Figure 43 Goose Dropping ~ensities - 1991 Figures 4 4 to 50
Total Number of Goose and Gull Droppings for Crysler Park ~each, Farran park Beach, Woodlands Day Use Park Beach
APPENDICES
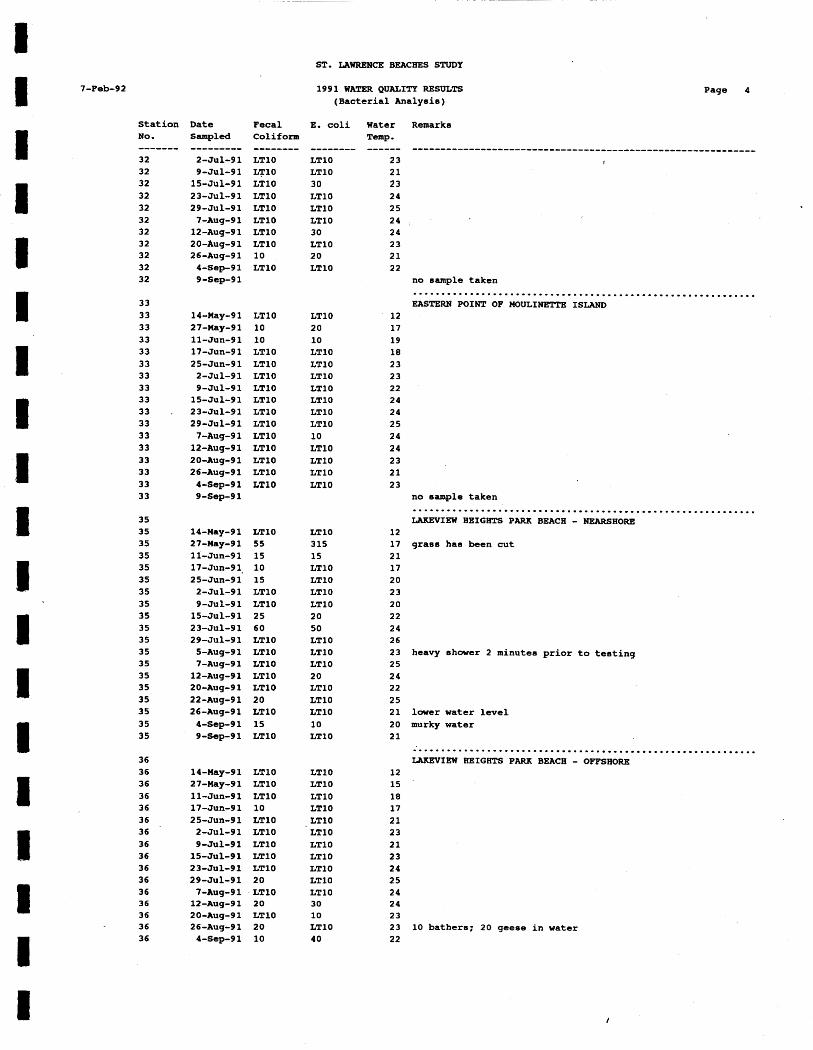
A. 1991 WATER QUALITY DATA - BACTERIAL ANALYSIS B. 1991 WATER QUALITY DATA - CHEMICAL ANALYSIS C . GEESE AND GULL STUDY - DROPPING COUNTS AND DENSITIES D. BEFORE AND AFTER BEACH USE - 1991 E. PARK ACTIVITIES - 1991

1. INTRODUCTION TO THE RURAL BEACHES PROGRAM
1.1 The Rural Beaches Proqram
In response to rural beach closures in Southern and Eastern Ontario during the early to mid 1 9 8 0 ' ~ ~ the Ontario Ministry of the Environment (MOE) established the Rural Beaches Program. This report is the second and final report of a two year study to address the problem of surface water quality in the vicinity of shoreline beaches within the Raisin Region Conservation Authority watershed.
The purpose of the second year of the study was to provide the groundwork for a Clean Up Rural Beaches (CURB) Plan. The CURB Plan is a detailed document providing implementations strategies and costs for specific remedial actions to eliminate, reduce, or otherwise control bacterial pollution sources identified in this report.
1.2 Conclusions from the 1990 St. Lawrence Beaches Summary Report
The primary objective of the 1990 study year was to establish a data base which would be used to identify sources of water quality problems within the defined study area. Based on this first year of study, eight conclusions were stated. In brief, these conclusions were:
1. Background levels of fecal coliforms in the St. Lawrence River typically have bacterial densities of less than 10 organisms per 100 mL of water sampled. This background level is below the Provincial Recreation Water Quality Guideline of 100 organisms per 100 mL of water.
2. Most beaches seem to be influenced by local sources of bacterial pollution rather than upstream sources. These possible sources of contamination may be storm water runoff, goose and gull feces, local septic systems, and bathing activities.
3 . Lancaster and Glengarry Parks are the only beaches which . are affected by tributaries, namely Finney Creek and the
Raisin River.
4 . High fecal coliform and E.coli levels in the vicinity of the Woodlands campground beach may be attributable to bacteria from the 1nglesi.de sewage treatment plant.
5. Several high bacteria counts at or near Alexandria Park may be attributed to septic systems or other unspecified local sources .

6. Nearshore high bacteria counts recorded between Summerstown and Pilon's Point may be the result of faulty residential septic systems.
7. Goose and gull feces have bacterial levels comparable to those of human and animal sewage.
8. Evaluation of the effect of goose and gull feces on beach bacterial contamination was inconclusive because of low water bacterial counts at four beaches. which were surveyed for bird dropping densities.
1.3 Obiectives for the 1991 St. Lawrence Rural Beaches stud^ Proqram
Based on the conclusions of the 1990 St. Lawrence Rural Beaches Summarv Report, the objectives for the 1991 study year were formulated as recommended actions. This final report documents the actions taken, the results of those actions, and recommendations for further actions.
The specific objectives were as follows:
1. Continue the water sampling program in Year 1 of the -Rural Beaches Program, to better focus on specific areas where water quality problems have been identified;
2. Where local sources of beach pollution have been identified, conduct a detailed survey of park activities;
3 . To assess the correlation of bacteria with other parameters, daily sampling should be conducted at a specific beach;
4. Review the results of a St. Lawrence Parks Commission study of their park sewage systems to discover if these systems are contributing to local beach bacterial pollution;
5. Sediment samples should be taken at selected beaches, as well as samples of storm runoff waters, and water samples before and after beach use;
6. Continuation of the goose and gull beach feces count in order to gather data for the purpose of comparison with previous results, and to correlate data with tested beach water bacterial levels;
7. Storm water outfalls should be located and residential sewer systems assessed to determine their impact on ~lexandria Park beach;

8. Examine the effects of the Ingleside Sewage Treatment Plant on beach water quality at Woodlands Park through establishment of a systematic testing grid;
9. The Raisin River. and Finney Creek were identified as likely bacterial pollution sources at Lancaster and Glengarry Parks. Because of the predominantly agricultural nature of the watershed areas of these tributaries, on-going monitoring along their course should be continued. As well, information concerning farming operations and agricultural practices should be collected within the tributaries watersheds. Specific areas of study include livestock access to watercourses, manure and land'management practices, and milkhouse wash water waste disposal;
10. The application of a Clean Up Rural Beaches (CURB) model to prioritize agricultural sources;
11. Continuation of a public information program to inform the community about the second phase of the Rural Beaches Program;
12. Contacts with landowners to promote water quality awareness, and remedial measures and technical advice available for alternative waste management solutions;
13. Establish remedial options based on the findings fromthe two years of study under the Rural Beaches Program. These options would be assessed and recommendations made on the implementation of these measures to improve beach water quality.
All of these objectives have been addressed in this report.
2. STUDY AREA \
2.1 Beaches
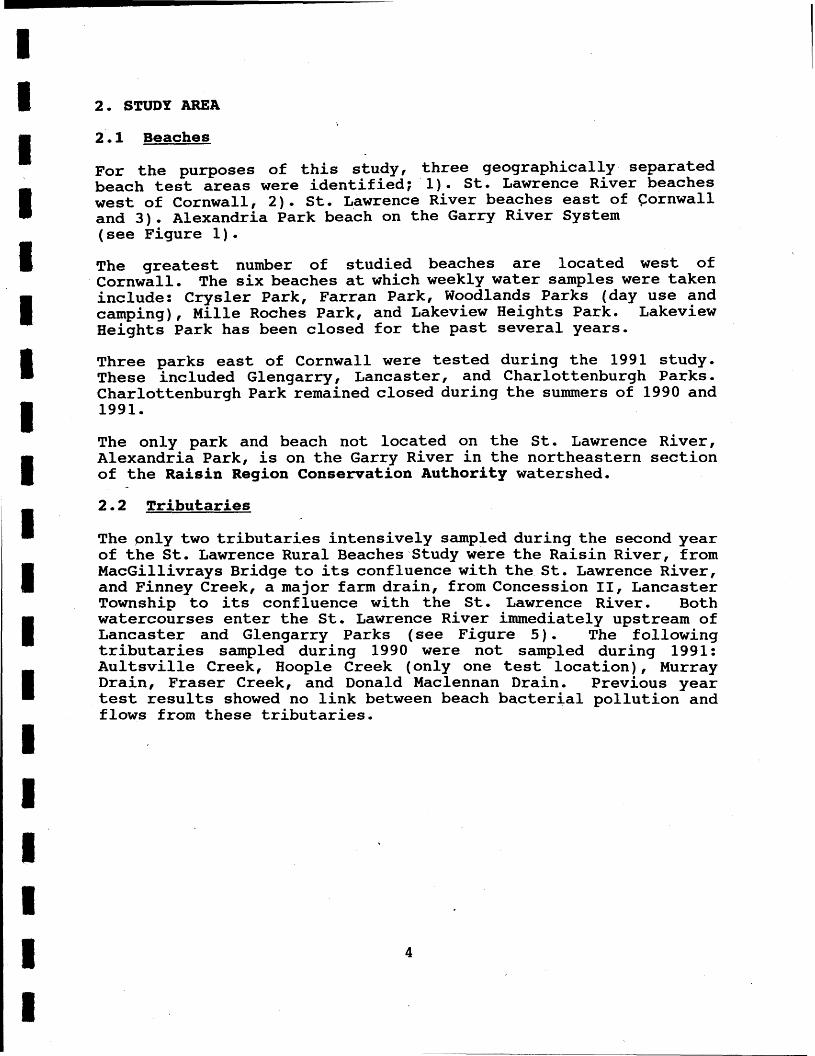
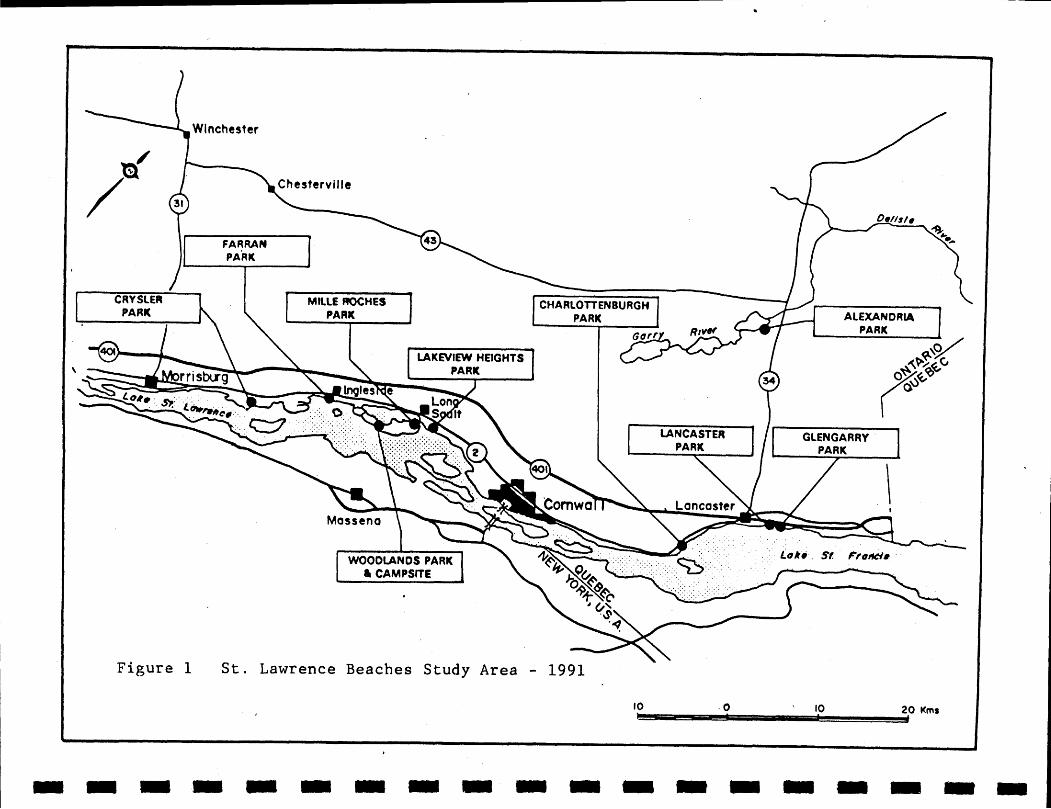
For the purposes of this study, three geographically separated beach test areas were identified; 1). St. Lawrence River beaches west of Cornwall, 2). St. Lawrence River beaches east of Cornwall and 3). ~lexandria Park beach on the Garry River System (see Figure 1) . The greatest number of studied beaches are located west of Cornwall. The six beaches at which weekly water samples were taken include: Crysler Park, Farran Park, Woodlands Parks (day use and camping), Mille Roches Park, and Lakeview Heights Park. Lakeview Heights Park has been closed for the past several years.
Three parks east of Cornwall were tested during the 1991 study. These included Glengarry, Lancaster, and Charlottenburgh Parks. Charlottenburgh Park remained closed during the summers of 1990 and 1991.
The only park and beach not located on the St. Lawrence River, Alexandria Park, is on the Garry River in the northeastern section of the Raisin Region Conservation Authority watershed.
2.2 Tributaries
The pnly two tributaries intensively sampled during the second year of the St. Lawrence Rural Beaches Study were the Raisin River, from ~acGillivrays Bridge to its confluence with the St. Lawrence River, and Finney Creek, a major farm drain, from Concession 11, Lancaster Township to its confluence with the St. Lawrence River. Both watercourses enter the St. Lawrence River immediately upstream of Lancaster and Glengarry Parks (see Figure 5). The following tributaries sampled during 1990 were not sampled during 1991: Aultsville Creek, Hoople Creek (only one test location), Murray Drain, Fraser Creek, and Donald Maclennan Drain. Previous year test results showed no link between beach bacterial pollution and flows from these tributaries.
MILL€ ROCHES CHARLOlTENBURGH ALEXANDRIA
WOOOLANOS PARK
,
I Figure 1 St. Lawrence Beaches Study Area - 1991
10 0 20 Urns
I
3. METHODOLOGY AND PROCEDURES
3.1 Backqround Data \
Meteorological data for the period from May to September 1991, was supplied by Environment Canada. Data collected originated from weather stations at Dalhousie Mills, Glen Gordon, Cornwall, and Morrisburg.
Additional beach water bacterial testing results used for comparison purposes was provided by the Eastern Ontario Health Unit (EOHU) for the current study year.
Site plans of all St. Lawrence Parks Commission beaches included in the study were analyzed to determine the following: the placement runoff culverts, sewage systems, washroom facilities, and parking areas in re1ationshi.p to the beach, and the length of the beach front. As well, the location of sewage treatment plants and stormwater outfalls for all study beaches were noted, especially those discharging immediately upstream of a park beach.
3.2 Water Samplinq
The beach water sampling schedule during 1991 study period involved weekly testing at the abovementioned park beaches and tributaries, beginning on May 10 and ending on September 10. Tributaries were sampled at more than one test location, beaches were tested at both nearshore and offshore locations. Testing grids were used to locate bacterial pollution origins both at and upstream of park beaches, except at Crysler Park.
Nearshore and tributary samples collected included testing for bacterial and chemical pollutants, while offshore and grid sample testing involved the collection of bacterial samples exclusively. Figures 2 to 6 show the water sampling stations selected for the 1991 study.
, Additional bacterial testing results obtained from the EOHU was used in this study for comparison purposes. The water sampling protocol used by the EOHU differs from that used by St. Lawrence Beaches Study staff. The EOHU sampling is done during periods of high use. When counts at a location exceed the Provincial guideline, additional samples are taken over a period of time. This is done to determine whether or not the high bacterial count is of a momentary or sustained nature. Should counts remain high for a sustained period, closure of the beach may become necessary.

L""":d"El G "TS PARK
LAKE ST LAWRENCE
Figure 3 1991 Sampling Stations - Map 2


3.3 Storm Water Runoff Sampling
A storm water sampling component was added to the regular bacterial and chemical water sampling schedule. The purpose of this extra testing was to measure the content of runoff waters draining grass picnic areas via park culverts over beach areas. As well, tributaries were tested for bacterial and chemical parameters to determine pulse sources of pollution.
During the testing period including the months of June, July, August, and early September, only one significant rain event occurred. However, the rainfall was of insufficient quantity and duration to permit sampling water from the culverts.
3.4 Before and After Beach Use Testinq
A third extra water sampling program required the collection of bacterial water samples from Crysler, Farran, and Woodlands (day use) beaches, to determine the effects of beach use on bacterial concentrations. Samples were taken at approximately 9:00 and 16:00, for a total of three periods during the summer.
3.5 Sediment Samlinq
Sediment samples were collected at beaches in Woodlands (day use and camping), Crysler, and Farran Parks to determine bacterial concentrations. Samples were taken once a month, for a total of four samples per beach during the summer.
Sediment samples were taken on Finney Creek at two sampling '
locations to determine the bacteria concentrations to correlate with water sampling bacterial counts.
3.6 Geese and Gull Droppinq Studv
A continuation of the goose and gull dropping density study at Crysler, Farran, and Woodlands (day use) Parks was accomplished. Lakeview Heights Park was not chosen as a repeat sampling study location. Sampling at each beach occurred weekly, from May 14 to September 6 inclusive. Every effort was made by beaches staff to count only fresh feces, to avoid recounting those which were included in previous weekly counts. Feces were counted at several spots on each beach within a 1 or 2 metre square area. Feces on sand beach areas and grass berms were included where appropriate for each park studied.
Recorded observations were plotted on park site plans, and densities were then calcufated. The park areas used for density calculations were 22000 m £05 Woodlands Park (day use), 30000 m for Crysler Park, and 35000 m for Farran Park.

3.7 Park ~ctivities
A daily record of park activities was kept by park staff on request, to determine if any or all of these activities has an impact on beach water bacterial counts. The activity sheets included record columns for rainfall, total attendance, number of bathers, grass cutting, beach sand raking, application of new sand, and washroom lineups.
3.8 Aqricultural Operation Survev
The survey of agricultural operations was a major instrument employed to locate rural source bacterial pollution associated with farm practices within the Finney Creek and lower Raisin River watersheds (see Figure 7) . A 21 question survey was delivered person to person during the summer and fall of 1991, and covered farm practices such as manure storage and handling, milkhouse wash water disposal, and animal pasturing. A total of 45 farms were surveyed, representing approximately 90% of all farms within the agricultural study area.
3.9 Rural Residential Sewaqe Systems
A study ofindividual rural area residential sewage systems was not conducted in either 1990 or 1991. Inadequate septic systems may have been or may continue to be a source of bacterial pollution within the beaches study area, particularly in the Lancaster area and along the Raisin River. Due to the geographic size of the area, and the urban nature of the more significant concentrations of individual septic serviced dwellings and commercial establishments, such a study would have required additional resources not currently available.
The Ontario Ministry of the ~nvironment completed a study in 1992 of the sewage systems in the hamlet of South Lancaster. The study will form the basis for a plan of remedial measures intended to ameliorate those problems which were identified.
3.10 Related Proiects
A public information display to promote and create awareness about the St. Lawrence Rural Beaches Program continued during the 1991 study year by way of a display at the Cornwall Boat and Sportsman Show, and through personal contacts and distribution of water quality literature to landowners in conjunction with the Farm Operation Survey.
I
A study of individual park sewage disposal systems to be conducted by the St. Lawrence Parks during 1991 was delayed because of capital budget priorities. The study is scheduled to be conducted during 1992/1993.
4. RESULTS
4.1 Backqround Data
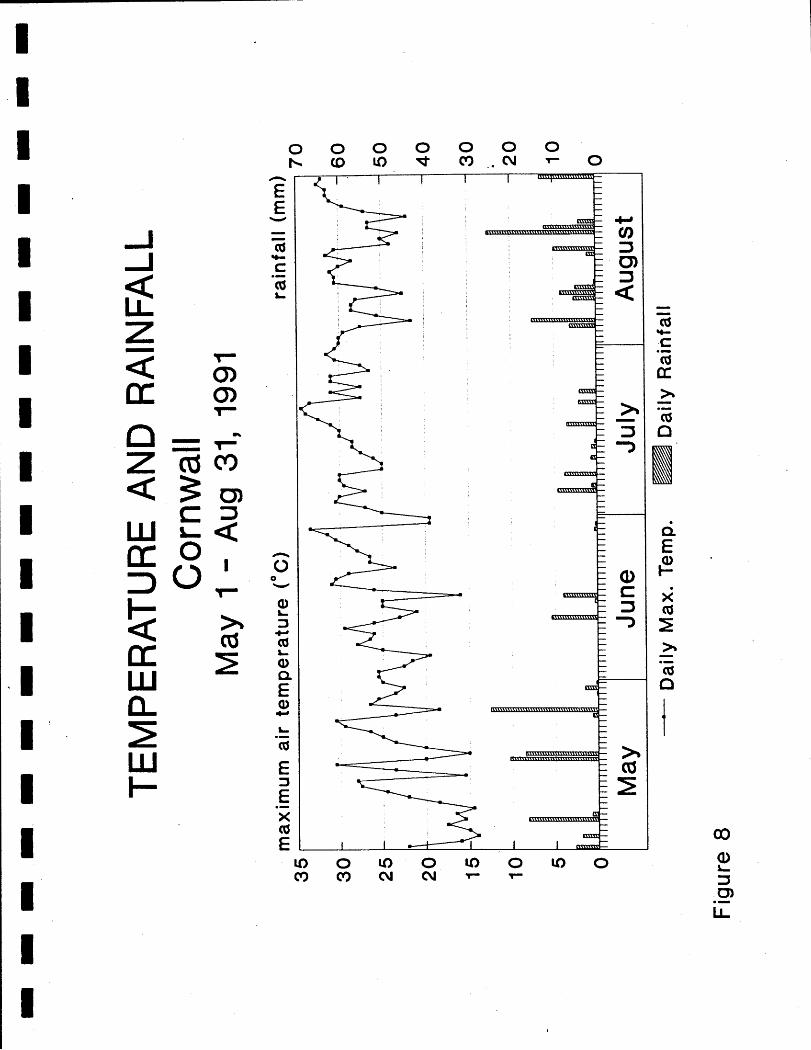
The summer of 1991 had meteorological conditions which could be described as relatively long episodes of warm weather, punctuated by extended rain free periods (see figure 8 ) . The lack of appreciable amounts of precipitation during the summer of 1991 did have an affect on several tributaries, particularly Finney Creek. The lowering of water levels made flow monitoring for the purpose of determining bacterial die-off rates impractical because of ponding . The overall relationship between bacterial growth and meteorological conditions is complex, and does not lend itself towards definitive correlations between weather conditions and bacteria growth. It is uncertain what role meteorological conditions played during the summers of 1990 and 1991 when no beaches were closed, and the previous two summers when several beach closures occurred.
Site park plans for several St. Lawrence Parks Commission beaches showed runoff culverts and land contours which drain upland areas such as parking lots and grassed picnic grounds, diverting waters over the beach area. his situation exists at Woodlands (day use), Farran, and Mille Roche Park beaches. The lack of earthen berms or other structures to deflect upland runoff waters away from beach areas exists at Glengarry and ~akeview Heights Park beaches. Other parks affected include municipally owned Alexandria Park and privately owned Lancaster Park beaches. Additionally, parks affected by upstream sewage treatment plants (STPs) include Woodlands Park (camping) beach, and Lakeview Heights Park beach. Woodlands is downstream of the STP at Ingleside, Lakeview Heights is downstream of the STP at Long Sault.
4.2 Water Samplinq
In both study years, Farran Park beach has displayed fecal bacterial levels that are consistent. During the early and middle periods of the swimming season, fecal bacterial levels are relatively low and stable. . Towards the beginning of August however, fecal coliform levels rose to or slightly exceeded the provincial guideline of 100 fecal coliforms per 100 mL of water. The Eastern Ontario Health Unit follows up high bacterial counts by additional water sampling. Sampling is continued for three consecutive days. The purpose of this sampling is to determine whether high bacterial counts are of a periodic or sustained nature. If bacterial counts remain above the provincial objective during the three day sampling period, the beach will be closed until bacterial counts are below the guideline level.
Fecal bacterial counts above the provincial guideline were recorded on three occasions during the 1991 weekly sampling period at Woodlands Park (day use) beach. All high counts occurred during the latter half of the summer water recreation season (see figure 12) . Of all the beaches tested, Mille Roches Park beach had the highest weekly sampled bacterial counts, exceeding or nearly exceeding the provincial guideline on six occasions. EOHU results show exceedance of guideline levels for short periods of time on four occasions (see figure 13). During the 1991 testing period, Lakeview Heights Park beach remained closed because of financial considerations. Fecal coliform counts were within the acceptable limits of 100 fecal coliforms per 100 mL of water (see figure 14). On two testing occasions, fecal coliform counts were approaching the upper limit of acceptability.
Bacteria counts at Charlottenburgh Park during the 1991 study year were relatively low, exceeding the provincial guideline on one occasion and approaching the upper limit on another in mid-summer (see figure 15).
Test results from the 1991 study year showed a few significant bacterial concentrations affecting Glengarry and Lancaster Park beaches (see figures 16 & 17). On two occasions, in July and August, bacterial counts at Glengarry Park exceeded the provincial guideline. EOHU testing showed bacterial rates exceeding the guideline for brief periods on four occasions in mid-summer. The guideline was exceeded at Lancaster Park on one occasion in mid- August.
1991 test results showed high fecal coliform counts on two occasions at Alexandria Park beach (see figure 18). EOHU testing showed six brief occasions when fecal bacterial counts exceeded the provincial guideline.
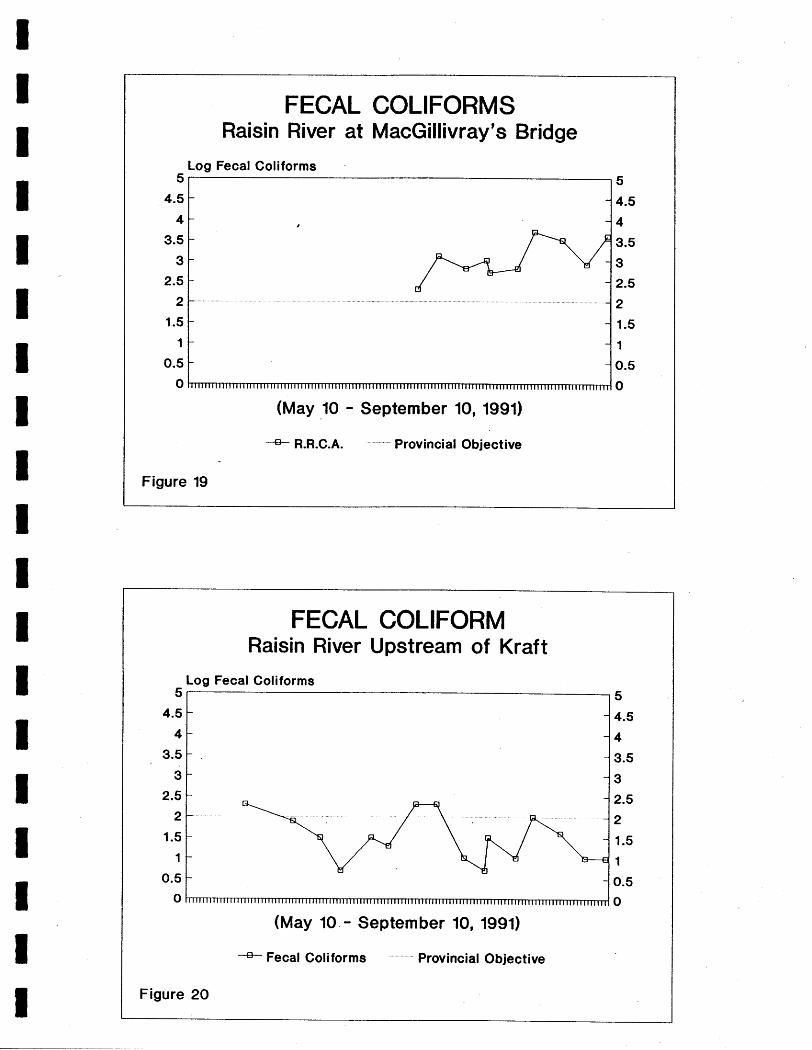
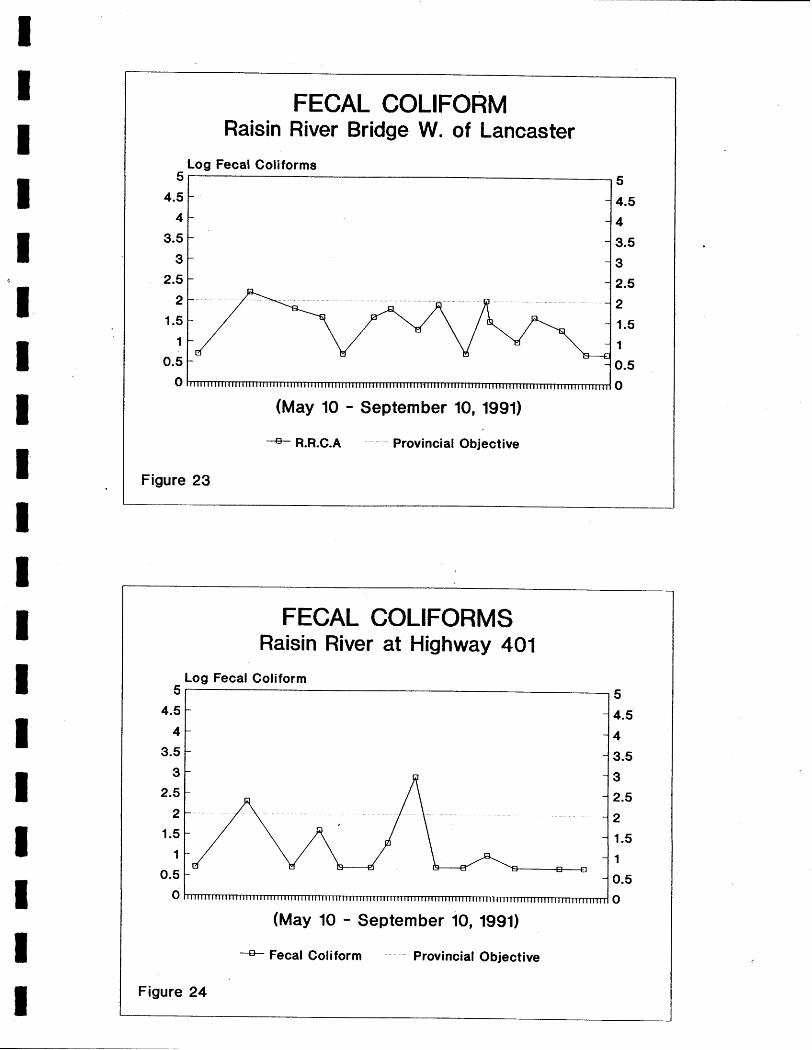
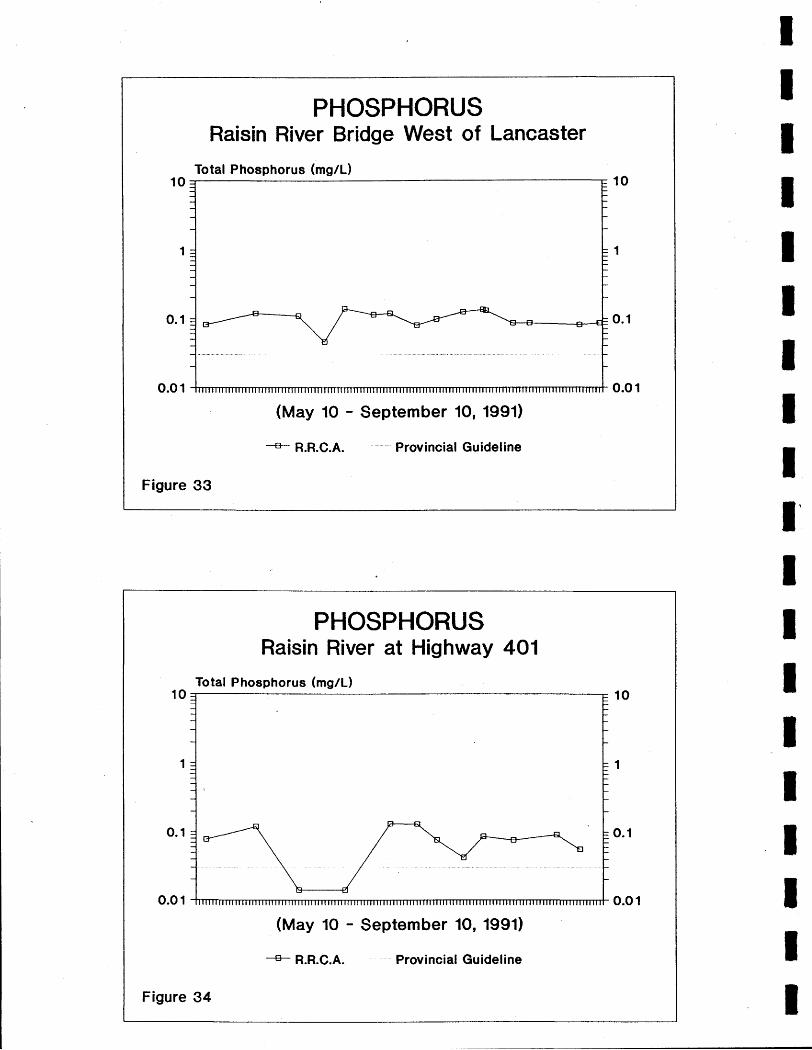
Fecal coliform testing results on the Raisin River at six test locations were variable, with fecal coliform levels ranging from acceptable to unacceptable (see figures 19 to 24). Only the test location at MacGillivray's Bridge had results which exceeded the guideline limit on all sampling runs (see figure 19). Analysis of Provincial Water Quality Network data collected over several years on the Raisin River showed that bacterial counts historically tend to rise in summer, peak during mid-season, and decline during the fall, reaching their lowest levels in mid-winter. Fecal coliform counts during the' mid-summer period frequently exceed the provincial guideline. This fecal bacterial concentration pattern also occurred during the years 1990 and 1991-

Total phosphorus levels on the Raisin River were similar to those of the previous year, with levels ranging from 5 to 13 times the guideline level (see figures 27 to 32).
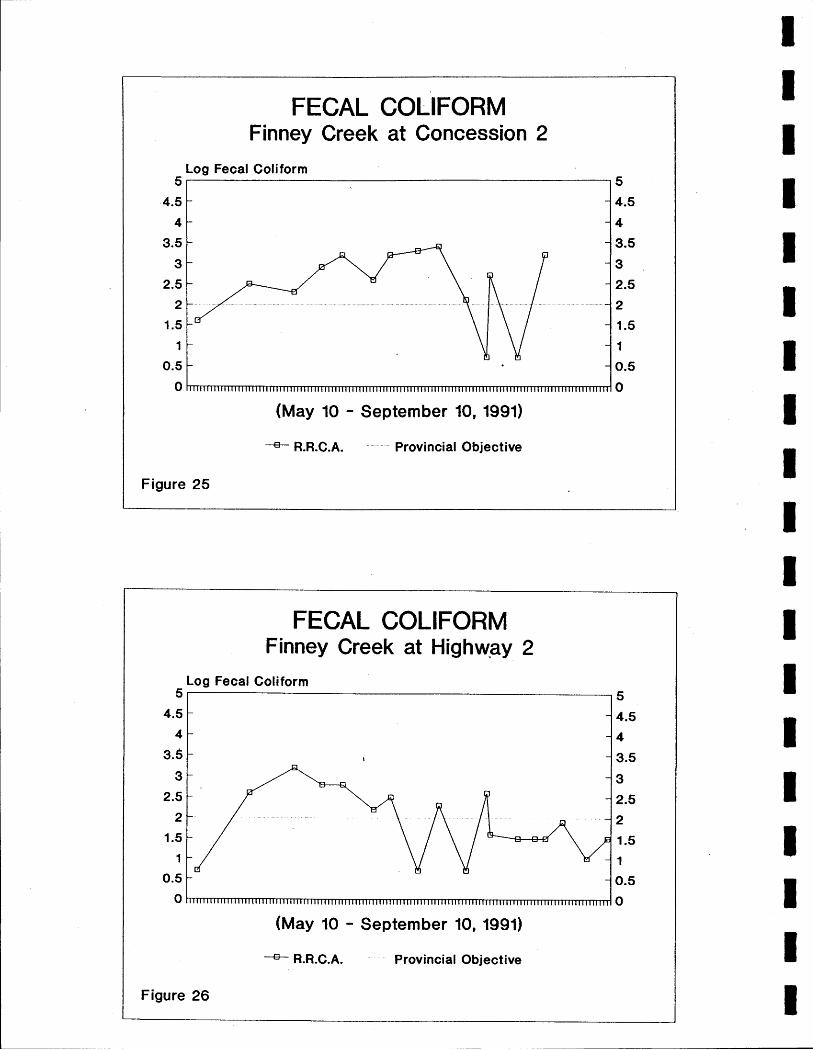
The test locations on Finney Creek showed high bacterial counts during the greater part of the summer, particularly the test location at Concession 11, Lancaster Township. On only 3 occasions during the 1991 sampling program did fecal colif orm levels fall to within' the acceptable limit (see figure 25) . Sampling at this location was suspended froni August 27 to September 9 as a result of low flow conditions causing ponding.
The second test location at Highway 2 suffered from low flow conditions during the same period, though ponding did not occur (see figure 26). his may have been a result of the surfacing of groundwater springs. Fecal bacterial counts at this location were within the provincial guideline objective on 8 occasion. High counts tended to coincide with flowing conditions, leading to the conclusion that most of the bacteria originates at upstream locations.
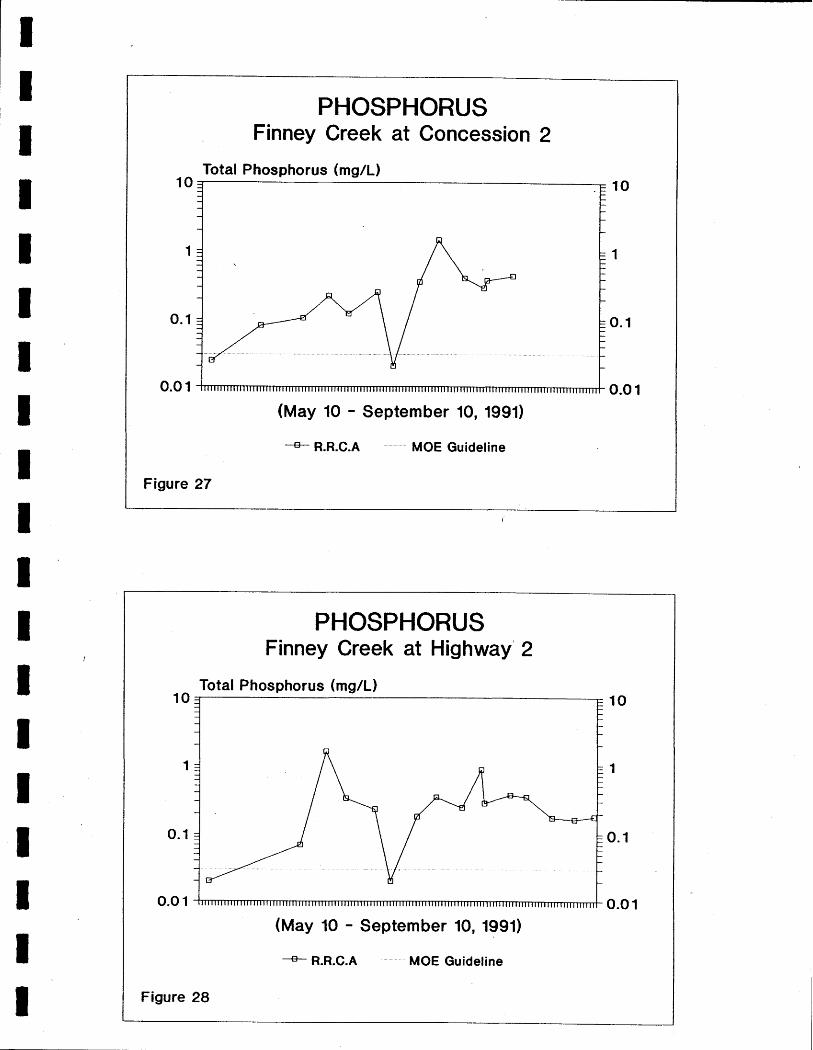
Total phosphorus levels in Finney Creek were between 37 and 50 times the provincial guideline level of 0.03 mg/L (see figures 27 & 28). These levels were the highest detected in any of the tested tributaries. The results were consistent with those measured during the previous year.
4.3 Storm Water Runoff Sampling
Bacterial testing could not be conducted during the summer of 1991 because of insufficient rainfall during the testing period to cause overland runoff.
4.4 B e f o r e and A f t e r B e a c h Use Testinq
The results of water samples taken prior to and immediately following human beach activity at three of the park beaches is shown in figures 35 to 37. ~nalysis of sample testing results did not substantiate the assumption that bacterial counts increase with beach usage. No clear pattern of fecal bacterial density occurrence could be determined. On some occasions bacterial counts increased after beach use as was hypothesized. However, on other testing occasions, bacterial counts were actually lower following beach use. From the data collected it is unclear why such variations from the hypothesis occurred. No clear pattern can be determined when results from testing conducted on the same day at all three parks are compared. Sampling did not always occur during periods of heavy park beach use.

4.5 Sediment Sam~linq
The sediment samples taken from four of the parks beaches show low fecal coliform and E.coli bacterial levels in May (figures 38 to 41) . The highest levels of both bacteria were found in August, though bacterial densities varied from beach to beach. The overall highest counts were found at Woodlands campground beach, and the next highest counts recorded at Farran Park Beach. Sediment sampling did not always coincide with periods of heavy park beach use.

FECAL COLIFORM Crysler Park
0 1 0
(May 10 - September 10, 1991)
Log Fecal Coliform 5 5
R.R.C.A Provincial Objective * E.0.H.U
4.5
4
Figure 9
- -
- - 4.5
4
FECAL COLIFORM Farran Park
Log Fecal Coliform 5
4.5
4
3.5
3 2.5
2
1.5
1
0.5
(May 10 - September 10, 1991)
* R.R.C.A. Provincial Objective * E.O.H.U.
Figure 10
-
- -
- -
- - - -
- -
5
4.5
4
3.5
3
2.5 -
X
- ;IC x - *
I3 rn n C I ~ - - V Y U Y
- 0.5
0 0 0


FECAL COLIFORM Mille Roches Park Beach
Log Fecal Coliform 5 5
4.5 - - 4.5 4 - - 4
3.5 - - 3.5
3 - - 3 2.5 - - 2.5
2 -
0.5 - - 0.5 0 . 0 1 1 1 1 0
(May 10 - September 10, 1991)
* R.R.C.A. Provincial Objective * E.O.H.U.
Figure 13
FECAL COLIFORM Lakeview Heights Park
Log Fecal Coliform . 5
4.5
4
3.5
3
2.5
2
1.5
1
0.5
0
(May 10 - September 10, 1991)
* R.R.C.A. Provincial Objective
\
Figure 14
- -
- -
- -
- -
- -
- -
-
5
4.5
4
3.5
3
2.5
2
- nn " - -- - - 0.5
O l l l l l l m m m m m r r 0

0 9 0
(May 10 - September 10, 1991)
FECAL COLIFORM Charlottenburgh Park
Log Fecal Coliform
* R.R.C.A. Provincial Objective * E.O.H.U.
5
4.5
4
3.5
3
2.5
2
1.5
1
0.5
0
Figure 16
(May 10 - September 10, 1991) \
R.R.C.A. Provincial Objective
Figure 15 \
-
- -
- - - -
- - - -
5.
4.5
4
3.5
3
2.5 - - 2 -
- "
- - - 0.5
:: 0

FECAL COLIFORM Glengarry Park
Log Fecal Coliform 5
4.5,-
4
3.5
3
2.5
FECAL COLIFORM Alexandria Park
Log Fecal Coliform 5
4.5
4
3.5
3
2.5
2
1.5
1
0.5
2 - X
0.5 - - 0.5
0 P I I I I I I I I I I I I I I I I I ~ ~ ~ ~ ~ ~ ~ ~ ~ ~ ~ ~ ~ ~ ~ ~ ~ ~ ~ I I I I I I I I ~ ~ ~ ~ I I I I I I 0
(May 10 - September 10, 1991)
* R.R.C.A. Provincial Objective * E.O.H.U.
Figure 17
-
- - - - -
X -
- x -
5
4.5
4
3.5
3
2.5
(May 10 - September 10, 1991)
* R.R.C.A. Provincial Objective % E.O.H.U.
Figure 18
-
- -
- - - -
- X - - -
- - - - - -
- -
0 0 0
5
4.5
4
3.5
3
2.5
2
1.5
1
0.5
FECAL COLIFORMS Raisin River at MacGillivray's Bridge
Log Fecal Coliforms 5 1 15
(May 10 - September 10, 1991)
R.R.C.A. . - - . - Provincial Objective
Figure 19
FECAL COLIFORM Raisin River Upstream of Kraf t
Log Fecal Coliforms 5
4.5
4
3.5
3
2.5
2
1.5
1
0.5
(May 10 - September 10, 1991)
-++- Fecal Coliforms Provincial Objective
Figure 20
- - - -
- - - -
- -
5
4.5
4
3.5
3
2.5 -
-
-
- -
000
0.5

FECAL COLIFORM Raisin River Upstream of Williamstown
Log Fecal Coliforms 5
4.5
4
3.5
3
2.5
2
1.5
1
0.5
FECAL COLIFORM Raisin River Downstream of Williamstown
Fecal Coliforms 5
4.5
4
3.5
3
2.5
2
1.5
1
0.5
(May 10 - September 10, 1991) ,
+ R.R.C.A. Provincial Objective
Figure 21 1
- -
- -
- - - -
5
4.5
4
3.5
3
(May 10 - September 10, 1991)
* R.R.C.A. Provincial Objective
Figure 22
- - - -
- - - -
- I -
-
- - 1 - - 0.5
O l l l l l ~ ~ l l l l l l l l l l l l l 1 1 1 1 1 1 1 1 1 1 1 1 1 1 1 1 1 1 1 1 0
5
4.5
4
3.5
3 - -
-
- -
- -
0 0 0
1
0.5
FECAL COLIFORM Raisin River Bridge W. of Lancaster
0'0
(May 10 - September 10, 1991)
Log Fecal Coliforms
* R.R.C.A
Figure 23
5
4.5
4
3.5
3
Provincial Objective
FECAL COLIFORMS Raisin River at Highway 401
- -
- - - - - -
Log Fecal Coliform 5
5
4.5
4
3.5
3
(May 10 - September 10, 1991)
* Fecal Coliform Provincial Objective
Figure 24
PHOSPHORUS Finney Creek at Concession 2
Total Phosphorus (mg/L)
0.01 0 0.01
(May 10 - September 10, 1991)
* R.R.C.A MOE Guideline
Figure 27
PHOSPHORUS Finney Creek at Highway 2
Total Phosphorus (mg/L) 10 10
1 1
0.1 0.1
0.0 1 0.0 1
(May 10 - September 10, 1991) - R.R.C.A MOE Guideline
Figure 28

PHOSPHORUS Raisin River at MacGillivray's Bridge
Total Phosphorus (mg/L) 10 - - -
- - -
1: - - - - - -
PHOSPHORUS Raisin River Upstream of Williamstown
Total Phosphorus (mg/L)
= 10 - - - - - -
r 1 - - - - - -
10 -I - - -
1: - - - - - -
- 10 - - - - - -
f 1 - - - - - -
0.1 : - - - - - -
0.0 1
0.1 r - - - - - -
0.0 1
(May 10 - September 10, 1991)
R.R.C.A. Provincial Guideline
Figure 29
: 0.1 - - - - -
-1-
(May 10 - September 10, 1991)
* R.R.C.A. Provincial Guideline
Figure 30
: 0.1 - - -
-
0.0 1
1 7 -
- - -
0.0 1
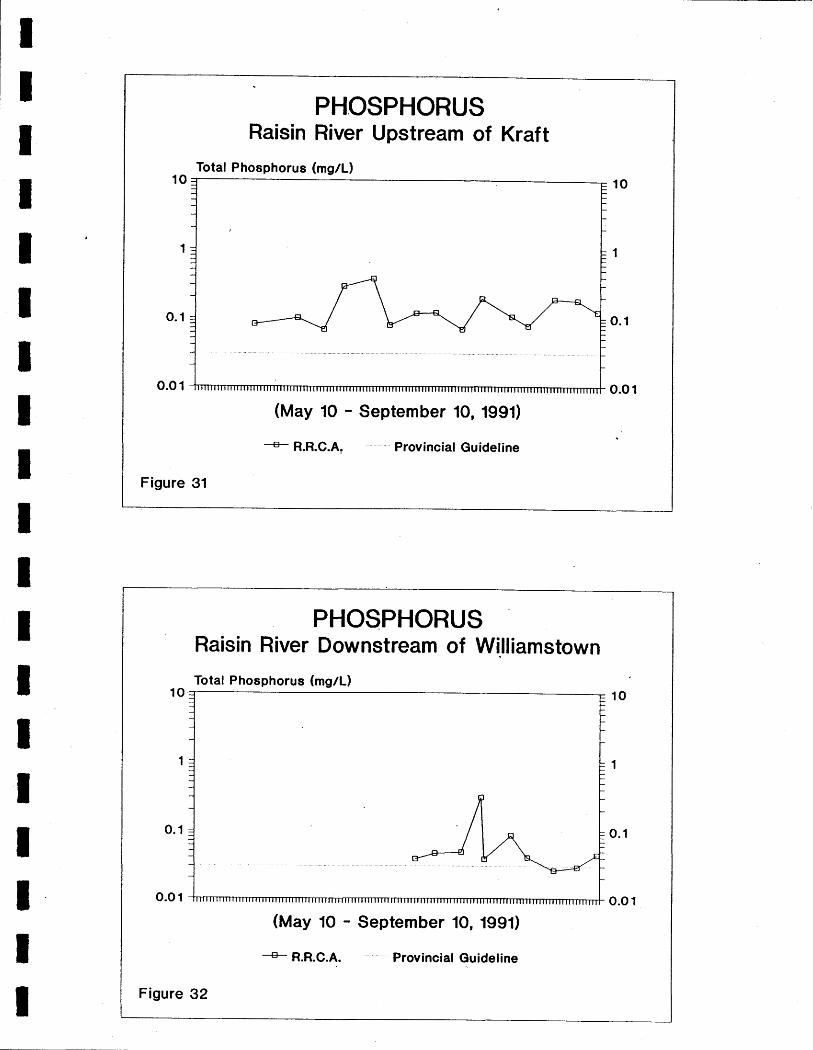
PHOSPHORUS Raisin River Upstream of Kraft
Total Phosphorus (mg/L) 10 10
(May 10 - September 10, 1991) - R.R.C.A, Provincial Guideline
Figure 31
PHOSPHORUS Raisin River Downstream of Williamstown
Total Phosphorus (mg/L)
(May 10 - September 10, 1991)
* R.R.C.A. Provincial Guideline
Figure 32

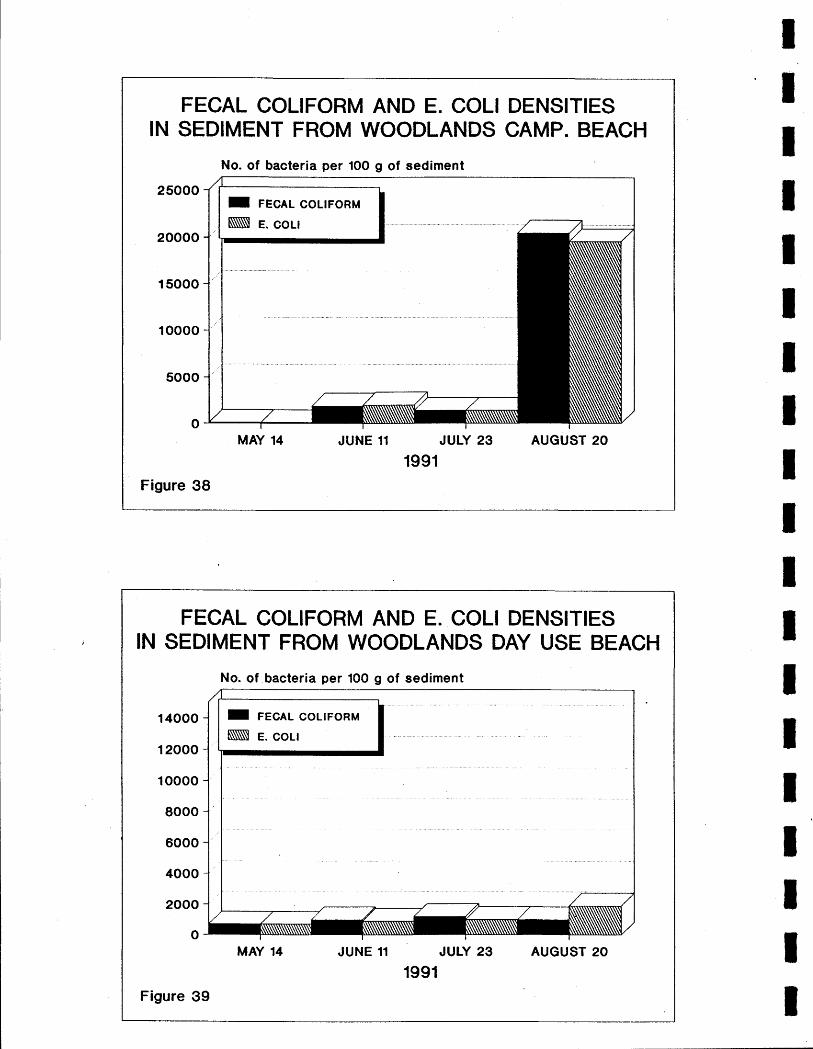
FECAL COLIFORM AND E. COLl DENSITIES IN SEDIMENT FROM WOODLANDS CAMP. BEACH
No. of bacteria per 100 g of sediment
25000 -
20000 -
15000 -
10000 -
5000 -
0 - I I I I
MAY 14 JUNE 11 JULY 23 AUGUST 20
1991 Figure 38
FECAL COLIFORM
FECAL COLIFORM AND E. COLl DENSITIES IN SEDIMENT FROM WOODLANDS DAY USE BEACH
No. of bacteria per 100 g of sediment
L
FECAL COLIFORM
o J I I I I
MAY 14 JUNE 11 JULY 23 AUGUST 20
1991 Figure 39

FECAL COLIFORM AND E. COLl DENSITIES IN SEDIMENT FROM CRYSLER PARK BEACH
No. of bacteria per 100 g of sediment A 1
MAY 14 JUNE 11 JULY 23 AUGUST 20
Figure 40
FECAL COLIFORM AND E; COLl DENSITIES IN SEDIMENT FROM FARRAN PARK BEACH
No. of bacteria per 100 g of sediment
MAY 14
Figure 41
JUNE 11 JULY 23 AUGUST 20
1991

4.6 Geese and Gull Droppinq Study
Three park beaches were included in this study, based on results from previous year testing and observations made on park visits. Lakeview Heights Park was not included in the second year of study because of the low incidence of both geese and gull populations the previous year.
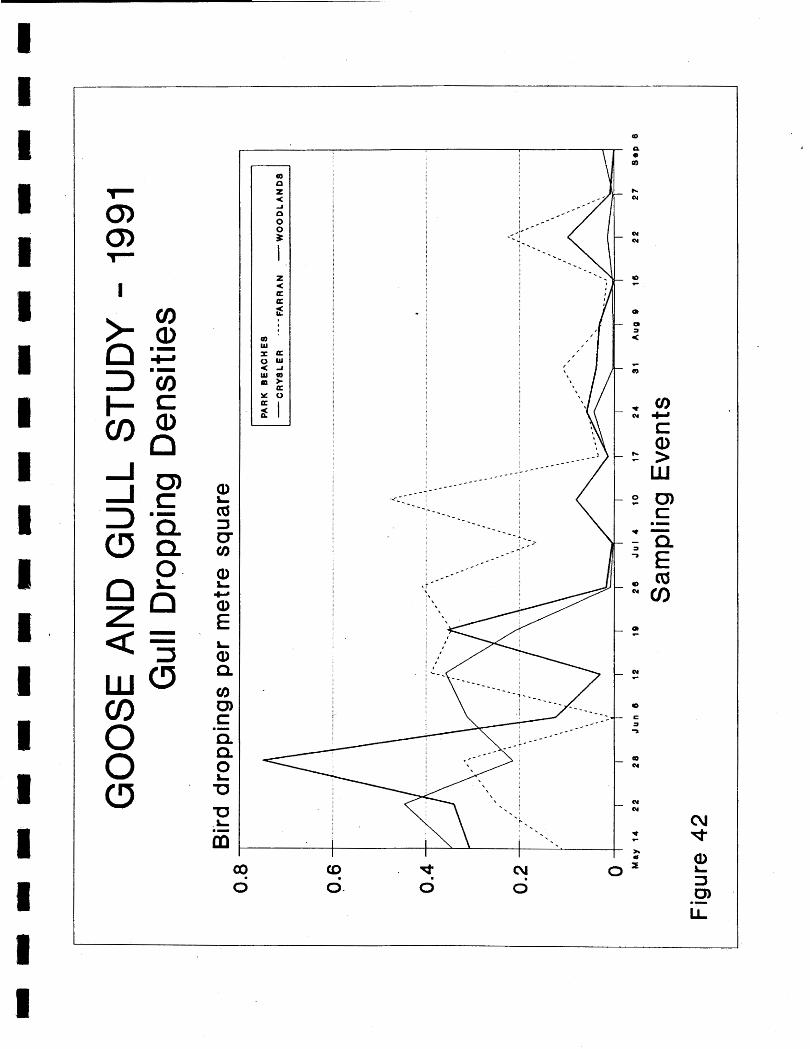
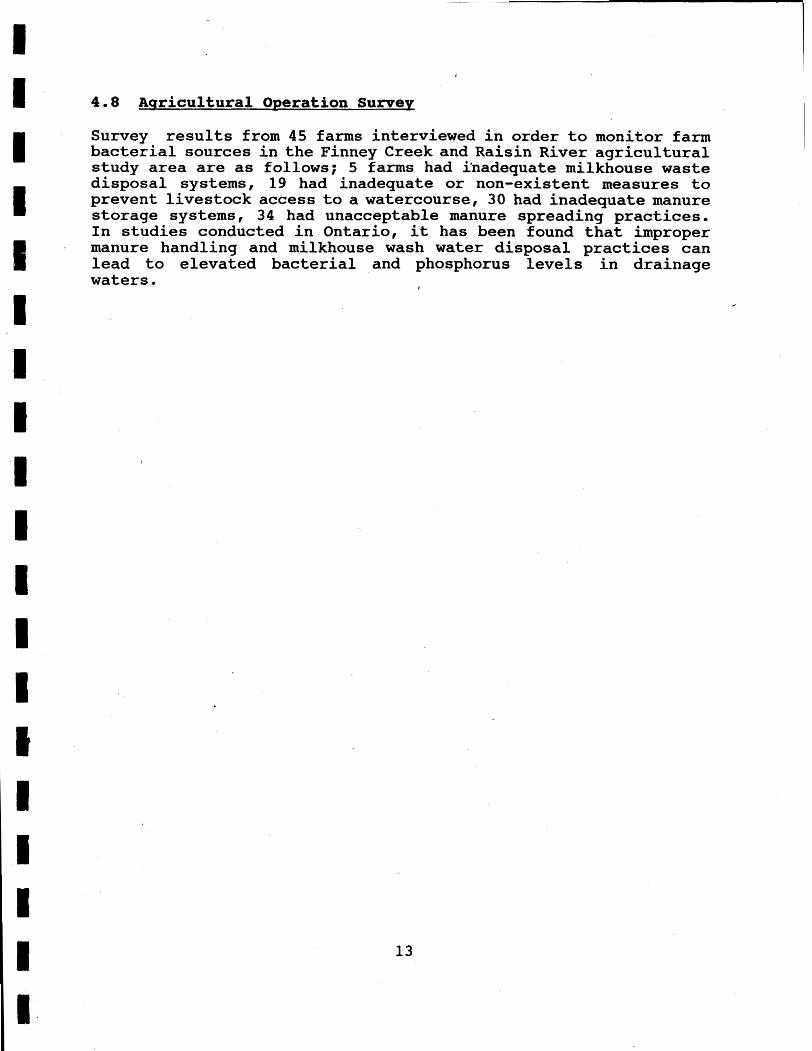
Study results show that gull populations were highest in May and June, showing general decline during the remainder of the summer months (see figures 42, 44 to 50) . While Crysler and Woodlands (day use) Park beaches showed sharp declines in gull populations between weeks 5 and 6, Farran Park beach showed a rise in gull populations in mid-~uly and again in early to mid-August.
Geese populations tended to be highest from weeks 1 to 4, and to decline,from weeks 5 to 10, rising again from week 10 onwards (see figures 43, 44 to 50). Only at Farran Park beach did populations decline with no geese being present on the final week of testing.
Geese and gull dropping counts are affected by such factors as heavy beach use by park users and park maintenance such as sand raking and grass cutting. Therefore, low counts may not be indicative of actual bird populations.
4.7 Park Activities
Routine beach activities were recorded by park staff at Glengarry, Mille Roches, Woodlands (camping and day use), Farran, and Crysler Parks (see appendix E). ~ctivities at parks which were subject to geese and gull, sediment bacteria, and before and after beach use testing, were of particular interest. In order to draw any conclusions concerning bacterial presence and concentrations as a result of local sources, such information as park attendance, number of beach users, rainfall, grass cutting, beach raking, new sand, and wash room lineups, was of particular importance. For various reasons, much of this vital detailed information was not collected accurately or regularly, especially during the month of August. Therefore, no firm set of relationships between beach activities and fecal bacterial can be formed.
Park grass cutting crews however, did not report any breakouts of park septic beds during the summer of 1991.


GOOSE AND GULL STUDY - 1991 Crysler Park
Total number of droppings 20000 -
G O O S E W Q U L L i
0 - I I I I I I I I 1
May 14 22 28 Jun 5 12 19 26 Jul 4
Sampling Events
GOOSE AND GULL STUDY - 1991 Crysler Park
Jul 10 17 24 31 Aug 9 15 22 27 Sep 6
Sampling Events Figure 45
Total number of droppin,gs 20000 '
G O O S E m Q U L L i

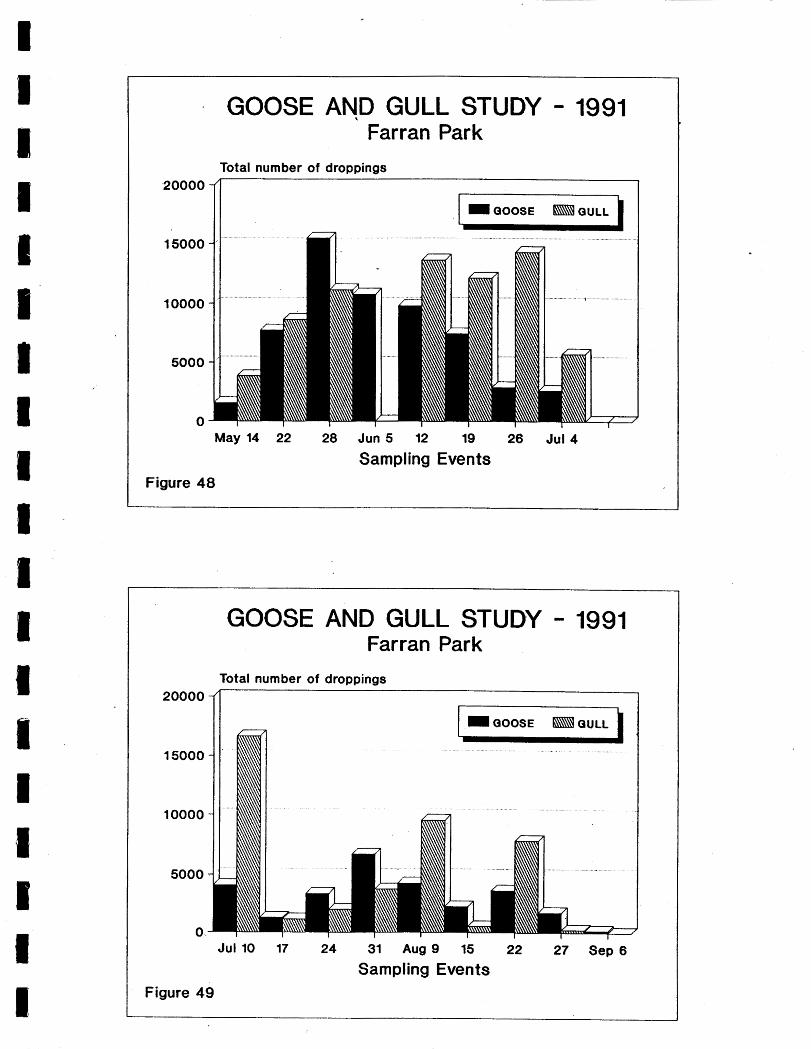
GOOSE AND GULL STUDY - 1991 Farran Park
Total number of droppings 20000 -4 I
G O O S E W Q U L L L I
May 14 22 28 Jun 5 12 19 26 Jul 4
Sampling Events Figure 48
GOOSE AND GULL STUDY - 1991 Farran Park
Total number of droppings 20000
15000
10000
5000
o> Jul 10 17 24 31 Aug 9 15 22 27 Sep 6
Sampling Events Figure 49

GOOSE AND GULL SURVEY - 1991
Notes: CRYSLER PARK - beach raked June 13,26 July 11,25 Aug (missing data)
- grass cut June 6,7,11,12,14,15 July 18,23 Aug (missing data)
FARRAN PARK - beach raked June 4,5,10,23,24,26,27,29,30 July 18,19,23,24,25,26,27,28,29
- grass cut June 3,4,5,10,15,19,20,21,24 ,
July 2,16,17,18,19,24,25,26,27,28,29 - August report not yet received - goose feces picked and gull feces overturned
regularly
WOODLANDS PARK - beach raked June 13,16,29 July 12,19,25 Aug 1,2,9,22,23
- grass cut June 1,5,7,8,9,21,22,26,27,28 July 9,10,12,18,19,20,21 Aug 1,2
4.8 Aqricultural Operation Survey
Survey results from 45 farms interviewed in order to monitor farm bacterial sources in the Finney Creek and Raisin River agricultural study area are as follows; 5 farms had i'nadequate milkhouse waste disposal systems, 19 had inadequate or non-existent measures to prevent livestock access to a watercourse, 30 had inadequate manure storage systems, 34 had unacceptable manure spreading practices. In studies conducted in Ontario, it has been found that improper manure handling and milkhouse wash water disposal practices can lead to elevated bacterial and phosphorus levels in drainage waters.
I
5. CONCLUSIONS
5.1 Beaches
The &udy of park sewage systems to be conducted by the St. Lawrence Parks Commission during 1991 was rescheduled for 1992/1993 because of changes in capital budget priorities. For the purposes of this report, sewage systems were considered as potential sources of bacterial contamination detected at park beaches, pending the results of the park sewage system study.
5.l.1 Crysler Park
Two suspected sources of bacteria at Crysler Park beach are the feces from geese and gulls, and surface runoff channelled towards the beach swimming area. Geese and gull study results indicate that these bird species are a contributor of bacterial pollution at this beach. A high bacterial count in May coincides with the presence of high goose and gull feces densities. The situation may be compounded by surface runoff waters channelled over the beach from upland areas contaminated with bacteria from bird droppings, food, and other sources.
5.1.2 Farran Park
A possible source of fecal bacteria at this beach is runoff from the grassed and upper beach areas laden with bacteria which drains into the swimming area. The presence of gulls during most of the summer may have also contributed to elevated fecal bacterial counts. However, no direct relationship between bird densities and elevated beach water bacterial counts has been established because true dropping densities may be effected by beach raking and bather activities. The park sewage system immediately uphill of the beach area is also a suspected source of bacteria.
5.1.3 Woodlands Park (day use)
No direct relationship between bacterial counts and goose and gull presence at this beach has been established. The low occurrence of both geese and gulls during late summer when the highest beach water and sediment fecal counts occurred discounts both species of birds as significant bacterial sources. . Potential contributors of fecal bacterial may be runoff waters from the upland areas which are channelled over the beach, as well as an improperly operating park sewage system.

5.1.4 Woodlands Park (camping)
The source of bacterial pollution suspected of affecting this beach is the Ingleside Sewage Treatment Plant. The outfall pipe for this STP was discovered to be fractured during the summer of 1991 at a shallow spot near the Long Sault Parks, Low river levels increased the flow of water near the Woodlands Park (camping) beach, and may have transported discharge bacterial pollutants near the beach area.
The Ingleside Sewage Treatment Plant, built in the 1950's to serve the community of Ingleside, has since been proven to be inadequate in handling the demands placed upon it by increased urban development. Engineering studies concerning the adequacy of this STP are currently underway.
Additionally, stormwater outfalls immediately upstream of the parks may be contributing to some of the bacterial loading. Evidence of this as a possible bacterial occurred in August following a major rain event, when elevated fecal coliform counts at this beach were detected.
5.1.5 Mille Roches Park
The potential sources of bacteria detected in beach samples may be ,
attributable to droppings from food scavenging gulls that are present when crowds are large. As well, stormwater culverts from upland grass and parking areas that direct runoff waters to the beach may also be bacterial contributors. Another possible bacterial source may be bathers themselves. There may also be some bacterial contributions attributable to the park sewage system, because of its close proximity to the swimming area. This possible source will be studied by the St. Lawrence Parks Conunission during 1992/1993.
5.1.6 Lakeview Heights Park
During the summer of 1989, the last summer during which the park was in operation, the beach was placarded for 77 days. The previous year it was placarded for 48 days. Though bacterial counts in 1990 and 1991 were within the acceptable limit, it is suspected that the cause of previous bacterial pollution originated from the upstream Long Sault Sewage Treatment Plant. Discharged effluent not sufficiently diluted may become trapped in the beach area, which has a lower circulation rate because of its protected inlet location.
Sampling at an alternative beach site within the park boundaries showed no substantial difference -in bacterial counts between it and the existing beach area.

5.1.7 Charlottenburgh Park
During the years the park was in operation, several beach closures occurred. Possible sources of bacteria may be faulty upstream cottages septic systems in and around Pilon's Point and Hamilton Island, from gull populations which were observed on the abandoned beach, and from the park's sewage system.
5.1.8 Lancaster Park 5.1.9 Glengarry Park
Localized sources of bacterial pollution at these two beaches may be attributable to runoff waters from upland grassed and parking areas being channelled over the beach, as well as from park sewage systems.
During the 1990 study period, bacterial counts in this area were elevated when the two upstreamtributaries, Finney Creek and ~aisin River, were flowing. In 1991, Finney Creek had no flow and the Raisin River had very low flows. It is suspected that bacteria detected in these tributaries originated from agricultural operations and inadequate or failing sewage systems along their banks. A further potential upstream source of bacterial pollution, is the community of South Lancaster. While no specific water quality study was conducted under this program, the Ministry of the Environment and the Tawnship of Lancaster will be considering the recommendations of .a recently conducted study to determine the problems associated with sewage disposal in the community.
5.1.10 Alexandria Park
The presence of fecal coliforms may be attributable to the following sources: surface runoff fromthe grassed area surrounding the beach, failing or inadequate cottage/permanent dwelling septic systems and to a lesser extent, gull feces. Storm water outfalls were considered a contributor of detected bacteria, and will be investigated as a possible source. Also of note is that prior to the 1991 swimming season, a stone groin on the west side of the beach was removed. It was observed that the removal of this structure improved water circulation at the beach.
I 5.2 Tributaries
I 5.2.1 Finney Creek
The predominant land use in the Finney Creek watershed is agriculture. The creek and most of its natural and manmade tributaries are classified as municipal drains, intended to drain f a h lands including barnyards, cultivated fields, and pastures. Based on water quality and agricultural operation study results, it is concluded that high fecal bacterial counts are as a result of
farming practices, especially those practices which allow the mixing of fecal material with stream waters.
Sources of phosphorus include fertilizers, eroded soils, and detergents (mostly from milkhouse wash water).
5.2.2 Raisin River
Possible bacterial and phosphorus sources in the Raisin River include both agricultural and non-agricultural sources. ~gricultural sources include all of those mentioned in Section 5.2.1. Non-agricultural sources include faulty or inadequate private sewage systems, especially within the rural communities of Martintown and Williamstown, as well as for those constructed on or near the banks of the river. Studies conducted for the Ministry of the Environment to determine the extent of water quality problems in Martintown, have concluded that a sewage treatment system for the community is required. To date, no studies have been undertaken to determine water quality in Williamstown.
5.2.3 Hoople Creek
No intensive bacterial or chemical water testing program was carried out on this creek during the 1991 testing year. Previous testing concluded that the waters from this tributary have no effect on beaches downstream of its confluence with the St. Lawrence River.
~espite this fact, Hoople Creek has been recognized as having
I serious water quality problems, largely attributable to area agricultural practices.
6. RECOMMENDED REMEDIAL MEASURES I 6.1 P a r k s
The following recommended remedial measures are not listed in any particular order of priority.
6.1.1 C r y s l e r Park l It is recommended that the following measures be implemented; I
1. a program to reduce or otherwise control geese and gull populations as well as geese and gull use of the park area be instituted; I
2. works be undertaken to divert upland runoff waters away. from or downstream of beach areas;
3. a studybeconductedtodetermine the impact, if any, the existing park sewage disposal system may have on beach water quality; I
4 . a litter control program involving more frequent garbage collection, and/or covered containers, be put in place to lessen the attractiveness of park areas for gull feeding;
I 5 . a public information program be put into place to
encourage park users to not feed the gulls or other bird species within the park beach area.
I 6.1.2 F a r r a n Park I It is recommended that the following measures be implemented; I -
1. a program to reduce or otherwise control geese and gull populations as well as geese and gull use of the park area be instituted;
2. the erection of monofilament screens over the beach area to reduce the numbers of gulls from landing on the beach and nearshore swimming areas; ' I
3. a litter control program involving more frequent garbage collection, and/or covered containers, be put in place to lessen the attractiveness of park areas for geese and gull feeding;
4. works be undertaken to divert upland runoff .waters away from or downstream of beach areas;
5 . a study be conducted to determine the impact, if any, the existing park sewage disposal system may have on beach water quality;
6. a public information program be put into place to encourage park users to not feed the gulls or other bird species within the park beach area.
6.1.3 Woodlands Park (day use)
It is recommended that the following measures be implemented;
1. the erection of monofilament screens over the beach area to reduce the numbers of gulls from landing on the beach and nearshore swimming areas;
2. works be undertaken to divert upland runoff waters away from or downstream of beach areas;
3 . astudybeconductedtodetermine theimpact, if any, the existing park sewage disposal system may have on beach water quality;
4 . a litter control program involving more frequent garbage collection, and/or covered containers, be put in place to lessen the attractiveness of park areas for gull feeding;
5. a public information program be put into place to encourage park users to not feed the gulls or other bird species within the park beach area.
6.1.4 Woodlands Park (camping)
It is recommended that the following measures be implemented;
1. the Ingleside Sewage Treatment Plant be upgraded as soon pas possible to avoid the discharge of untreated sewage into the waters upstream of this park;
2. repairs to the STP discharge pipe should be instituted as soon as is possible.
3 . a study be conducted to determine the impact, if any, the existing park sewage disposal system may have on beach . water quality;

6.1.5 Mille Roches Park
It is recommended that the following measures be implemented;
1. a program to reduce or otherwise control gull populations as well as gull use of the park area be instituted;
2. the erection of monofilament screens over the beach area to reduce the numbers of this species from landing on the beach and nearshore swimming areas;
3 . a studybeconductedtodetemine theimpact, if any, the existing park sewage disposal system may have on beach water quality;
4. works be undertaken to divert upland runoff waters away from or downstream of beach areas;
5. that a litter control program involving more frequent garbage collection, and/or covered containers, be put in place to lessen the attractiveness of park areas for gull feeding ;
6. that a public information program be put into place to encourage park users to not feed the gulls or other bird species within the park beach area.
6.1.6 Lakeview Heights Park'
It is recommended that the following measures be implemented;
. the upgrading of the Long Sault Sewage Treatment Plant as soon as is possible, to reduce the likelihood of untreated bacterial waste overflowing into the river upstream of this park beach;
2. a study be conducted to determine the impact, if any, the existing park sewage disposal system may have on beach water quality;
6.1.7 Charlottenburgh Park
It is recommended that the following measures be implemented;
1. that upstream dwelling owners be encouraged to have their septic systems inspect, and to improve/replace faulty septic systems;
2. a study be conducted to determine the impact, if any, the existing park sewage disposal system may have on beach water quality.

6.1.8 Lancaster Park
It is recommended that the following measures be implemented;
1. that a program be put in place to reduce/eliminate , agricultural and non-agricultural bacterial pollution
originating from tributaries upstream of the beaches;
2. works be undertaken to divert upland runoff waters away from or downstream of beach areas;
3. a study be conducted to determine the impact, if any, the existing park sewage disposal system may have on beach water quality;
4 . that the recommendations of a sewage disposal study of the community of South Lancaster be considered.
6.1.9 Glengarry Park
It is recommended that the following measures be implemented;
1. that a program be put in place to reduce/eliminate agricultural and non-agricultural bacterial pollution originating from tributaries upstream of the beaches;
2. works be undertaken to divert upland runoff waters away from or downstream of beach areas;
3. a studybeconductedtodetemine theimpact, if any, the existing park sewage disposal system may have on beach water quality;
4 . that the recommendations of a sewage disposal study of the community of South Lancaster be considered.
Alexandria Park
It is recommended that the following measures be implemented;
I 1. upstream r@sidential septic systems be inspected and improved, as necessary;
2. that a litter control program involving more frequent garbage collection, and/or covered containers, be put in place to lessen the attractiveness of park areas for gull feeding ;
3. a study be conducted to determine the impact, if any, the
I existing park sewage disposal system may have on beach water quality;
4. that a public information program be put into place to encourage park users to not feed the gulls or other bird
I species within the park beach area.
6.2 Tributaries
6.2.1 Finney Creek
The water quality problems of Finney Creek have the potential to affect the St. Lawrence River beaches of Lancaster and Glengarry Parks. 1 It is recommended that the following measure be implemented;
1 . a plan be formulated to provided remedial funding for measures to reduce bacterial and phosphorus loadings into . the watercourses.
6.2.2 Raisin River
The water quality data indicates that bacterial pollution originating along the Raisin River has the potential to effect the downstream St. Lawrence River park beaches of Lancaster and Glengarry.
It is recommended that the following measures be implemented;
1. a plan be formulated to provide remedial funding for measures to reduce bacterial and phosphorus loadings into the watercourse, from both agricultural and non- agricultural sources;
2. a program be considered to provide funding -for remedial measures to clean up those areas of the Raisin River and its watershed, which adversely affect surface water quality, but do not effect rural beaches;
3 . the conclusions from a water quality study of Martintown be instituted, in order to reduce urban source bacterial pollution affecting the river;
4. a water quality study be conducted for Williamstown to determine the impact of domestic source bacterial waste on surface and groundwater quality.
6.2.3 Hoople Creek
I Hoople Creek was found not to affect downstream beaches. However, its serious water quality problems have been noted. The Rural
' Beaches Program will not provide remedial funding for reducing
I bacterial and phosphorus loadings into the St. Lawrence River.
B It-is recommended that the following measure be implemented;
1. an alternative program be instituted to fund a clean-up of Hoople Creek and its tributaries.
I ' 6.3 Clean Up Rural Beaches (CURB) Plan
I This final report is the conclusion of the study phase of the program. Based on the results and conclusions stated in this report, it is recommended that a Clean Up Rural Beaches (CURB) Plan
I be prepared and a proposal be submitted to the Ministry of the Environment for entry into the Rural Beaches CURB Implementation Program.
The formula'tion of a Clean Up Rural Beaches (CURB) Plan is the second step in the Rural Beaches Program. The Plan outlines the remedial measures to be taken to clean up bacterial pollution detected at rural beaches, the cost of the remedial measures required, sources of remedial funding, and strategies for the implementation of remedial works. The CURB Plan is based largely on the conclusions and reconmendations derived from the two year study phase.
The emphasis of the CURB Implementation Program is on improving agricultural land nianagement practices, particularly those which adversely affect water quality.
I
The program implementation period for each participating conservation authority is five years in length, commencing with the approval of a locally produced CURB Plan by the Ontario Ministry of the Environment.
REFERENCES
Ontario Ministry of the Environment, 1989. A Guide to the Collection and Submission of Samples for Laboratory Analysis.
Ministry of the Environment, 1984. Water Management Goals, -Policies, Objectives, and ~mplementation Procedures of the Ministry of the Environment.
Raisin Region Conservation Authority, 1990. St. Lawrence Beaches Study: 1990 Summary Report. Richard Pilon and Rose-Marie Chretien. Martintown, Ontario.
d
Paul Wisner & Associates Inc., 1992. Ingleside Sewage System Outfall - Design of Outlet and Impact on Lake St. Lawrence Water Quality. Ottawa, Ontario.
Benoit, Larry, 1991. Ontario Ministry of the Environment. Personal Communication. Cornwall, Ontario.
Helliar, Robert, 1991. Ontario Ministry of the Environment. Personal Communication. Cornwall, Ontario.
Mar, Peter, 1991. Ontario c in is try of the Environment. Personal Communication. Toronto, Ontario.
Ley, Arthur, 1991. Ontario Ministry of the Environment. Personal Communication. Kingston, Ontario.
Ferguson, David, 1991. Ontario Ministry of the Environment. Personal Communication. Kingston, Ontario.
Metcalfe, Bruce, 1991. Ontario Ministry of the Environment. Personal Communication. Kingston, Ontario.
Slater, Glen, 1991. Ontario ini is try of Agriculture and Food. Personal Communication. Alexandria, Ontario.
Dupuis, Gerald, 1991. Eastern Ontario Health Unit. Personal Communication. ~lexandria, Ontario. ,
Eckersley, Mike, 1991. Ontario Ministry of Natural Resources. Personal Communication. Cornwall, Ontario.
Cottrill, John, 1991. St. Lawrence Parks Commission. Personal Communication. Morrisburg, Ontario.
Levert, Jean-Guy, 1991. Town of Alexandria. Personal Communication. Alexandria, Ontario.

APPENDIX A
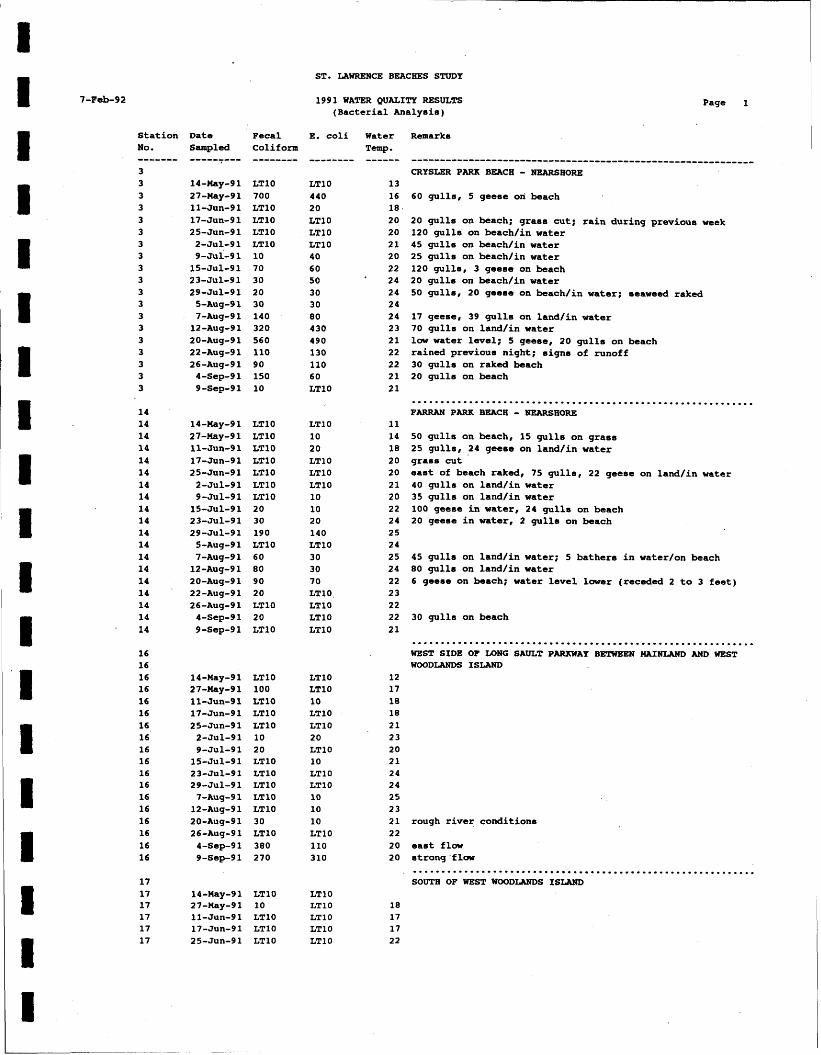
Station No. ------- 3 3 3 3 3 3 3 3 3 3 3 3 3 3 3 3 3 3 3
ST. LAWRENCE BEACHES STUDY
1991 WATER QUALITY RESULTS (Bacterial Analysis)
Page 1
Date Sampled
Fecal Colif o m
E, coli
LTlO 700 LTlO LTlO LTlO LTlO 10 7 0 3 0 20 3 0 140 32 0 560 110 90 150 10
LTlO LTlO LTlO LTlO LTl 0 LTlO LTlO 20 3 0 190 LTlO 60 8 0 9 0 20 LTlO 20 LTlO
LTlO 100 LTlO LTlO LTlO 10 20 LTlO LTlO LTlO LTlO LTlO 30 LTlO 380 270
LTl 0 440 20 LTl 0 LTl 0 LTlO 4 0 6 0 5 0 30 30 8 0 430 490 130 110 60 LTlO
LTlO 10 20 LTlO LTlO LTlO 10 10 20 140 LTlO 3 0 3 0 7 0 LTlO. LTlO LTlO LTlO
Water Temp ------
LTlO LTlO 10 LTlO LTlO 20 LTlO 10 LTlO LTlO 10 10 10 LTlO 110 310
Remarks
------------------------------------------------------------ CRYSLER PARK BEACH - W H O R E
60 gulls, 5 geese ori beach
20 gulls on beach; grass cut; rain during previous week 120 gulls on beach/in water 45 gulls on beach/in water 25 gulle on beach/in water 120 gulls, 3 geese on beach 20 gulls on beach/in water 50 gulls, 20 geese on beach/in water; seaweed raked
17 geese, 39 gulls on land/in water 70 gulls on land/in water low water level; 5 geese, 20 gulls on beach rained previous night; signs of runoff 30 gulls on raked beach 20 gulls on beach
............................................................ FARRAN PARK BEACH - NEARSHORE 50 gulls on beach, 15 gulls on grass 25 gulls, 24 geese on land/in water grass cut east of beach raked, 75 gulls, 22 geese on land/in water 40 gulls on land/in water 35 gulls on land/in water 100 geese in water, 24 gulls on beach 20 geese in water, 2 gulls on beach
45 gulls on land/in water; 5 bathers in water/on beach 80 gulls on land/in water 6 geese on beach; water level lower (receded 2 to 3 feet)
30 gulls on beach
....................................................... WEST SIDE OF LONG SAULT PAWWAY BECWEEN MAINLAND AND WEST WOODLANDS ISWWD
rough river conditions
east flow strong -flow ........................................................
17 SOUTH OF WEST WOODLANDS ISLAND 17 14-May-91 LTlO LTlO 17 27-May-91 10 LTlO 18 17 11-Jun-91 LTlO LTlO 17 17 17-Jun-91 LTlO LTlO 17 17 25-Jun-91 LTlO LTlO
Station Date Fecal No. Sampled Colif o m ------- --------- -------- 17 2-Jul-91 LTlO 17 9-Ju~-91 LTlO 17 15-Jul-91 20 17 23-Jul-91 10 17 29-Jul-91 LTlO 17 7-Aug-91 30 17 12-Aug-91 LTlO 17 20-Aug-91 LTlO 17 26-Aug-91 LTlO 17 4-Sep-91 70 17 , 9-Sep-91
14-Hay-91 LTlO 27-Hay-91 10 11-Jun-91 LTlO 17-Jun-91 LTlO 25-Jun-91 10 2-Jul-91 LTlO 9-Jul-91 LTlO 15-Jul-91 10 23-Jul-91 60 29-Jul-91 30 7-Aug-91 80 12-Aug-91 50 20-Aug-91 10 26-Aug-91 10 4-Sep-91 30 9-Sep-91 LTlO
14-Hay-91 LTlO 27-May-91 LTlO 11-Jun-91 LTlO 17-Jun-91 LTlO 25-Jun-91 LTlO ,
2-Ju~-91 LTlO 9-Jul-91 LTlO 15-Ju~-91 LTlO 23-Jul-91 LTlO 29-Jul-91 LTlO 7-Aug-91 LTlO 12-Aug-9 1 LTlO 20-Aug-91 50 26-Aug-91 4-Sep-9 1 9-Sap-9 1
14-May-91 LTlO 27-May-91 10 11-Jun-91 10 17-Jun-91 LTlO 25-Jun-91 LTlO 2-Jul-91 30 9-Jul-91 LTlO 15-Jul-91 70 23-Jul-91 10 29-Jul-91 10 5-Aug-91 40 7-Aug-91 10 12-Aug-91 30 20-Aug-91 10 22-Aug-91 90 26-Aug-91 30 4-Sep-91 100
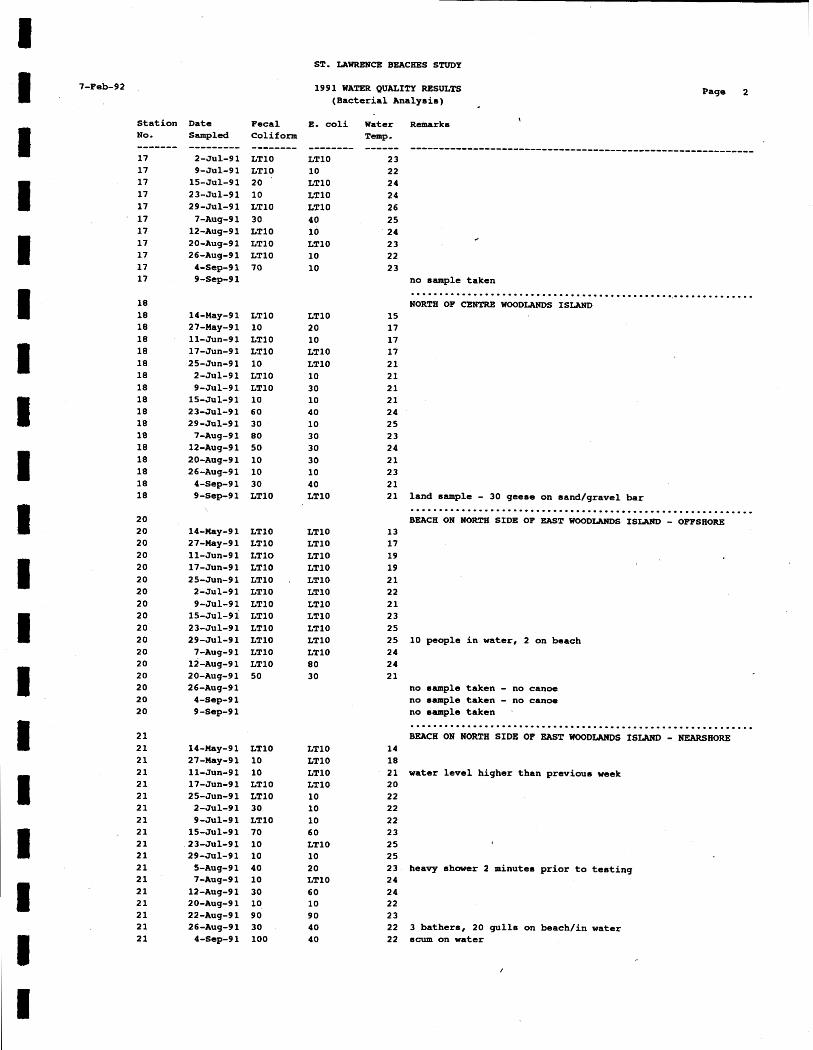
ST. LAWRENCE BEACHES STUDY
1991 WATER QUALITY RESULTS (Bacterial Analysis)
Page 2
t E. coli Water Remarks
Temp. -------- ------ ............................................................ LTlO 2 3 10 22 LTlO 2 4 LTlO 24 LTlO 2 6 4 0 2 5 10 24 LTlO 2 3 10 2 2 10 2 3
no sample taken
LTlO 2 0 10 LTlO LTlO 10 30 10 40 10 30 3 0 3 0 10 4 0 LTlO
LTlO LTlO LTlO LTlO LTlO LTlO LTlO LTlO LTlO LTlO LTlO 8 0 3 0
LTlO LTlO LTlO LTlO 10 10 10 6 0 LTlO 10 20 LTlO 6 0 10 90 40 4 0
............................................................ NORTH OF CENTRE WOODLANDS ISLAND
15 17 17 17 2 1 2 1 2 1 2 1 2 4 25 2 3 2 4 2 1 23 2 1 21 land sample - 30 geese on sand/gravel bar
............................................................ BEACH ON NORTH SIDE OF EAST WOODLANDS ISLAND - OFFSHORE
13 17 19 19 2 1 22 2 1 2 3 25 25 10 people in water, 2 on beach 2 4 24 2 1
no sample taken - no canoe no sample taken - no canoe no sample taken . ............................................................ BEACH ON NORTH SIDE OF EAST WOODLANDS ISLAND - NEARSHORE
14 18 21 water level higher than previous week 2 0 2 2 22 22 2 3 2 5 2 5 23 heavy shower 2 minutes prior to testing 24 2 4 22 2 3 22 3 bathers, 20 gulls on beach/in water 22 scum on water
I Page 3 i
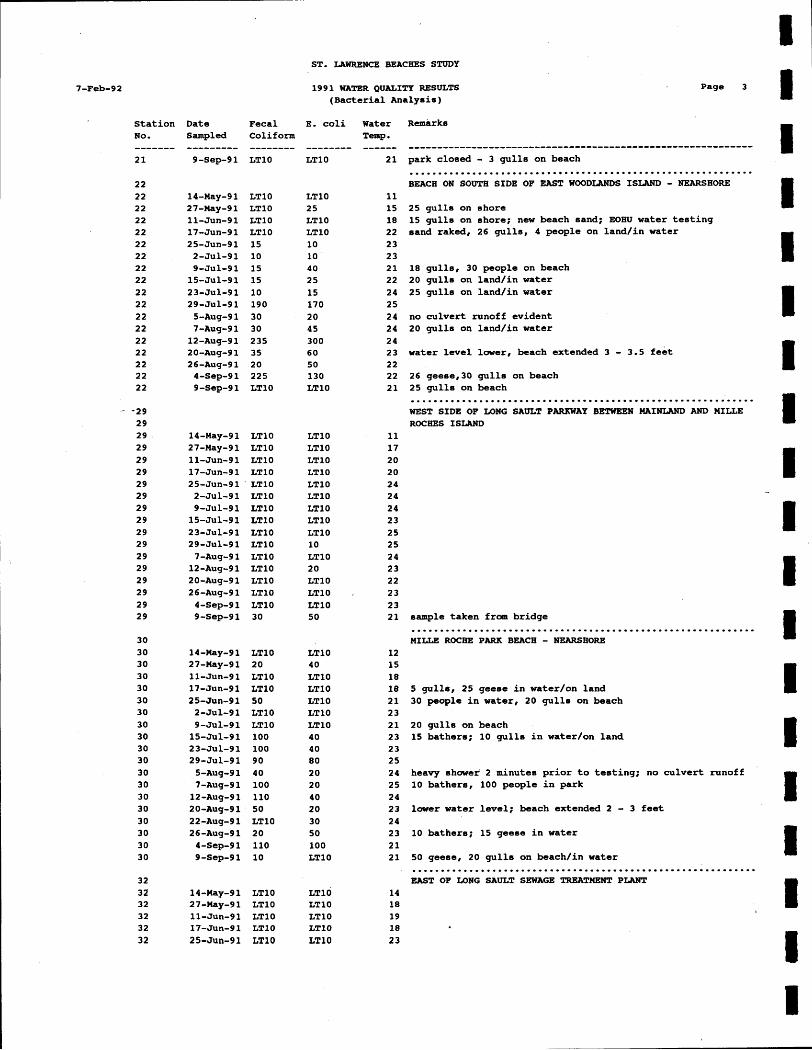
ST. LAWRENCE BEACHES STUDY
1991 WATER QUALITY RESULTS ( B a c t e r i a l Analys is )
S t a t i o n No.
Date Sampled --------- 9-Sep-9 1
Fecal Col i f o m -------- LTlO
E. c o l i Water Temp. ------
2 1
Remarks
-------- LTlO
------ - - -
park c lo sed - 3 g u l l s on beach ............................................................ BEACH ON SOUTH SIDE OF EAST WOODLANDS ISLAND - NEARSHORE
LTlO LTlO LTlO LTlO 15 10 15 15 10 190 3 0 3 0 235 35 2 0 225 LTlO
LTlO 2 5 LTlO LTlO 10 10 40 2 5 15 170 20 4 5 300 6 0 5 0 130 LTlO
25 g u l l s on sho re 15 g u l l s on shore; new beach sand; EOHU water t e s t i n g sand raked, 26 g u l l s , 4 people on l and / in water
18 g u l l s , 30 people on beach 20 g u l l s on l and / in wa te r 25 g u l l s on l and / in water
no c u l v e r t runoff ev iden t 20 g u l l s on l and / in wa te r
water l e v e l lower, beach extended 3 - 3.5 f e e t
26 geese,30 g u l l s on beach 25 g u l l s on beach ............................................................ WEST SIDE OF LONG SAULT PARKWAY BETWEEN MAINLAND AND MILLE ROCHES ISLAND
LTlO LTlO LTlO LTlO LTlO LTlO LTlO LTlO LTlO LTlO LTlO LTlO LTlO LTlO LTlO 3 0
LTlO LTlO LTlO LTlO LTlO LTlO LTlO LTlO LTlO 10 LTlO 20 LTlO LTlO 3
LTlO 5 0 sample t aken f rm br idge ............................................................
MILLE ROCEiE PARK BEACH - NEARSHORE LTlO 20 LTlO LTlO 5 0 LTlO LTlO 100 100 90 40 100 110 5 0 LTlO 20 110 10
LTlO 40 LTlO LTlO LTlO LTlO LTlO 4 0 4 0 80 20 20 4 0 20 3 0 5 0 100 LTlO
5 g u l l s , 25 geese i n water/on l and 30 people i n water, 20 g u l l s on beach
20 g u l l s on beach 15 ba the r s ; 10 g u l l s i n water/on l a n d
heavy shower 2 minutes p r i o r t o t e s t i n g ; no c u l v e r t runoff 10 ba the r s , 100 people i n park
lower water l e v e l ; beach extended 2 - 3 f e e t
10 bathers ; 15 geese i n water
50 geese, 20 g u l l s on beach/in water ............................................................ EAST OP LONG SAULT SEWAGE TREATMENT PLANT
LTlO LTlO LTlO LTlO LTlO
LTlO LTlO LTlO LTlO LTlO
ST. LAWRENCE BEACHES STUDY
1991 WATER QUALITY RESULTS ( B a c t e r i a l A n a l y s i s )
P a g e 4
S t a t i o n N o .
D a t e F e c a l E. coli W a t e r Remarks S a m p l e d C o l i f om Temp. --------
LTlO LTlO LTlO LTlO LTlO LTlO LTlO LTlO 10 LTlO
LTlO 10 10 LTlO LTlO LTlO LTlO LTlO LTlO LTlO LTlO LTlO LTlO LTlO LTlO
LTlO 5 5 15 10 15 LTlO LTlO 2 5 60 LTl 0 LTlO LTlO LTlO LTlO 2 0 LTlO 15 LTlO
LTlO LTlO LTlO 10 LTlO LTlO LTlO LTlO LTlO 2 0 LTlO 20 LTlO 20 10
-_------ ------ ............................................................ LTlO 2 3 I
LTlO 2 1 30 2 3 LTlO 2 4 LTlO 2 5 LTlO 2 4 3 0 2 4 LTlO 2 3 20 2 1 LTlO 22
LTlO 2 0 10 LTlO LTlO LTlO LTlO LTlO LTlO LTlO 10 LTlO LTlO LTlO LTlO
LTlO 315 15 LTlO LTlO LTlO LTlO 20 50 LTlO LTlO LTlO 2 0 LTlO LTlO LTlO 10 LTlO
LTlO LTlO LTlO LTlO LTlO LTl 0 LTlO LTlO LTlO LTlO LTlO 3 0 10 LTlO 4 0
n o s a m p l e t a k e n ............................................................ EASTERN POINT OF HOULINElTB ISLAND
12 17 19 18 2 3 2 3 2 2 24 24 2 5 2 4 24 2 3 2 1 2 3
n o s a m p l e t a k e n ............................................................ LAKEVIEW HEIGHTS PARK BEACH - NEARSHORE
12 17 grass h a s b e e n c u t 2 1 17 20 2 3 2 0 2 2 2 4 26 23 h e a v y s h o w e r 2 m i n u t e s prior to t e s t i n g 2 5 2 4 22 25 21 l o w e r w a t e r level 20 murky w a t e r 2 1 ............................................................
W I E W HEIGHTS PARK BEACH - OFFSHORE 12 15 18 17 2 1 2 3 2 1 2 3 2 4 2 5 2 4 2 4 2 3 23 10 b a t h e r s ; 20 geese i n w a t e r 22

ST. LAWRENCE BEACEES STUDY
1991 WATER QUALITY RESULTS (Bacterial Analysis)
Page 5
Station No.
Date Sampled --------- 9-Sep-9 1
Fecal Cali f o m ------- -
E. coli Water Remarks Temp. -------- ------ ............................................................
no sample taken ............................................................ HAMILTON ISLAND BRIDGE
12 15 16 19 22 2 1 22 2 3 2 5 26 2 3 2 6 2 3 24 21 strong flow
no temp. recorded
LTlO LTlO LTlO LTlO LTlO LTlO 20 LTlO 10 LTlO 10 20 150 3 0 LTlO 130
10 LTlO 3 0 LTlO LTlO 10 10 LTlO LTlO 20 10 20 70 70 10 5 0 ............................................................
PILON'S POINT 12 15 39 18 22 2 1 2 1
no sample taken - rough channel conditions 25 sample taken from land - rough channel conditions 2 5 2 3 26
no sample taken - rough channel conditions 2 3 2 2
no sample taken
2 0 3 0 LTlO LTlO LTlO LTlO 20
20 30 10 LTlO LTlO LTlO LTlO
2 0 LTlO LTlO LTlO
LTlO 7 0
LTlO 90
............................................................ C-NBURGH PARK BEACH - NEARSHORE
13 15 17 2 1 2 3
no sample taken -.boat mechanical failure 24 samples from this date forward taken by land 2 5 2 6 2 5 2 4 2 3 26 22 2 4 23 30 gulls on beach and picnic tables 22 21 20 gulls on beach/in water
LTlO 15 LTlO LTlO LTlO
LTlO LTlO LTlO LTlO LTlO
85 LTlO LTlO 140 10 2 0 15 10 10 LTlO LTlO 10
20 LTlO LTlO LTlO 40 35 LTlO LTlO LTlO 10 5 5 10 ............................................................
CEARUXTENBURGH PARK BEACH - OFFSHORE 12 15 17 19 2 1
no sample taken - boat mechanical failure 2 3
LTlO LTl 0 LTlO LTl 0 LTlO
LTlO LTlO LTlO LTlO LTl 0
LTlO LTlO

ST. XAWRENCE BEACHES STUDY
1991 WATER QUALITY RES&S (Bacterial Analysis)
Page 6
Station No. ------- 4 1 4 1 4 1 4 1 4 1 4 1 4 1 4 1
Date Fecal Sampled Colif o m --------- -------- 22-Jul-91 LTlO 30-Ju~-91 LTlO 6-Aug-9 1 LTlO 14-Aug-9 1 19-Aug-91 27-Aug-91 LTlO 3-Sep-91 LTlO 9-Sep-9 1
E. coli Water Temp. ------
2 5 2 6 2 5
Remarks
------------------------------------------------------------ LTlO LTlO LTlO
no sample &ken - rough channel conditions no sample taken -.rough channel conditions
LTlO LTlO
no sample taken ............................................................ SOUTH JANCASTER, ON THE EAST SIDE OF THE PUBLIC WHARF
LTlO 470 LTlO LTlO LTlO LTlO LTlO LTlO LTlO LTlO LTlO LTlO LTlO LTlO 2 0
10 340 LTlO LTlO LTlO LTlO LTlO LTlO LTlO LTlO LTlO LTlO 20 LTlO LTl 0
water dirty brown colour
Some samples were not done on July 3 due to boat problems
no sample taken ............................................................ UPSTREAH OF FINNEY CREEK OUTLET'- OFFSHORE
13-Hay-91 LTlO 28-May-91 80 10-Sun-91 LTlO 18-Jun-91 LTlO 24-Jun-91 LTlO 3-Jul-91 8-Jul-91 LTlO 16-Jul-91 LTlO 22-Ju~-91 LTlO 30-Jul-91 LTlO 6-Aug-91 LTlO 14-Aug-91 LTlO 19-Aug-91 27-Aug-9 1 3-Sep-9 1 9-Sep-91 6
LTlO 90 LTlO LTlO LTlO
no sample taken - boat mechanical failure LTlO LTlO LTlO LTlO LTlO LTlO
no sample taken - rough channel conditions no sample taken - rough channel conditions no sample taken - rough channel conditions no sample taken ..................................*...-..................... DOWNSTREAM OF FINNEY CREEK OUTLET - OFFSHORE
LTlO 9 0 LTlO LTlO LTlO
LTlO 70 10 LTlO LTlO,
no sample taken - boat mechanical failure LTlO LTlO LTlO LTlO 30 LTlO
LTlO LTlO LTlO 10 10 LTlO
no sample taken - rough channel conditions no sample taken - rough channel conditions no sample taken - rough channel conditions no sample taken .... . . . . . . . . . . . . . . . . . . . . . . . . . . . . . . . . . . . . . . . . . . . . . . . .
LANCASTER PARK BEACH - NEARSHORE 13-May-91 LTlO 28-by-91 10
LTlO 10 new sand on beach

ST. LAWRENCE BEACHES STUDY
1991 WATER QUALITY RESULTS (Bacterial Analysis)
Page 7
Station No.
Date Sampled --------- 10-Jun-9 1 18-Jun-9 1 24-Jun-91 3-Jul-9 1 8-Jul-9 1 16-Jul-91 22-Jul-91 30-Jul-9 1 5-Aug-9 1 6-Aug-9 1 14-Aug-9 1 19-Aug-91 22-Aug-9 1 27-Aug-91 3-Sep-9 1 9-Sep-91
Fecal Colif orm -------- LTlO LTlO LTlO LTlO LTlO 10 20 LTlO LTlO LTlO LTlO 10 210 50 4 0 10
E, coli Water Remarks Temp.
-------- 10 LTlO LTlO LTlO LTlO 2 0 4 0 LTlO LTlO LTlO LTlO LTlO 170 7 0 50 40
------ ------------------------------------------------------------ 2 1 22 20 gulls on beach 23 7 bathers 22 3 gulls on land/in water 25 23 3 bathers 26 25 15 gulls on beach; 2 bathers 22 2 3 2 5 2 3 20 2 3 21 heavy weed growth 2 0
............................................................ LANCASTER PARK BEACH - OFFSHORE
16 17 19 22 2 4 2 4 2 5 2 6 27 25 people on beach 2 3 2 5
no sample taken - rough channel conditions no temperature recorded
2 1 no sample taken
LTlO 10 LTlO LTlO LTlO . 10 LTlO 2 0 LTlO LTlO LTlO
LTlO LTlO
LTlO 3 0 LTlO LTlO LTlO LTlO LTlO 3 0 LTlO LTlO 10 '
10 LTlO
............................................................ GLENGARRY PARK BEACH - NEARSHORE
L ~ O 10 2 0 LTlO LTl 0 LTlO 2 5 7 0 75 30 LTlO 35 100 2 0 90 10 60 55
LTlO 15 30 LTlO LTlO 15 15 10 120 10 LTlO 3 5 105 3 0 5 0 2 0 5 0 2 5
35 gulls on land/in water 15 gulls on land/in water 25 gulls on land/in water 11 gulls on land/in water
1 bather ,
9 gulls, 1 dead gull on beach 7 gulls on beach; 3 bathers
............................................................ GLENGARRY PARK BEACH - OFFSHORE
15 17 19 2 1 24
no sample taken - boat mechanical failure 24 25 26 heavy beach use 27 65 people on beach 2 4
LTlO LTlO 10 LTlO LTlO
LTlO LTlO 10 LTlO LTlO
LTlO . LTlO 3 0 LTlO LTlO
LTlO LTlO 50 LTlO LTlO

ST. LAWRENCE BEACHES STUDY
1991 WATER QUALITY RESULTS (Bacterial Analysis)
Page ,, 8
Station Date Fecal E. coli Water Remarks No. Sampled Colif o m Temp. _-_---- --------- -------- -------- ------ ------------------------------------------------------------ 49 14-Aug-91 LTlO 10 25 20 bathers
49 19 -Aug-9 1 no sample taken - rough channel conditions 49 27-Aug-91 LTlO LTlO 2 4 49 3-Sep-91 LTlO 10 22
t 4 9 9 -Sep-9 1 no sample taken
LTlO 10 LTlO 10 LTlO LTlO LTlO 20
LTlO LTlO LTlO LTlO LTlO LTlO
LTlO LTlO LTlO LTlO LTlO LTlO LTl 0 LTlO LTlO LTlO LTlO 10 LTlO LTlO LTlO
LTlO 10 LTlO LTlO LTl 0 20 LTlO LTlO 7 0 20 8 0 8 0 2 0
LTlO 10 LTlO 50 LTlO 10 10 80
LTlO 10 LTlO LTlO LTlO LTlO 10 LTlO
10 5 0 5 0 LTlO 10 LTlO
LTlO 10 LTlO LTlO LTlO LTlO LTlO 10 LTlO LTlO LTlO 10 LTlO LTlO LTlO
LTlO 10 LTlO LTlO 4 0 LTlO 2 0 2 0
2 0 110 LTlO 30 30
LTlO 30 2 0 3 0 30 LTlO 10 40
............................................................ IAKEWIEW HEIGHTS P A M - EAST OF BEACH
12 15 19 17 21 6 geese, large number of droppings 2 3 20 1 gull on beach 2 1
no sample taken 27 2 5 2 3 22 water level lower by 2 - 3 feet; few weeds in water 21 law water level 2 1
............................................................ LAKEVIEW HEIGHTS PARK - SOUTHERN POINT
11 \
15 16 17 20 2 3 2 1 2 1 2 4 26 15 geese on graas 24 2 4 22 21 low water level 20 20 geese in water
............................................................ NORTH OF CENTRAL WOODLRNDS ISLAND - NEARSHORE
15 17 water level higher 2 1 18 2 0 2 1 20 22 2 4 2 5 2 4 2 4 20 water stirred up from east wind, murky
no sample taken - no canoe no sample taken ............................................................ CULVERT BETWgEN CENTRE AND EAST WOODLANDS ISLANDS
12
20 2 dead carp in water 2 2

ST. LAWRENCECE BEACHES STUDY
1991 WATER QUALITY RESULTS (Bacterial Analysis)
Page 9
Station Date Fecal No. Sampled Colif o m ------- --------- -------- 54 23-Jul-91 20 5 4 29-Jul-91 10 5 4 7-Aug-91 10 54 12-Aug-91 100 54 20-Aug-91 330 54 26-Aug-91 110 54 4-Sep-91 2600 5 4 9-Sep-9 1
E. coli Water Temp.
-------- ------ LTlO 2 5 LTlO 2 5 LTlO 2 4 150 2 4 270 20 140 22 1080 22
Remarks
............................................................
thick brown on surface, no flow no flow no flow - beaver dammed, scum on water no sample taken ............................................................ INGLESIDE - NEARSHORE, UPSTREAM FROM SEWAGE TREATMENT PLANT OUTLET PIPE
14-May91 LTlO 27-May-91 LTlO 17-Jun-91 LTlO 25-Jun-91 LTlO 9-Jul-91 LTlO 11-Jul-91 15-Jul-91 10 23-Jul-91 10 29-Jul-91 LTlO 7-Aug-91 LTlO 12-Aug-91 60 20-Aug-91 10 26-Aug-91 160 4-Sep-91 10 9-Sep-91 LTlO
LTlO 2 0 LTlO 20 10
no sample taken LTlO LTlO 2 0 LTlO 190 LTlO 6 0 10 10
water level lower, 2 - 3 feet
.......................................-.......-..*.-.....*. INGLESIDE - OFFSHORE, UPSTREAM FROM SEWAGE TREATMENT PLANT OUTLET PIPE
14-May-91 LTlO 27-May-91 LTlO 11-Jun-91 LTlO 17-Jun-91 10 25-Jun-91 LTlO 2-Jul-91 10 9-Jul-91 LTlO 15-Jul-91 170 23-Jul-91 LTlO 29-Ju~-91 LTlO 7-Aug-91 LTlO 12-Aug-91 LTlO 20-Aug-91 60 26-Aug-91 LTlO 4-Sep-91 LTlO 9-Sep-91
LTlO LTlO LTlO LTlO LTlO 2 0 LTlO 110 LTlO LTlO LTl,O LTlO 10 LTlO LTlO
no sample taken ............................................................ NORTH OF EAST WOODLANDS ISLAND
11-Jun-91 LTlO 17-Jun-91 LTlO 25-Jun-91 LTlO 2-Jul-91 LTlO 9-Jul-91 LTlO 15-Jul-91 30 23-Jul-91 LTlO 29-Jul-91 40 7-Aug-91 40 12-Aug-91 100 20-Aug-91 40 26-Aug-9 1 4-Sep-9 1 9-Sep-9 1
LlTO 20 10 2 0 2 0 LTlO 10 LTlO LTlO 80 40
no sample taken - no canoe no sample taken - no canoe no sample taken ............................................................ DOWNSTREAM OF LONG SAULT SEWAGE TREATMENT PLANT, AT YACHT CLUB
14 18
14-May-91 LTlO 27-May-91 10
LTlO LTlO

ST. LAWRENCE BEACHES STUDY
1991 WATER QUALITY RESULTS (~acterial ~nalysis)
Page 10
Station No. ------- 6 2 62 62 62 62 6 2 62 6 2 6 2 62 62 62 62 62
Date Sampled --------- 11-Jun-91 17-Jun-91 25-Jun-91 2-Jul-9 1 9-Jul-91 15-Jul-91 23-Jul-91 29-Jul-9 1 7-Aug-9 1 12-Aug-91 20-Aug-9 1 26-Aug-9 1 4-Sep-9 1 9 -Sep-9 1
Fecal Colif o m -------- LTTl 0 10 LTlO 10 LTlO 190 LTlO LTl 0 10 10 LTlO 10 LTlO
E. coli Water Temp.
Remarks
------------------------------------------------------------ -------- LTlO LTlO LTlO LTlO LTlO 120 LTlO LTlO LTlO 10 LTlO 10 LTlO
no sample taken ............................................................ RAISIN RIVER NEAR CAIRN
LTlO LTlO LTlO 10 LTlO LTlO LTlO LTlO LTlO
LTlO LTlO LTlO .
LTlO LTlO LTlO LTlO LTlO LTlO
no sample taken - rough channel conditions LTlO LTlO
LTlO LTlO
no sample taken ............................................................ WCLAREN PAM BEACH - WEST WOODLANDS ISLAND
10 10 2 0 9 0 LTlO LTlO 5 0 5 0 10
10 LTlO LTlO 160 5 0 10 6 0 70 LTlO
3 gulls on beach beach raked 2 bathers . 20 gulls on beach 3 bathers 40 gulls on beach 10 gulls on beach ............................ HOOPLE BAY AT HIGHWAY TWO
LTlO LTlO LTlO 6 0 LTlO LTlO LTlO 10 LTlO LTlO 10 LTlO '
2 0 LTlO 10 LTlO 10 10
LTlO 10 LTlO 150 LTlO LTl 0 LTlO LTlO LTlO LTlO LTlO LTlO 5 0 LTlO LTlO LTlO 20 LTlO
inf law
rough water, windy
............................................................ RAISIN RIVER AT FIRST BR1IX;E DOWNSTREAM OF WILLIAMSTOWN
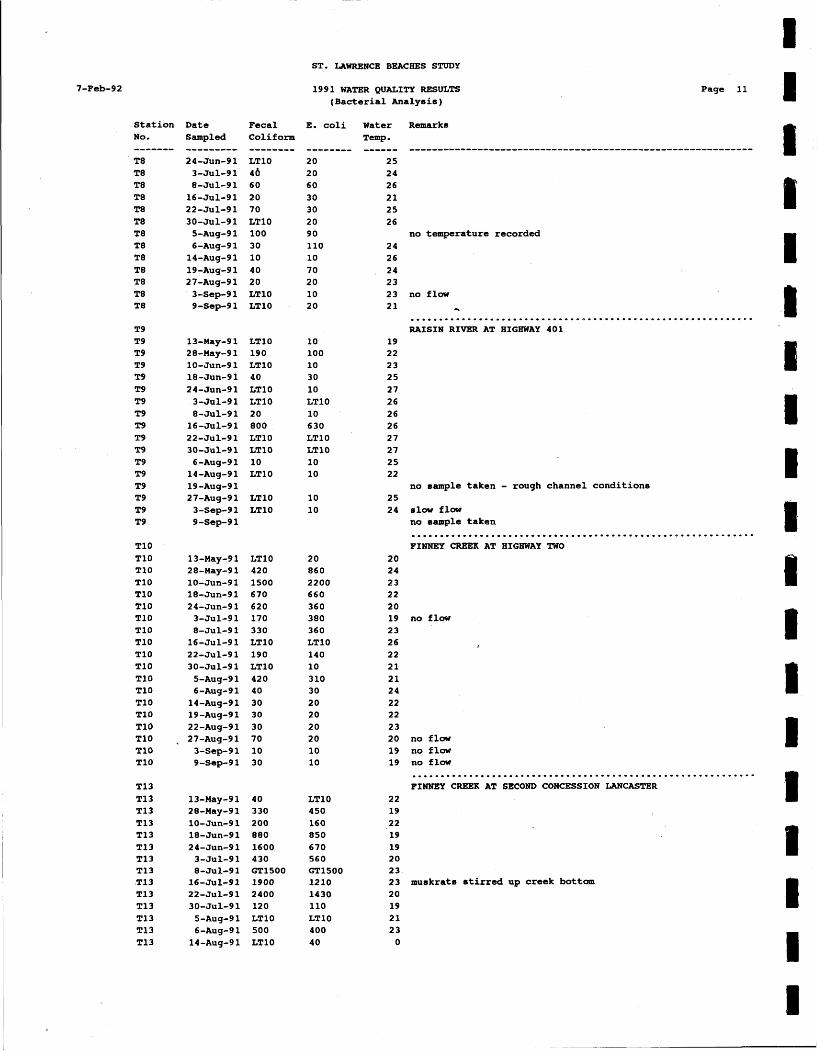
ST. LA-NCE BEACXES STUDY
Page 11 I 1991 WATER QUALITY RESULTS (Bacterial Analysis)
Station No.
Date Sampled --------- 24-Jun-91 3-Jul-9 1 8-Jul-91 164111-9 1 22-Jul-9 1 30-Jul-9 1 5-Aug-9 1 6-Aug-9 1 14-Aug-91 19-Aug-91 27-Aug-91 3-Sep-9 1 9-Sep-9 1
Fecal Colif orm -------- LTlO 4 b 6 0 20 7 0 LTlO 100 3 0 10 4 0 20 LTlO LTlO .
E. coli Water Temp. ------
2 5 2 4 26 2 1 2 5 2 6
Remarks
------------------------------------------------------------
no temperature recorded
no flow
* ............................................................ RAISIN RIVER AT HIGHWAY 401
LTlO 190 LTl 0 40 LTlO LTlO 2 0 800 LTlO LTlO 10 LTlO
10 100 10 3 0 10 LTlO 10 6 30 LTlO LTlO 10 10
no sample taken - rough channel conditions LTlO LTlO s l w flow
no sample taken ............................................................ FINNEY CREEK AT HIGBWAY TWO
LTlO 420 1500 670 620 170 330 LTlO 190 LTlO 420 40 3 0 3 0 3 0 7 0 10 30
20 860 2200 660 360 380 360 LTlO 140 10 310 3 0 20 20 2 0 2 0 10 10
no flow
no flow no flow no flow ............................................................ FINNEY CREEK AT SECOND CONCESSION LANCASTER
40 330 200 880 1600 430 GT1500 1900 2400 120 LTlO 500 LTlO
LTlO 450 160 850 670 560 GT1500 1210 1430 110 LTlO 400 40
muskrats utirred up creek bottom

ST. LAWRENCE BEACBES STUDY
1991 WATER QUALITY ReSULTS (Bacterial Analysis)
Page 12
Station Date Fecal E. coli Water No. sampled colif orm Temp- ------- --------- -------- -------- ------ T13 19-Aug-91 T13 22-Aug-91 G!L$500 1380 18 T13 27-Aug-9 1 T13 3-SCP-9 1 TI3 9-Sep-9 1
28-May-91 220 10-Jun-91 80 18-Jun-91 30 24-Jun-91 LTlO 3-Jul-91 30 8-Jul-91 20 16-Jul-91 210 22-Jul-91 210 30-Jul-91 10 5-Aug-91 LTlO 6-Aug-91 30 14-Aug-91 10 19-Aug-91- 110 27-Aug-91 40 3-Sep-91 10 9-Sep-91 10
16-Jul-91 LTlO 22-Jul-91 100 30-Jul-91 120 5-Aug-91 110 6-Aug-91 180 14-Aug-91 20 19-Aug-91 410 27-Aug-91 90 3-Sep-91 70 9-Sep-91 50
140 110 6 0 LTlO 20 20 2 0 5 0 10 10 10 10 40 90 LTlO 2 0
LTlO 150 8 0 6 10 210 2 0 290 40 40 6 0
13-May-91 10 10 28-May-91 50 60 10-Jun-91 LTlO LTlO 18-Jun-91 30 4 0 24-Jun-91 LTlO 3 0
Remarks
------------------------------------------------------------ no sample taken - no flow no sample taken - no flow no sample taken - no flow no sample taken - no flow ............................................................ RAISIN RIVER, DOWNSTREAM OF KRAFT PLANT
no flow
............................................................ RAISIN RIVER DOWNSTRgAH OF WILLIAMSTOWN
2 6 2 5 2 5 2 3 22 25 25 2 4 22 19
............................................................ RAISIN RIVER UPSTREAM OF WILLIAMSTOWN
2 6 26 27 2 4 2 3 2 5 25 no flow 2 4 2 2 2 1 ............................................................
RAISIN RIVER AT MACGILLIVRAY8S BRIDGE 26 2 6 2 7 2 4 22 2 6 26 no flow 24 21 no flow 21 slow flow ............................................................
GARRY RIVER - UPSTREAM OF ALEXANDRIA LAKE 2 1 2 3 2 3 20 2 2
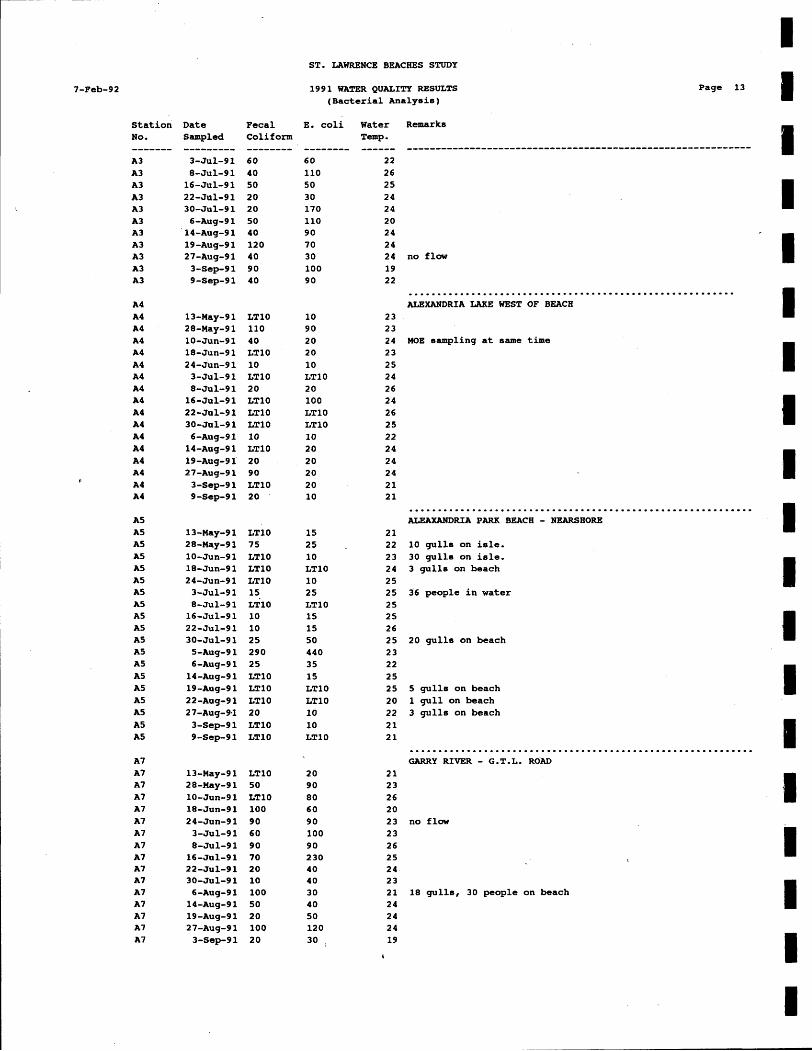
Station Date Fecal No. Sampled Colif o m ------- --------- -------- A3 3-Jul-91 60 A3 8-Jul-91 40 A3 16-Jul-91 50 A3 22-Jul-91 20 A3 30-Jul-91 20 A3 6-Aug-91 50 A3 14-Aug-91 40 A3 19-Aug-91 120 A3 27-Aug-91 40 A3 3-Sep-91 90 A3 9-Sep-91 40
13-Hay-91 LTlO 28-May-91 110 10-Jun-91 40 18-Jun-9 1 LTlO 24-~un-91 10 3-Jul-91 LTlO 8-Jul-91 20 16-Jul-91 LTlO 22-Jul-91 LTlO 30-Jul-91 LTlO 6-Aug-91 10 14-Aug-91 LTlO 19-Aug-91 20 27-Aug-91 90 3-Sep-91 LTlO 9-Sep-91 20
13-May-91 LTlO 28-May-91 75 10-Jun-9 1 LTlO 18-Jun-91 LTlO 24-Jun-91 LTlO 3-Jul-91 15. 8-Jul-91 LTlO 16-Jul-91 10 22-Jul-91 10 30-Jul-91 25 5-Aug-91 290 6-Aug-91 25 14-Aug-91 LTlO 19-Aug-9 1 LTlO 22-Aug-91 LTlO 27-Aug-91 20 3-Sep-91 LTlO 9-Sep-91 LTlO
13-May-91 LTlO 28-Hay-91 50 10-Jun-91 LTlO 18-Jun-91 100 24-Jun-91 90 3-Jul-91 60 8-Jul-91 90 16-Jul-91 70 22-Jul-91 20 30-Jul-91 10 6-Aug-91 100 14-Aug-91 50 19-Aug-91 20 27-Aug-9 1 100 3-Sep-91 20
ST, LAWRENCE BEACHES STUDY
1991 WATER QUALITY RESULTS (Bacterial ~nalysis)
Page 13
E. coli Water Temp - -------- ------
60 22 110 2 6 50 2 5 30 2 4 170 2 4 110 20 90 2 4 70 24 3 0 2 4 100 19 90 22
Remarks
------------------------------------------------------------
no flow
10 9 0 2 0 20 10 LTl 0 2 0 100 LTlO LTlO 10 20 2 0 20 20 10
15
25 . 10 LTlO 10 2 5 LTlO 15 15 5 0 440 3 5 15 LTlO LTlO 10 10 LTlO
......................................................... ALEXANDRIA LAKE WEST OF BEACH
HOE sampling at same time
............................................................ ALEAXANDRIA PARK BEACH - NEARSHORE 10 gulls on isle. 30 gulls on isle. 3 gulls on beach
36 people in water
20 gulls on beach
5 gulls on beach 1 gull on beach 3 gulls on beach
............................................................ GARRY RIVER - G.T.L. ROAD
no flow
18 gulls, 30 people on beach

ST. LAWRENCE BEACRBS S-Y
1991 WATER QUALITY RBSULTS (Bacterial Analysis)
Station Date Fecal B. coli Water Remarks No. sampled Colif om Temp. ------- --------- -------- -------- ------ ------------------------------------------------------------ A7 9 - S S P - ~ ~ 30 10 2 1
APPENDIX B I
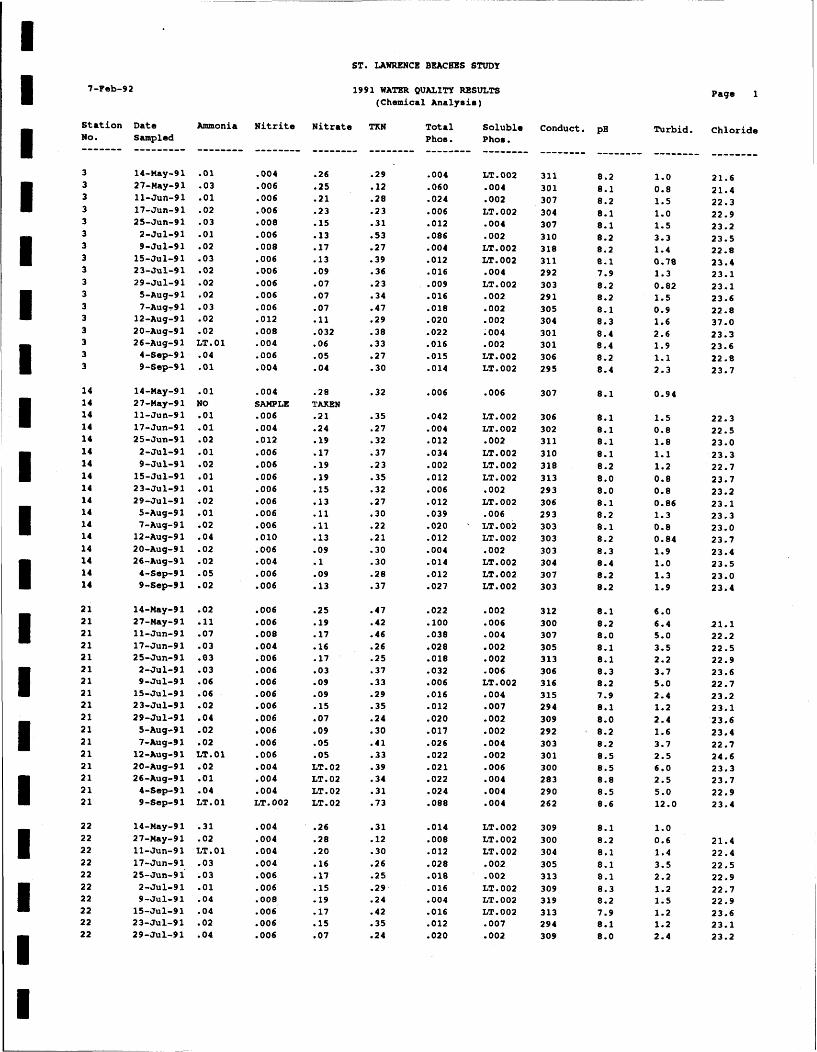
ST. LAWRENCE BEACHES STUDY
1991 WATER QUALITY RESULTS (Chemical Analyaia)
Page 1
Station Date Ammonia Nitrite no. Sampled
Nitrate TKN Total Soluble Phos. Phoa. -------- -------- -------- --------
Conduct. p~ Turbid. Chloride
LT.002 -004 .002 LT. 002 -004 .002 LT. 002 LT. 002 .004 LT. 002 .002 .002 .002 .004 .002 LT. 002 LT.002
.004 SAMPLE .006 .004 .012 .006 .006 .006 .006 .006 .006 .006 .010 .006 .004 .006 .006
.28 TAKEN .2 1 .2 4 .19 .17 .19 .19 -15 -13 .ll -11 .13 .09 .1 .09 .13
.006
LT. 002 LT. 002 .002 LT.002 LT. 002 LT. 002 .002 LT. 002 .006 LT. 002 LT. 002 .002 LT. 002 LT.002 LT.002
-006 .006 .008 .004 .006 .006 .006 .006 .006 .006 .006 .006 .006 .004 .004 .004 LT. 002
-25 el9 .17 .16 .17 .03 09 .09 .I5 .07 .09 .05 .05 LT. 02 LT. 02 LT.02 LT.02
.OO2
.006
.004
.002
.002
.006 LT. 002 .004 .007 .002 .002 .004 .002 .006 .004 .004 004
LT. 002 LT. 002 LT. 002 .002 .002 LT. 002 LT. 002 LT. 002 .007 .002

ST. LAWRENCE BEACHES STUDY
1991 WATER QUALITY RESULTS (Chemical Analyeie)
Page 2
Nitrate T K N Total Soluble Phoa. Phoe.
Station No. ------- 2 2 2 2 2 2 2 2 22 22 22
Date Sampled --------- 5-Aug-9 1 7-Aug-91 12-Aug-91 20-Aug-9 1 26-Aug-9 1 4-ssp-9 1 9-Sep-9 1
Ammonia Nitrite Conduct. pH Turbid. Chloride
-------- .03 .02 LT. 01 .02 .01 .o4 .03
-------- -------- -------- -------- .05 .29 .034 .004 .05 .41 .026 .004 .05 .33 .022 .002 LT .02 .39 .02 1 ,006 LT.02 .34 .022 .004 LT. 02 .31 .024 .004 -11 .40 .035 .004
.01
.03 LT.01 .02 .02 .O1 .06 .03 .03 .02 .O1 .Ol LT. 01 .02 .O1 .04 LT.01
LT. 002 LT. 002 LT. 002 LT.002 .002 LT .002 LT.002 LT.002 .004 .002 .002 LT. 002 LT. 002 .002 .004 LT. 002 .002
LT. 002 LT.002 LT. 002 LT.002 LT. 002 LT .002 .004 LT. 002 .004 LT. 002 ,004 LT. 002 LT. 002 LT. 002 .004 LT.002 .002
.27
.25
.20
.2 1
.09 TAKEN .05 LT. 02 LT. 02 LT. 02 LT.02 .04 LT. 02 LT. 02 LT.02 LT. 02 LT. 02
LT. 002 .002 LT. 002 LT. 002 LT. 002
.002 LT. 002 LT.002 LT. 002 .002 .002 .002 LT. 002 .002 LT.002 .002
.25 .40 .010 .002
.26 .40 LT.04 LT.002
.10 .31 .018 LT. 002
.I32 .30 .014 .004
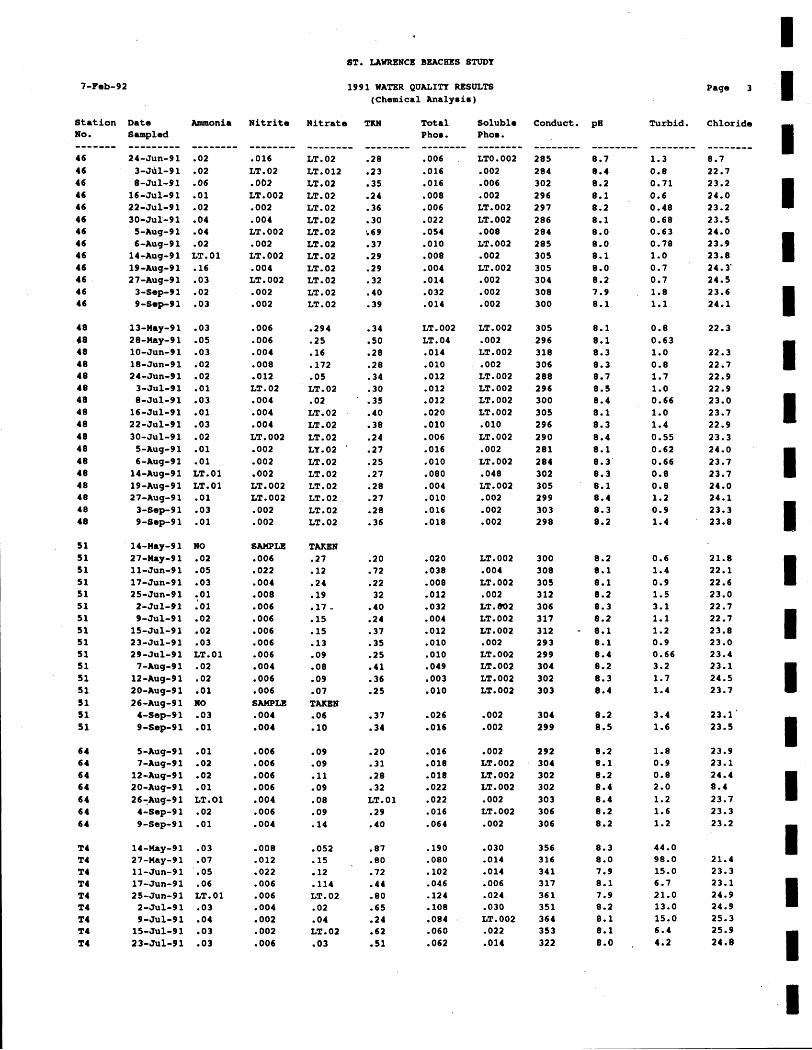
ST. LAWRENCE BEACHES STUDY
1991 WATER QUALITY RESULTS (Chemical Analysie)
Page 3
Station No. ------- 4 6 46 46 4 6 46 46 46 4 6 46 46 4 6 46 4 6
Date S.mpled --------- 24-Jun-91 3-Jd1-9 1 8-Jul-91 16-Jul-91 22-Jul-91 30-JuX-91 5-Aug-9 1 6-Aug-9 1 14-Aug-91 19-Aug-9 1 27-Aug-9 1 3-Sap-9 1 9-Ssp-9 1
Ammonia Nitrite Nitrate T X N Total Ph08.
Solublm Phoe . -------- LTO .002 .002 .006 .002 LT.002 LT. 002 .008 LT. 002 .002 LT. 002 .002 .002 .002
Conduct. pH Turbid. Chloride
-------- -------- LT.02 .28 LT.012 .23 LT.02 .35 LT. 02 .24 LT. 02 .36 LT. 02 .30 LT. 02 :69 LT.02 .37 LT.02 .29 LT. 02 -29 LT. 02 .32 LT.02 .40 LT.02 -39
.016 LT. 02 .062 LT. 002 .002 .004 LT. 002 .002 LT. 002 .004 LT.002 .002 .002
.006
.006
.004
.008
.012 LT.02 .004 .004 .004 LT.002 .002 .002 .002 LT.002 LT. 002 .002 .002
.294
.25
.16
.I72
.05 LT.02 .02 LT.02 .
LT. 02 LT. 02 LY.02 LT.02 LT.02 LT.02 LT. 02 LT.02 LT. 02
LT.002 .002 LT. 002 .002 LT.002 LT. 002 LT. 002 LT.002 .010 LT.002 .002 LT.002 .048 LT.002 .002 .002 .002
SAMPLE .006 ,022 .004 .008 ,006 .006 .006 .006 .006 .004 .006 .006 SIVIPLE .004 .004
LT. 002 .004 LT. 002 .002 LT. 802 LT. 002 LT. 002 .002 LT. 002 LT. 002 LT.002 LT. 002
.09 .20 .016 .002
.09 -31 .018 LT. 002 , 11 .28 .018 LT.002 .09 .32 .022 LT.002 .08 LT.01 .022 .002 .09 .29 .016 LT. 002 .14 .40 .064 .002
-03 -07 .05 .06 LT. 01 .03 .04 -03 .03
.052
.15
.12
.I14 LT.02 .02 .04 LT. 02 .03
.030
.014
.014
.006 -024 .030 LT. 002 -022 .014

ST. LAWRENCE BgACBBS STUDY
1991 WATER QUALITY RBSULTS (Chemical Analyrir)
Page 4
Station No.
Date Sampled --------- 29-Jul-91 5-Aug-9 1 7-Aug-91 12-Aug-91 20-Aug-9 1 26-Aug-91 4-Sep-9 1 9-Sop-9 1
Ammonia Nitrite Nitrate TKN
-------- -------- LT. 02 .36 -03 .42 LT.02 .53 LT. 02 .63 LT.02 .43 LT.02 -41 LT.02 .67 LT.02 .60
Total Ph00. -------- .030 a060 .098 -108 ,042 .036 .lo6 .074
Soluble Phos . -------- .006 ,010 .022 .016 .006 .004 ,018 .010
Conduct. Turbid. Chloride
-------- LT.01 -06 .05 LT.01 LT.01 LT.01 .07 LT. 01
-------- .006 .006 .004 .002 .
,002 LT. 002 .004 .002
.012
.02 ,022 .008 .004 LT.02 .008 .oo4 ,004 .002 .002 .004 .002 .002 LT. 002 .006 .004
.I88
.48
.24 LT. 02 LT.02 LT. 02 LT. 02 LT.02 LT. 02 LT. 02 LT.02 LT. 02 LT. 02
. LT. 02 LT.02 LT. 02 LT. 02
.054
.060
.040
.018
.078
.078
.074 -048- .034 .062 .072 .078 .022 LT. 002 .036 .036 .032
.012
.Old
.004 SAMPLE .006 .004 .002 .002 .002 .002 .002 SAMPLE .002 .008
.208
.I66
.I60 TAmm LT .02 LT. 02 LT.02 LT.02 LT. 02 LT.02 LT. 02 TAKEN LT.02 LT.02
.048
.040 LT. 002
.596 LT.02 LT.02 LT.02 LT.02 LT.02 LT.02 .a3 LT. 02 LT. 02 .04 LT. 02 LT. 1 -03 .03 .03
.02 e03 2.00 -05 LT.01 LT. 01 .04 .01 .10 .30 el8 .08 .10 .12 , -17 .10
.044
.006
.024
.010
.002
.02
.006
.006
.006
.014
.008
.006 LT. 01 ,008 .o 10 .010
.576 .56 .024 .052 2.01 .90 .080 .060 LT. 02 .57 .lo4 .058 LT.02 .75 ,220 .I70 LT. 02 *65 .I20 .094 LT.02 .82 .250 ,190 LT.02 1.22 LT.020 .200
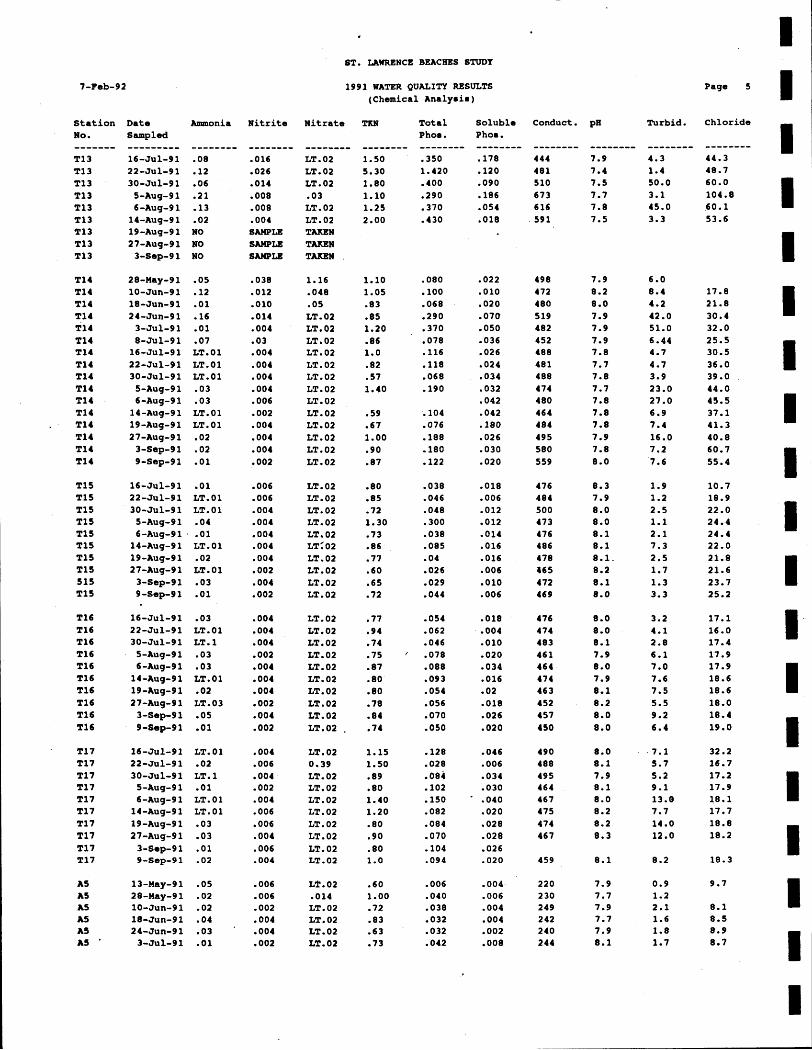
ST. LAWRENCE BEACWS STUDY
1991 WATER QUALITY RESULTS (Chemical Analyaia)
Page 5
Conduct. pH Turbid. Chloride Station No. ------- T13 T13 TI3 T13 T13 T13 T13 TI3 TI3
Date Sampled --------- 16-Jul-91 22-Jul-91 30-Jul-91 5-Aug-9 1 6 -Aug-9 1 14-Aug-9 1 19-Aug-9 1 27-Aug-9 1 3-SOP-9 1
Ammonia Nitrite Nitrate
-------- LT.02 LT. 02 LT.02 .03 LT.02 LT.02 TMEN TAKEN TMEN .
TKN
-------- 1.50 5.30 1.80 1.10 1.25 2.00
Total Phos . -------- .350 1.420 .400 .290 .370 .430
Soluble Phos . -------- .I78 .I20 ,090 ,186 .054 .018
-------- .016 .026 -014 .008 .008 .004 SAMPLE SAMPLE SAMPLE
1.16 .048 .05 LT. 02 LT.02 LT.02 LT. 02 LT. 02 LT.02 LT. 02 LT.02 LT.02 LT. 02 LT. 02 LT. 02 LT.02
T1S TI5 TI5 T1S T1S T1S T15 T1S 515 TlS
.01 LT. 01 LT.01 .04 .01 LT.01 .02 LT. 01 .03 .O1
LT. 02 LT. 02 LT. 02 LT. 02 LT. 02 LT: 02 LT.02 LT.02 LT. 02 LT.02
.03 LT.01 LT. 1 .03 -03 LT.01 .02 LT.03 -05 .O1
LT.02 LT.02 LT. 02 LT.02 LT. 02 LT. 02 LT.02 LT.02 LT.02 LT.02 .
LT. 01 .02 LT. 1 .O1 LT.01 LT.01 .03 -03 .01 .02
LT. 02 0.39 LT. 02 LT. 02 LT.02 LT.02 LT.02 LT.02 LT. 02 LT.02
L'k.02 .60 .006 .004 -014 1-00 -040 .006 LT.02 .72 .038 .004 LT. 02 .83 .032 .004 LT. 02 .63 .032 .002 LT. 02 .73 .042 .008
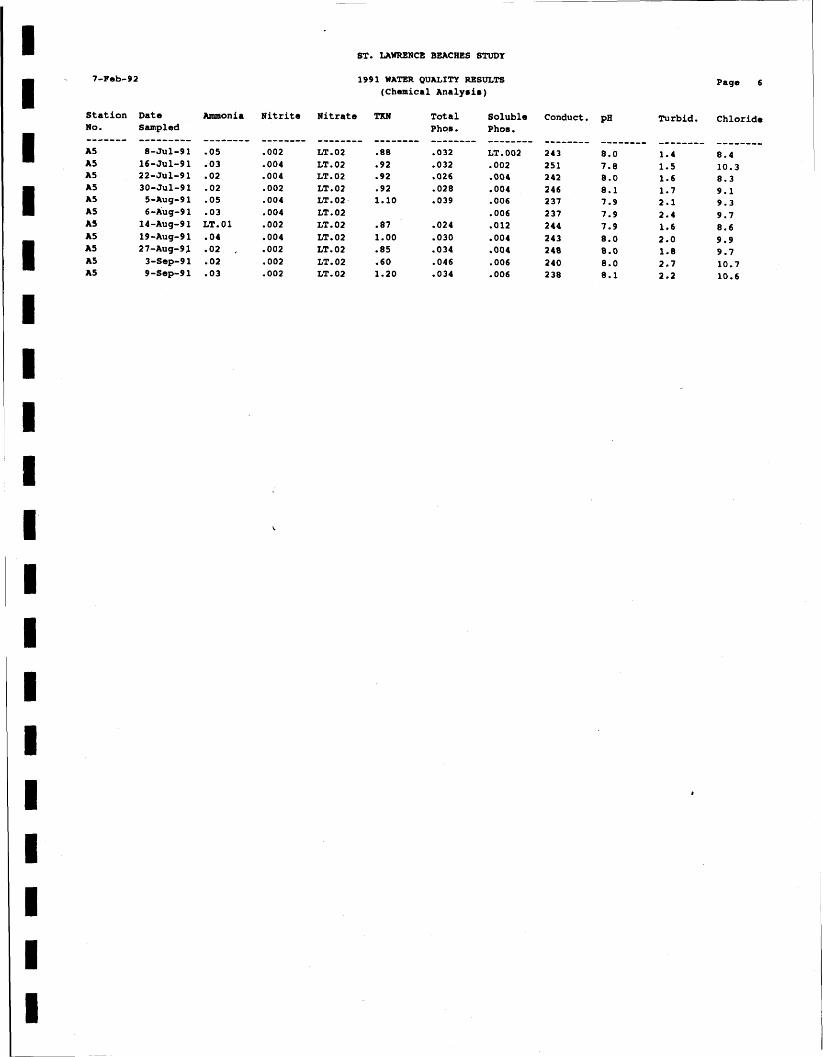
Station No. ------- A5 AS A5 A5 A5 A5 A5 A5 A5 A5 A5
Date Sampled --------- 8-Jul-91 16-Jul-91 22-Jul-91 30-Jul-91 5-Aug-9 1 6-Aug-9 1 14-Aug-91 19-Aug-9 1 27-Aug-9J 3-Sep-9 1 9-Sep-91
Ammonia
-------- .05 -03 .02 .02 05 .03 LT. 01 .04 .02 ,
.02 -03
Nitrite
-------- .002 .004 .004 .002 .004 .004 .002 .004 .002 ,002 .002
ST. LAWRENCE BBACBES STUDY
1991 WATER QUALITY RESULTS (Chemical Analysis)
Nitrate
-------- LT.02 LT.02 LT.02 LT.02 LT.02. LT.02 LT.02 LT.02 LT. 02 LT. 02 LT. 02
Tot a1 Phor . -------- .032
.032
.026
.028
.039
.024
.030
.034
.046
.034
Soluble Phor . --- - - - - - LT. 002 .002 .004 .004 ,006 .006 .012 .004 .ooa .006 .006
Conduct. p~ Turbid.
-------- 1.4 1.5 1.6 1.7 2.1 2 4 1.6 2.0 1.8 2.7 2.2
Page 6
Chloride
-------- 8.4 10.3 8.3 9.1 9.3 9.7 8.6 9.9 9.7 10.7 10.6

APPENDIX C

ST. LAWRENCE BEACHES STUDY - 1991 G e e s e and G u l l S t u d y
T o t a l D r o p p i n g s Density (I/&) ------------------ ------------------
Park D a t e GOOSE ,cvU GOOSE GULL --------------- --------- ------ ------ ------ ------
CRYSLER CRYSLER CRYSLER CRYSLER CRYSLER CRY SLER CRYSLER CRY SLER CRY SLER CRYSLER CRYSLER CRYSLER CRYSLER PARRAN FARRAN FARRAN FARRAN FARRAN FARRAN FARRAN FARRAN FARRAN FARRAN PARRAN PARRAN PARRAN WOODLANDS WOODLANDS WOODLANDS WOODLANDS WOODLANDS WOODLANDS WOODLANDS WOODLANDS WOODLANDS WOODLANDS WOODLANDS WOODLANDS WOODLANDS
P a g e 1

APPENDIX D
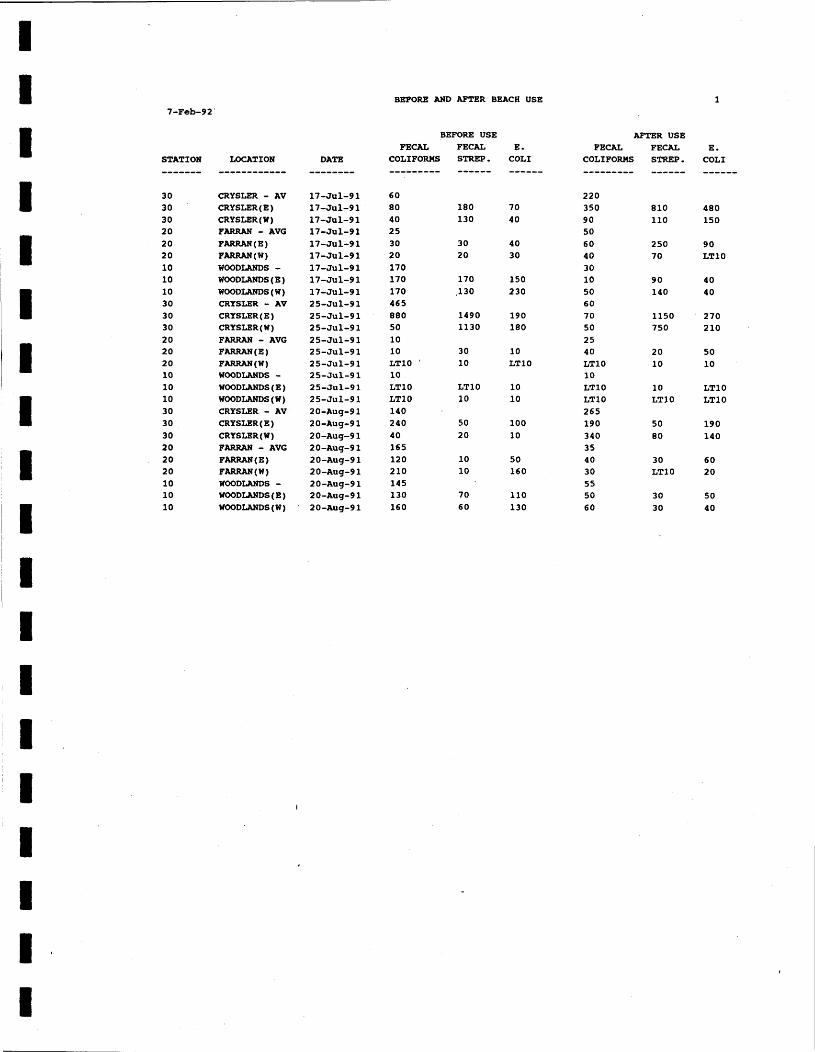
STATION ------- 3 0 3 0 3 0 20 20 2 0 10 10 10 30 30 3 0 2 0 20 2 0 10 10 10 3 0 3 0 30 2 0
, 20 20 10 10 10
LOCATION ------------ CRYSLER - AV CRYSLER(E ) CRYSLER ( W) FARRAN - AVG FARRAN(E) F-(W) WOODLANDS - WOODLANDS ( E ) WOODLANDS ( W) CRYSLER - AV CRYSLER ( E ) CRYSLER(W) FARRAN - AVG F-(E) FARRAN(W) WOODLANDS - WOODLANDS(E) WOODLANDS ( W ) CRYSLER - AV CRYSLER(E) CRYSLER ( W ) FARRAN - AVG PARRAN ( E ) F-(w) WOODLANDS - WOODLANDS ( E ) WOODLANDS(W)
DATE --------
BEFORE AND AFTER BEACH USE
BEFORE USE FECAL FECAL E.
COLIFORHS STREP. COLI --------- ------ ------ 6 0 8 0 4 0 2 5 3 0 2 0 170 170 170 465 880 5 0 10 10 LTlO '
10 LTlO LTlO 140 240 40 165 120 2 10 145 130 160
3 0 10 10 LTlO
LTlO 10 10 10
AFTER USE FECAL FECAL
COLIFORnS STREP. --------- ------ 220 350 90 5 0 60 4 0 30 10 5 0 60 7 0 5 0 2 5 40 LTlO 10 LTlO LTlO 265 190 340 35 40 30 55 5 0 60
10 LTlO
30 LTlO
E. COLI
90 LTlO
LTlO LTlO

APPENDIX E
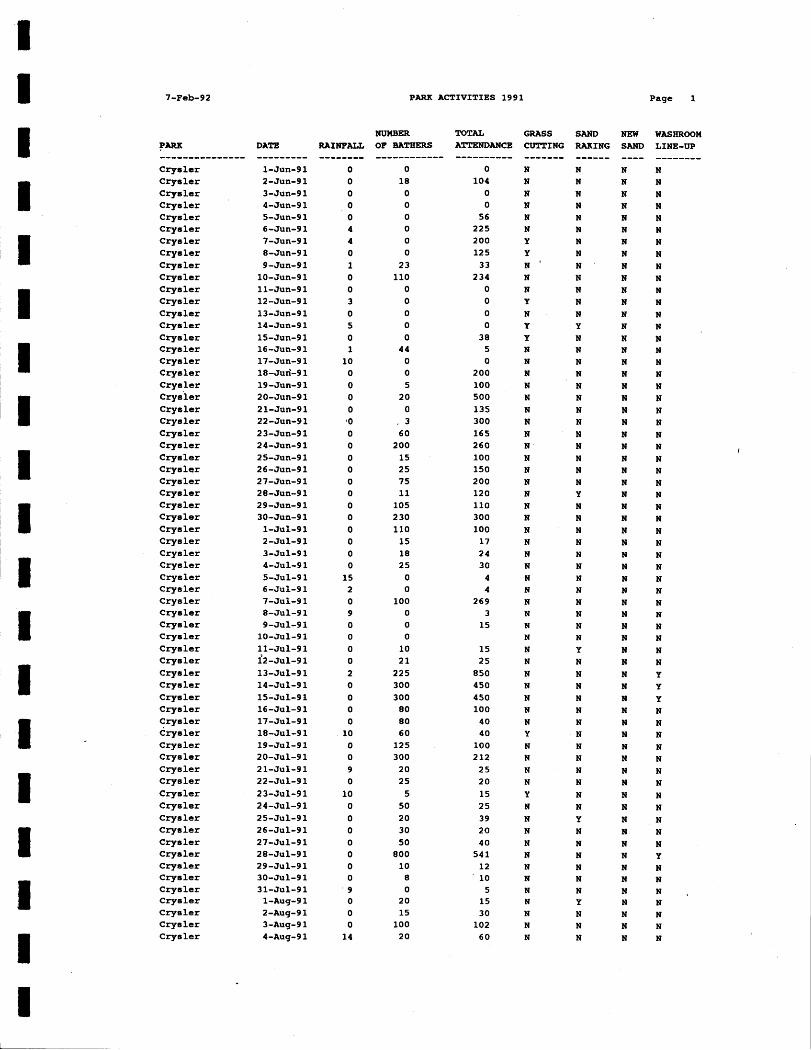
7-Peb-92 PARK ACTIVITIES 1991 Page 1
P- -------- Crysler Crysler Crysler Crysler Crysler Crysler Crysler Crysler Crys ler Crysler Crysler Crysler Crysler Crysler Crysler Crysler Crysler Crysler Crys ler crysier Crysler Crysler Crysler Crysler Crysler Crysler Crysler Crysler Crysler Crysler Crysler Crysler Crysler Crysler Crysler Crysler Crysler Crysler Crysler Crysler Crysler Crys ler Cryeler Crysler Crysler Crysler Crysler Crysler Crysler Crysler Crysler Crysler Crysler Cryeler Crysler Crys ler Crysler Crysler Crysler Crysler Crysler Cryeler Crysler Crysler Crysler
DATE --------- 1-Jun-9 1 2-Jun-91 3-Jun-91 4-Jun-91 5-Jun-9 1 6-Jun-91 7-Jun-91 8-Jun-9 1 9-Jun-91 10-Jun-91 11-Jun-91 12-Jun-91 13-Jun-9 1 14-Jun-91 15-Jun-91 16-Jun-91 17-Jun-91 18-Jud-9 1 19-Jun-91 20-Jun-91 21-Jun-91 22-Jun-91 23-Jun-9 1 24-Jun-91 25-Jun-91 26-Jun-91 27-Jun-91 28-Jun-91 29-Jun-91 30-Jun-9 1 1-Jul-91 2-Jul-91 3-Jul-91 4-Jul-91 5-Jul-9 1 6-Jul-91 7-Jul-91 8-Jul-9 1 9-Jul-91 10-Jul-91 !I-Jul-91 12-Jul-91 13-Jul-91 14-Jul-9 1 15-Jul-9 1 16-Jul-91 17-Jul-91 18-Jul-9 1 19-Jul-91 20-Jul-9 1 2 1-Jul-9 1 22-Jul-9 1 23-Jul-91 24-Jul-9 1 25-Jul-91 26-Jul-91 27-Jul-91 28-Jul-91 29-Jul-91 30-Jul-9 1 31-Jul-91 1-Aug-9 1 2-Aug-9 1 3-Aug-91 4-Aug-91
NUMBER OF BATHERS ------------
0 18 0 0 0 0 0 0
23 110 0 0 0 0 0 44 0 0 5
2 0 0
. 3 6 0
200 15 2 5 7 5 11
105 2 30 110 15 18 2 5 0 0
100 0 0 0 10 2 1 225 300 300 8 0 8 0 60 125 300 2 0 2 5 5
50 20 3 0 5 0
800 10 8 0
20 15
100 20
TOTAL A!CT'ENDANCE ----------
0 104 0 0
5 6 225 200 125 3 3
234 0 0 0 0
38 5 0
200 100 500 135 300 165 260 100 150 200 120 110 300 100 17 2 4 3 0 4 4
269 3
15
GRASS CUTTING ------- N N N N N N Y Y N ' N N Y N Y Y N N t3
N N N N N N N N N N N N N N N N N N N N N N N N N N N N N Y N N N N Y N N N N N N N N N N N N
SAND W I N G ------ N N N N N N N N N N N N N Y N N N N N N N N N N N N N Y N N N N N N N N
N N N N Y N N N N N N N N N N N N N Y N N N N N N Y N N N
NEW SAND ---- N N N N N N N N N N N N N N N N N N N N N N N N N N N N N N N N N N N N N N N N N N N N I N N N N N N N N N N N N N N N N N N N N
WASHROOM LINE-UP -------- N N N N N N N N N N N N N N N N N N N N N N N N N N N N N N N N N N N N N N N N N N Y Y Y N N N N N N N N N N N N Y N N
N 5
N N N N
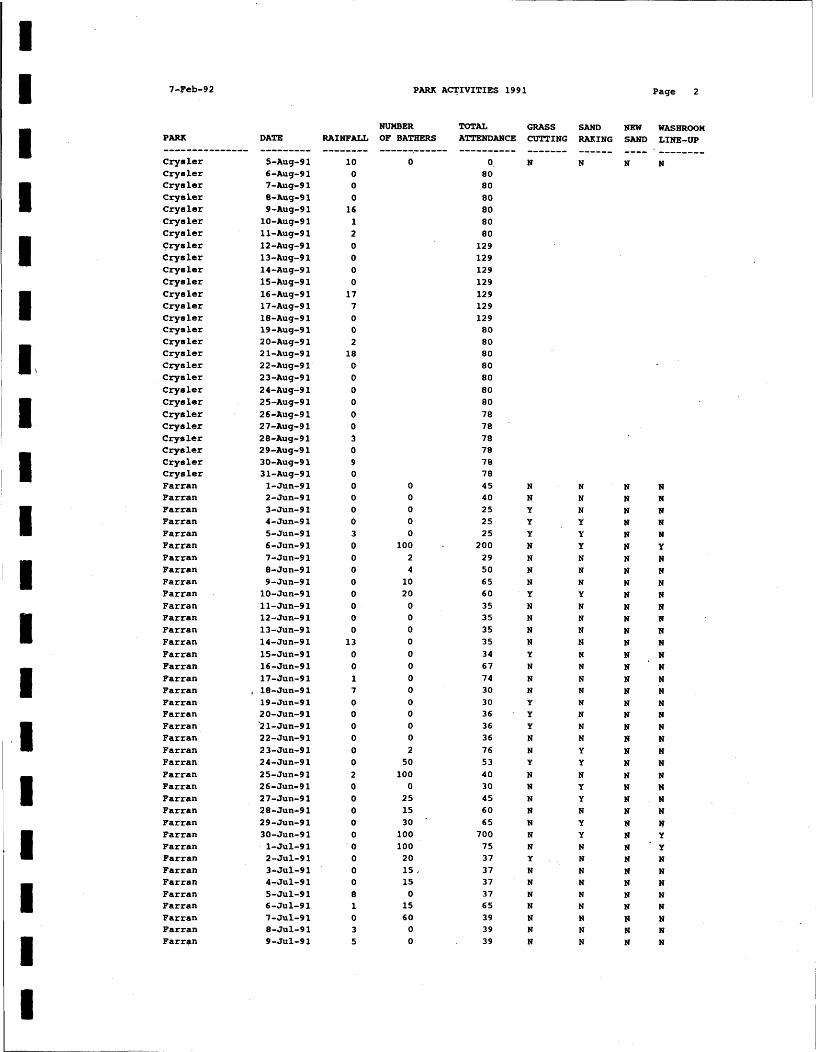
7-Feb-92 PAM ACTIVITIES 1991 Page 2
PARK --------- Crysler Crysler Crys ler Crysler Crys ler Crysler Crysler Crysler Crysler Crysler Cry6 ler Crysler Crysler Crysler Cryef er Crysler Crysler Crysler Crysler Crysler Crysler Crysler Crysler Crysler Crysler Crysler Crysler Farran Farran Farran Farran Farran Farran Farran Farran Farran Farran Farran Farran Farran Farran Farran Farran Parran Farran Farran Farran Farran Farran Farran Farran Farran Farran Farran Farran Farran Farran Farran Farran Farran Farran Farran Farran Farran Parran Farran
DATE --------- 5-Aug-9 1 6-Aug-91 7-Aug-9 1 8-Aug-9 1 9-Aug-9 1 10-Aug-91 11-Aug-9 1 12-Aug-91 13-Aug-9 1 14-Aug-9 1 15-Aug-9 1 16-Aug-9 1 17-Aug-9 1 18-Aug-91 19-Aug-91 20-Aug-91 2 1-Aug-9 1 22-Aug-9 1 23-Aug-91 24-Aug-91 25-Aug-91 26-Aug-9 1 27-Aug-91 28-Aug-9 1 29-Aug-9 1 30-Aug-9 1 31-Aug-9 1 1-Jun-91 2-Jun-91 3-Jun-9 1 4-Jun-9 1 5-Jun-9 1 6-Jun-9 1 7-Jun-91 8-Jun-91 9-Jun-91 10-Jun-91 11-Jun-91 12-Jun-91 13-Jun-9 1 14-Jun-91 15-Jun-9 1 16-Jun-91 17-Jun-91 18-Jun-9 1 19-Jun-91 20-Jun-91 -21-~un-91 22-Jun-91 23-Jun-91 24-Jun-9 1 2 5-Jun-9 1 26-Jun-9 1 27-Jun-91 28-Jun-91 29-Jun-91 30-Jun-9 1 1-Jul-91 2-Jul-91 3-Jul-91 4-Jul-91 5-Jul-91 64111-91 7-Jul-91 8-Jul-9 1 9-Jul-91
RAINFALL -------- lo 0 0 0 16 1 2 0 0 0 0 17 7 0 0 2 18 0 0 0 0 0 0 3 0 9 0 0 0 0 0 3 0 0 0 0 0 0 0 0 13 0 0 1 7 0 0 0 0 0 0 2 0 0 0 0 0
' 0 0 0 0
8 1 0 3 5
NUMBER OF BATHERS ------------
0
TOTAL ATTENDANCE ----------
0, 80 80 80 8 0 8 0 80 129 129 12 9 129 129 129 129 8 0 8 0 8 0 80 80 8 0 80 7 8 78 '
78 7 8 78 7 8 4 5 4 0 2 5 25 2 5 200 2 9 50 6 5 6 0 35 35 35 35 34 6 7 74 3 0 30 3 6 3 6 36 7 6 5 3 4 0 3 0 4 5 60 6 5 700 7 5 37 3 7 3 7 37 6 5 3 9 39
. 39
GRASS CUTTING ------- N
N N Y
Y . Y N N
N N Y N N N N Y N N N Y Y Y N ' N Y
N N N N N N N Y N N N
N N N N
SAND
m I N G ------ N
N N N Y Y Y N N N Y N N N N N N N N N N N N Y Y N Y Y N Y Y N N
N N N N N N N
NFW SAND ---- N
N N N N N N N N N N N N N N
N . N N N N N N N N N N N N N N N N N N N N N N N N
WASHROOM LINE-UP -------- N

PARK
Fa r r an Pa r r an Fa r r an Fa r r an Pa r r an Pa r r an Pa r r an Fa r r an Pa r r an Fa r r an Fa r r an Pa r r an Pa r r an Pa r r an Fa r r an Fa r r an Fa r r an Fa r r an Fa r r an Fa r r an Fa r r an Pa r r an Pa r r an Fa r r an Pa r r an Pa r r an Fa r r an Fa r r an Fa r r an Fa r r an Fa r r an Fa r r an Fa r r an Fa r r an Fa r r an Fa r r an Fa r r an Pa r r an Fa r r an Fa r r an Fa r r an Fa r r an Fa r r an Fa r r an Pa r r an Pa r r an Fa r r an Fa r r an Fa r r an
Fa r r an Glengarry Glengarry Glengarry Glengarry Glengarry Glengarry Glengarry Glengarry Glengarry Glengarry Glengarry Glengarry Glengarry
DATE --------- 10-Jul-91 11-Jul-9 1 12-Jul-91 13-Jul-91 14-Jul-91 15-Jul-91 16-Jul-91 17-Jul-9 1 18-Jul-9 1 19-Jul-9 1 20-Jul-91 21-Jul-91 22-Jul-9 1
23-Jul-91 24-Jul-91 25-Jul-91 26-Jul-9 1
27-Jul-91 284111-91 29-Jul-91 30-Jul-91 31-Jul-91
1-Aug-9 1 2-Aug-91 3-Aug-9 1 4-Aug-9 1 5-Aug-9 1 6-Aug-9 1 7-Aug-9 1 8-Aug-9 1 9-Aug-9 1
10-Aug-9 1 11 -Aug-9 1 1 2 - ~ ~ ~ - 9 ' 1 13-Aug-9 1 14-Aug-9 1 15-Aug-9 1 16-Aug-9 1 17-Aug-9 1 18-Aug-9 1 19-Aug-9 1 20-Aug-9 1 21-Aug-91 22-Aug-9 1 2 3-Aug-9 1 24-Aug-91 25-Aug-9 1 26-Aug-91 27-Aug-9 1 28-Aug-9 1 29-Aug-9 1
30-Aug-9 1 31-Aug-9 1
1-Jun-91 2-Jun-91 3-Jun-9 1 4-Jun-91 5- Jun-9 1 6-Jun-91 7-Jun-91 8-Jun-91 9-Jun-9 1
10-Jun-91 11-Jun-9 1 12-Jun-9 1 13-Jun-91
PARK ACTIVITIES 1991 Page 3
NUMBER OF BATHERS
TQ'I'AL ATTENDANCE ----------
5 5 45
100 9 0
118 118 8 5 85 54 9 7
101 5 1 75 7 0 8 1 85 9 7
125 130 100 6 9
8 8 102 117 12 1 4 6 42 47 6 4 7 0 75 80 50 4 9 5 2 5 3 58 2 6 2 8
0 0
20
GRASS CUTTING ------- N N
N
N N N Y
Y Y Y N
N N
N Y
Y Y
Y Y Y N
Y
Y Y N
N N Y Y N
N
N N
Y
Y Y
Y N
N Y
Y Y Y N
N
N
Y N
Y Y
N
N N
Y
Y
Y Y Y Y Y Y Y
N N Y
SAND RAX ING ------ N N
N
N N N
N
N Y Y N
N N
Y Y
Y Y Y Y Y N
Y
Y Y N N Y Y N
N N
N
Y
N N
N N
N
N N N N N
N N
N N
N N
N N N N
N N N
N
-t-J N
N
N N N N
NEW SAND ---- N N
N N N N
N
N N N N
N N
N N
N N N
N
N N
WASHROOM
LINE-UP -------- N
N
N N N N
N
N N N N
N
N N N
N Y
Y Y Y N

PARK
G l e n g a r r y Glengar ry G l e n g a r r y G l e n g a r r y G l e n g a r r y Glengar ry G l e n g a r r y Glengar ry G l e n g a r r y Glengar ry G l e n g a r r y Glengar ry Glengar ry Glengar ry Glengar ry Glengar ry Glengar ry G l e n g a r r y Glengar ry G l e n g a r r y G l e n g a r r y Glengar ry Glengar ry Glengar ry Glengar ry Glengar ry G l e n g a r r y Glengar ry G l e n g a r r y G l e n g a r r y Glengar ry Glengar ry Glengar ry Glengar ry Glengar ry Glengar ry Glengar ry Glengar ry Glengar ry Glengar ry G l e n g a r r y
Glengar ry Glengar ry Glengar ry Glengar ry Glengar ry Glengar ry Glengar ry Glengar ry Glemgarry Glengar ry Glengar ry Glengar ry Glengar ry Glengar ry
G l e n g a r r y Glengar ry Glengar ry G l e n g a r r y G l e n g a r r y G l e n g a r r y
Glengar ry Glengar ry Glengar ry G l e n g a r r y Glengar ry
DATE --------- 14-Jun-91 15-Jun-91 16-Jun-91 17-Jun-91 18-Jun-91 19-Jun-91 20-Jun-91 21-Jun-91 22-Jun-91 23-Jun-91 24-Jun-91 25-Jun-9 1 26-Jun-91 27-Jun-91 28-Jun-91 29-Jun-91 30-Jun-91
1-Jul-91 2-Jul-91
3-Jul-91 4- Ju l -91 5-Jul-91 6-Jul-91 7-Jul-91 8-Jul-91 9-Jul-91
10-Jul-91. 11-Jul-91 12-Jul-91 13-Jul-91 1 4 - ~ u l - b 1 15-Jul-91 16-Jul-91 17-Jul-9 1 18-Jul-9 1
.19-Jul-91 20-Jul-91 21-Jul-91 22-Jul-91 23-Jul-91 24-Jul-91
25-Jul-91 26-Jul-91 27-Jul-91 28-Jul-91 29-Jul-9 1 30-Jul-91 31-Jul-9 1
1-Aug-91 2-Aug-9 1 3-Aug-9 1 4-Aug-91 5 - ~ u g - 9 1 6-Aug-9 1 7-Aug-9 1 8-Aug-9 1 9-Aug-91
10-Aug-9 1 11-Aug-91 12-Aug-9 1 13-Aug-9 1 14-Aug-9 1 15-Aug-91 16-Aug-91 17-Aug-9 1 18-Aug-9 1
RAINFALL -------- 2 0 0 2
1 3 0 0 0 0 0 0 0 0 0 0 3 0 0 0
0 0
11 7 4 2 4 1 0 0 0 0 0 0
0 6 0 0 0 0
1 3 0 0 0 0 0
0 0 9 0 0 0 4 0
1 0
0 0
11 1 3 0 0 0 0 1 7
PARK ACTIVITIES 1991
NUMBER OF BATHERS ------------
0 0 0 0 0
10 10 20 20
225 300 100 150
40 40 40 50
200 7 5
120 50
0 3 0
600 0 0
2 0 40
150 165
1000 200 300 300 200 300 700 150 200
125 2 00 300 300
90 1000
150 160 150 100 12 5 400
500 20
1 5 5 0 30 10 2 5 5 0 7 6 75
85 125 12 5 200 200
TOTAL A'JTEWDANCE ----------
. 27 5 0
350 200
40 30 4 0 8 0
100 720
1000
9 00 300
80 70
400 450
1000 300 250 150 150 800
1000 100 100 150 200 270 395
2000 400 500 550 450 700
1600 1200
500 300 500
550 550 600
2000
300 300 400 300 350 800
800 200 175 180
250 200 250 250 150 150 150 160 180 400 500
GRASS CUTTING ------- Y Y Y N
N Y Y Y Y N N N 4 N Y Y Y Y N N Y Y N N
N N
Y Y Y N N N N N Y Y N N
N N
Y
Y Y Y Y N
N N
Y
N N N N
N Y
Y N N N
N N
Y Y
N N N
SAND W I N G ------ N N N N N N N N N N N N N N N
N N N N N N N N N N
N N Y N
N N N N N N Y N N
N N
N N Y Y N N N Y N N Y N N N N N Y N N N N N N
Y N N
Page 4
NEW WASHROOM SAND LINE-UP ---- -------- N N N N N N
N N N N N N N N N N N N N N N N N N N N N N N N
N N N N N N
N N N N
N N N N N N
N N N N
N N N N N N N N N N N Y
N N N N N N N N N N N N N N N N
N N
N N
N N N N N N N Y N N N N N N N N N N N N
N N N N
N N N N
N N N N
N N N N N N N N N N
N N N N N N N N

PARK --------------- Glengarry Glengarry Glengarry Glengarry Glengarry Glengarry Glengarry Glengarry Glengarry Glengarry ~lengarry Glengarry Glengarry Mille Roches Mille Roches Mille Roches Mille Roches Mille Roches Mille Roches Mille Roches Mille Roches Mille Roches Mille Roches Mille Roches Mille Roches Mille Roches Mille Roches Nille Roches Mille Roches Mille Roches Mille Roches Mille Roches Mille Roches Mille Roches Mille Roches Mille Roches Mille Roches Mille Roches Mille Roches Mille Roches Mille Roches Mille Roches Mille Roches Mille Roches Mille Roches Mille Roches Mille Rbches Mille Roches Mille Roches Mille Roches Mille Roches Mille Roches Mille Roches Mille Roches Mille Roches Mille Roches Mille Roches Mille Roches Mille Roches Mille Roches Mille Roches Mille Roches Mille Roches Mille Roches Mille Roches Mille Roches
DATE --------- 19-Aug-9 1 20-Aug-9 1 2 1-Aug-91 22-Aug-91 2 3-Aug-9 1 24-Aug-9 1 2 5-Aug-9 1 26-Aug-9 1 27-Aug-9 1 28-Aug-9 1 29-Aug-9 1 30-Aug-9 1 31-Aug-9 1 1-Jun-91 2-Jun-91 3-Jun-9 1 4-Jun-9 1 5-Jun-91 6-Jun-91 7-Jun-91 8-Jun-91 9-Jun-91 10-Jun-9 1 11-Jun-9 1 12-Jun-91 13-Jun-91 14-Jun-91 15-Jun-9 1 16-Jun-91 17-Jun-9 1 18-Jun-91 19-Jun-91 20-Jun-91 21-Jun-91 22-Jun-9 1 23-Jun-9 1 24-Jun-91 25-Jun-91 26-Jun-91 27-Jun-91 28-Jun-9 1 29-Jun-9 1 30-Jun-91 1-Jul-9 1 2-Jul-91 3-Jul-91 4-Jul-91 5-Jul-91 6-Jul-91 7-Jul-91 8-Jul-91 9-Jul-91 10-Jul-91 11-Jul-91 12-Jul-9 1 13-Jul-91 14-Jul-91 15-Jul-91 16-Jul-91 17-Jul-91 18-Jul-91 19-Jul-91 20-Jul-91 21-Jul-91 22-Jul-9 1 23-Jul-91
RAINFALL --------
0 0
22 13 0 0 0 0 0 0 0 0
15 0 0 0 0 0 1 0 0 0 0 0 0 0 13 0 0 5 5 5 0 0
' 0 0 0 0 0 0 0 0 0 0 0 0 0 5 1 0 8 3 0 0 0 0 0 0 0 0 7 1 0 5 0 5
PARK ACTIVITIES 1991 Page 5
NUMBER OF BATHERS -----------
20 20 0
2 0 20 100 300 2 0 40 3 0 2 5 5 0 10
4070 80 0 0 15
175 3 5 75 9 0 10 5 0 5
2 0 20 0 0
5 0 7 0 12 5 100 5 0 4 0
250 250 5 0 5 0 5 0 30 20 200 35 40 5 0 10 40
200 10 3 0 20 2 0 50 40
250 75 100 80 100 175 2 00 225 125 100
TOTAL ATTENDANCE
- ---------- 100 100 85 50 100 300 500 50 60 50 6 0 100 200
GRASS CUTI'ING ------- N N Y Y Y Y N N N Y Y N N Y N N Y Y N Y Y N N Y Y Y Y N N N Y Y Y Y N N N N Y Y Y N N N Y YF Y Y Y N N Y Y Y Y
Y N Y Y Y Y Y N N Y Y
SAND RAKING ------ N .N N N N N N N N N N N N N N N N N N N N N N N N N N Y N N N N N N N N N N N N Y N N N N N Y Y N N N N N Y N N N N N N Y N N N N N
NEW SAND ---- N N N N N N N N N N N N N N N N N N N N N N N N N N N N N N N N N N N N N N N N N N N N N N N N N N N N N N N N N N N N N N N N N N
WASBROOM LINE-UP -------- N N' N N N N N N N N N N N N N N N N Y N N N Y N N N N N N N N N N N N N Y Y N N N N N Y N N N N N Y N N N N N N Y N N N N N Y Y N N

7-Feb-92 PARX ACTIVITIES 1991 Page 6
PARX ------------- Mille Roches Mille Roches Mille Roches Mille Roches Mille Roches Hille Roches Mille Roches Mille Roches Mille Roches Mille Roches nille Roches Hille Roches Mille Rochee Mille Roches Mille Roches Mille Roches Mille Roches Mille Roches Mille Roches Mille Roches Mille Roches Mille Roches Mille Roches Mille Roches Mille Roches
. Mille Roches Mille Roches Mille Roches Mille Roches Mille Roches Mille Roches Mille Roches Mille Roches Mille Roches Mille Roches Mille Roches Mille Roches Mille Roches Mille Roches Woodlands Woodlands Woodlands Woodlands Wood lands Woodlands Woodlanda Woodlands Woodlands Woodlands Woodlands Woodlands Woodlands Woodlands Woodlands Woodlands Wood lands Woodlands Woodlands Woodlands Woodlanda Woodlands Woodlands Woodlands Woodlands Woodlands Woodlands
DATE '
--------- 24-Jul-91 25-Jul-91 26-Jul-91 27-Jul-9 1 28-Jul-91 29-Jul-91 30-Jul-9 1 31-Jul-91 1-Aug-91 2-Aug-91 3-Aug-9 1 4-Aug-9 1 5-Aug-9 1 6-Aug-91 7-Aug-9 1 8-Aug-91 9 -Aug-9 1 10-Aug-9 1 11-Aug-91 12-Aug-91 13-Aug-9 1 14-Aug-9 1 15-Aug-91 16-Aug-9 1 17-Aug-9 1 18-Aug-9 1 19-Aug-91 20-Aug-9 1 2 1-Aug-9 1 22-Aug-91 23-Aug-9 1 24-Aug:gl 2 5-Aug-9 1 26-Aug-91 27-Aug-9 1 28-Aug-91 29-Aug-91 30-Aug-91 31-Aug-91 1-Jun-91 2-Jun-91 3- Jun-9 1 4-Jun-91 5-Jun-91 6-Jun-91 7-Jun-91 8-Jun-91 9 - Jun-9 1 10-Jun-91 11-Jun-91 12 -Jun-9 1 13-Jun-91 14-Jun-91 15-Jun-91 16-Jun-91 17-Jun-91 18-Jun-91 19-Jun-9 1 20-Jun-91 2 1-Jun-9 1 22-Jun-91 23-Jun-9 1 2 4-Jun-9 1 25-Jun-91 26-Jun-91 27-Jun-9 1
RAINF'ALL --------
1 0 0 0 0 0 0 14 1 0 0 0 2 1 1 0
0 0
12 8 4 0 0 0 0 5 6 3 0 15 15 3 0 0 0
0 0 0 0 18 0 0 0 0 0 0 0 0 0 0 0 0 0
28 0 0 5 3 0 0 0 0 0 0 0 0 0
NUMBER OF BATHERS ------------
40 100 5 0 100 200 2 5 5 0 20 40 5 0 175 3 0 10 40 5 0 20 10 1
3 0 40 4 0 30 20 4 0 2 5 20 0 15 0 10 2 5 3 0 100 10 15 10 10 2 5
TOTAL ATTENDANCE ----------
GRASS CUTTING ------- Y Y N N N N N Y
Y . N N N Y Y Y Y N N N N N Y Y N N N Y Y N N N N N N N N N N N Y N N N Y N Y Y Y N N N N N N N N N
b
N N Y Y N N N Y Y
SAND RAKING ------ N Y N N N N N N Y N N N N N N N N N N N N N Y Y N N N N N N Y N N N N N N N N N N N N N N N N N N N N Y N N Y N N N N N N N N N N N
NEW SAND ---- N N N N N N N N N N N N N N N N N N N N N N N N N N N N N N N N N N N N N N N N N N N N N N N N N N N N N N N N N N N N N N N N N N
WASHROOM LINE-UP -------- N N N Y Y N N N N Y Y N N N N N N N N N N N N N N N N N N N N N N N N N N N N N N N N N Y N N N N N N N N N N N N N N N N N Y N N N
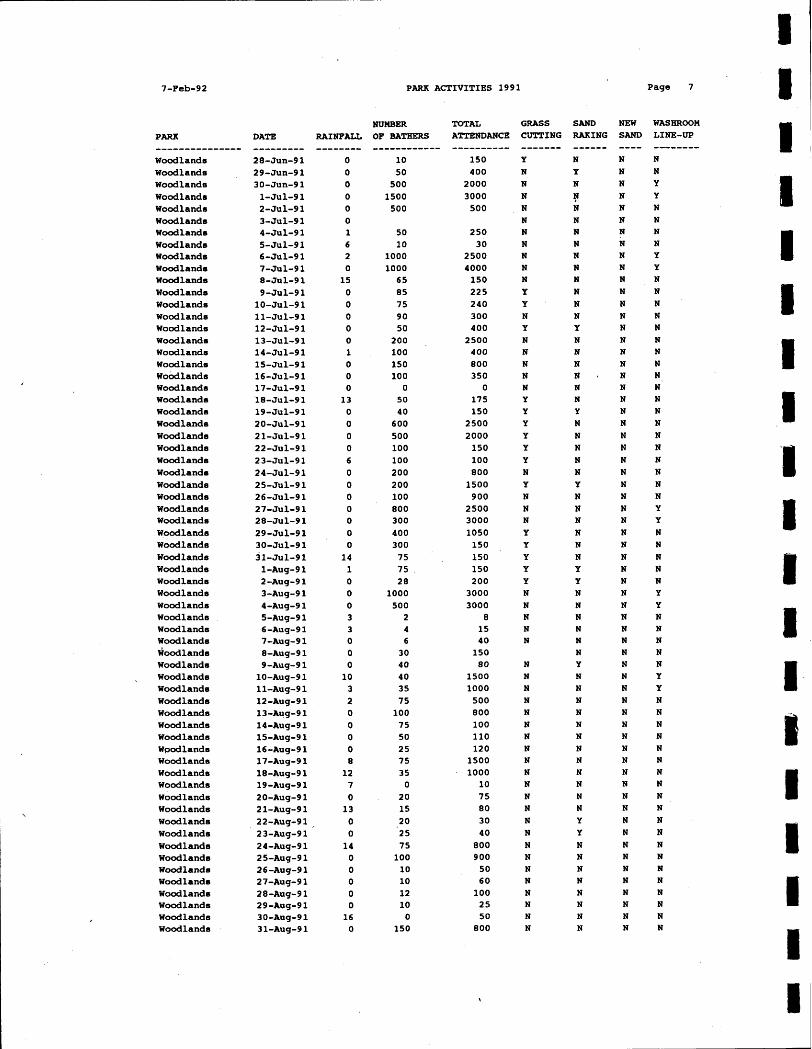
PARK --------------- Woodlands Woodlands Woodlands Woodlands Woodlands Woodlands Woodlands Woodlands Woodlands Woodlands Woodlands Woodlands Woodlands Woodlands Woodlands Woodlands Woodlands Woodlands ~obdlands Woodlands Woodlands Woodlands Woodlands Woodlands Woodlands Woodlands Woodlands Woodlands Woodlands Woodlands Woodlands Woodlands Woodlands Woodlands Woodlands Woodlands Woodlands Woodlands Woodlands Woodlands Woodlands woodlands Woodlands
, Woodlands Woodlands Woodlands Woodlands Woodlands Woodlands Wpodlands Woodlands Woodlands Woodlands Woodlands Woodlands Woodlands Woodlands Woodlands Woodlands Woodlands Woodlands Woodlands Woodlands Woodlands Woodlands
DATE --------- 28-Jun-9 1 29-Jun-91 30-Jun-9 1 1-Jul-9 1 2-Jul-91 3-Jul-91 4-Jul-91 5-Jul-91 6-Jul-91 7-Jul-91 8-Jul-91 9-Jul-91 10-Jul-9 1 11-Jul-91 12-Jul-91 13-Jul-91 14-Jul-91 15-Jul-91 16-Jul-9 1 17-Jul-91 18-Jul-9 1 19-Jul-91 20-Jul-91 21-Jul-91 22-Jul-91 23-Jul-91 24-Jul-91 25-Jul-91 26-Jul-91 27-Jul-9 1 28-Jul-91 29-Jul-91 30-Jul-9 1 31-~~1-91 1-Aug-9 1 2-Aug-91 3-Aug-9 1 4-Aug-9 1 5-Aug-9 1 6-Aug-91 7-Aug-91 8-Aug-9 1 9-Aug-9 1 10-Aug-9 1 11-Aug-9 1 12-Aug-91 13-Aug-9 1 14-Aug-9 1 15-Aug-9 1 16-Aug-9 1 17-Aug-9 1 18-Aug-9 1 19-Aug-9 1 20-Aug-9 1 2 1-Aug-9 1 22-Aug-91 23-Aug-91 24-Aug-91 25-Aug-9 1 26-Aug-91 27-Aug-91 28-Aug-91 29-Aug-91 30-Aug-9 1 31-Aug-91
RAINFALL -------- 0 0 0 0 0 0 1 6 2 0 15 0 0 0 0 0 1 0 0 0 13 0 0 0 0 6 0 0 0 0 0 0 0 14 1 0 0 0 3 3 0 0 0 10 3 2 0 0 0 0 8 12 7 0 13 0 0 14 0 0 0 0 0 16 0
PARK ACTIVITIES 1991
NUMBER OF BATHERS -----------
10 5 0
500 1500 500
GRASS CUTTING ------- Y N N N N N N N N N N Y Y N Y N N N N N Y Y Y Y Y Y N Y N N N Y Y Y Y Y N N N N N
SAND RAKING
NEW SAND ---- N N N N N N N N N N N N N N N N N N N N N N N N N N N N N N N N N N N N N N N N N N N N N N N N N N N
N N N N N N N N N N N N N N
WASHROOM LINE-UP ------- N N Y Y N N N N Y Y N N N N N N N N N N N N N N N N N N N Y Y N N N N N Y Y N N N N N Y Y N N N N N N N N N N N N N N N N N N N N


