Department of Mechanical Engineering National Institute of Technology, Agartala RAJDEEP BANIK. Enrollment:- 14PME021 Optimization of process parameters for Friction Stir Welding of AA6061 and AA7075 alloys Under the guidance of Dr. Subrata Kumar Ghosh & Mr. Barnik Saha Roy For the award of degree of Master of Technology
Transcript
Department of Mechanical Engineering
National Institute of Technology, Agartala
RAJDEEP BANIK.
Enrollment:- 14PME021
Optimization of process parameters for Friction Stir Welding of AA6061 and AA7075 alloys
Under the guidance of Dr. Subrata Kumar Ghosh & Mr. Barnik Saha Roy
For the award of degree
of
Master of Technology
OUTLINE
1. Introduction about FSW.
2. Parameters.
3. Literature survey.
4. Conclusions from review papers.
5. Motivation of work.
6. Objective of present study.
7. Experimental plan.
8. Observations and analysis.
9. Taguchi - Grey Optimization.
10. Conclusions.
11. Future scopes.
12. References.
2
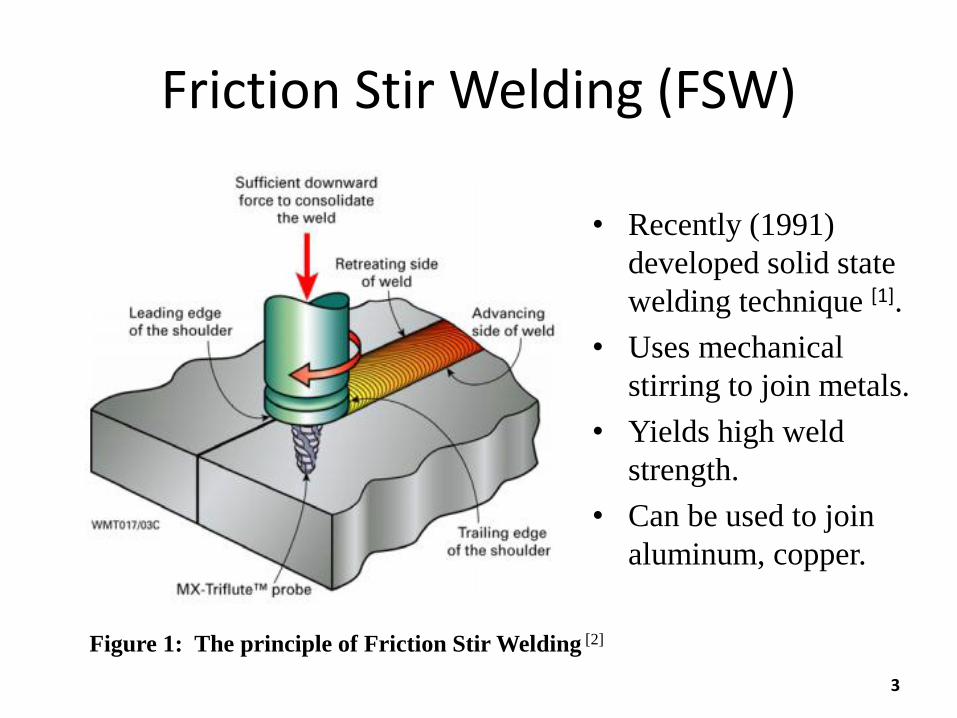
Friction Stir Welding (FSW)
• Recently (1991)
developed solid state
welding technique [1].
• Uses mechanical
stirring to join metals.
• Yields high weld
strength.
• Can be used to join
aluminum, copper.
3
Figure 1: The principle of Friction Stir Welding [2]
Parameters
• Tool rotation speed
• Tool Traverse speed
• Plate position
• Tilt angle
• Surface roughness
4
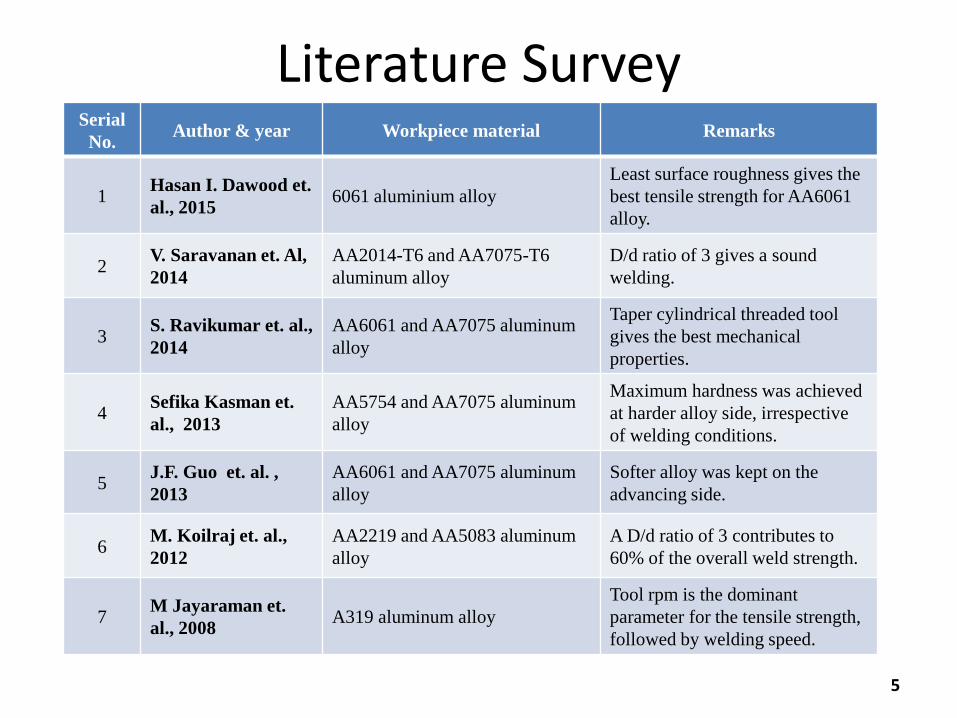
Literature Survey
5
Serial
No. Author & year Workpiece material Remarks
1 Hasan I. Dawood et.
al., 2015 6061 aluminium alloy
Least surface roughness gives the
best tensile strength for AA6061
alloy.
2 V. Saravanan et. Al,
2014
AA2014-T6 and AA7075-T6
aluminum alloy
D/d ratio of 3 gives a sound
welding.
3 S. Ravikumar et. al.,
2014
AA6061 and AA7075 aluminum
alloy
Taper cylindrical threaded tool
gives the best mechanical
properties.
4 Sefika Kasman et.
al., 2013
AA5754 and AA7075 aluminum
alloy
Maximum hardness was achieved
at harder alloy side, irrespective
of welding conditions.
5 J.F. Guo et. al. ,
2013
AA6061 and AA7075 aluminum
alloy
Softer alloy was kept on the
advancing side.
6 M. Koilraj et. al.,
2012
AA2219 and AA5083 aluminum
alloy
A D/d ratio of 3 contributes to
60% of the overall weld strength.
7 M Jayaraman et.
al., 2008 A319 aluminum alloy
Tool rpm is the dominant
parameter for the tensile strength,
followed by welding speed.
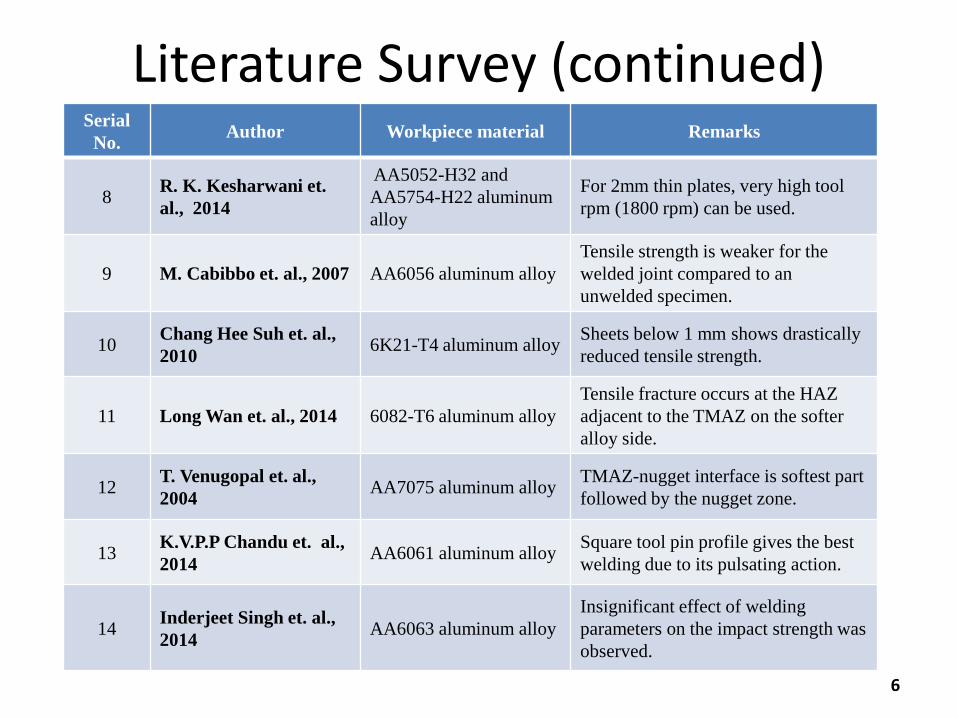
Literature Survey (continued)
6
Serial
No. Author Workpiece material Remarks
8 R. K. Kesharwani et.
al., 2014
AA5052-H32 and
AA5754-H22 aluminum
alloy
For 2mm thin plates, very high tool
rpm (1800 rpm) can be used.
9 M. Cabibbo et. al., 2007 AA6056 aluminum alloy
Tensile strength is weaker for the
welded joint compared to an
unwelded specimen.
10 Chang Hee Suh et. al.,
2010 6K21-T4 aluminum alloy
Sheets below 1 mm shows drastically
reduced tensile strength.
11 Long Wan et. al., 2014 6082-T6 aluminum alloy
Tensile fracture occurs at the HAZ
adjacent to the TMAZ on the softer
alloy side.
12 T. Venugopal et. al.,
2004 AA7075 aluminum alloy
TMAZ-nugget interface is softest part
followed by the nugget zone.
13 K.V.P.P Chandu et. al.,
2014 AA6061 aluminum alloy
Square tool pin profile gives the best
welding due to its pulsating action.
14 Inderjeet Singh et. al.,
2014 AA6063 aluminum alloy
Insignificant effect of welding
parameters on the impact strength was
observed.
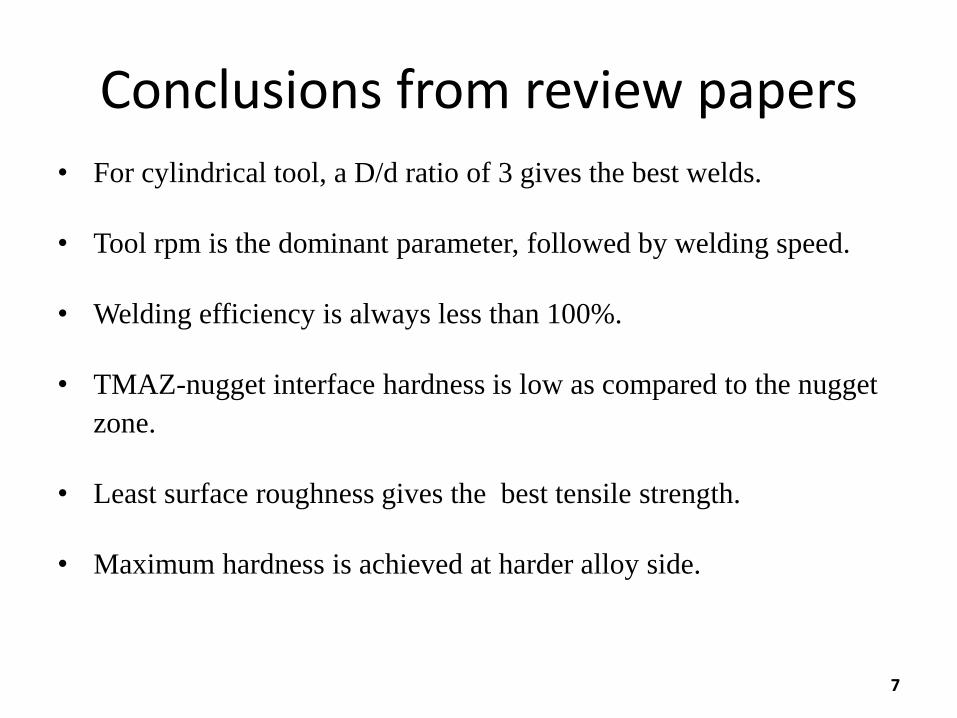
Conclusions from review papers
• For cylindrical tool, a D/d ratio of 3 gives the best welds.
• Tool rpm is the dominant parameter, followed by welding speed.
• Welding efficiency is always less than 100%.
• TMAZ-nugget interface hardness is low as compared to the nugget
zone.
• Least surface roughness gives the best tensile strength.
• Maximum hardness is achieved at harder alloy side.
7
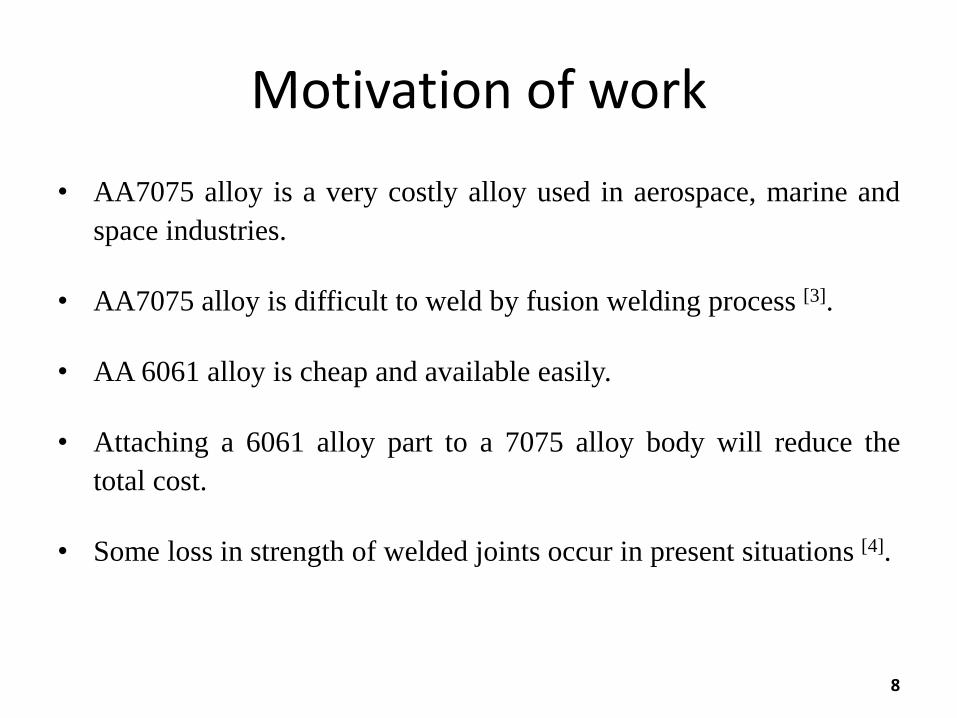
Motivation of work
• AA7075 alloy is a very costly alloy used in aerospace, marine and
space industries.
• AA7075 alloy is difficult to weld by fusion welding process [3].
• AA 6061 alloy is cheap and available easily.
• Attaching a 6061 alloy part to a 7075 alloy body will reduce the
total cost.
• Some loss in strength of welded joints occur in present situations [4].
8
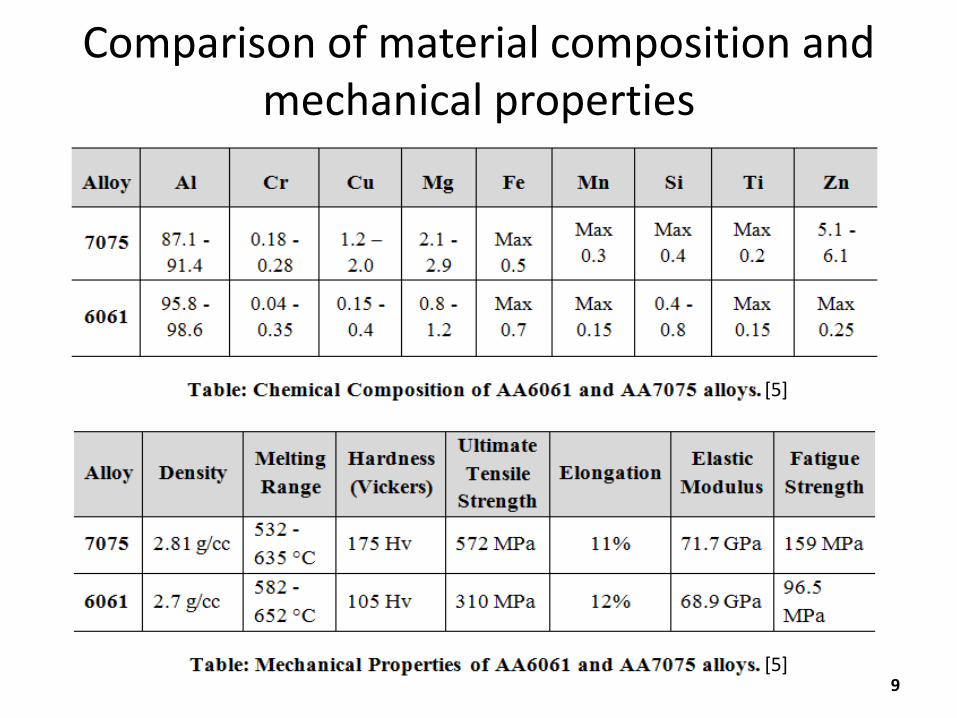
Comparison of material composition and mechanical properties
9
[5]
[5]
Objective of present study
• To weld aluminium alloy 6061 and 7075 by FSW
• To study the effect of process parameters on Ultimate tensile strength of joint (UTS)
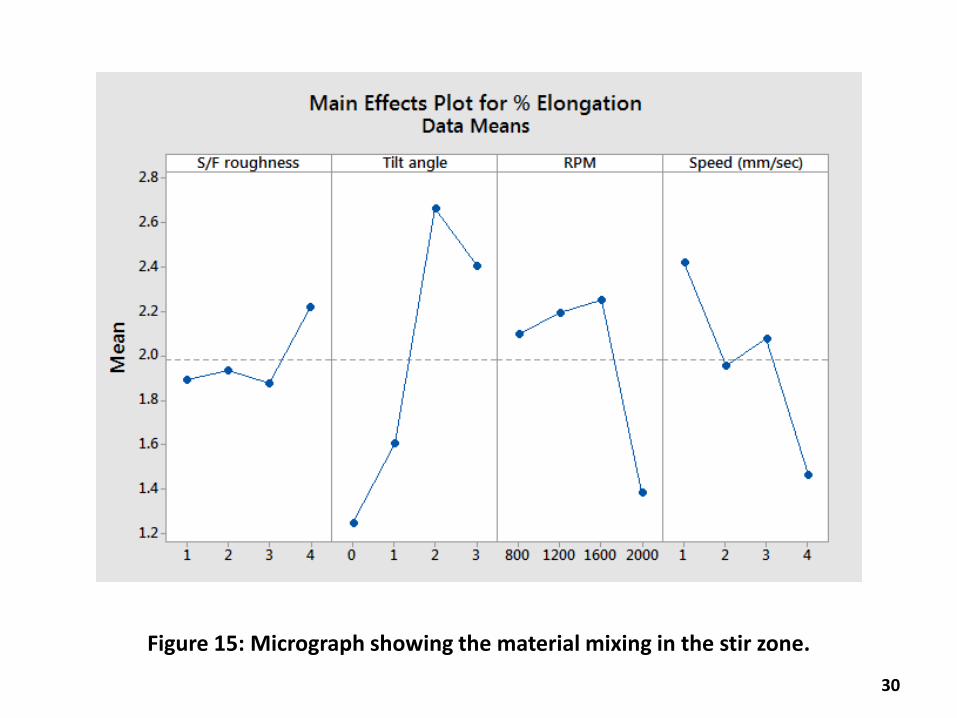
• To study the effect of process parameters on percentage elongation during tensile testing of the joint
• To study the effect of process parameters on Vickers’s microhardness of the joint (HV 0.1)
• To study of the microstructure of the welded joint.
• To develop a mathematical model to predict the mechanical properties of the joint by Regression Analysis using commercial software MINITAB
• To optimize the process parameters using Grey Relational Analysis
• To perform a confirmatory test as per the result obtained from Grey Relational Analysis.
10
Experimental plan
6mm plates of 7075 and 6061 aluminium alloy have been purchased.
The plates have been cut into pieces of 300 X 65 mm.
The cut pieces have been machined into straight edges using the shaper
machine.
Trial experiments have been performed based on the parameters obtained
from literature reviews, and a level for each parameters have been decided
based on the resulting welds.
L16 orthogonal array have been designed taking four parameters each with
four levels.
11
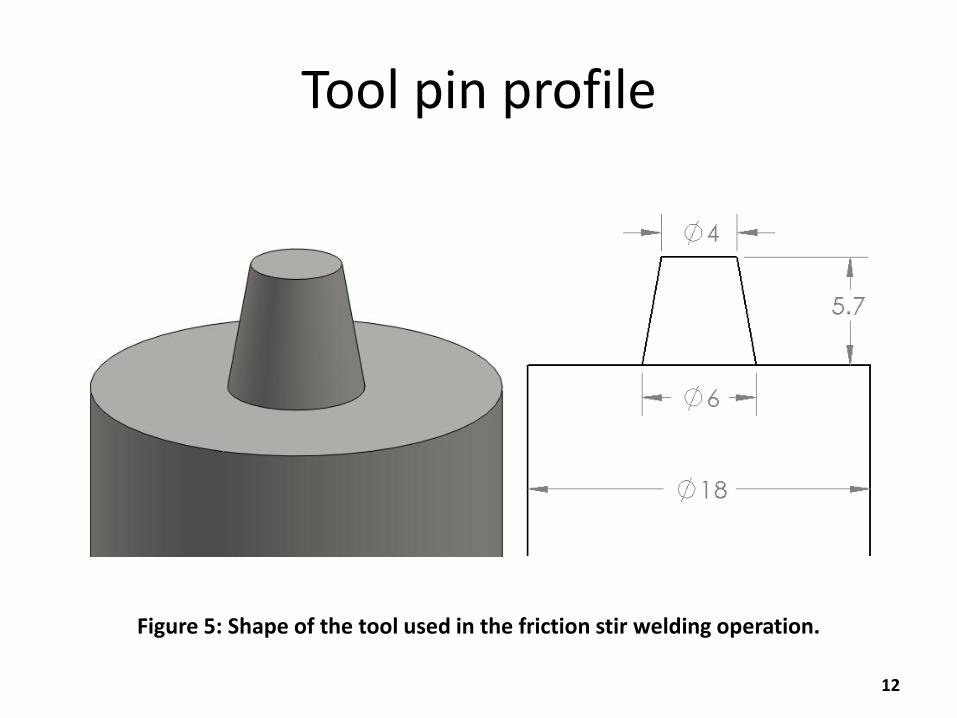
Tool pin profile
12
Figure 5: Shape of the tool used in the friction stir welding operation.
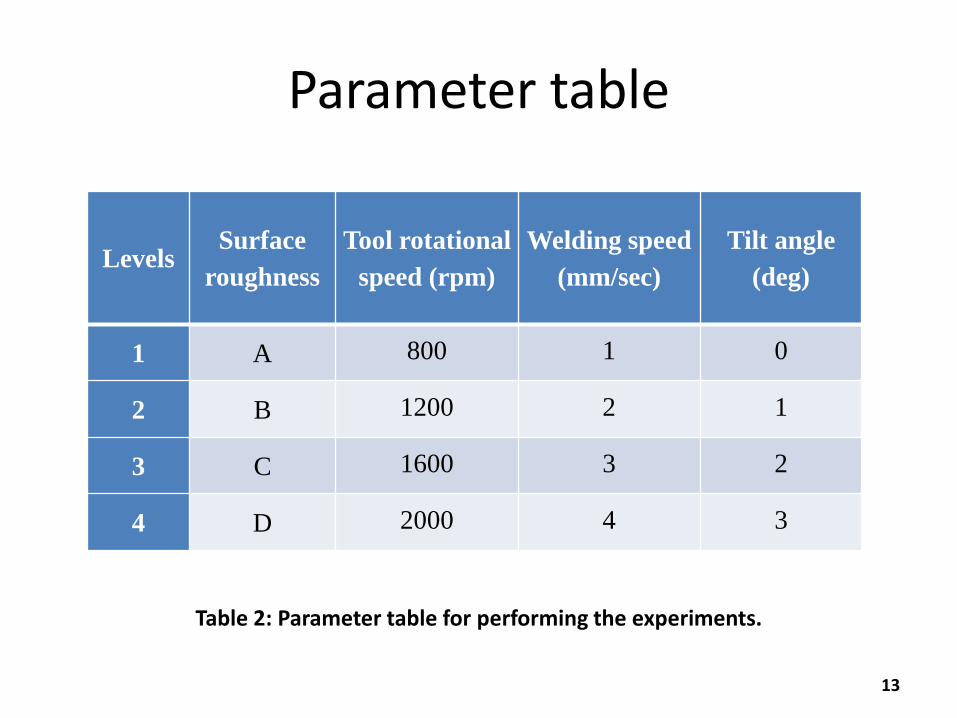
Parameter table
Levels Surface
roughness
Tool rotational
speed (rpm)
Welding speed
(mm/sec)
Tilt angle
(deg)
1 A 800 1 0
2 B 1200 2 1
3 C 1600 3 2
4 D 2000 4 3
13
Table 2: Parameter table for performing the experiments.
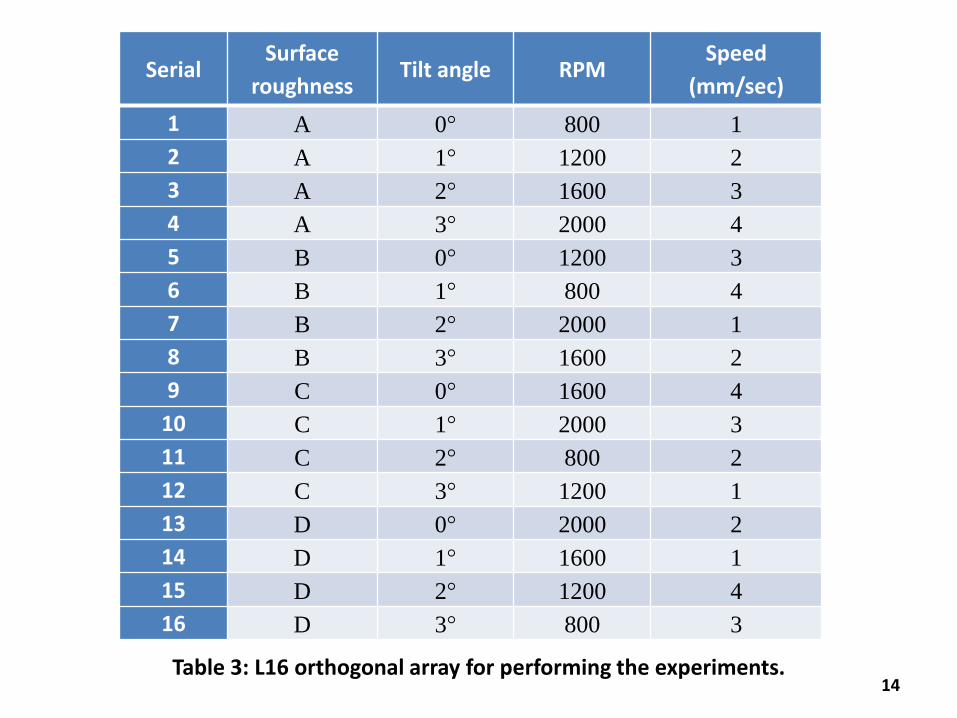
14 Table 3: L16 orthogonal array for performing the experiments.
Serial Surface
roughness Tilt angle RPM
Speed
(mm/sec)
1 A 0° 800 1
2 A 1° 1200 2
3 A 2° 1600 3
4 A 3° 2000 4
5 B 0° 1200 3
6 B 1° 800 4
7 B 2° 2000 1
8 B 3° 1600 2
9 C 0° 1600 4
10 C 1° 2000 3
11 C 2° 800 2
12 C 3° 1200 1
13 D 0° 2000 2
14 D 1° 1600 1
15 D 2° 1200 4
16 D 3° 800 3
Experimental plan (continued)
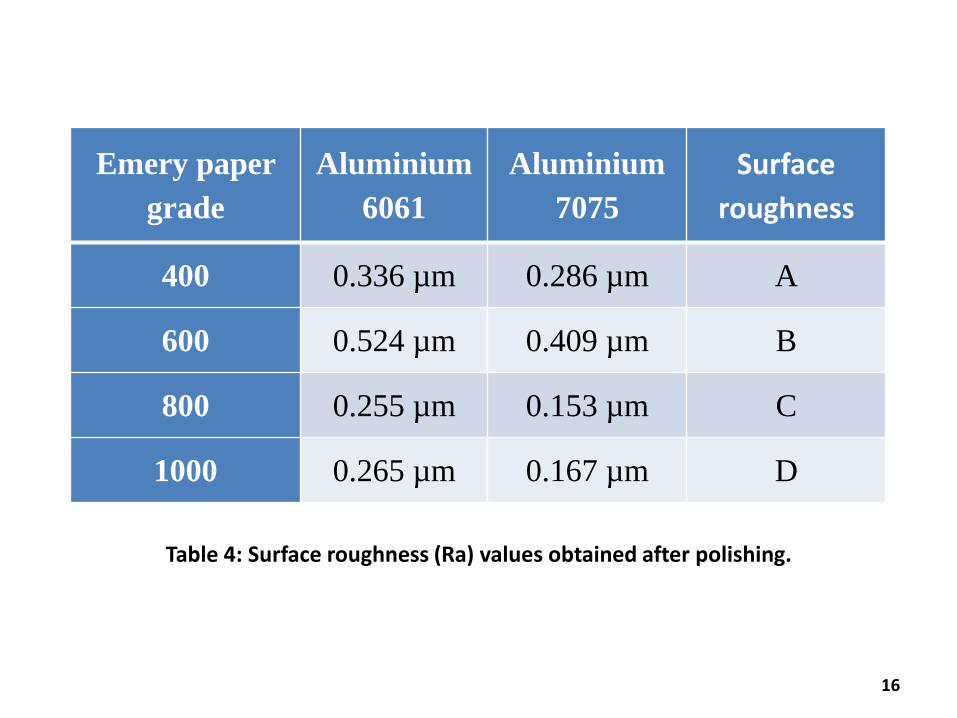
The work pieces have been polished using different grades of emery paper,
viz., 400, 600, 800, 1000, to achieve different levels of surface roughness.
The surface roughness for each workpiece have been measured using the
3D profilometer.
The surface roughness was measured in three areas in each work piece and
then an average value of the ‘Ra’ value have been taken as a parameter.
Welding have been done as per the design of experiments.
Samples for tensile, impact, hardness and microstructure have been cut
from the welded plates.
15
Emery paper
grade
Aluminium
6061
Aluminium
7075
Surface
roughness
400 0.336 µm 0.286 µm A
600 0.524 µm 0.409 µm B
800 0.255 µm 0.153 µm C
1000 0.265 µm 0.167 µm D
16
Table 4: Surface roughness (Ra) values obtained after polishing.
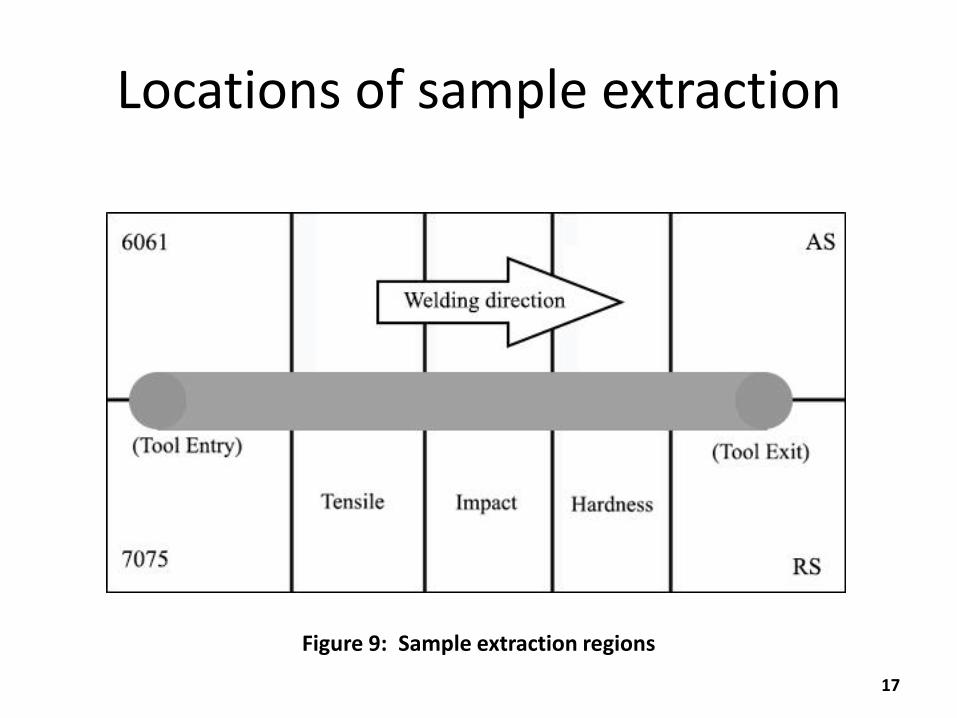
Locations of sample extraction
17
Figure 9: Sample extraction regions
18
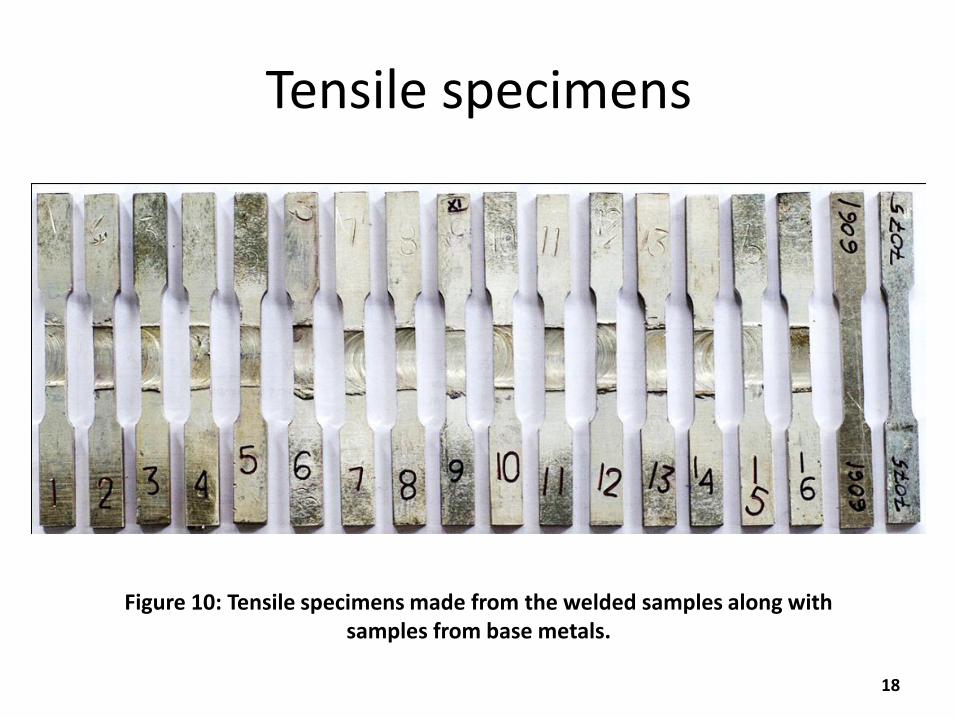
Figure 10: Tensile specimens made from the welded samples along with samples from base metals.
Tensile specimens
19
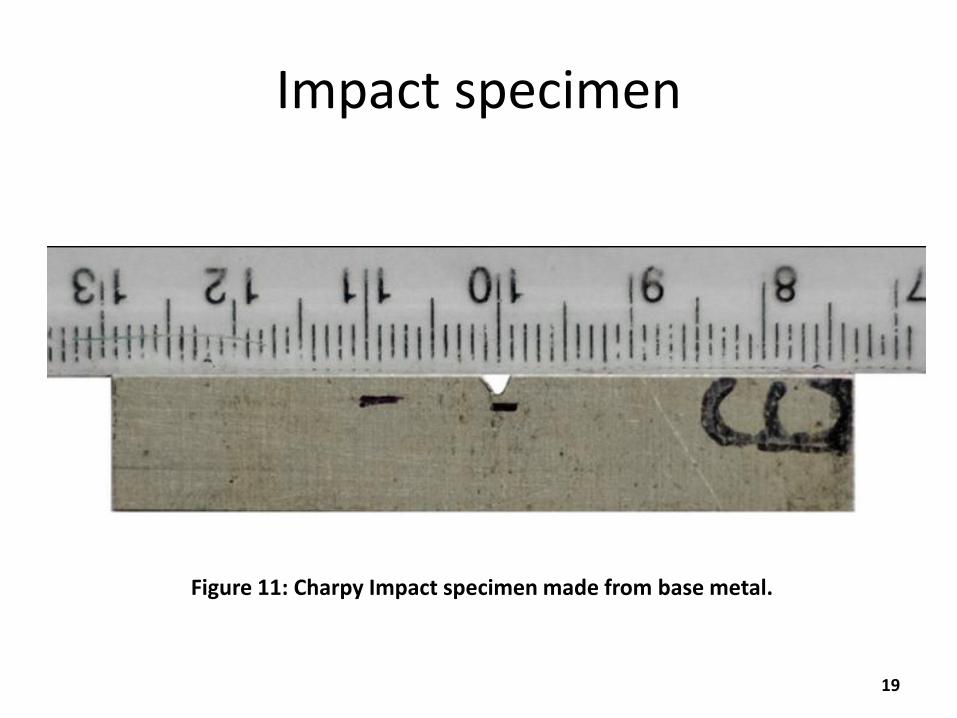
Figure 11: Charpy Impact specimen made from base metal.
Impact specimen
20
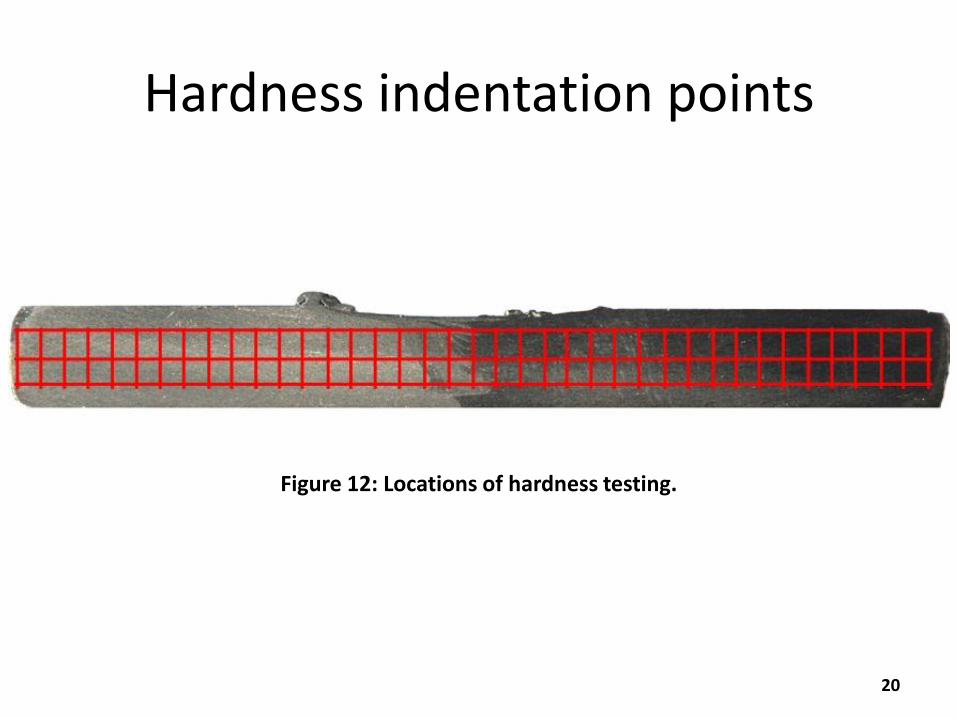
Figure 12: Locations of hardness testing.
Hardness indentation points
21
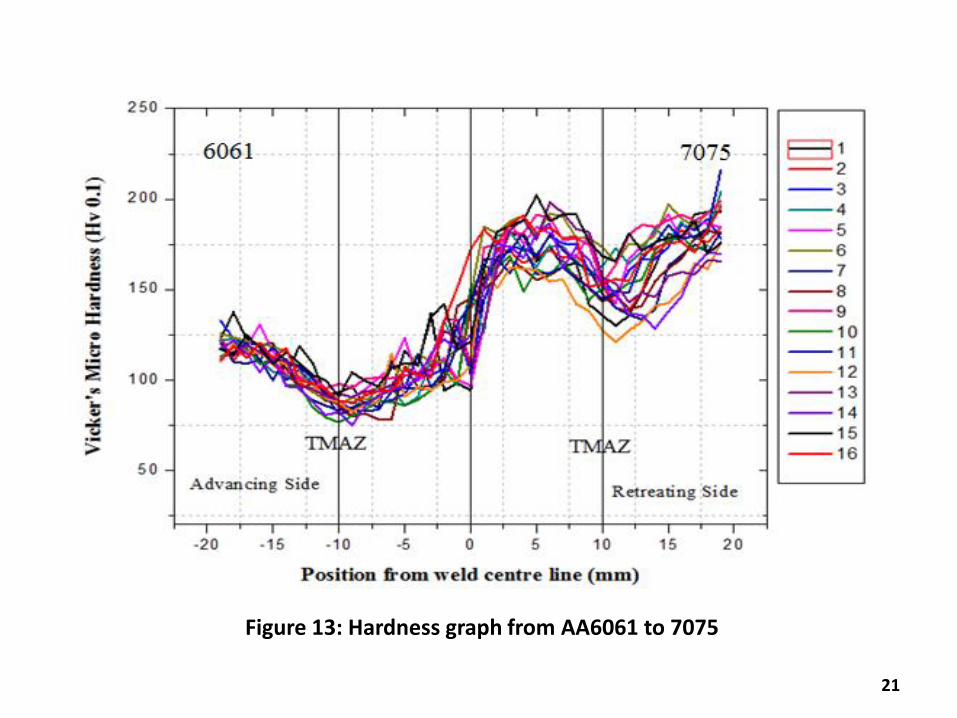
Figure 13: Hardness graph from AA6061 to 7075
OBSERVATION TABLE
Serial no. Surface
roughness
Tilt
angle RPM
Speed
(mm/sec) UTS (MPa)
Percentage
elongation
Hardness
(HV 0.1)
Toughness
(Nm)
1 A 0° 800 1 198.8 1.91 135.80 10
2 A 1° 1200 2 218.66 1.77 133.87 11.5
3 A 2° 1600 3 238.94 2.78 135.687 7.5
4 A 3° 2000 4 194 1.112 138.14 9.5
5 B 0° 1200 3 187.46 1.42 138.35 5.0
6 B 1° 800 4 200.66 1 145.45 7.5
7 B 2° 2000 1 233.06 2.525 130.944 14
8 B 3° 1600 2 241.46 2.8 129.907 11
9 C 0° 1600 4 200 0.96 144.275 4.5
10 C 1° 2000 3 228.8 1.193 128.271 10.5
11 C 2° 800 2 240 2.56 135.394 9
12 C 3° 1200 1 224.26 2.786 124.20 11
13 D 0° 2000 2 160.4 0.7 135.016 9
14 D 1° 1600 1 224.4 2.46 129.705 12.5
15 D 2° 1200 4 240.66 2.79 145.15 10.5
16 D 3° 800 3 239.6 2.925 141.635 8.5
22
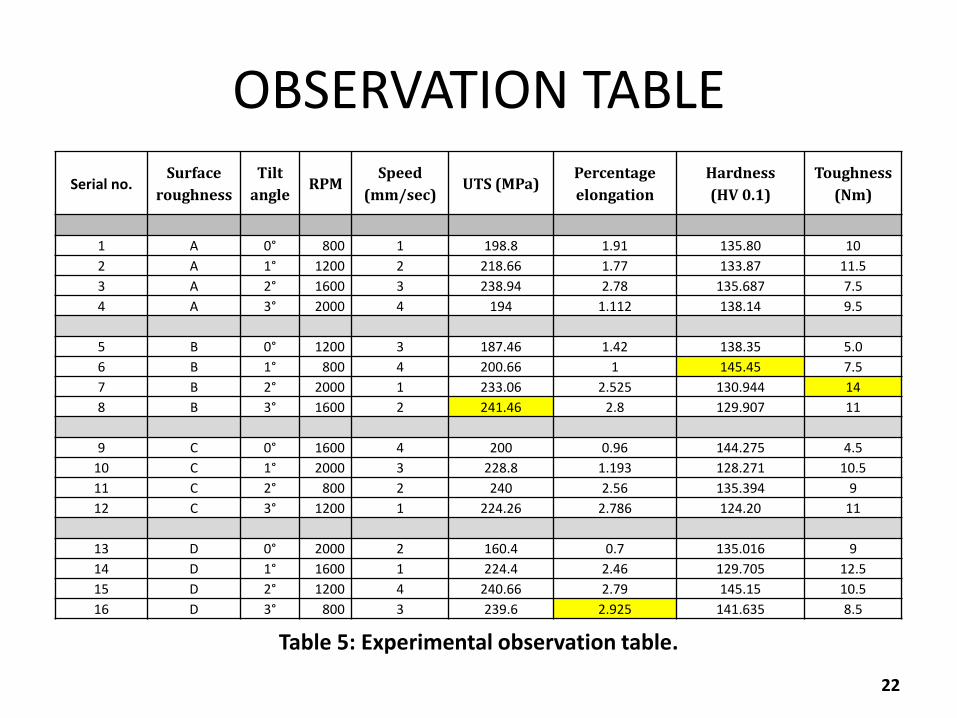
Table 5: Experimental observation table.
Microstructure study
23
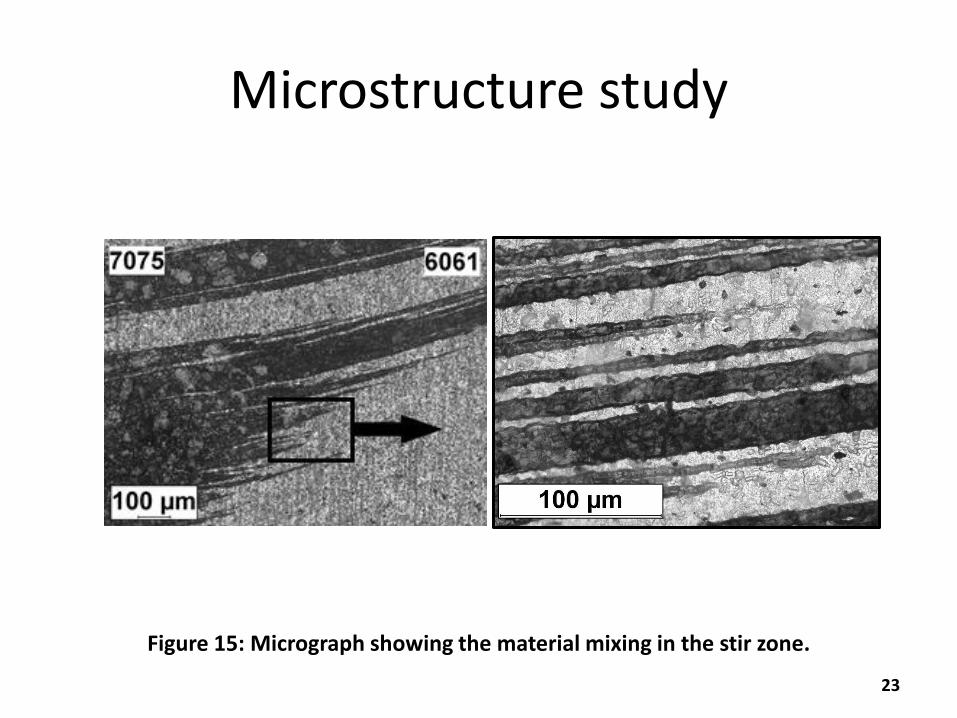
Figure 15: Micrograph showing the material mixing in the stir zone.
24
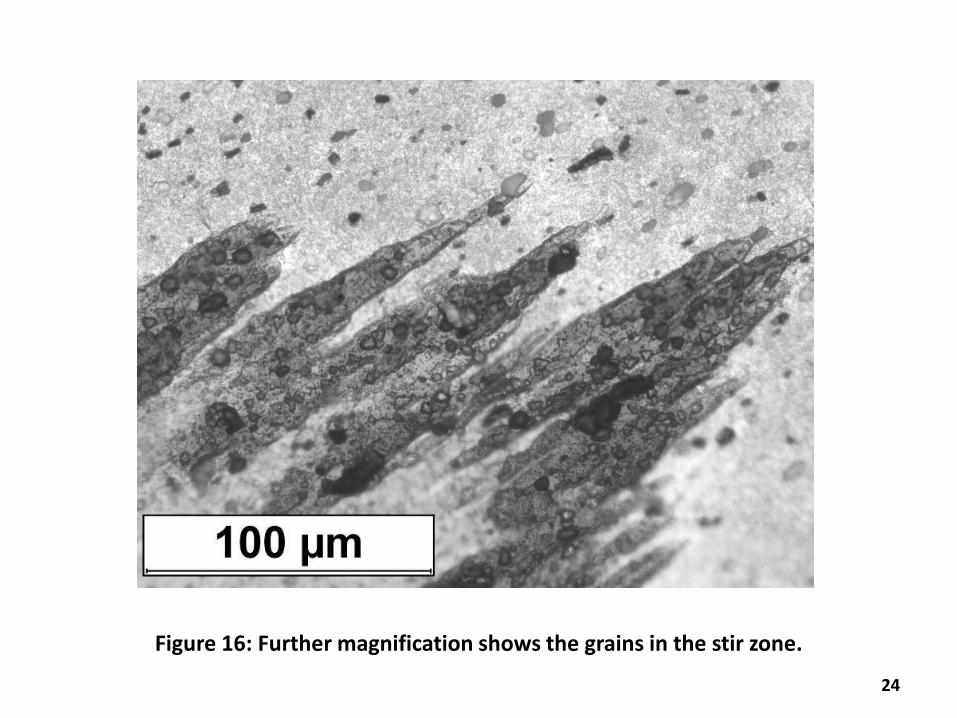
Figure 16: Further magnification shows the grains in the stir zone.
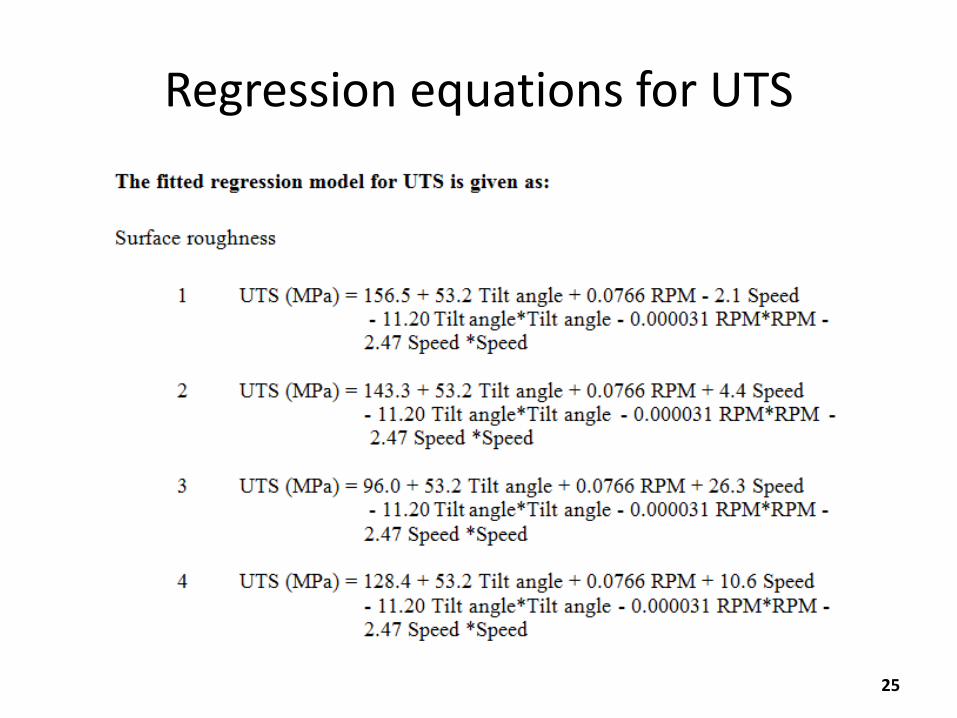
Regression equations for UTS
25
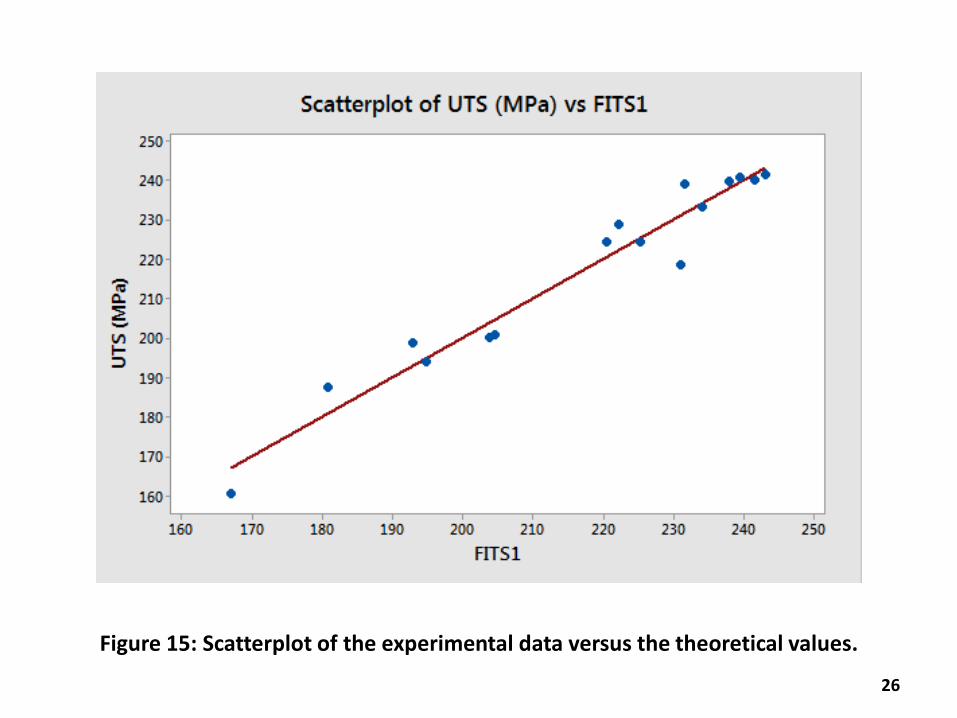
Figure 15: Scatterplot of the experimental data versus the theoretical values.
26
Figure 15: Micrograph showing the material mixing in the stir zone.
27
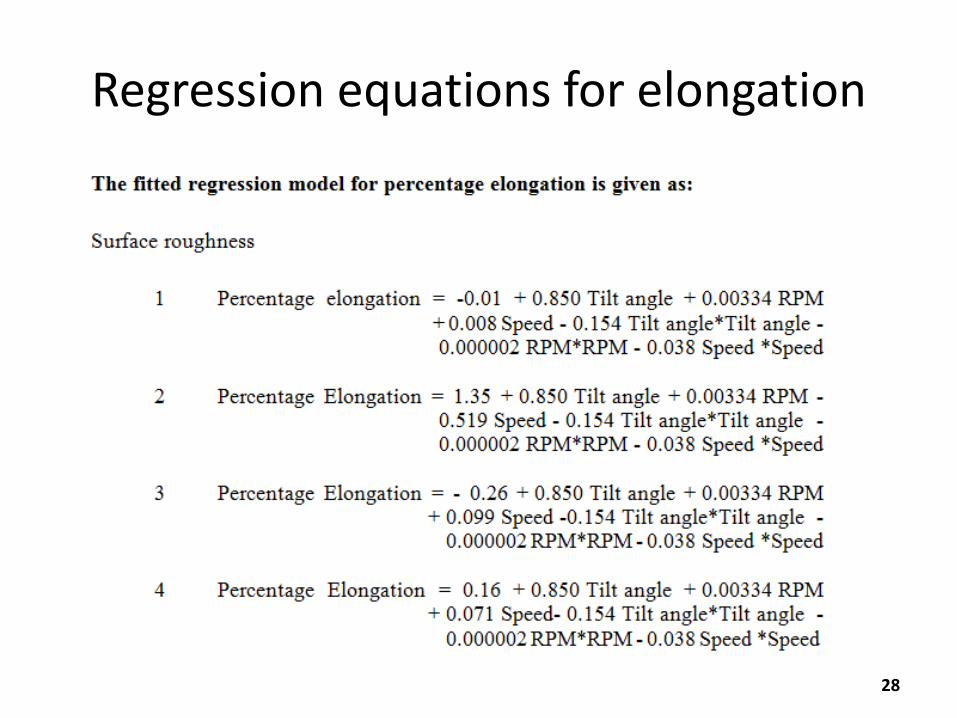
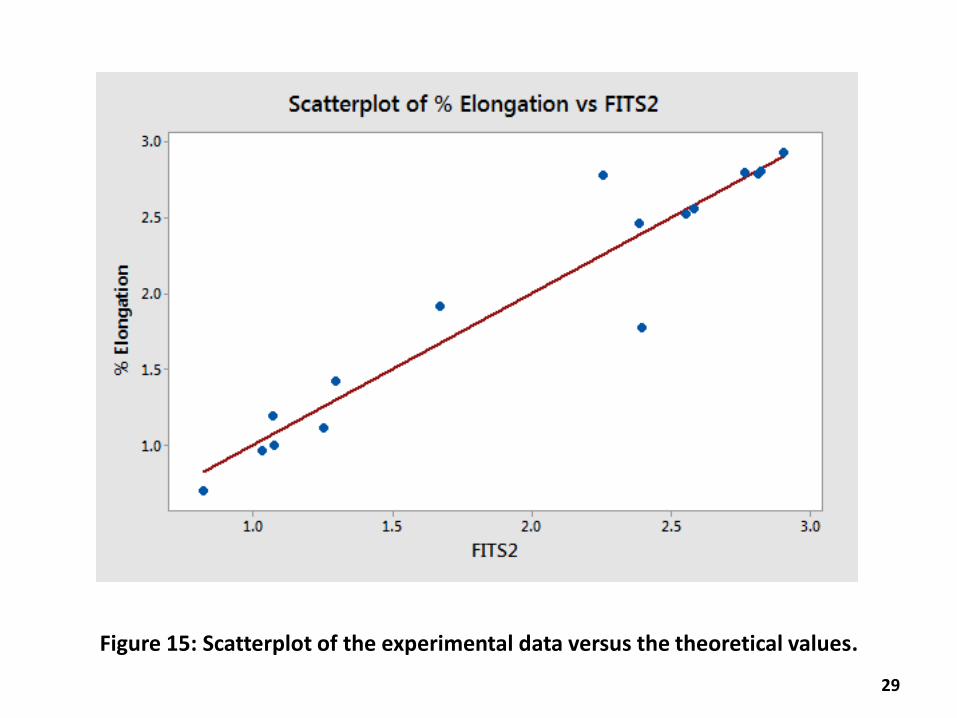
Regression equations for elongation
28
Figure 15: Scatterplot of the experimental data versus the theoretical values.
29
Figure 15: Micrograph showing the material mixing in the stir zone.
30
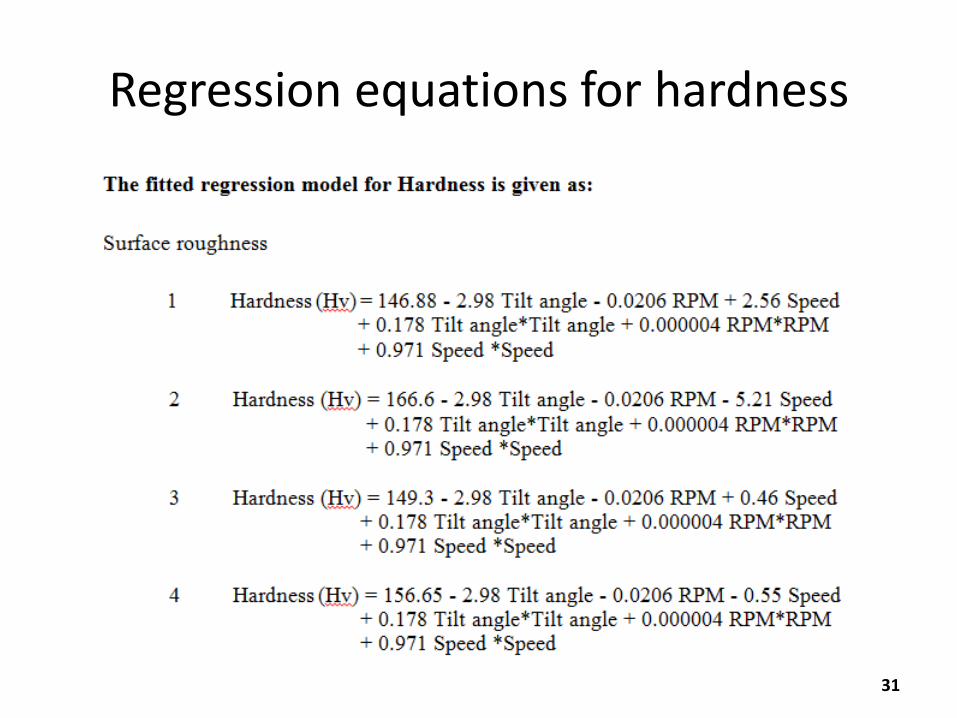
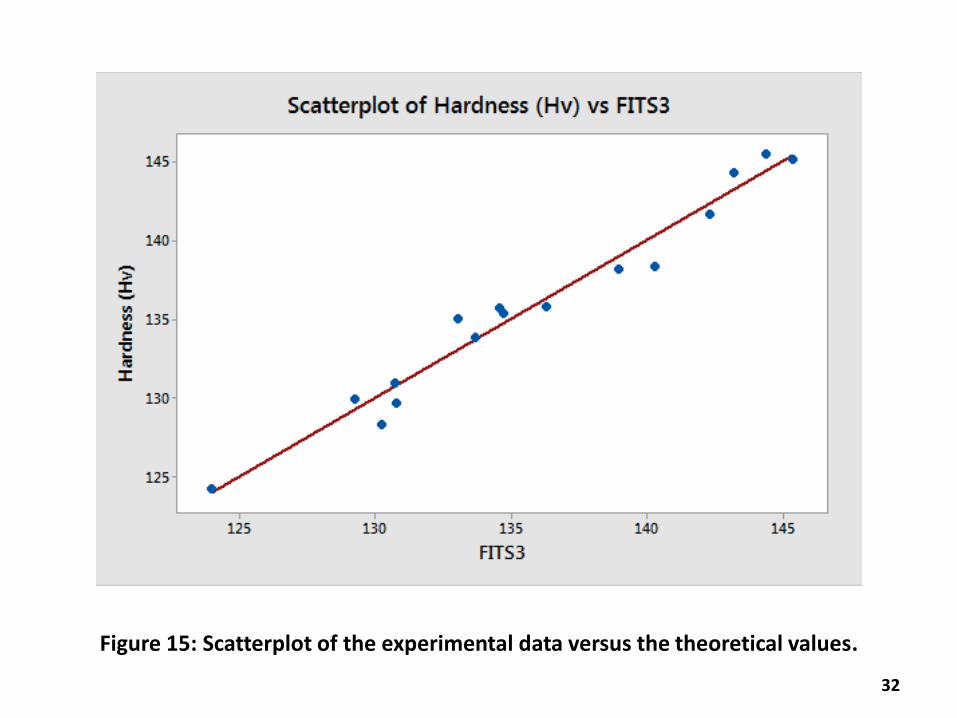
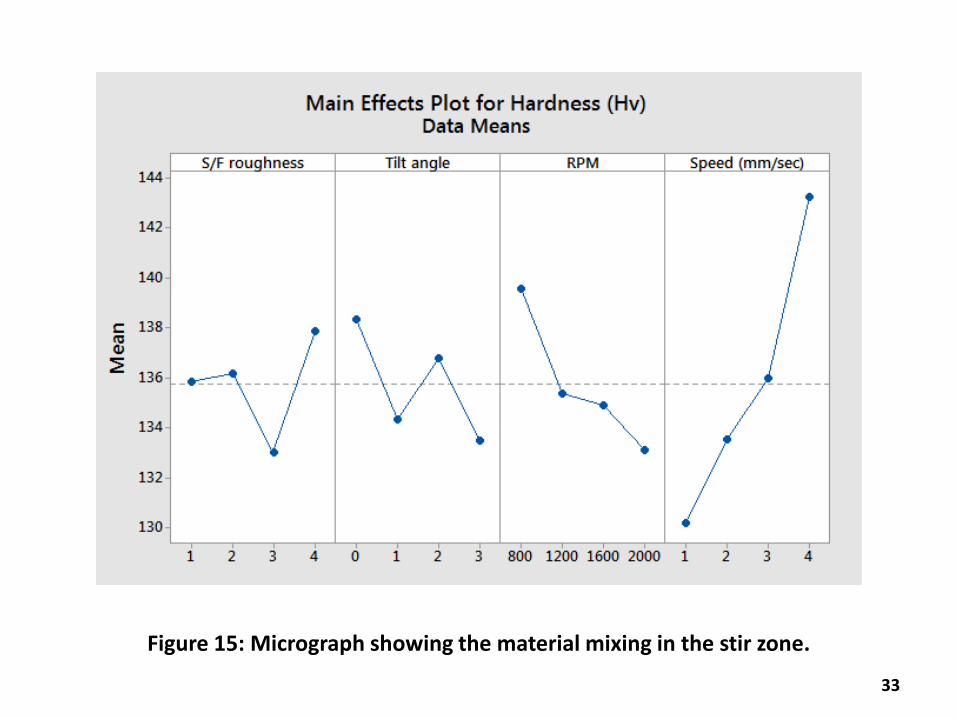
Regression equations for hardness
31
Figure 15: Scatterplot of the experimental data versus the theoretical values.
32
Figure 15: Micrograph showing the material mixing in the stir zone.
33
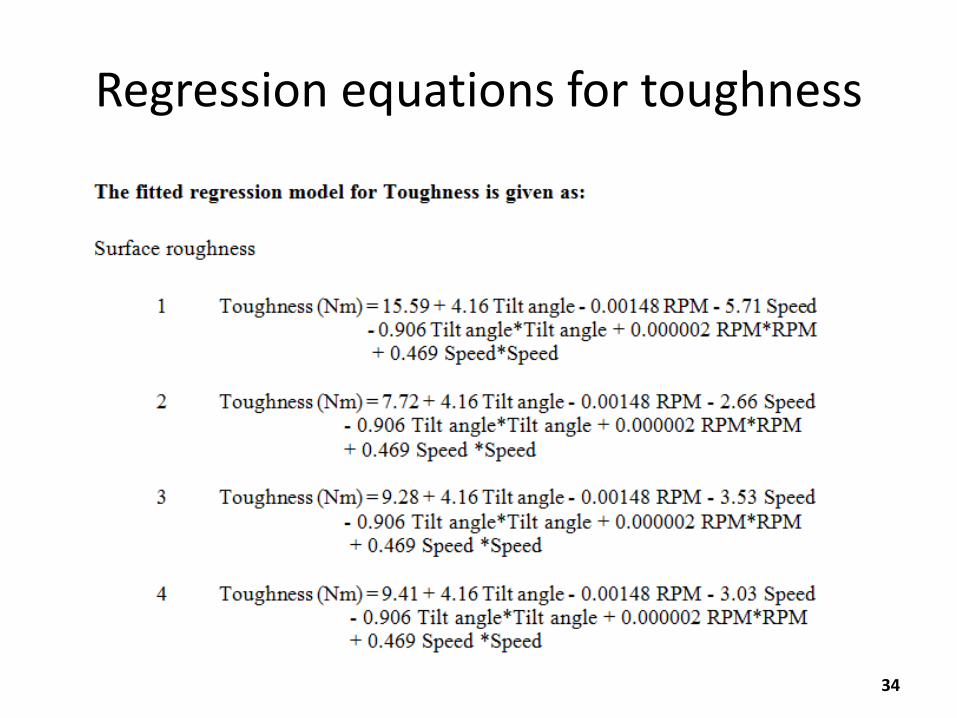
Regression equations for toughness
34
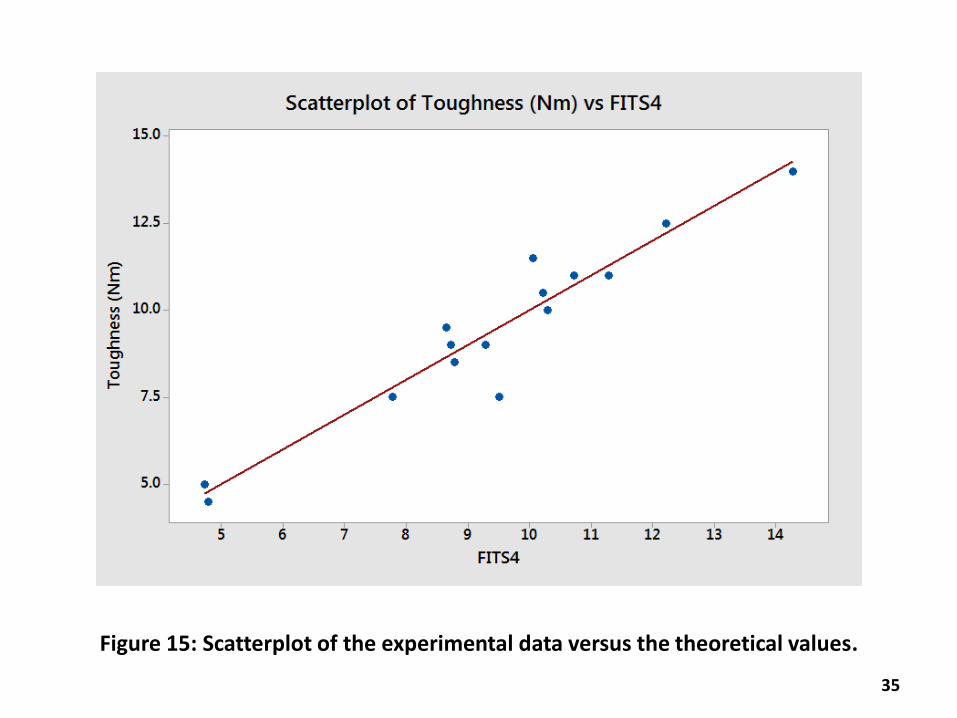
Figure 15: Scatterplot of the experimental data versus the theoretical values.
35
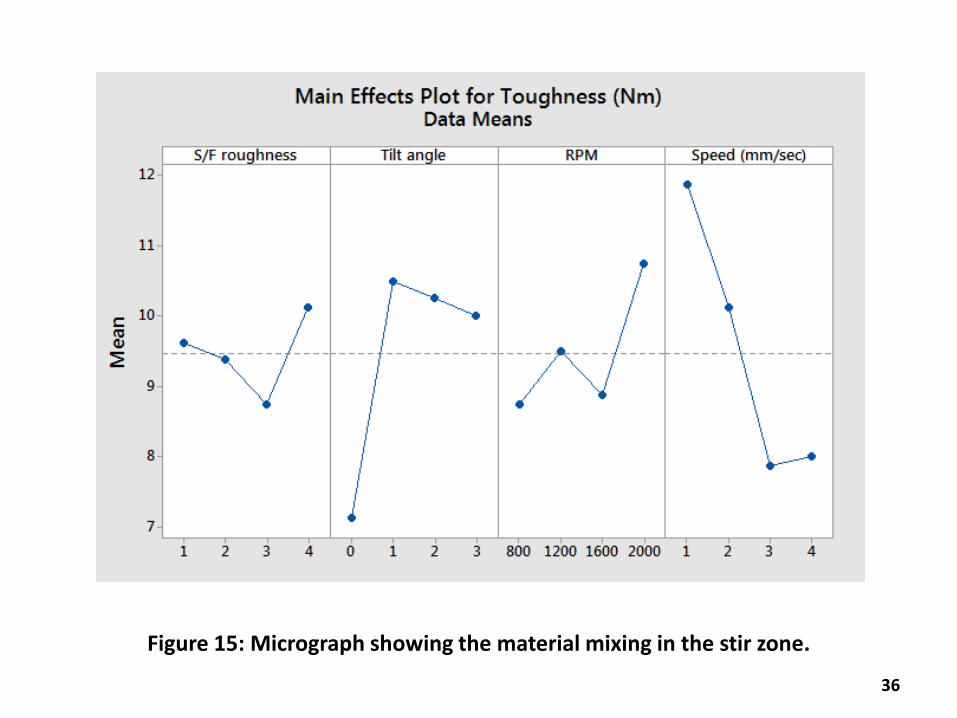
Figure 15: Micrograph showing the material mixing in the stir zone.
36
Taguchi - Grey Optimization
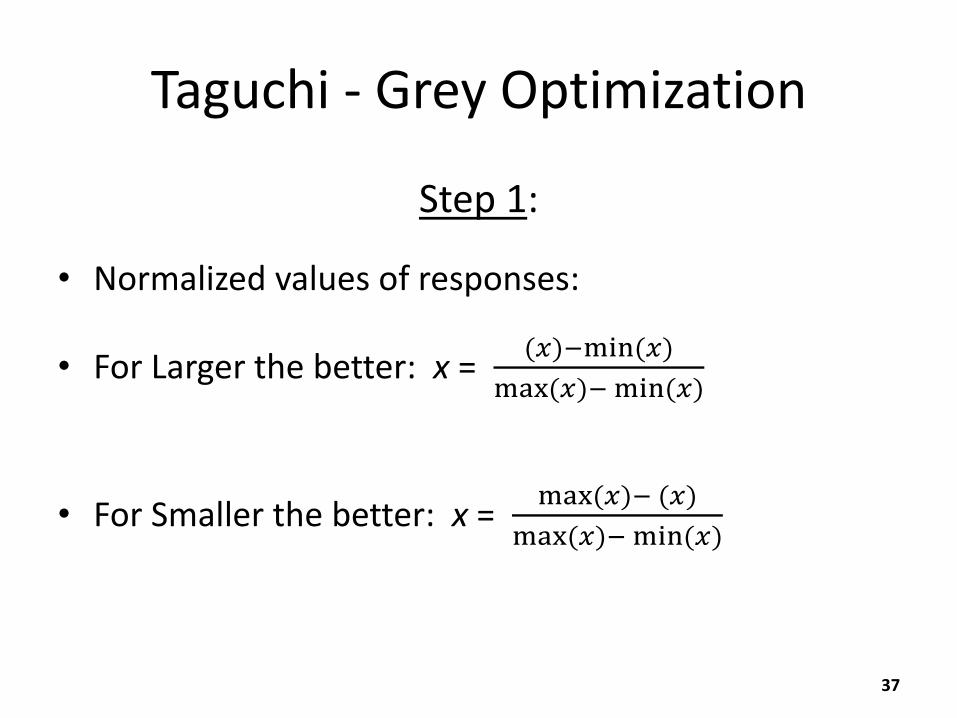
Step 1:
• Normalized values of responses:
• For Larger the better: x = (𝑥)−min(𝑥)
max(𝑥)− min(𝑥)
• For Smaller the better: x = max(𝑥)− (𝑥)
max(𝑥)− min(𝑥)
37
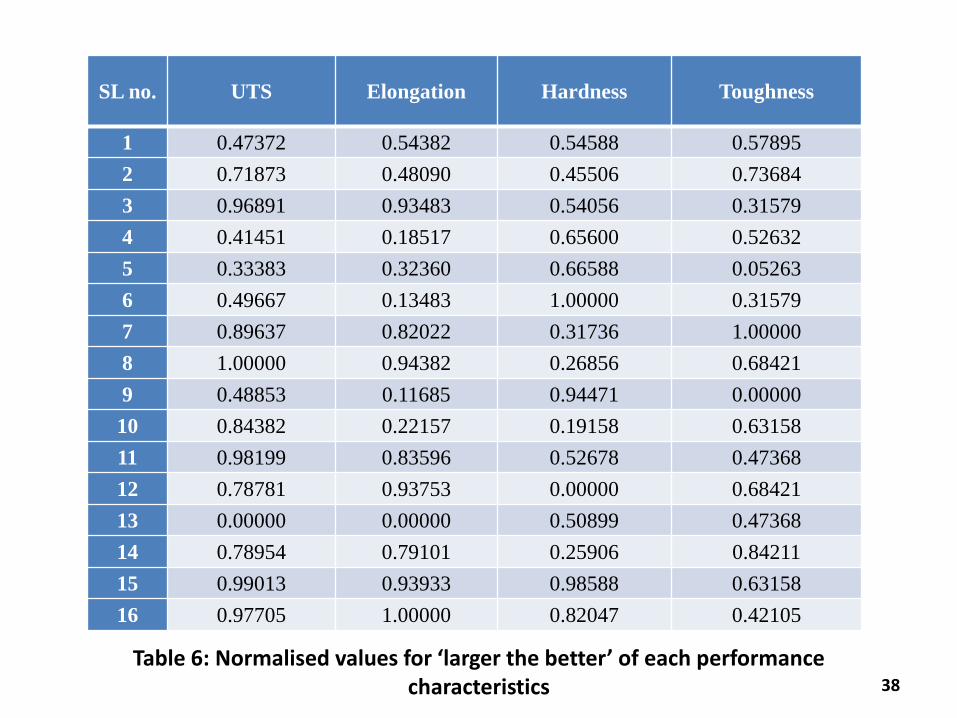
SL no. UTS Elongation Hardness Toughness
1 0.47372 0.54382 0.54588 0.57895
2 0.71873 0.48090 0.45506 0.73684
3 0.96891 0.93483 0.54056 0.31579
4 0.41451 0.18517 0.65600 0.52632
5 0.33383 0.32360 0.66588 0.05263
6 0.49667 0.13483 1.00000 0.31579
7 0.89637 0.82022 0.31736 1.00000
8 1.00000 0.94382 0.26856 0.68421
9 0.48853 0.11685 0.94471 0.00000
10 0.84382 0.22157 0.19158 0.63158
11 0.98199 0.83596 0.52678 0.47368
12 0.78781 0.93753 0.00000 0.68421
13 0.00000 0.00000 0.50899 0.47368
14 0.78954 0.79101 0.25906 0.84211
15 0.99013 0.93933 0.98588 0.63158
16 0.97705 1.00000 0.82047 0.42105
Table 6: Normalised values for ‘larger the better’ of each performance characteristics 38
Taguchi - Grey Optimization
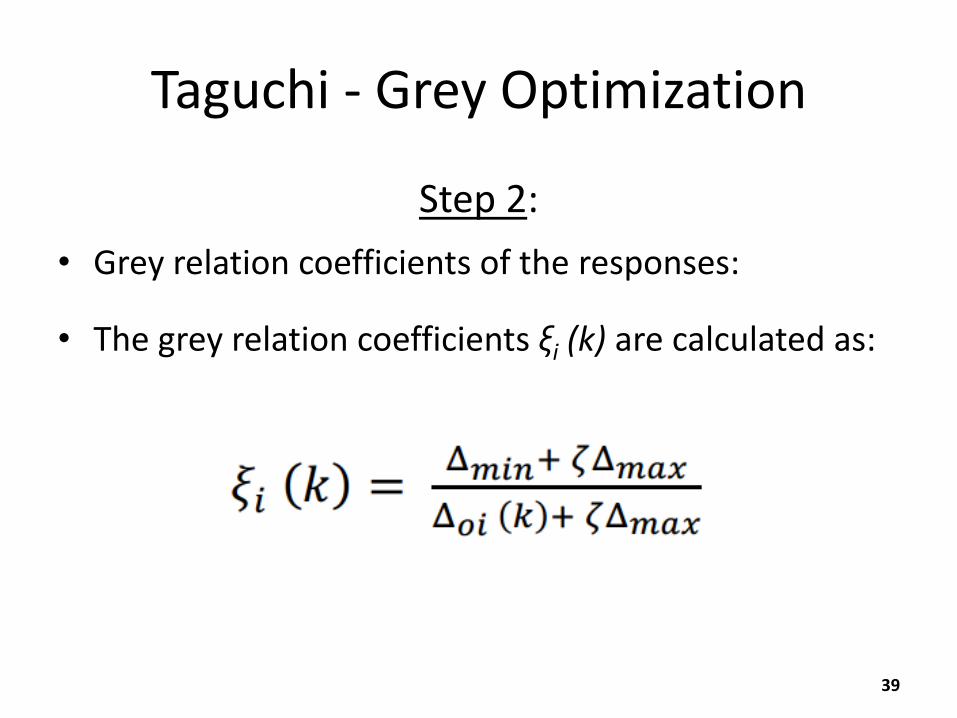
Step 2:
• Grey relation coefficients of the responses:
• The grey relation coefficients ξi (k) are calculated as:
39
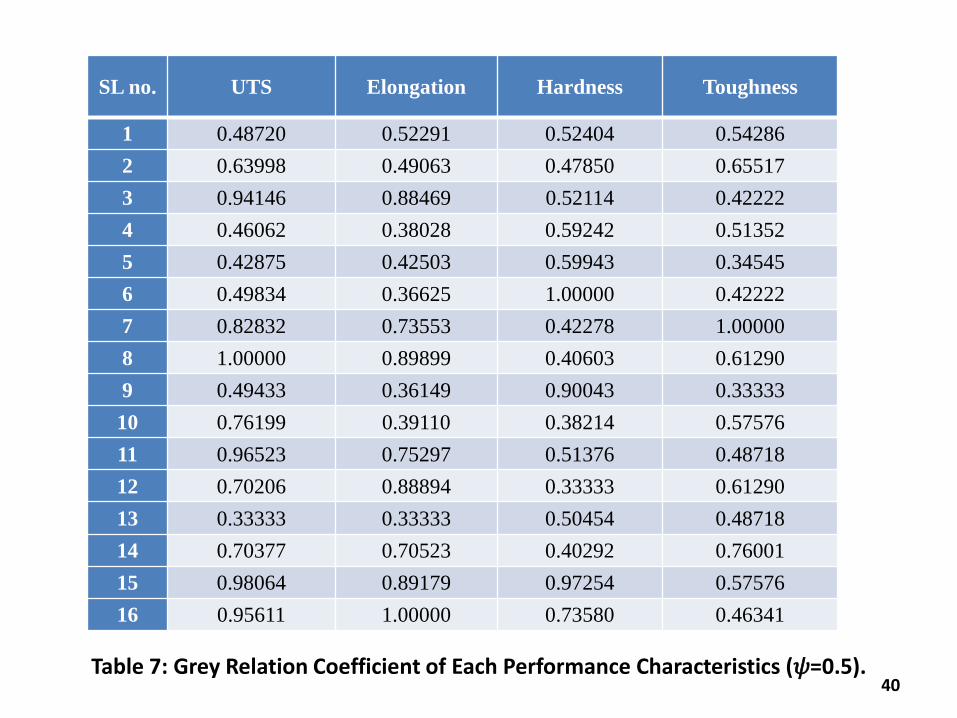
SL no. UTS Elongation Hardness Toughness
1 0.48720 0.52291 0.52404 0.54286
2 0.63998 0.49063 0.47850 0.65517
3 0.94146 0.88469 0.52114 0.42222
4 0.46062 0.38028 0.59242 0.51352
5 0.42875 0.42503 0.59943 0.34545
6 0.49834 0.36625 1.00000 0.42222
7 0.82832 0.73553 0.42278 1.00000
8 1.00000 0.89899 0.40603 0.61290
9 0.49433 0.36149 0.90043 0.33333
10 0.76199 0.39110 0.38214 0.57576
11 0.96523 0.75297 0.51376 0.48718
12 0.70206 0.88894 0.33333 0.61290
13 0.33333 0.33333 0.50454 0.48718
14 0.70377 0.70523 0.40292 0.76001
15 0.98064 0.89179 0.97254 0.57576
16 0.95611 1.00000 0.73580 0.46341
Table 7: Grey Relation Coefficient of Each Performance Characteristics (𝜓=0.5). 40
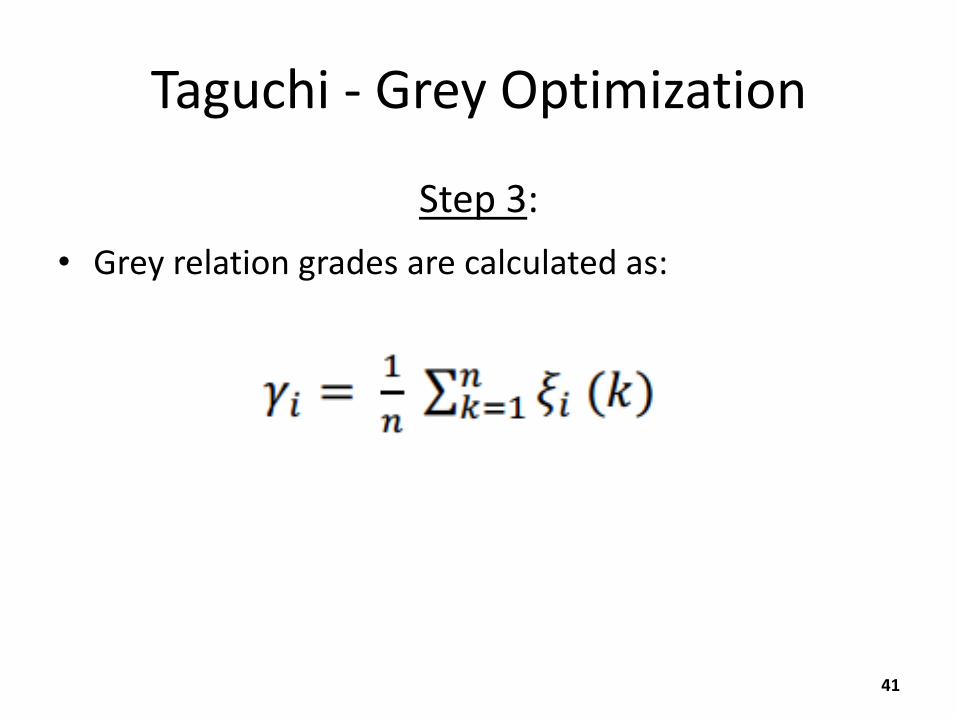
Taguchi - Grey Optimization
Step 3:
• Grey relation grades are calculated as:
41
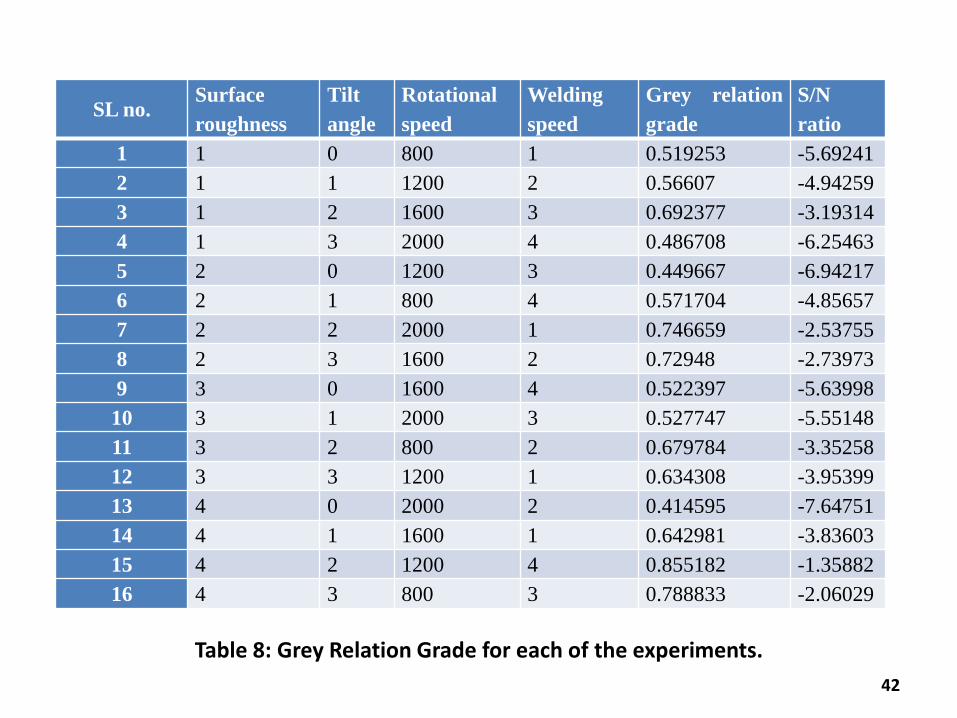
SL no. Surface
roughness
Tilt
angle
Rotational
speed
Welding
speed
Grey relation
grade
S/N
ratio
1 1 0 800 1 0.519253 -5.69241
2 1 1 1200 2 0.56607 -4.94259
3 1 2 1600 3 0.692377 -3.19314
4 1 3 2000 4 0.486708 -6.25463
5 2 0 1200 3 0.449667 -6.94217
6 2 1 800 4 0.571704 -4.85657
7 2 2 2000 1 0.746659 -2.53755
8 2 3 1600 2 0.72948 -2.73973
9 3 0 1600 4 0.522397 -5.63998
10 3 1 2000 3 0.527747 -5.55148
11 3 2 800 2 0.679784 -3.35258
12 3 3 1200 1 0.634308 -3.95399
13 4 0 2000 2 0.414595 -7.64751
14 4 1 1600 1 0.642981 -3.83603
15 4 2 1200 4 0.855182 -1.35882
16 4 3 800 3 0.788833 -2.06029
Table 8: Grey Relation Grade for each of the experiments.
42
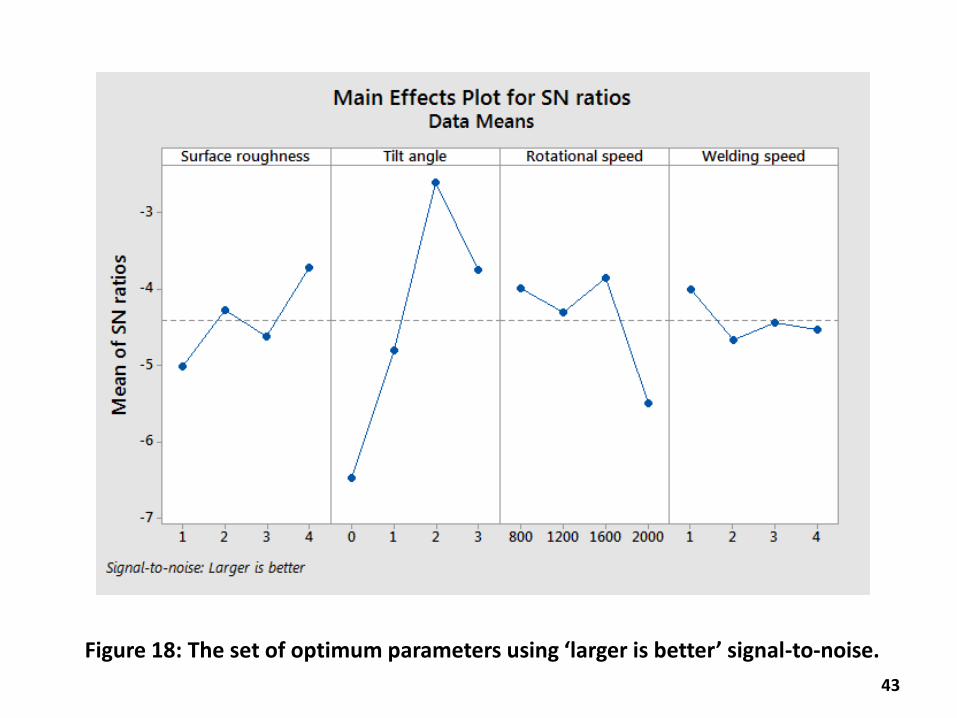
43
Figure 18: The set of optimum parameters using ‘larger is better’ signal-to-noise.
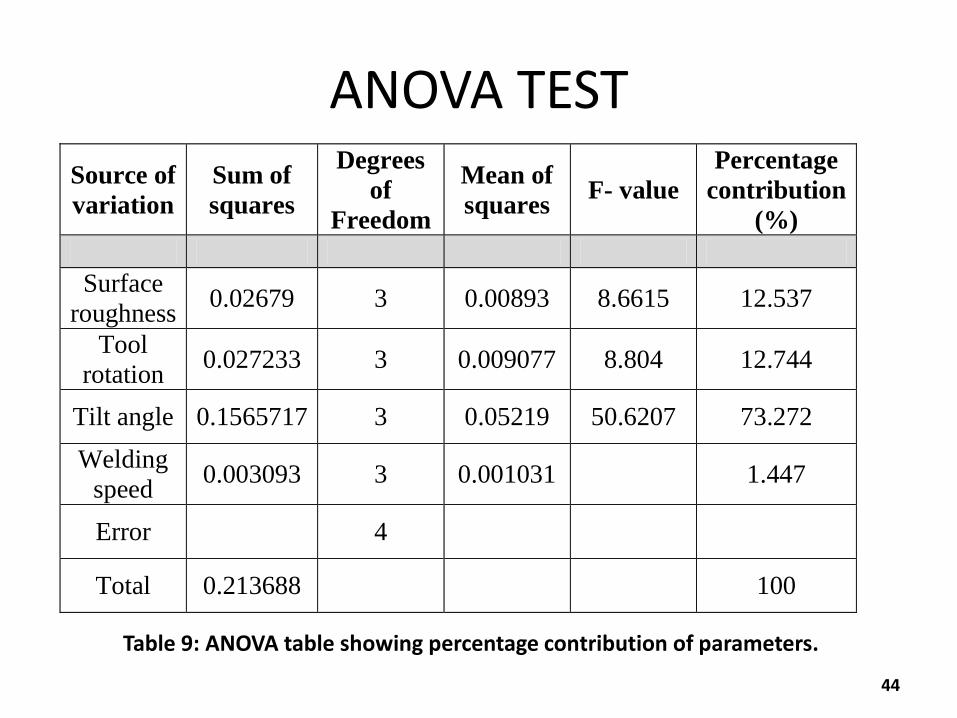
ANOVA TEST
44
Source of
variation
Sum of
squares
Degrees
of
Freedom
Mean of
squares F- value
Percentage
contribution
(%)
Surface
roughness 0.02679 3 0.00893 8.6615 12.537
Tool
rotation 0.027233 3 0.009077 8.804 12.744
Tilt angle 0.1565717 3 0.05219 50.6207 73.272
Welding
speed 0.003093 3 0.001031 1.447
Error 4
Total 0.213688 100
Table 9: ANOVA table showing percentage contribution of parameters.
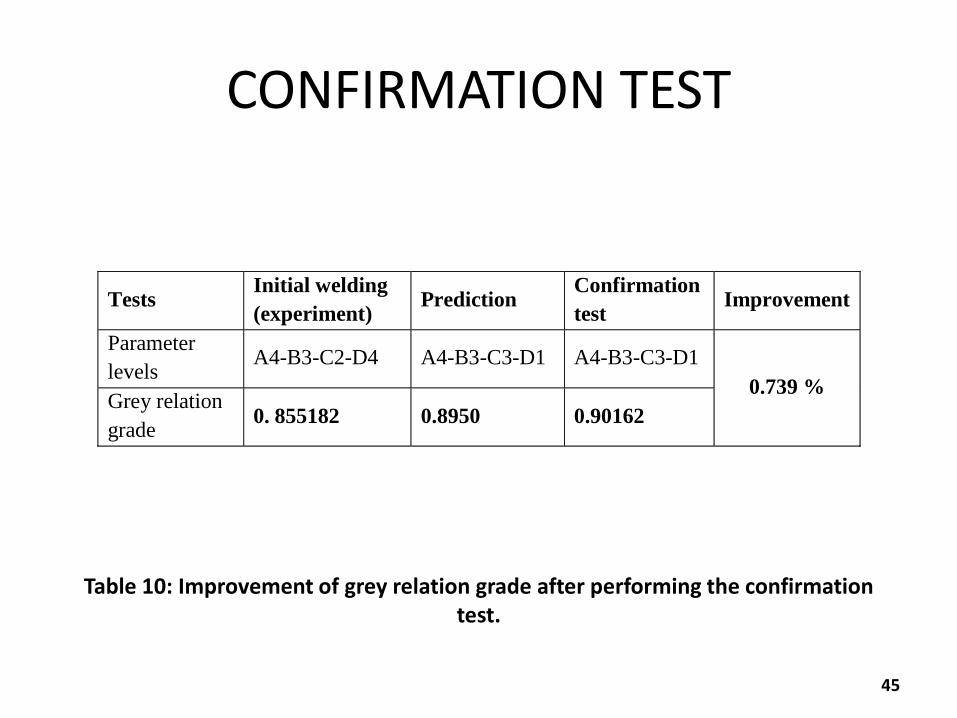
CONFIRMATION TEST
45
Tests Initial welding
(experiment) Prediction
Confirmation
test Improvement
Parameter
levels A4-B3-C2-D4 A4-B3-C3-D1 A4-B3-C3-D1
0.739 % Grey relation
grade 0. 855182 0.8950 0.90162
Table 10: Improvement of grey relation grade after performing the confirmation test.
CONCLUSIONS
Two different aluminium alloys have been successfully welded by friction stir welding.
Tool tilt angle have been found out as the most dominant parameter.
Regression equations have been developed for each tests based on the observed values.
From Grey relational optimization, the optimum parameters obtained are surface roughness of 0.2 µm, 1600 rpm of tool rotational speed, 1mm/sec of welding speed and tilt angle of 2 degrees.
Mathematical model for Grey Relational Grade (GRG) has developed and the confirmatory test have shown an improvement of 0.739% in the GRG.
46
FUTURE SCOPES
Bend test can be performed on the welded samples
Fatigue test can be performed on the welded samples
SEM investigation may be used to study the failure location and provide
the confidence so that the AA6061 and AA7075 can be used for automobile
and aerospace structures.
Measurement of generated forces and torque and correlating them to the
resulting material properties.
Different types of tool pin profile as another parameter.
47
REFERENCES 1. Sefika Kasman & Zafer Yenier. The dissimilar friction stir welding of AA5754 and AA7075
aluminum alloys. Int J Adv Manuf Technol (2014) 70:145–156.
2. Hasan I. Dawood, Kahtan S. Mohammed, Azmi Rahmat, Uday M.B. The influence of the
surface roughness on the microstructures and mechanical properties of 6061 aluminium