Raman-Induced Oscillation Between an Atomic and Molecular Gas Dan Heinzen Changhyun Ryu, Emek Yesilada, Xu Du, Shoupu Wan Dept. of Physics, University of Texas at Austin Support: NSF, R.A. Welch Foundation, NASA MRD -US Japan seminar 2006-
Transcript
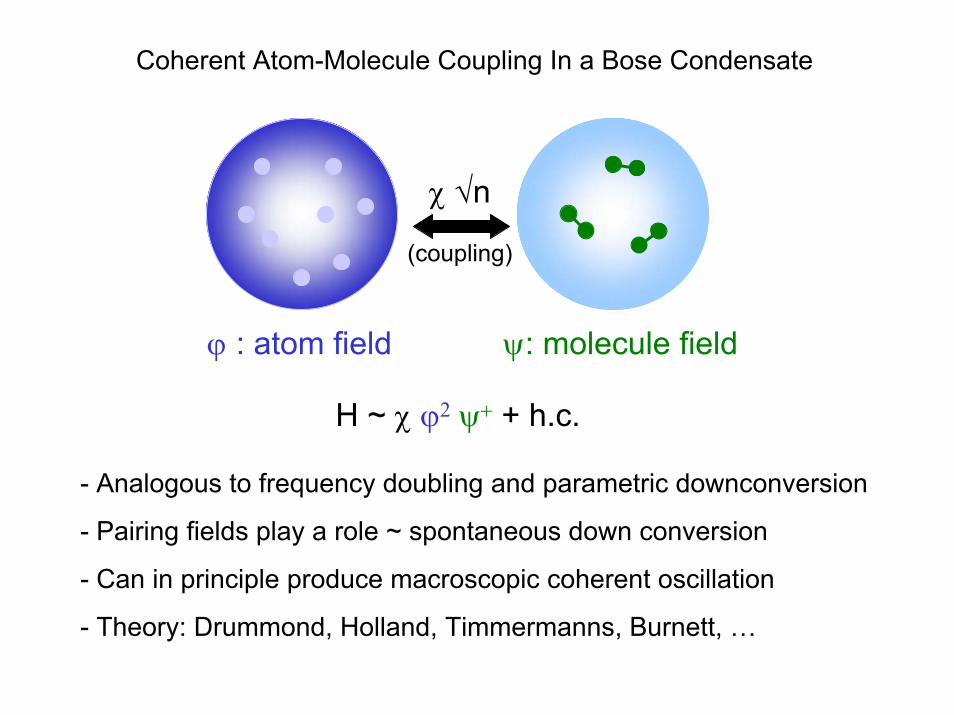
Raman-Induced Oscillation Betweenan Atomic and Molecular Gas
Dan Heinzen
Changhyun Ryu, Emek Yesilada, Xu Du, Shoupu Wan
Dept. of Physics, University of Texas at Austin
Support: NSF, R.A. Welch Foundation, NASA MRD
-US Japan seminar 2006-
BEC II
Changhyun Ryu, Wooshik Shim, Emek Yesilada, Shoupu Wan, Xu Du, D. H.
Zeeman-slowed 87Rb beam
Dark MOT, molasses
Cloverleaf trap
RF-induced evaporation
BEC with up to 2 × 10⁶ atoms
(F = 1, M= −1)
Outline
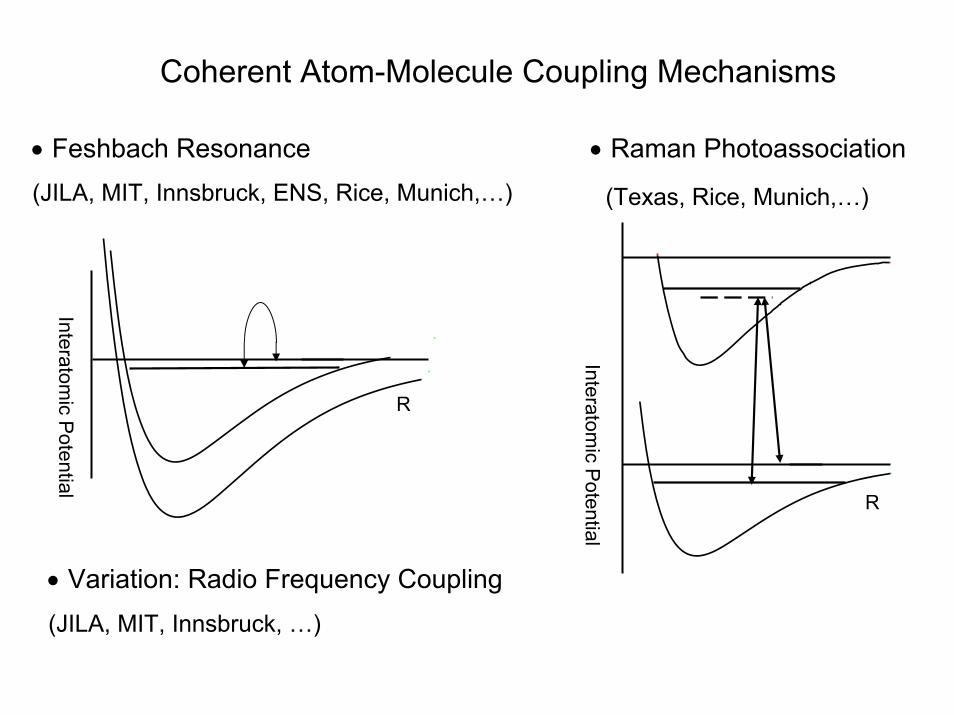
Feshbach Resonance and Raman Photoassociation in Bose Condensates.
Raman Photoassociation in a Mott Insulator.
- Resolved Contact Energy Shifts
Can Determine Fraction of Sites with 1, 2, or 3 atoms.
Can Determine Atom-Molecule Scattering Length.
- Oscillating Atomic <-> Molecular gas!
Bragg spectroscopy of atoms in a 3D optical lattice
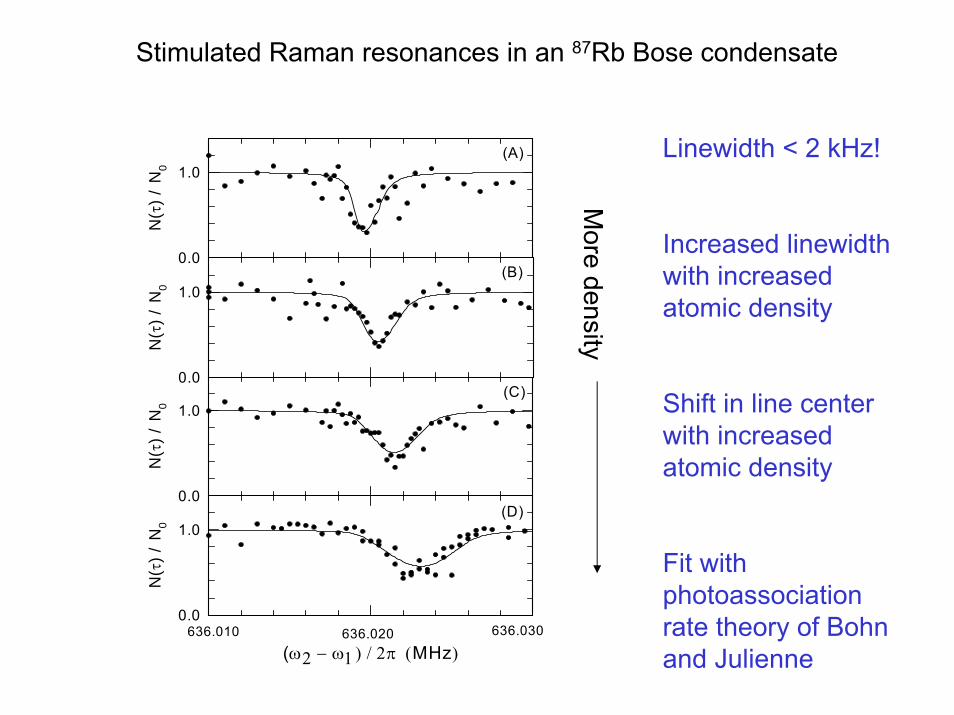
Shift in line center with increased atomic density
Fit with photoassociationrate theory of Bohn and Julienne
Stimulated Raman resonances in an 87Rb Bose condensate
More density
Results(Wynar, et al., Science 287, 1016 (2000))
ε0/2π = 636.0094 ± 0.0012 MHz
ama = -180 ± 150 a0
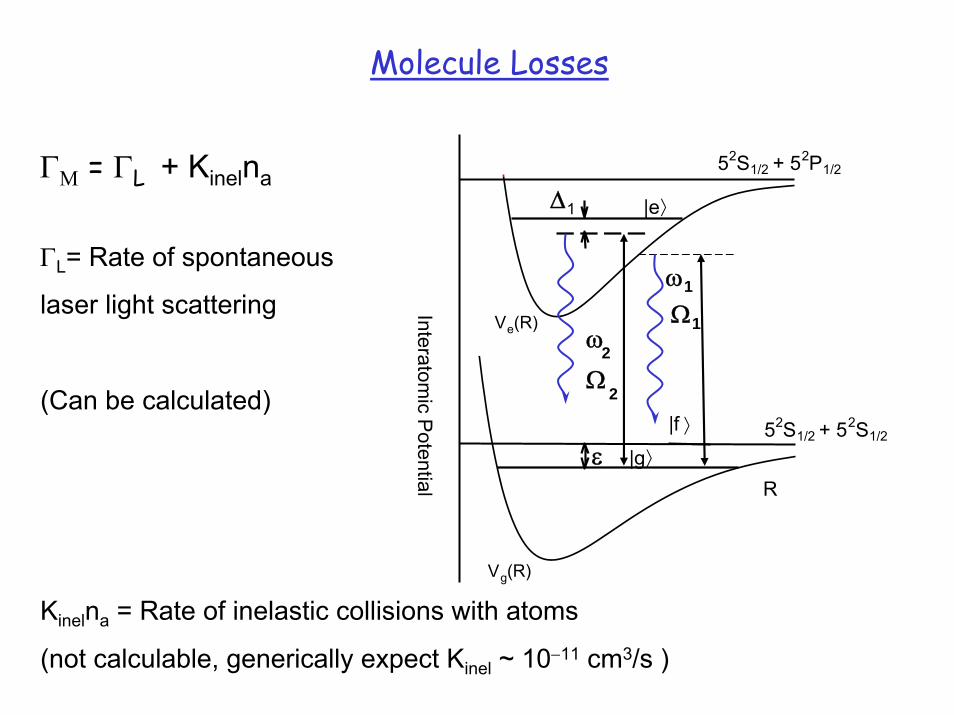
Kinel < 8 x 10-11 cm3/s
1,000 more accurate molecular binding energy than previously
First measurement of a molecule-condensate interaction
Mean field interactions account for shift and most of the broadening (no definite, nonzero Kinel)
Calculated Coupling Rate and Spontaneous Photon Loss Rate for Rb2
[ Assumes Kinel << 10-11 cm3/s ]
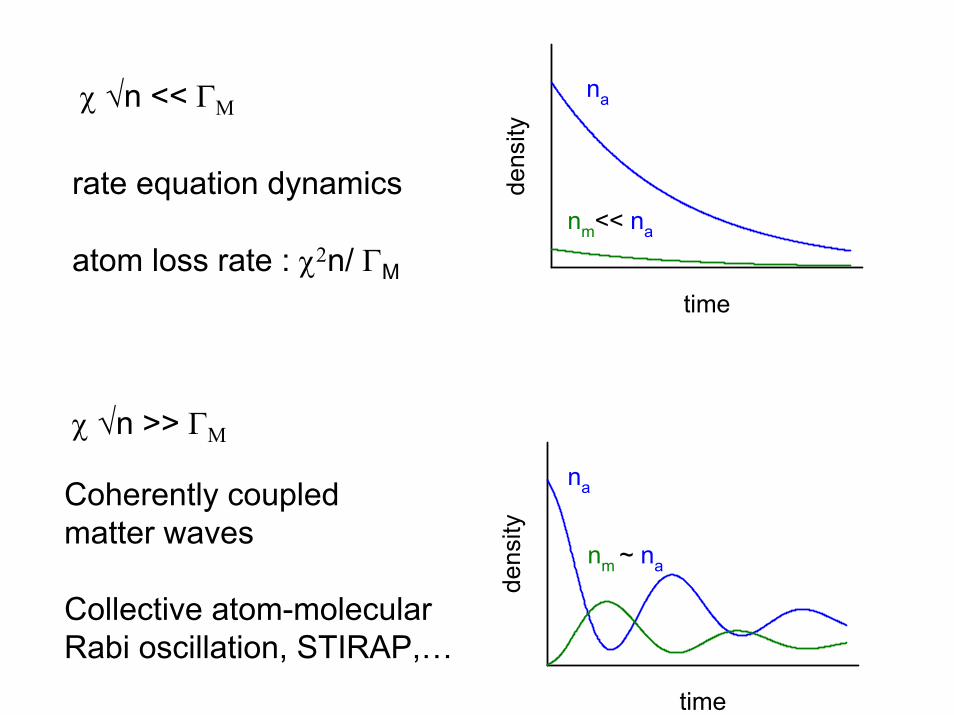
Experiments: Tried, limited evidence of collective coherent behavior
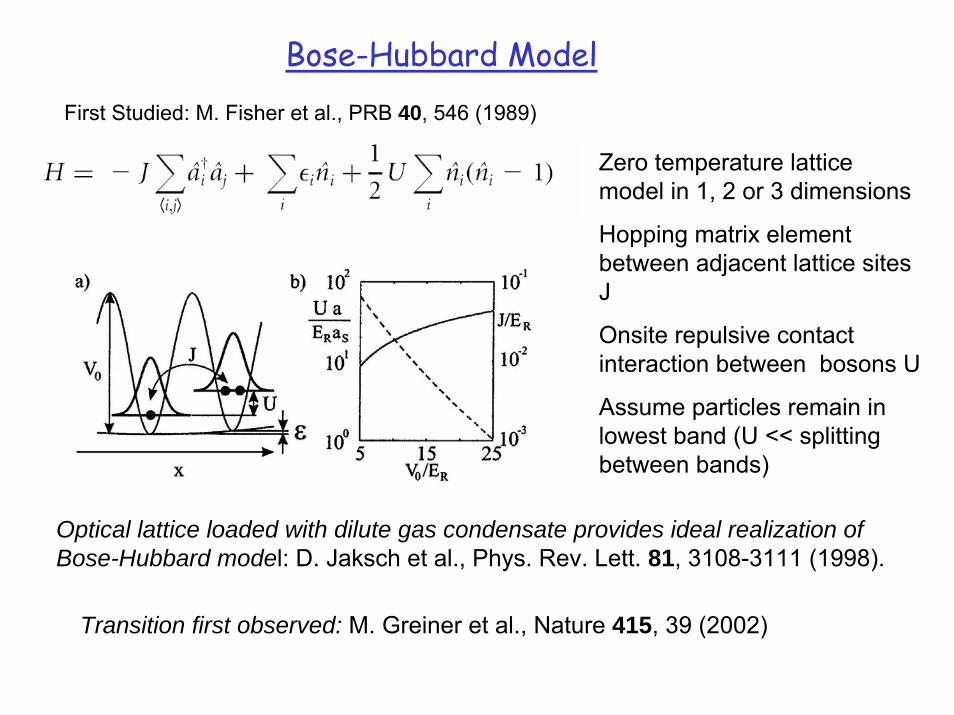
First Studied: M. Fisher et al., PRB 40, 546 (1989)
Bose-Hubbard Model
Zero temperature lattice model in 1, 2 or 3 dimensions
Hopping matrix element between adjacent lattice sites J
Onsite repulsive contact interaction between bosons U
Assume particles remain in lowest band (U << splitting between bands)
Optical lattice loaded with dilute gas condensate provides ideal realization of Bose-Hubbard model: D. Jaksch et al., Phys. Rev. Lett. 81, 3108-3111 (1998).
Transition first observed: M. Greiner et al., Nature 415, 39 (2002)
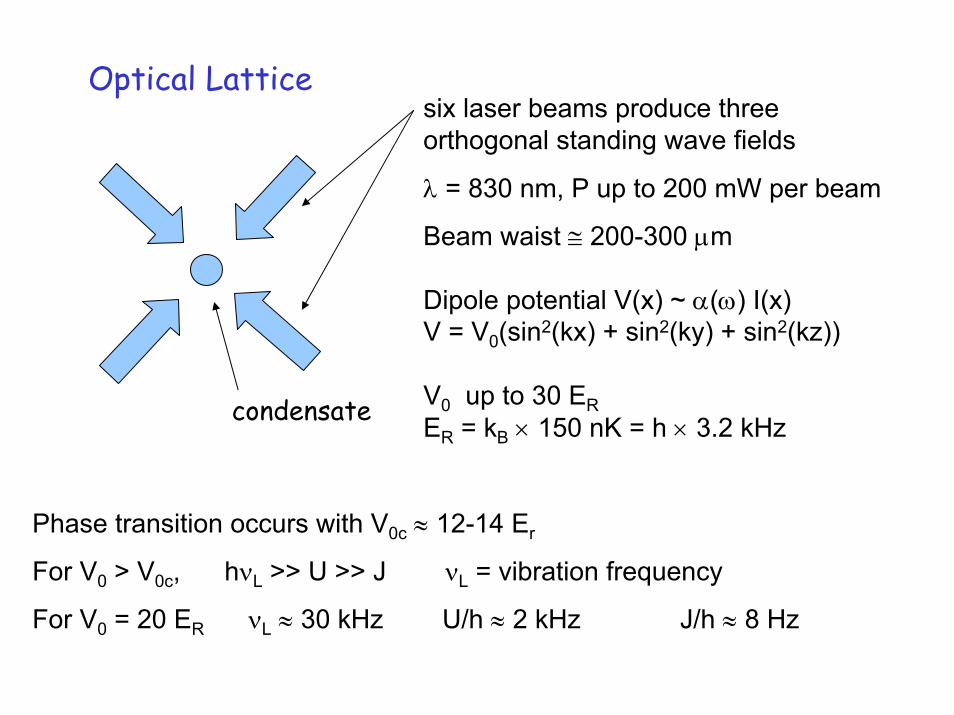
Optical Lattice
condensate
six laser beams produce three orthogonal standing wave fields
For V0 > V0c, hνL >> U >> J νL = vibration frequency
For V0 = 20 ER νL ≈ 30 kHz U/h ≈ 2 kHz J/h ≈ 8 Hz
Superfluid Phase (perturbed condensate)
Very Fast playback
φi = <bi> ≠ 0Approx. coherent stateWell defined condensate phaseUncertain particle number
Mott Insulator Phase
Very Fast playbackAprox. Fock state at each site<bi> → 0 as V0 →∞.
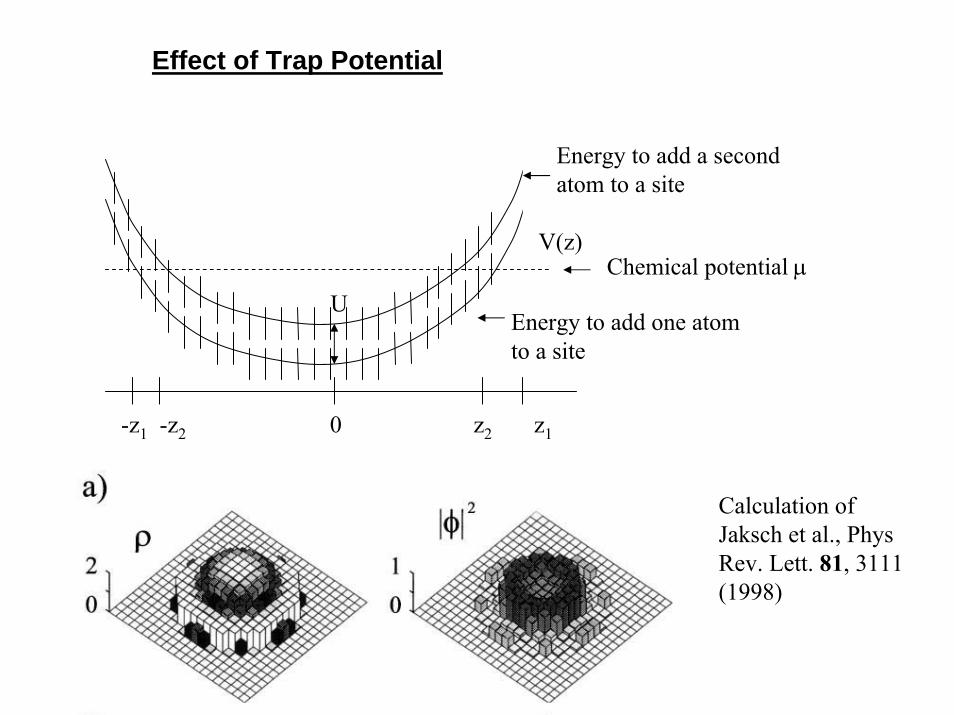
Energy to add one atom to a site
Energy to add a second atom to a site
V(z)Chemical potential μ
-z1 -z2 0 z2 z1z
U
Effect of Trap Potential
Calculation of Jaksch et al., Phys Rev. Lett. 81, 3111 (1998)
V(R)
R
Vm(R)
½ μω2R2
Raman photoassociation of two atoms in an optical lattice site
• Continuum →discrete levels of atoms in lattice site
• ω/2π ≈ 30 kHz = lattice vibration frequency
• Enhanced free-bound coupling
• Eliminates inelastic collisions
Proposal: D. Jaksch et al., Phys. Rev. Lett. 89, 040402 (2002)
Photoassociation in a Mott Insulator
Lattice
Height V0 ≈ 20ER
time
Photoassociation laser Measure atom number
pulse, duration t N(t)
BEC with
N(0) atoms
80 ms
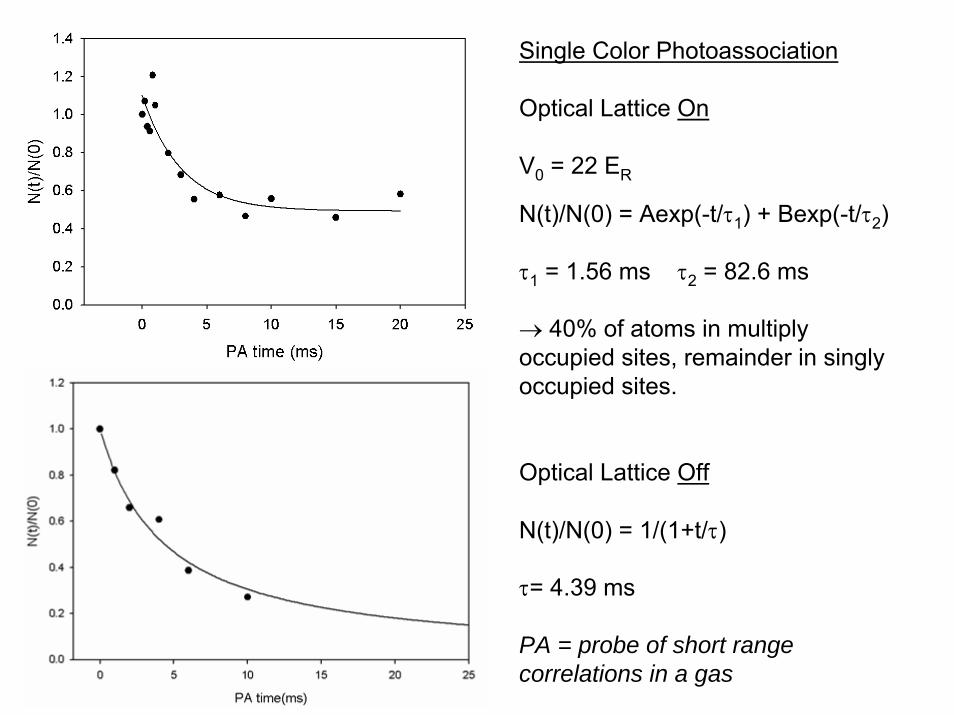
Single Color Photoassociation
Optical Lattice On
V0 = 22 ER
N(t)/N(0) = Aexp(-t/τ1) + Bexp(-t/τ2)
τ1 = 1.56 ms τ2 = 82.6 ms
→ 40% of atoms in multiply occupied sites, remainder in singly occupied sites.
Optical Lattice Off
N(t)/N(0) = 1/(1+t/τ)
τ= 4.39 ms
PA = probe of short range correlations in a gas
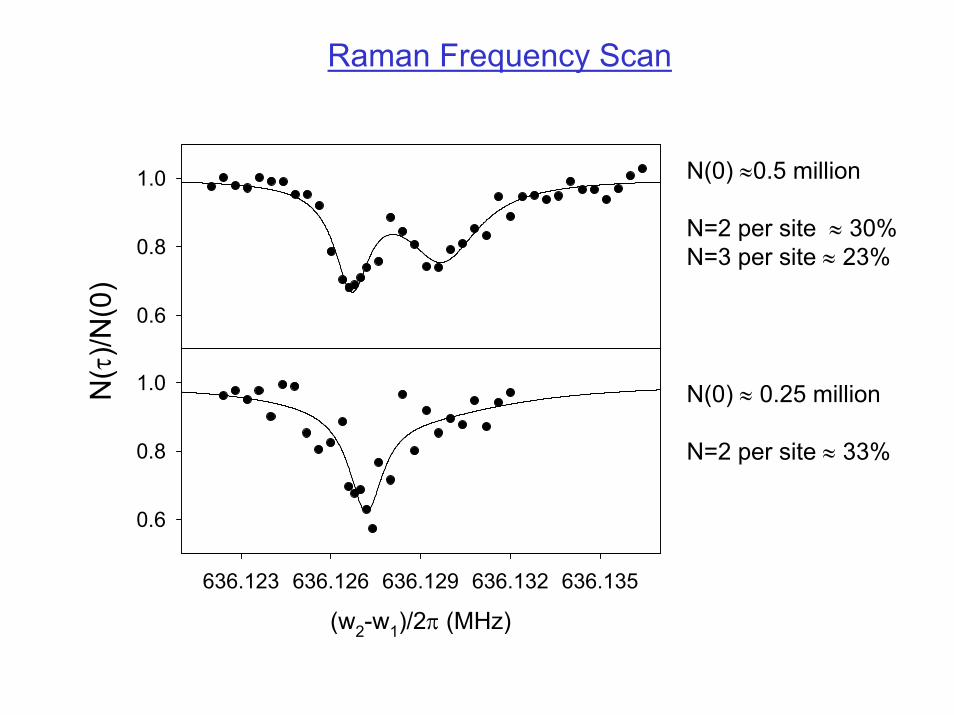
N(0) ≈0.5 million
N=2 per site ≈ 30%N=3 per site ≈ 23%
Raman Frequency Scan
0.6
0.8
1.0
(w2-w1)/2π (MHz)
636.123 636.126 636.129 636.132 636.135
N(τ
)/N(0
)
0.6
0.8
1.0 N(0) ≈ 0.25 million
N=2 per site ≈ 33%
Atom-molecule collisional loss
Uaa 3Uaa
Uam
N = 2 atoms per site
N = 3 atoms per site
Atom-molecule collisional loss
Uaa 3Uaa
Uam
N = 2 atoms per site
N = 3 atoms per site
Measured shift → Measured Uaa → aam = − 5 ± 20 a0
Greater width of N=3 peak: inelastic collision loss, greater power broadening. Estimate that Kinel ~ few × 10−11 cm3/s
0
Raman PA time (ms)0 1 2 3 4 5 6
N(τ
)/N(0
)
0.0
0.2
0.4
0.6
0.8
1.0
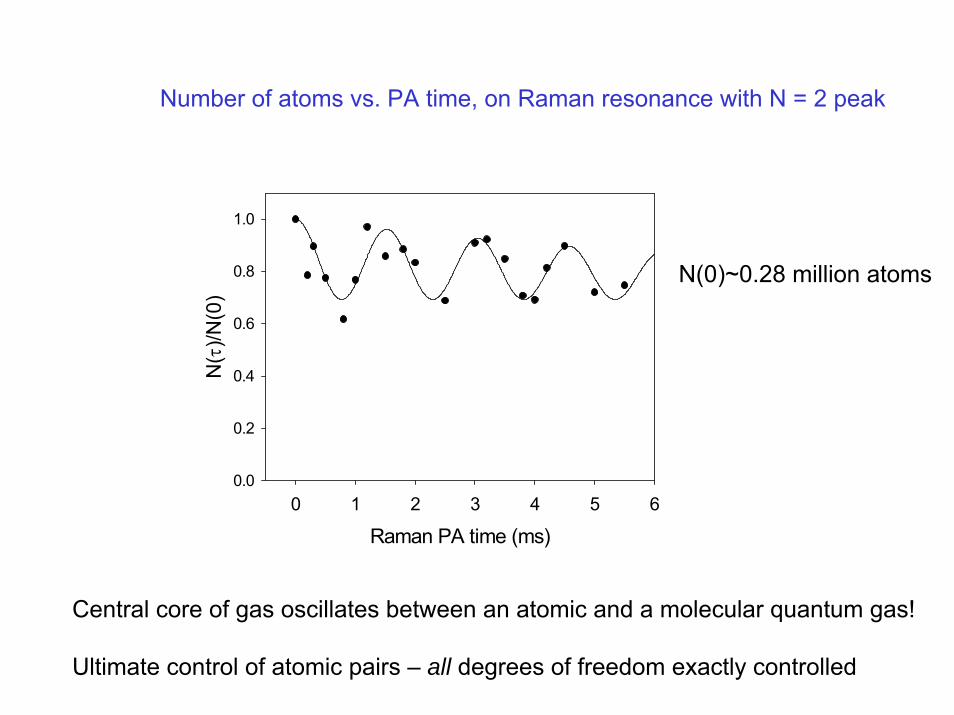
Number of atoms vs. PA time, on Raman resonance with N = 2 peak
N(0)~0.28 million atoms
Central core of gas oscillates between an atomic and a molecular quantum gas!
Ultimate control of atomic pairs – all degrees of freedom exactly controlled
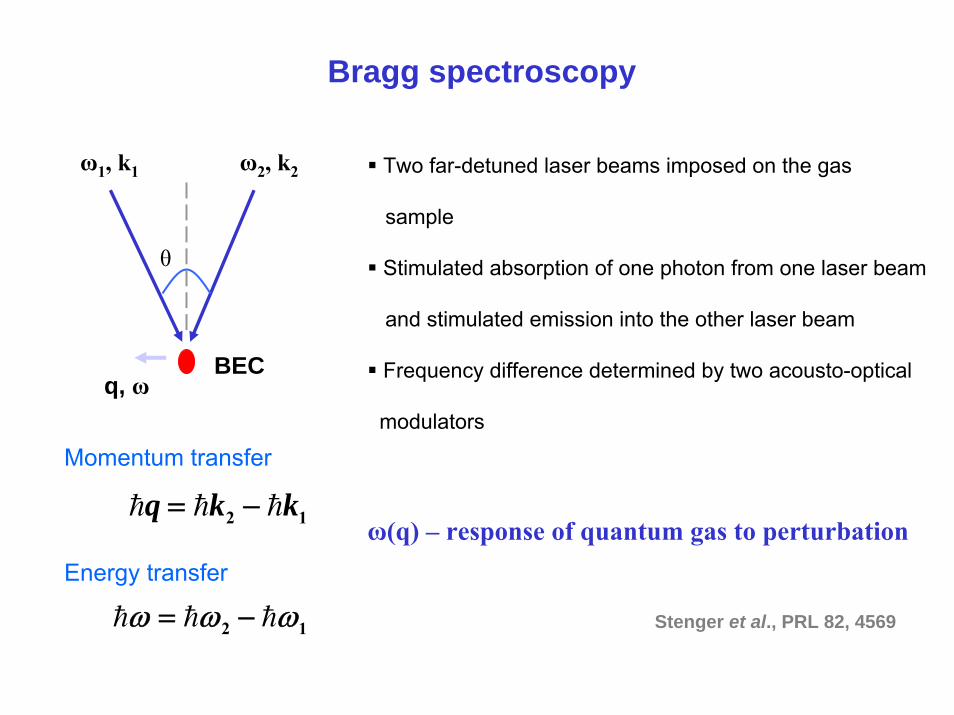
Bragg spectroscopy
Two far-detuned laser beams imposed on the gas
sample
Stimulated absorption of one photon from one laser beam
and stimulated emission into the other laser beam
Frequency difference determined by two acousto-optical
modulators
Momentum transfer
Energy transfer
12 kkq hhh −=
12 ωωω hhh −=
ω(q) – response of quantum gas to perturbation
ω1, k1 ω2, k2
BEC
θ
q, ω
Stenger et al., PRL 82, 4569
Dispersion relation ω(q)
For a weakly interacting quantum gas system
)2
2(2
)(2222
mq
mqq hh
h += μω
µ is chemical potential; m is atomic mass
For small q, collective excitations
cqq hh =)(ω
mc μ
= , speed of sound
For large q, single-particle excitations
μω +=mqq
2)(
22hh
ξ is healing length
Steinhauer et al., PRL 88, 120407
q (m-1)
0 2e+6 4e+6 6e+6 8e+6 1e+7
ω/2
π (H
z)
0
1000
2000
3000
4000
5000
6000
7000
πna81ξ =−Free particle
PhononExperimental setting
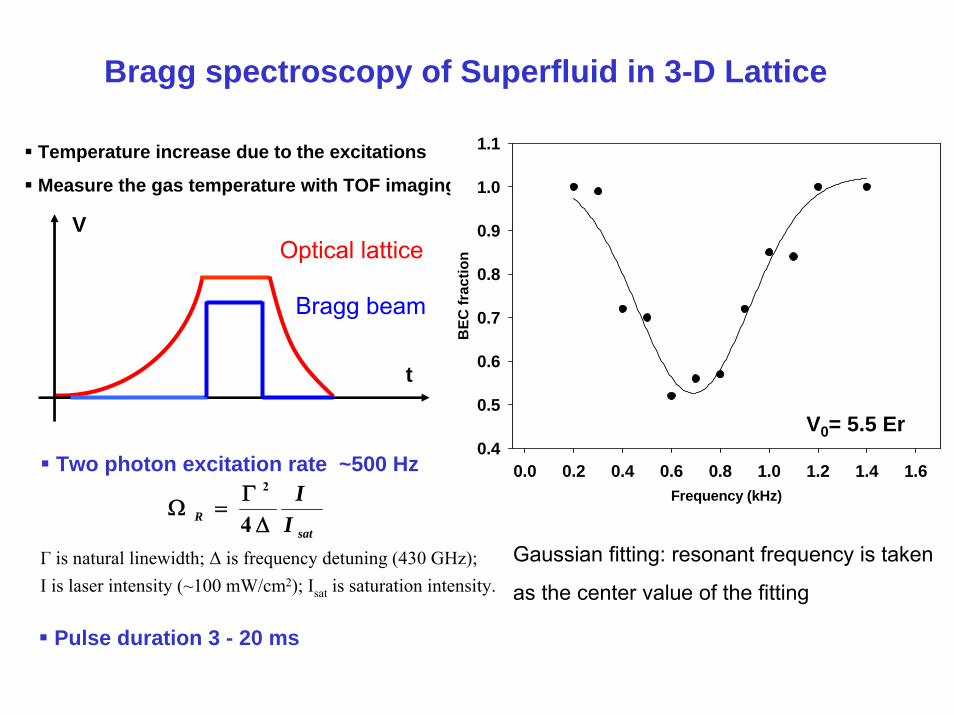
Bragg spectroscopy of Superfluid in 3-D Lattice
t
VOptical lattice
Bragg beam
Temperature increase due to the excitations
Measure the gas temperature with TOF imaging
Two photon excitation rate ~500 Hz
satR I
IΔ
Γ=Ω
4
2
Г is natural linewidth; Δ is frequency detuning (430 GHz);I is laser intensity (~100 mW/cm2); Isat is saturation intensity.
Gaussian fitting: resonant frequency is taken
as the center value of the fitting
Pulse duration 3 - 20 ms
Frequency (kHz)0.0 0.2 0.4 0.6 0.8 1.0 1.2 1.4 1.6
BEC
frac
tion
0.4
0.5
0.6
0.7
0.8
0.9
1.0
1.1
V0= 5.5 Er
Theory
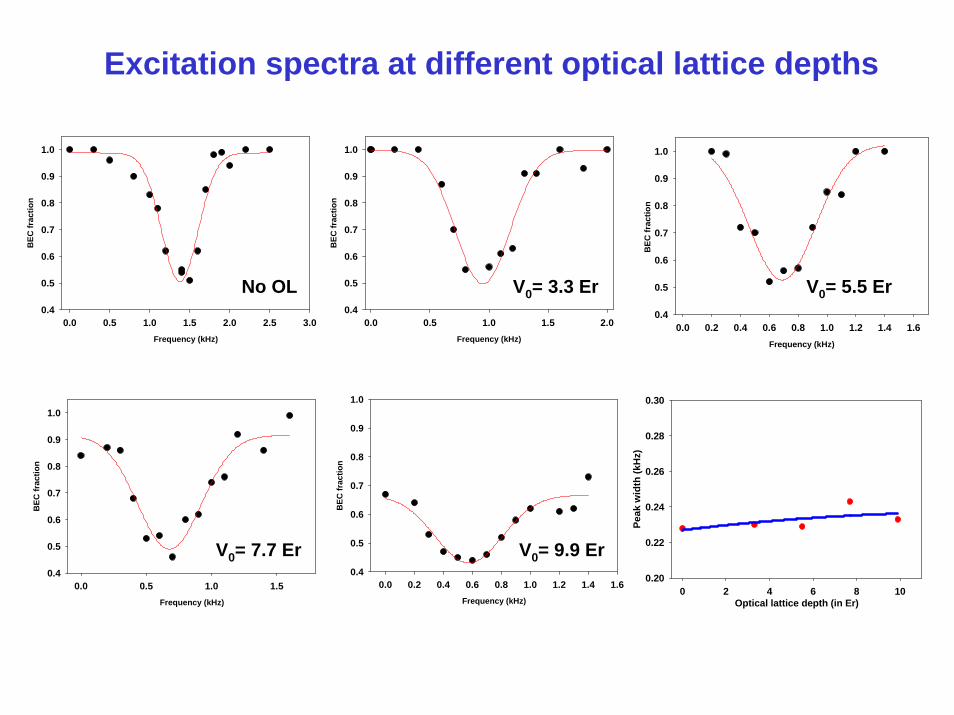
Bogoliubov theory (Biao Wu, IOP, Beijing)Breaks down for V0 > 3 Er
As optical lattice depth increases, μ* increases due to tighter confinement, m* increases due to the decreased band width
Excitation spectra at different optical lattice depths
Optical lattice depth (in Er)0 2 4 6 8 10
Peak
wid
th (k
Hz)
0.20
0.22
0.24
0.26
0.28
0.30
Frequency (kHz)
0.0 0.5 1.0 1.5 2.0 2.5 3.0
BEC
frac
tion
0.4
0.5
0.6
0.7
0.8
0.9
1.0
No OL
Frequency (kHz)
0.0 0.5 1.0 1.5 2.0B
EC fr
actio
n
0.4
0.5
0.6
0.7
0.8
0.9
1.0
V0= 3.3 Er
Frequency (kHz)
0.0 0.2 0.4 0.6 0.8 1.0 1.2 1.4 1.6
BEC
frac
tion
0.4
0.5
0.6
0.7
0.8
0.9
1.0
V0= 5.5 Er
Frequency (kHz)
0.0 0.5 1.0 1.5
BEC
frac
tion
0.4
0.5
0.6
0.7
0.8
0.9
1.0
V0= 7.7 Er
Frequency (kHz)
0.0 0.2 0.4 0.6 0.8 1.0 1.2 1.4 1.6
BEC
frac
tion
0.4
0.5
0.6
0.7
0.8
0.9
1.0
V0= 9.9 Er
Conclusion
Photoassociation in Mott insulator provides measure of singly, doubly, and triply occupied lattice sites – confirm large fraction of multiply occupied sites.


![Environmental Atomic Force and Confocal Raman Microscopies … · 2018-11-09 · Confocal Raman microscope [Witec GmbH; ] Confocal Raman microscopy: high resolution chemical mapping](https://static.documents.pub/doc/80x56/5fab2f45b37f971ef54300ff/environmental-atomic-force-and-confocal-raman-microscopies-2018-11-09-confocal.jpg)


