RAMAN SPECTRAL STUDIES OF SOLUTIONS OF FORMIC ACID AND METEYL FORMATE BY Richard J. Bartholomew, M.Sc. A thesis pnsented to the University of Waterloo in fulfilment of the thesis requirement for the degree of Doctor of Philosophy in Chemistry Waterloo, Ontario, Canada, 1996 O Richard J. Bartholomew 1996
Transcript
RAMAN SPECTRAL STUDIES OF
SOLUTIONS OF FORMIC ACID AND METEYL FORMATE
BY
Richard J. Bartholomew, M.Sc.
A thesis pnsented to the University of Waterloo
in fulfilment of the thesis requirement for the degree of
Doctor of Philosophy in
Chemistry
Waterloo, Ontario, Canada, 1996
O Richard J. Bartholomew 1996
National Li brary I*I of Canada Bibliothkque nationale du Canada
Acquisitions and Acquisitions et Bibliographie s e ~ k e s bibliographiques 395 Weilingbn Sbset 395, nie welrtt~gtm ûUawaON K 1 A W OttawabN KYAON4 Canada Canada
The author has granted a non- exclusive licence alIowing the National Li'brary of Canada to reproduce, loan, distfi'brrte or sell copies of hi* thesis by any meam and in any fom or format, making
The author retains ownership of the copyright in M e r thesis. Neither the thesis nor substantial extracts fiom it may be printed or otherwise reproduced with the author's permission.
L'auîeur a accordé une licence non exclusive permettant à la BrT>loth&pe nationale du Canada de reproduire, prêter, ou vendre des copies de sa thèse de quelw manière et sous quelque forme que ce soit pour mettre des exemplaires de cette thèse à la disposition des personnes intéressées.
L'auteur conserve la propxiété du droit d'auteur qui protège sa thèse. Ni la thèse ni des extraits substantiels de celle-ci ne doivent &tre imprimés ou autrement reproduits sans son autorisatioll.
The University of Waterloo requires the signatures of ali persons using or photocopying
this thesis. Please sign below, and give address and date.
Rnmna Spectral stidies of solutions
of Fonnic Aâd and Methyl Formate
Raman spectroscopy was used to study solutions of formic acid in water,
acetonitrile, 1 +dioxane, and dichioromethane and solutions of methyl formate in methyl
d-formate and acetonitrile.
A very clear non-coincidence effect, NCE (Le., v,, - v, t O), exists for formic
acid. Dilution in water led to a reduction of the NCE. Such behaviour is indicative of
resonance energy transfer, which implies si@~cant intermolecular coupling in formic
acid and short range, short terni order in the liquid. Diiution in acetonitrile and 1,4-
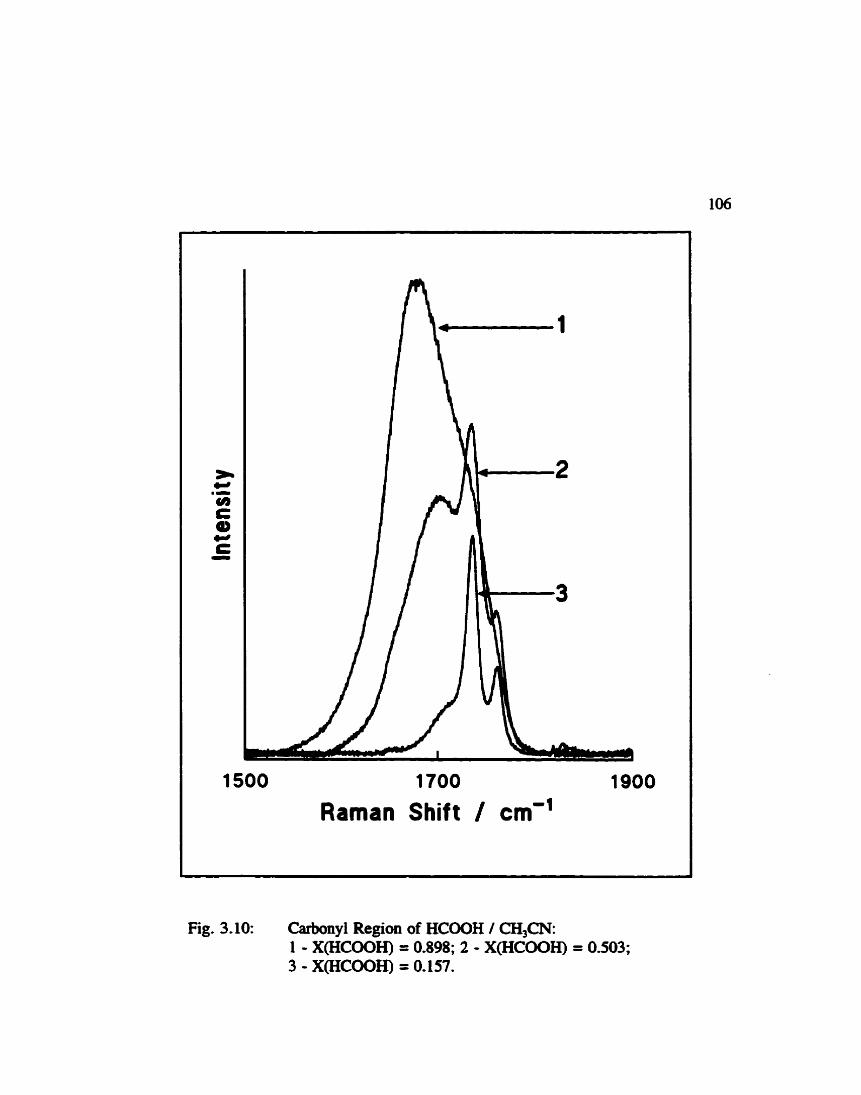
dioxane led to the development of peaks at -1735 cm-' and -1765 cm-'. By cornparison
with methyl formate, the band at -1735 cm-' was assigned to uncoupled formic acid
monomer. The band at -1765 cm-' was assigned to a foimic acid-solvent complex.
Independent evidence (perturbations of the solvent spectra) was found to support the
existence of a complex. In the case of acetonitrile, this complex was investigated more
deeply. A "Job" plot gave ambiguous results conceming the co-ordination number, n, of
the "complex". "Equiiibrium constants" were caiculated for several possible
stoichiometries. At high relative amounts of acetonitrile the "equilibrium constant l1
increased dramaticaliy (for each of the stoichiometries). At high concentrations of
acetonitrile, a mixture of complexes may exist.
A non-coincidence effect also exists in methyl formate but is much smailer than
in formic acid. The NCE was snidied as a function of concentration and compared with
several models in the Literature. The behaviour of the NCE for the isotopic dilution (in
methyl d-formate) conformed with the mode1 tested However, the non-isotopic dilution
(in acetonitnle) did not conform with the models. The full width at half maximum of the
carbonyl band exhibited unusual behaviour, fim inmashg and then decreasing, indicating
a change in the nature of the intennolecular potential with dilution.
Fit of all, 1 thank Dr. D. E. Irish for his help, patience and guidance through the
coune of this project and the preparation of this thesis.
I wish to thank Dr. M. Brwker of Mernorial University for advice and suggestions
at the beginning of this project. He origiaally suggested the polarization studies of formic
acid, but I expected those experiments to last about thnt weeks. Little did 1 realize this
would rnushroom into an entire thesis!
Without technical help of Andy Barber, Dave Bowen, Chris Gendron, Nom
Harrison, John Selwood and Jacek Sabra this thesis could never have been completed.
1 rnust, of course, thank my many CO-worken over last few years: Dr. Marek
Odziemkowski, Dr. Gerry Toogood, Dr. Grzegon Szymanski, Dr. Piongyi Deng, Brian
Smith, Alexandre G. Brolo, Feng Guo, Y-K Ha, J o m e Gnllthuizen, Jean Hein, Linda
Relative Iategrated Intensities of the "Bound Acetonitrile for the (Fomiic Acid + Acetonitriie) / Dichloromethane System .......................................... 149
Sunmiary of 'a' Values for the (Formic Acid + Acetonitrile) I Dichlorometbane System ................... 156
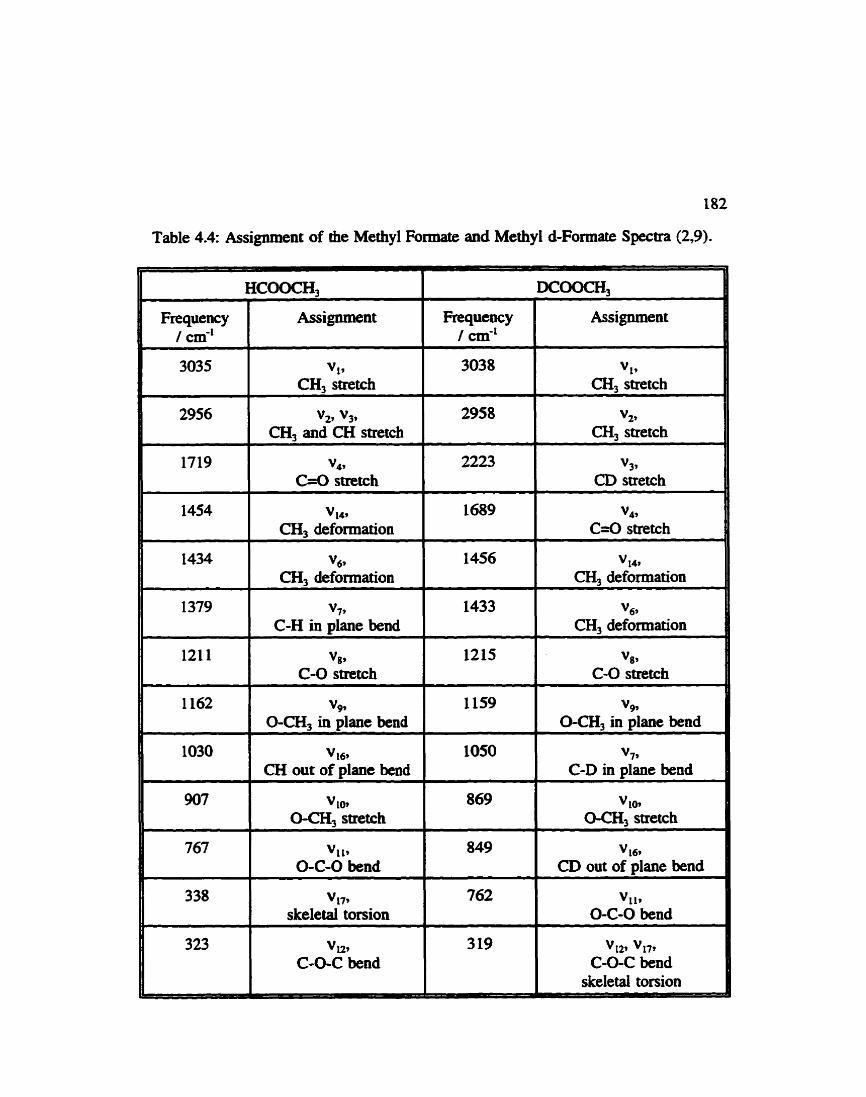
Assignment of Methyl Formate and Methyl d-Formate . . . . . . . . 182
Sumrnary of Band Maxima Frequencies for Methyl Formate 1 Methyl d-Formate (Carbonyl Mode) . . . . . . . . . . . . . . . . . . . . 189
Summary of Band First Moments for Methyl Formate 1 Methyl d-Formate (Carbonyl M d ) . . . . . . . . . . . . . . . . . . - . . 193
Half Widths at Half Maxima and Full Widths at Half Maxima for Methyl Formate I Methyl d-Formaîe (Carbonyl Mode) ............................---,.......-. 198
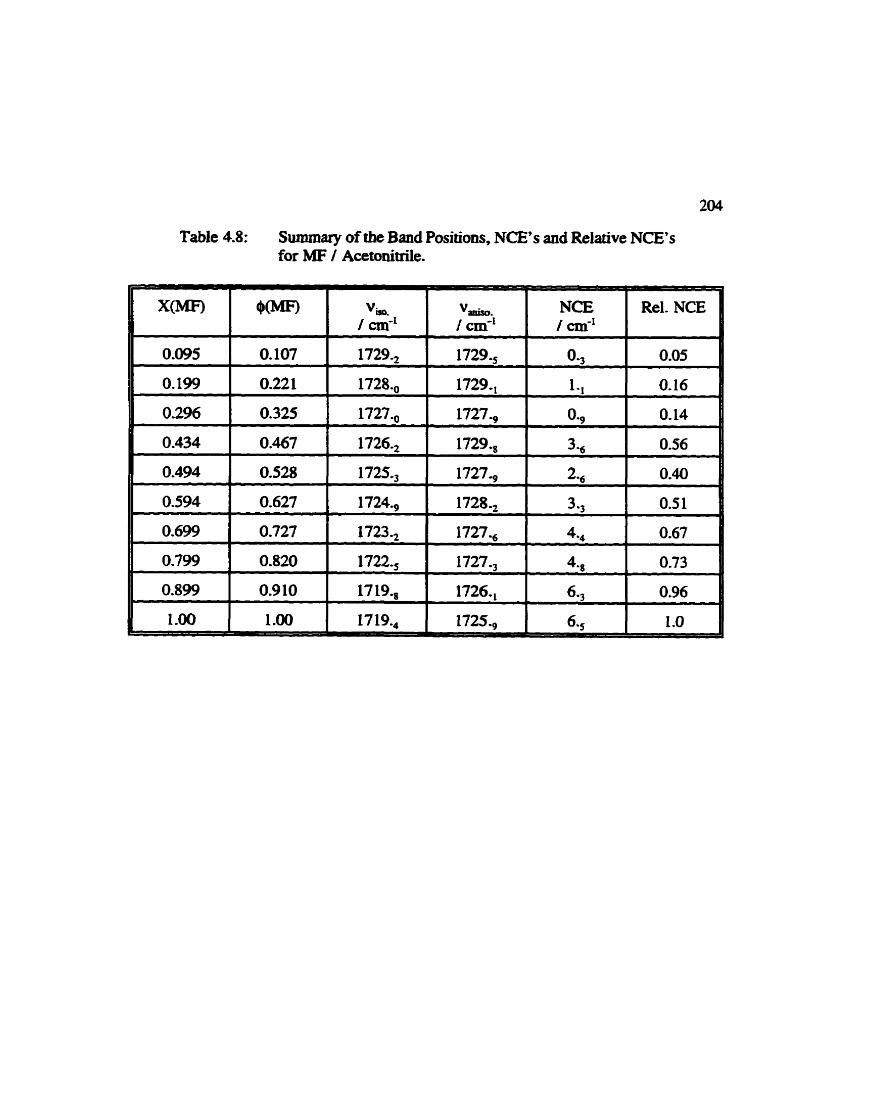
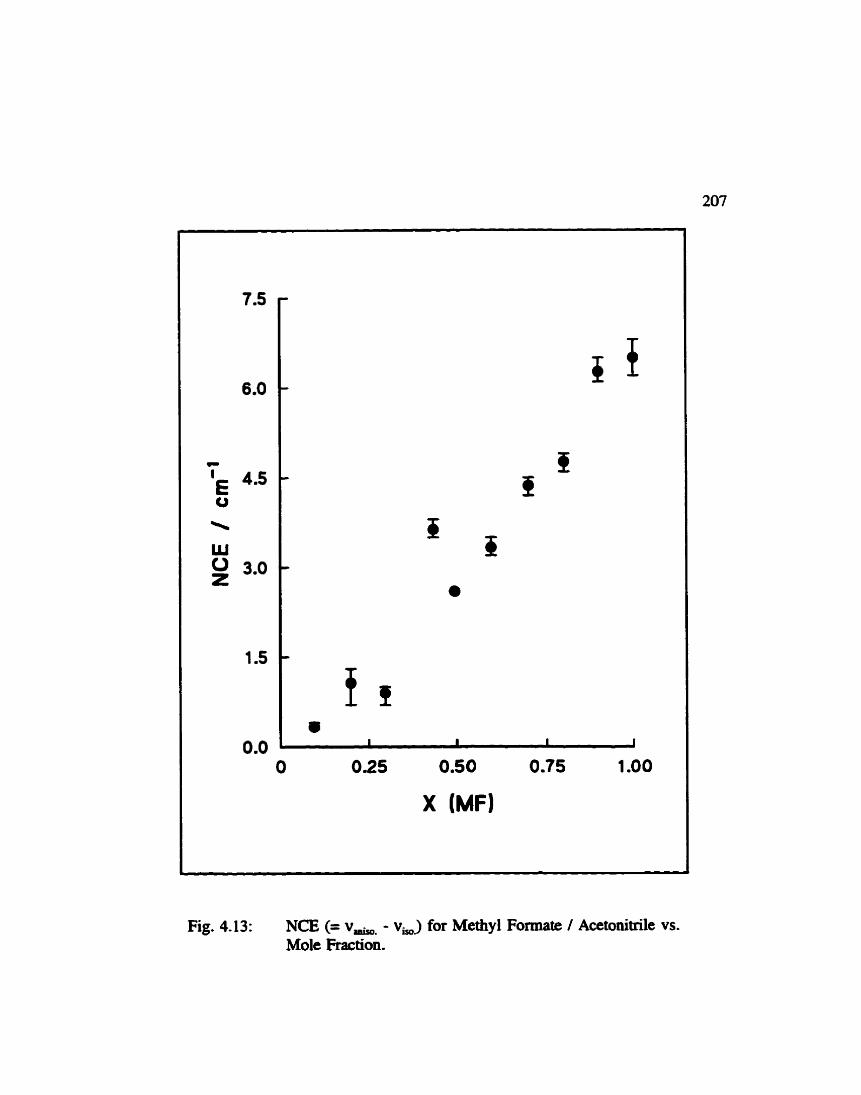
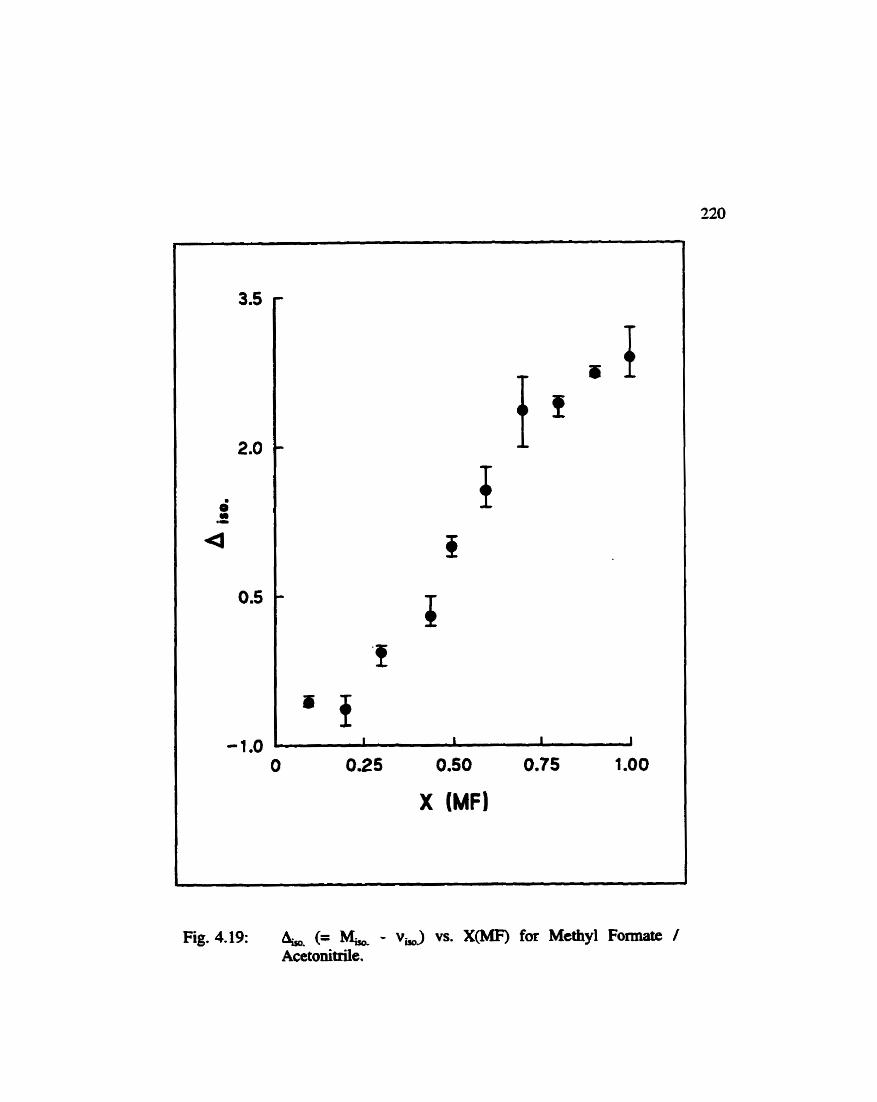
Summary of Band Maxima Positions, Noncoincidence Effect, and Relative Noncoincidence Effect for Methyl Formate I Acetonitrile (Carbonyl Mode) . . . . . . . . . . . . . . . . . . . 204
Sumrnary of Band Fit Moments, Non-coincidence Effect and Relative Nonaincidence Effect for Methyl Formate I Acetonitrile (Carbonyl Mode) . . . . . . . . . . . . . . . . . . . . . . . . . . 215
Survey Specfra of 1. edioxane and Formic Acid / 1. 4- dioxane ......................................... 119
Spectra of 1. 44oxane and Formic Acid / 1. rklioxane (350 . 750 cm-') ....................................... 122
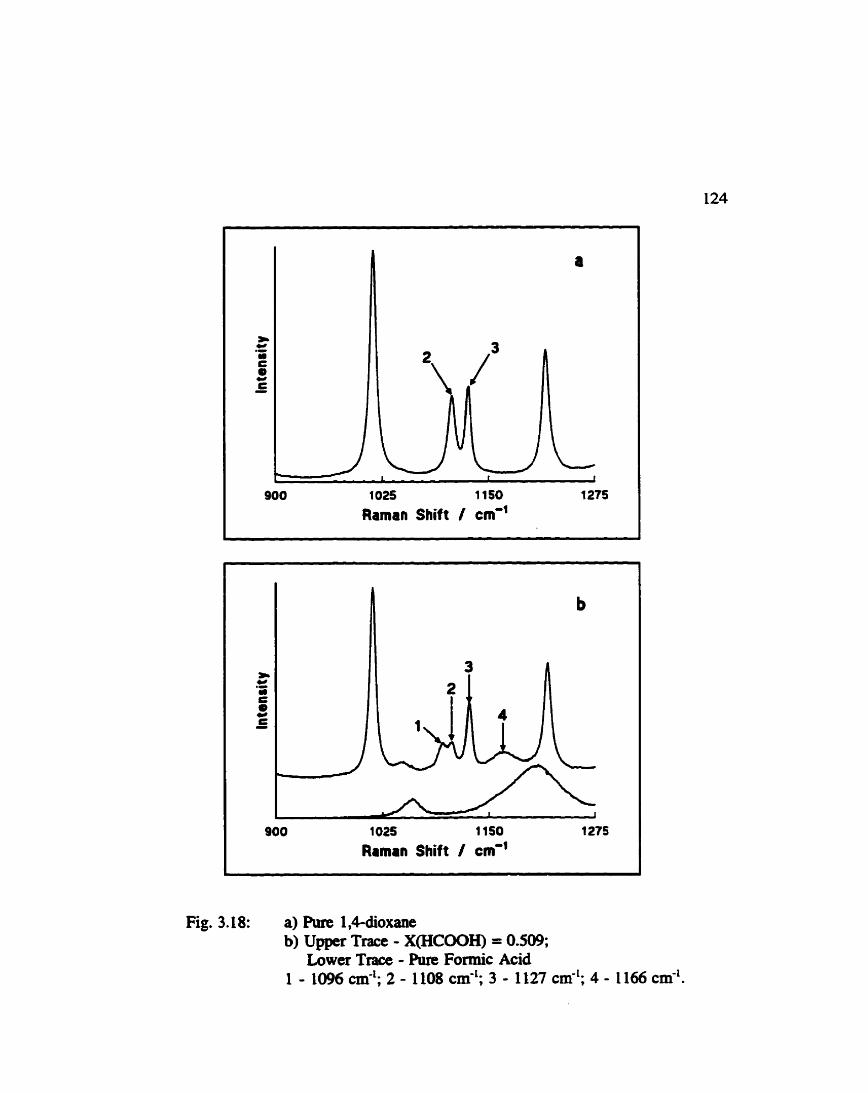
Spectra of 1. 4-dioxane and Formic Acid I 1. rldioxane (900 O 1275 cm-') ...................................... 124
Carbonyl Region of Formic Acid I 1.4.dioxane .............. 125
Variation of the Band Parameters for the Carbonyl Region of Formic Acid / 1. 4-dioxane . . . . . . . . . . . . . . . . . . . . 127
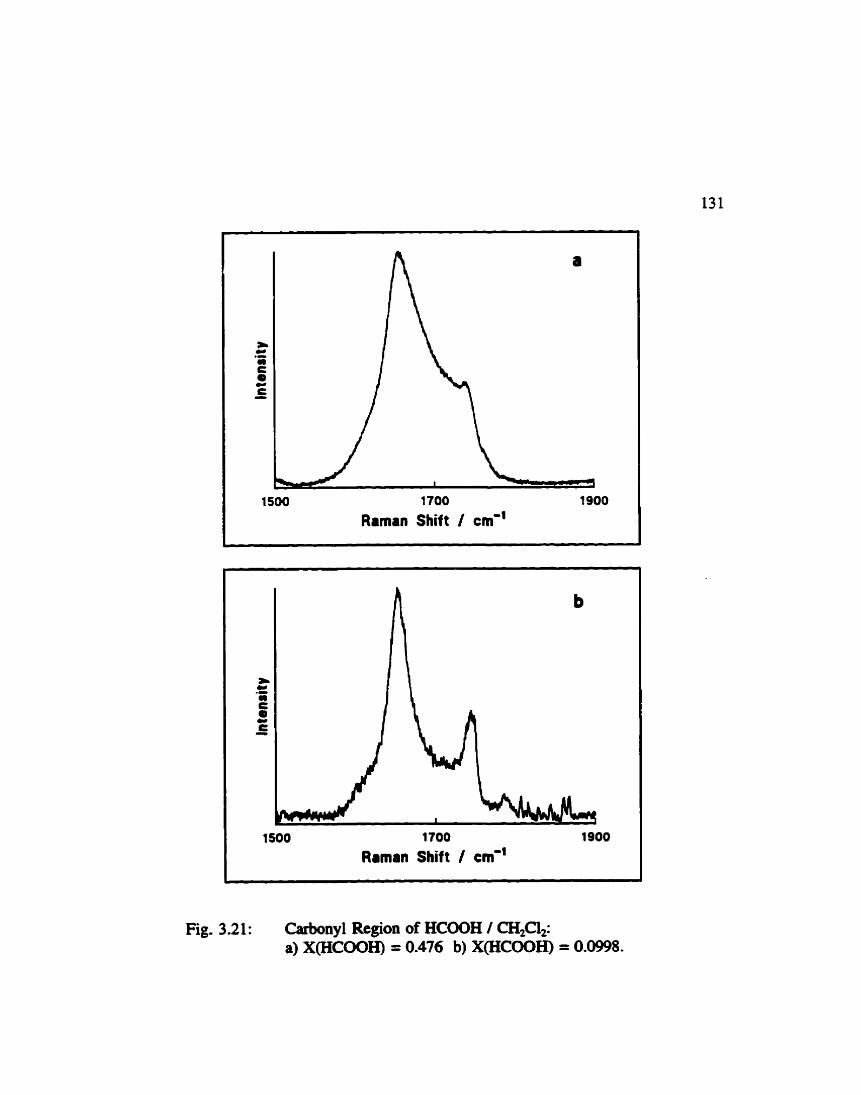
.......... Carbonyl Region of Formic Acid / Dichloromethane 131
Effect on "Association" Band of Formic Acid of Dilution in DichIoromethane ................................... 133
Variation of the Band Parameters for the 1735 cm*' Band of .............. Formic Acid in Acetonibrile and in 1. Q-dioxane 136
Variation of the Fraction of Total Carbonyl Intensity and Relative Intensity of the 1765 cm-' of Formic Acid in
......................... Acetonitrile and in 1. 4-dioxane 138
Fig. 3.25:
Fig. 3.26:
Fig. 3.27:
Fig. 3.28:
Fig. 3.29:
Fig. 3.30:
Fig. 3.31:
Fig. 4.1:
Fig. 4.2:
Fig. 4.3:
Fig. 4.4:
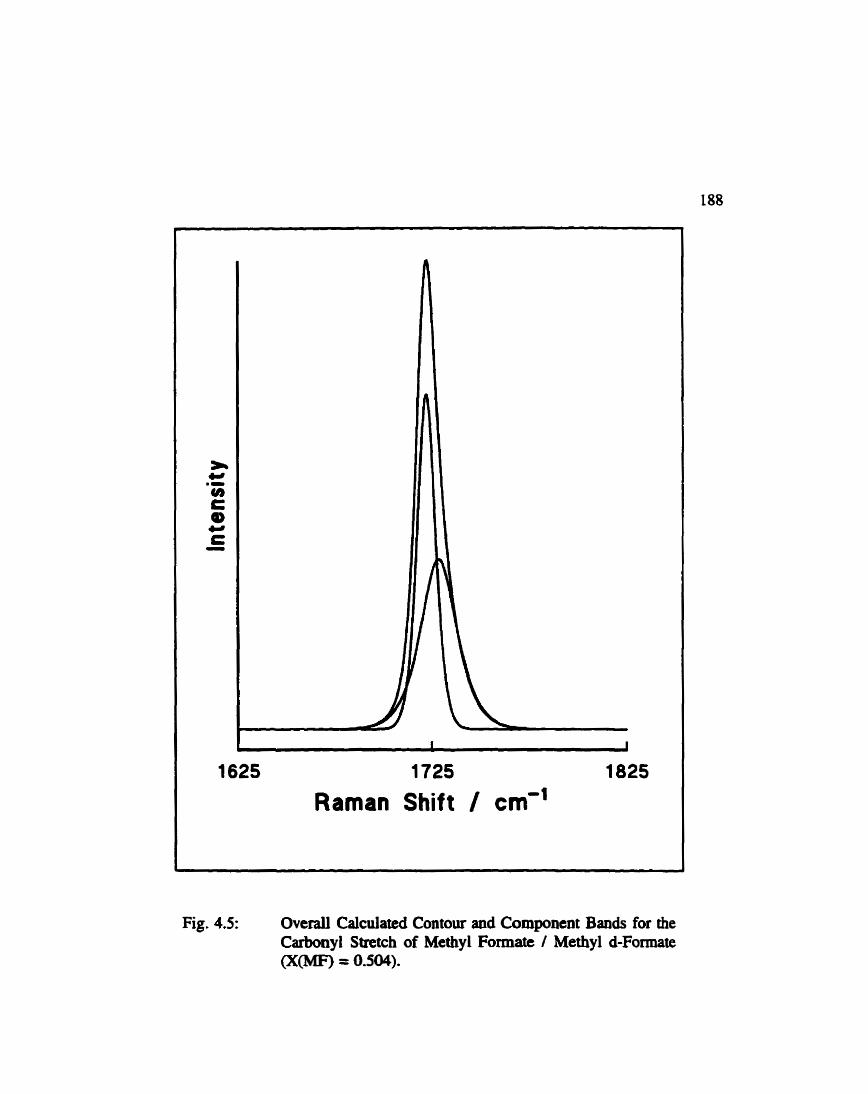
Fig. 4.5:
Fig. 4.6:
V, and V, Modes of CH2C12 in (Formic Acid + Acetonitrile) .................................. / Dichlotomethane 147
Job Plot for the (Formic Acid + Acetonitrile) / ................................... Dichioromethane 148
Determination of JB and J, for the Ninile Bands in the ............ (Formic Acid + Acetonitrile) / Dichlorometûane 154
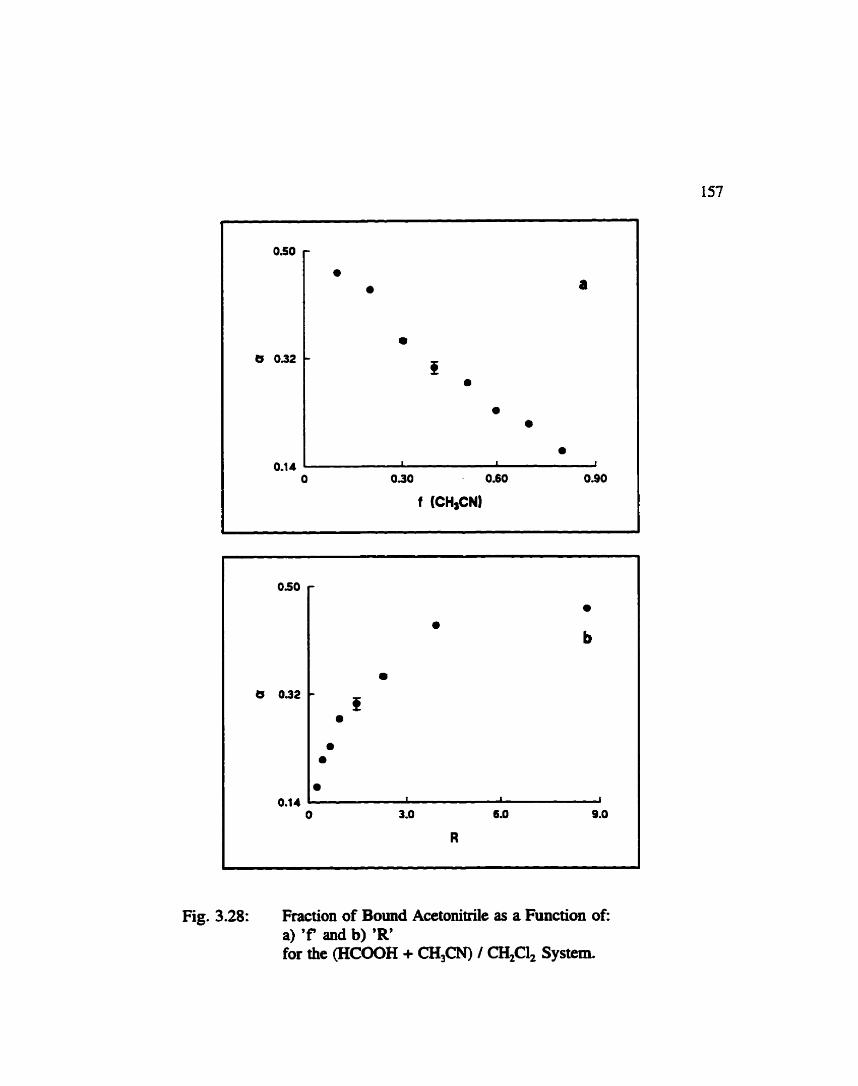
Fraction of "Bound" Acetonitrile as a Function gf 'a' and R' for the (Formic Acid + Acetonitde) / Dichioromethane ................................... 157
"Equilibrium Constanu" for the Fonnic Acid-Acetonitrile .................... Compiex for DifEerent Stoichiometries 16 1
Average Solvation Number of Formic Acid in the (Formic Acid + Acetonitrile) / Dichloromethane System vs. the Free
The Carbonyl Region of Forsnic Acid for the (Fonnic Acid + Acetonitnile) / Dichioromethane and the Variation of the Inteasity of the 1760 cm-' Band with the Concentration of
...................................... the Complex 165
........................ Spectra of Pure Methyl Formate 18 1
htropic and Anisotropic Spectra of Methyl Formate and .................................. Methyl d-Formate 184
Isotropie and Anisotropic Spectra of Methyl Formate / ................................. Methyl d-Formate 186
(Isotropic Spectral First Moment - Band Maximum) vs. M o l e F r a c t i o n f o r Methyl Formate / Acetoaitrile . . . . . . . . . . . . . . . . . . . . . . . . . . . . . . . . . . . . . . . 220
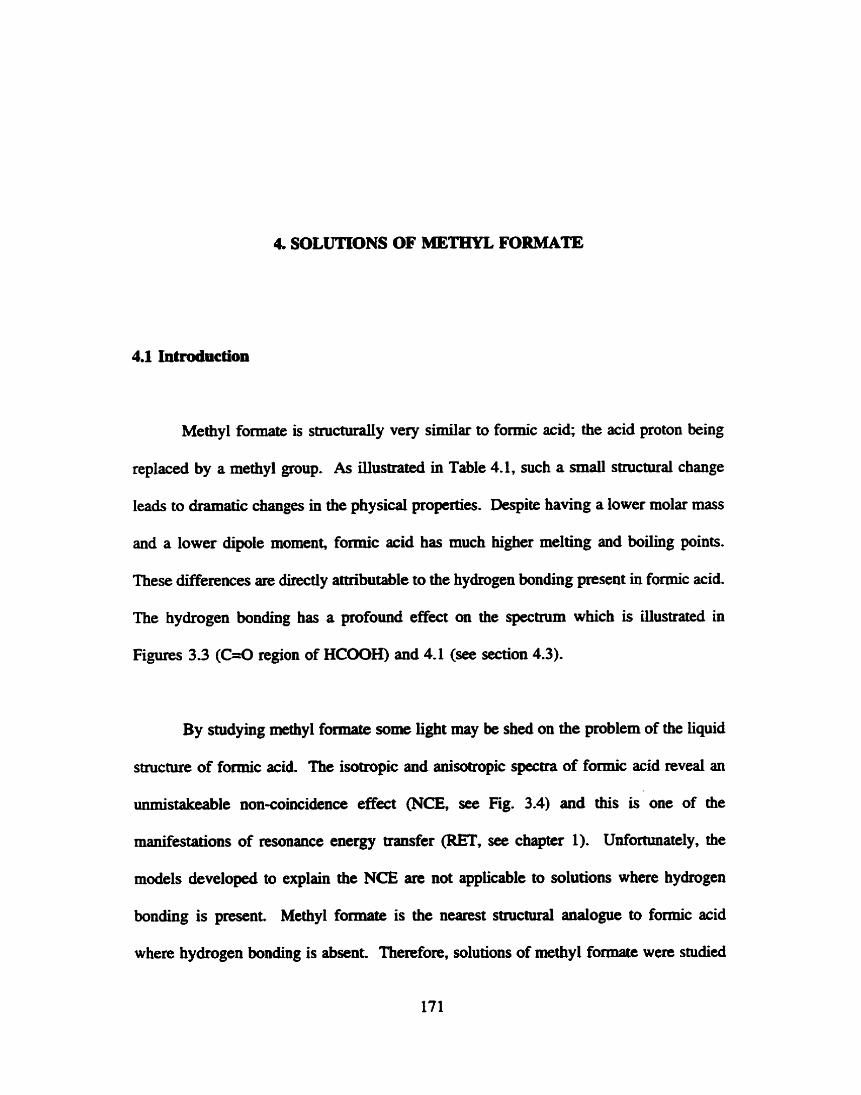
A goal of the research described in this thesis was to attain a better understanding
of the "structure" of liquid formic acid, methyl formate, and their solutions; the principal
technique has been Raman spectmscopy. Resulu from neat formic acid at rwm
temperature and at elevated temperatures have already been reporteci (1); the study of
fonnic acid solutions is a n a d extension. Previously in our gmup acetic acid was
studied as a function of concentration and temperature (2) and fonnic acid was a naturai
choice for a similar study. The high temperature results indicated fonnic a&, while
saucturally similar to acetic acid, has a significantly different liquid structure. The
explanations presented for acetic acid were not applicable to liquid formic acid. In an
attempt to m e r elucidate the structure of liquid formic acid, the study was extendeci to
include polarization results and solution studies. The inclusion of methyl formate may
appear, at first glance, somewhat arbitrary. However, methyl formate is closely related
to formic acid. The acidic proton is replaceci by a methyl group, precluding hydrogen
bonding. Hydrogen bondhg is obviously present in fomic acid and methyl formate is
the closest structural analogue where hydrogen bonding is absent. By studying this non-
2
hydrogen bonded andogue, some light may be shed on the liquid structure of formic acid.
Furthemore, methyl formate is a solvent of hoinsic interest. Methyl formate has been
suggested as a solvent for the preparation of electrolytes for Lithium batteries (3). As
such, m e r understanding of its üquid structure and interactions with other species is
desirable.
This thesis is organized as foilows. The first chapter gives a brief o v e ~ e w of the
theory and appiication of Raman spectroscopy, followed by a discussion of cesonance
energy transfer. The second chapter outhes the general experimental procedures.
Experirnental details are psented in the foliowing chapters as required. The third and
fourth chapters present the shidies of formic acid and rnethyl formate, respectively. Each
chapter has been written, as much as possible, as a seif-contained "unit". Consequently,
there is no central Hst of references - they are presented at the end of each chapter.
Throughout this thesis 'v' has been used to Rpresent fnquency in wavenumber units.
Conventionally, v with a horizontal bar is used for this. Unfortunately, the limitations
of the text editor used to prepare thïs thesis prevent the easy generation of such a
character.
Raman spectroscopy is a form of optical spectroscopy which, like infmed
spectroscopy, provides information about the vibrational modes of molecules. Smekal(4)
theoretically predicted the Raman effect (or combination scattering) in 1923 but it was
not observed until 1928. Simultaneously, Raman and Krishnan (5) and Landsberg and
Mandelstam (6) observed combination scattering. Raman later won a Nobel prize for the
achievement. Initially, Raman spectroscopy enjoyed a p e n d of widespread use because,
at the time, it was experimentally easier than infiand spectroscopy. However, infrared
instrumentation advanced rapidly and Raman spectroscopy was pushed into the
background, befoming the temtory of speciaüsts (7). In the late 1960's and early 1970's,
the invention of the laser and its subsequeat replacement of the mercury arc lamp as a
source of sarnple excitation led to rebirth of Raman spectroscopy as a practical technique.
Since then, advances in detector technology, computer control, and data anaiysis have led
to its populariq and a respecteci position among the tools for the characterization of
malter.
Raman spectroscopy is bascd on a light scattering phenornenon. A monochromatic
source (usually a laser) illuminates the sample. When an incident photon interacts with
a molecule, it can be scattend either elastically (with no change in energy) or inelastically
(with a change in energy). The former process is known as Rayleigh scattering and the
latter is caiied Raman scattering. The Rayleigh scatter is much less intense than the
incident radiation and the intensity of the Raman scattering is much weaker (ca. 10-~
Urnes) than the Rayleigh scattering.
The following short discussion of the (classical) theory of Raman spectroscopy has
been adapted fiom Guillory (8).
Rayleigh scatîering may k thought of in temis of the following equation:
M(z-O) + k v , - M(z-O) + hcvo Il]
where M(z = O) represents a molecule in the gnwnd vibrational state and hv, is the
energy of the incident photon. Normai Raman (Stokes) scattering, on the other hand, may
be written as:
where M (z = 1) represents a molecule in a first excited vibraional state and hc(v, - VJ
is the energy ciiffereuce between the incident and scattered photons. The ciifference is
referred to as a Raman shift and is equal to a vibrational, rotational or eleztmnic energy
change of the molecule. The difrence in energy between the incident radiation and the
scattered radiation is independent of the energy of the incident photon. It is, in fa* the
energy difference between the ground state and a fim excited state - a characteristic
property of the molecule.
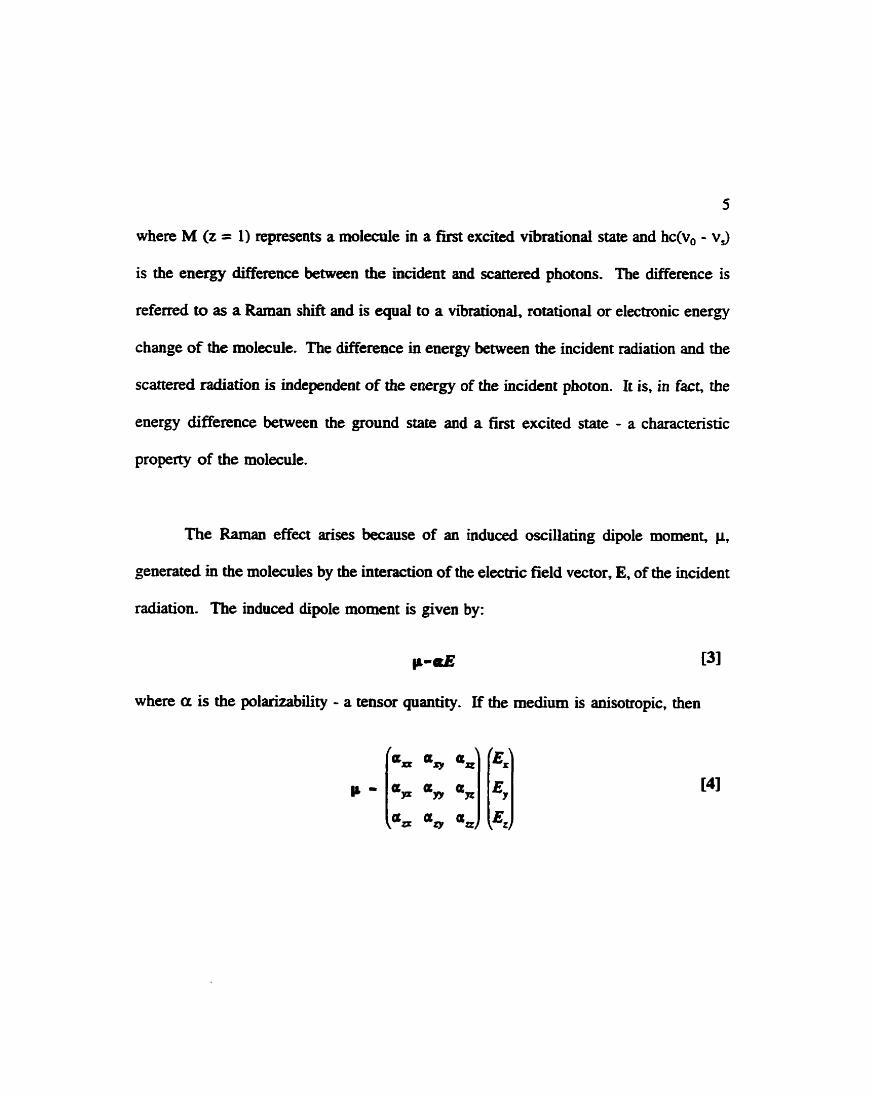
The Raman effect arises because of an induced oscillating dipole moment, p.,
generated in the molecules by the interaction of the electric field vector, E, of the incident
radiation. The induced dipole moment is given by:
P-d 131
where a is the polarizability - a tensor quantity. If the medium is anisotropic, then
As the molede vibrates the polarizability will change. For small variations about
the equilibrium position, a, (or any element of a) cm be expanded as a Taylor series in
normal CO-ordinates:
where ch' is the equilibrium polaruability dong the x direction induced by Ex. Higher
terms in this expansion have k e n neglected.
For a nomal mode undergohg simple harmonic motion:
Qk - Q; =mqo 163
where Qo is the amplitude of vibration and v, is the frrquency of the vibration.
Therefore,
7
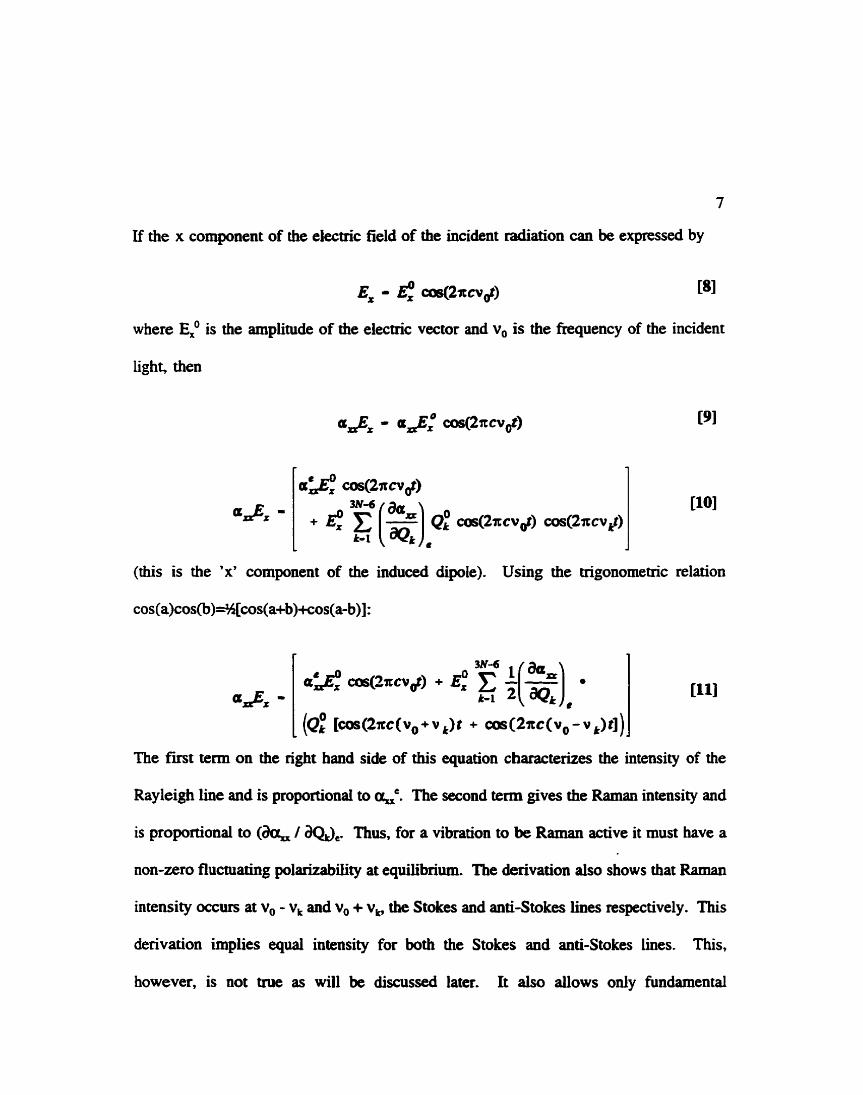
If the x compent of the electric field of the incident raàiation can be expressed by
Ex - CaS(21tcv&) 181
where E: is the amplitude of the electric vector and v, is the fiequency of the incident
light, then
(this is the 'x' component of the induced dipole). Using the trigonometric relation
cos(a)cos(b)~[cos(a+b)+cos(a-b)] :
The fmt term on the right hand side of this equation characterizes the intensity of the
Rayleigh line and is proportional to G'. The second term gives the Raman intensity and
is proportional ta (a- I Thus, for a vibration to be Raman active it must have a
non-zero fluctuating polarUabiiity at equilibrium. The derivation also shows that Raman
intensity occurs at V, - V, and V, + v, the Stokes and anti-Stokes lims respectively. This
derivation implies equai intensity for both the Stokes and anti-Stokes lines. This,
however, is not mie as wiil be discussed later. It also dows only fundamental
8
transitions. These flaws arise fiom restriction to a classical derivation and use of the
simple harmonic osciIlatm approximation. The expression above was derived using only
one element of the teasor. A full treatment requires the use of al i the tensor elements,
but the denvation for each elemnt is essentially the same.
When Raman scattering takes place, the scattered light can be of higher or lower
frequency than the incident light When it is higher, it is referred to as ana-Stokes
scattering and when it is Lower, Stokes scattering. Anti-Stokes scattering occurs when a
molecule in an excited vibrational state surrenders energy to the incident photon, thereby
relaxhg to a lower energy state. For Stokes scattering the opposite is me: a molecule
in a vibrational ground state obtains energy from the incident photon and is excited to a
higher state. Boltzmann statistics dictate that at low temperatures most molecules are in
vibrational ground States, so, because intensity is related to the number of molecules
making the transition, Stokes lines are normally far more intense than anti-Stokes lines.
In light of this faft, most Raman spectroscopy is done by studying the Stokes lines. The
intensity of Raman scattering depends on the absolute frequency of the scattered light
raised to the fourth power (see equation [lq). Consequently, excitation is usualiy in the
visible region (commody at 488.0 nm or 514.5 nm fiom an argon ion laser).
The classical treatment of the Raman eff- gives an incomplete picture. A
complete study requires the use of tirne-dependent perturbation theory and is given by
Long (9). Only a bnef comment on the resuits will be given here.
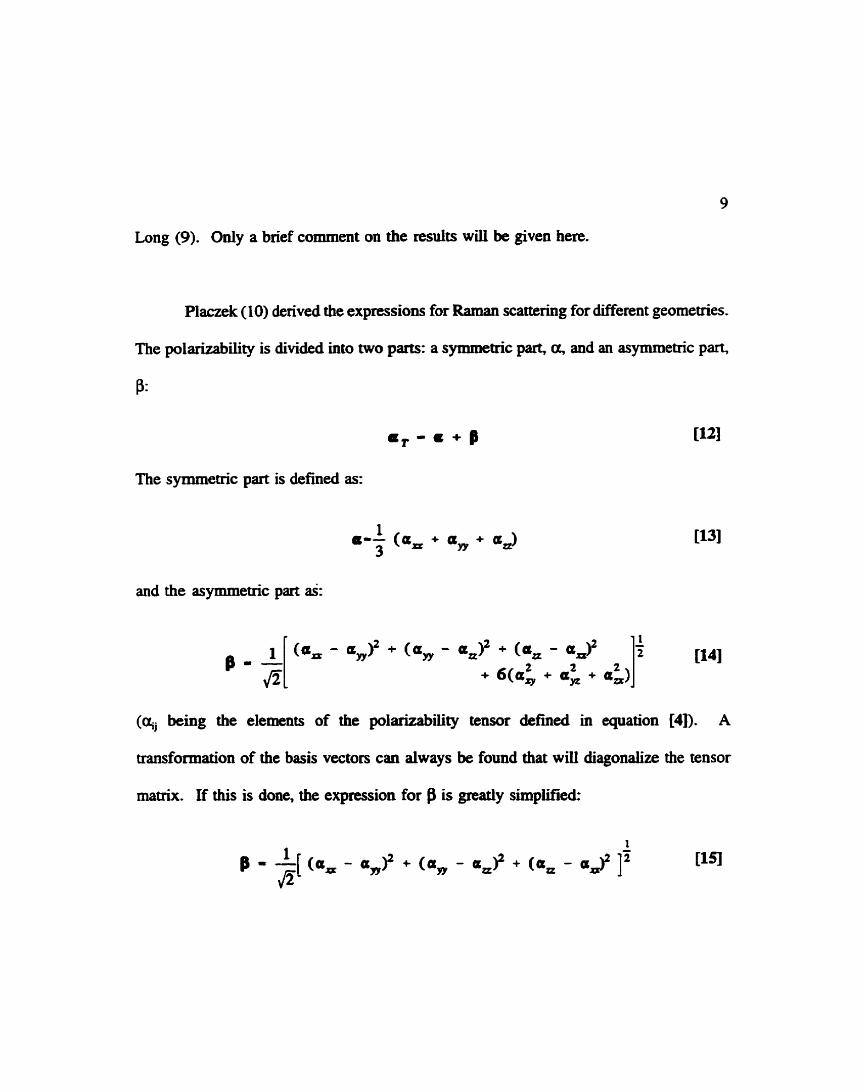
Placzek (10) derived the expressions for Raman scattering for âifferent geometries.
The polarizability is divided into two parts: a symrnetric part, a, and an asymmetric part,
a , - a + p
The symmetric part is defined as:
1 a-- (aP + a,,, + ad 3
and the asymmetnc part ai:
(a* - 4,3 + (a, - a,)' + (a, - aJ2 2 2 2
+ 6(a, + a, + a,)
(gj king the elemnts of the polarizability tensor denned in equation 141). A
aansformathn of the basis vectors can always be found that WU diagonalize the tensor
maaùc. If this is done, the expression for B is greatly simplifieci:
IO
In Raman spectroscopy the polarizability denvatives are the important quantities. These
are defined as:
where 'Q' is the vibrational normal coordinaie for a given mode.
For 90" scattering geometry, the intensity of the Stokes scattered light is (9):
where
C - - constant.
VO = incident fresuency in cm*'
hcv,, = the energy Merence between an initial state 'm' and a fina
'n'
N = number of molecules initially in state 'm'
k = the incident intensity.
11 state
For anti-Stokes "(vo + v d 4 " replaces "(v, - v d 4 " and "exp@cv, 1 kT) - 1" replaces " 1 -
exp(-hcv, 1 kT)". The constants 45 and 7 arise from orientationai averaging and are a
result of the particular experimental geometry. From this result, the ratio of Stokes to
anti-Stokes intensity is found:
This expression is found to be vaüd at thermal equilibrium (1 1). The exciting frequency
is assumed to be well separated from any electronic transitions. If oot, the intensities can
be greatly enhanced by the resonance Raman effect (1 1).
In Raman spectroscopy the polarization characteristics of the incident light are
known. Light scattered from a randomiy orîented liquid will have electrïc vectors whose
orientation is pardel (4) and perpendicuiar (13 to the orientation of the incident elecaic
vector. By using a simple Polaroïd f h either one of these orientations can be seiectively
studied. A quantity known as the depolarization ratio, defineci as:
cm be calculated and can be used to detemine stmcnual information. With 90"
scattering geometry, polarized incident light (as from an argon ion laser), and a Polaroid
fdter to analyze the scattered radiation, the depolarization ratio wiil have a value between
O and 0.75. For totally symmetric vibrations p < 0.75 (in theory, for cubic point groups,
it should be zero) while for non-totally syxnmetric vibrations p = 0.75 (the value depends
on the experirnental geometry (12)). Therefore, the number of totaîiy symmetric modes
12
cm be found easily. This helps elucidate the structure of the species under investigation.
In addition to this rather simple analysis, two intensity fimctions may be defined as
follows:
niese are the isotropic and anisotropic intmsities, respectively. The anisotropic specrnim
depends on both vibrational and reorientational motion of the molecule while the isotropic
depends ody on vibrationai motion (13). In sorne cases information about vibrational and
reorientational relaxation can be extracteci fiom the nata - vibrational and reorientationai
relaxation times may be determineci from the half-widths of the isotropic and anisotropic
spectm The phenornenon of resonance energy transfer (see section 1.3) can be studied
by examining the isotropic and anisotropic spectra as a hinction of concentration.
Valuable conclusions can then be drawn about intermolecular forces and liquid structure.
At low Raman shifts a problem arises in separating the Rayleigh scaner fiom the
Raman scatter. This is particularly pronounced over the range O - 200 cm-'. For gases
this low frequency region wiii display discrete lines h m rotational transitions. With
solids, discrete lines from the lattice normal modes are clearly observed For liquids and
solutions, however, sharp lines are not observed and separating the Raman from the
13
Rayleigh scatter becornes more difficult, Brooker, Nielsen and Praestgaard (14) and
Murphy et al. (15) have asserted that most low hquency Uitensity above 10 cm*' should
be regarded as Raman scatter. To extract the low frequency Raman data fkom the
Rayleigh wing they proposed a so called "reduced function:
w here
v
vo
I(v)
h
C
k
T
- - Raman shift in cm-'
- - frequency of the exciting line in cm-'
- - intensity at v
- - Planck constant
C - speed of light
- - Boltzmann constant
- - temperature in Kelvin.
This function corrects the intensity for separation from the exciting îine and for variations
in the Boltzmann distribution with temperature. Its utility is greatest when studying bands
at low ftequency or solutions at high temperature. An expression can, just as above in
the intensity format, be written for the isotmpic spectnun:
1.2.2 Practical Aspects of Raman Spectroscopy.
Raman spectroscopy has some very useful advantages which make it applicable
to a wide variety of situations. These advantages can be crudely classifieci into three
categones: chernical, instrumental, and sampling.
Raman spectroscopy has some important "chemical" advantages. Fit of dl, like
infrared spectmscopy, it can be used for "fingerprinting". AU molecules will have a
characteristic specmim and the spectnim can be used to detexmine a molecule's presence.
In practice, however, because of band overlap, weakness of bands, and other problems,
it may be di"cu1t to distinguish a given molecule in a complex system. A second
"chemicai" advantage is that water is a weak Raman scatterer, while it is a very strong
infrared absorber. Consequently. Raman spectra of aqueous systems are quite easy to
collect. Studies of important biological and biochemical systems where. clearly, aqueous
species are of great importance, are quite straightforward. A M e r "chemical" advantage
is that the intensity is linearly dependent on the concentration of the scattering species.
This is a great benefit for aualytical applications.
15
Most Raman spectroscopy is done using excitation kquencies in the visible
regim of the electromagnetic spectnim leading to important instrumental benefits.
Aithough the fiequency difference between the incident and the scattered light is in the
infrared, the light analyzed by the spectrometer is in the visible. Therefore, aii the opticai
components and sample cells involved in the Raman experiment can be made from g k s .
There is no aeed for special optical mitterials which may be fiagile, expensive or difficult
with which to work. In addition, the entire vibrational spectrum (O - 5000 cm-') cm be
studied easily without having to change the optics of the spectrometer. The use of glass
as a material for cell construction means cells for non-ambient conditions cm be fairiy
easily constmctd The use of lasers and visible Iight leads to another advantage of
Raman spectroscopy: the use of fibre optics. Fibre optics allow the collection of in situ
data without having the spectrometer in sinr (16). Data cm then k coliected from in vivo
systems (obviously very important in biological applications) or fiom hostile (either to the
spectrometer or the operator!) envuOmnents.
Sample handling in Raman spectroscopy is generaily very easy. For example,
solutions and liquids can be containeci in a rneiting point capiüary tube or a glas test
tube. Sample preparation for solids cm be equaliy easy. Using a microscope attachment
and assuming the solid is neither moistwe nor air sensitive, a spectrum c m be collected
of a sample placed on a microscope sliâe. Even when the solid is sensitive, collection
of a spectrum may be possible through the walls of the ceiï containing it without
16
distiizbing the solid. Single crystals can be mounted and positioned with a goniorneter
head. The amount of sample required for a Raman spectmm is, in general, very smd.
For example, when studying Liquids or solutions and using melting point capiilary tubes,
spectra c m routinely be c o k t e d from 0.25 - 0-50 mL of sample. Raman spectroscopy
has the M e r advantage of king a non-destructive technique; the sample can be
recovered and used again.
Unfortunately, Raman spectroscopy is saddled with some disadvantages. First, and
most seriously, it is a very weak effect. Because of this, the concentration of the species
must be fairly high to obtain a good spectruxn. Even when the concentration of the
analyte is quite high a good spectqpn may only be obtained with large time constants and
signal averaging. Consequently, considerable time may be required to obtain a good
specrnini. This is especiaiiy true with a monochanne1 instrument. The second big
problem with Raman spectroscopy is fluorescence. Visible radiation is commonly used
for excitation in Raman spectroscopy and iadiation at these fnquencies can sometimes
induce fluorescence. Fluorescence may be panicularly pronounced for highly conjugated
systems. Compared to the Raman effect, fluorescence is a very strong efiect and can
simply overwhelm the Raman signal. Extraction of usefbi data rnay then be impossible.
Even srdi concentrations of fluorescent impurities c m cause serious problerns.
Forninately, the development of Fï-Raman tccbaiques have reduced this problem because
near-infkared ftequencies are used for excitation. Similarly, experiments on coloured
17
samples can be difficult If the sample absorbs at the fresuency of the excithg radiation,
unwanted thermal or photochemical effects may occur. Fluorescence rnay also be a more
serious problem in coloured samples. These problems can be overcome by using longer
wavelength excitation (e.g., krypton or helium-neon lasers), but this leads to a loss of
sensitivity as govemed by the v4 factor in the intensity expression (equation 117).
A schematic diagram of the typical Raman experiment is shown in Fig. 1 .L (13).
In the early days of Raman spectnxcopy the excitation source was often a mercury arc
lamp (the "Toronto" arc lamp). Since the 1960's the arc lamps have been replaced by
lasers and all Raman spectroscopy is now done with lasers. The most common types of
lasers are the argon ion (lines at 514.5 nm and 488.0 nm) and krypton (568.2 nm and
647.1 nm). Other lasers are also used including the helium - neon laser and dye lasers.
In choosing an exciting line a trade-off must be made between the socaiied "va
advantage" and the possibility of photochemical reaction. The "v4 advantage" refers to
the fact that the intensity of the scattered light h a s e s in proportion to the fourth power
of the frequency of the exciting light Unfortunately, the use of higher ffequency exciting
radiation may lead to unwanted photochemical effects. Furthemore, using ultraviolet
radiation takes away the advantage of being able to use glass cells and optics. To have
LA
FL
SA
CL
PA
SC
MC
Dl, D2
CO
Fig. 1.1:
laser (often argon ion or krypton ion)
focusing lem
sample
camera lem
polarization analyzer
scrambler
monochromator
detectors, either monochanne1 or muitti-channel
computer for acquisition and analysis of spectral data
Schematic of Layout of a Typical Raman Experiment.
19
a choice of exciting lhes is useful in order to overcome possible fiuoresfence and colour
problems.
In principle, the light scattered from the sample can be analyzed at any angle
relative to the incident radiation. In practice, three geometries are used W, 180°, and
360" @ack scattering). The 90" scattering geometry is the most common. The light is
focused into the spectrometer by a camera lem through the entrame dit. If polarization
measurements are king perfonned, the polarization analyzer is mounted in fiont of the
entrance slit. Between the polarization discriminator and the dit there is a quarter wave
plate. The plate converts the linearly polarized light to circularly polarized light,
effectively "scramblhg" it. Scrambiing is necessary because spectrometer gratings often
have different transmission efficiencies for the two different orientations of the electric
vector of the scattered light The monochromator then splits the bght into its component
wavelengths. In the case of monochamel detection, the intensity of the light at each
wavelength is meanired sequentidy and the detector is usually a photomultiplier tube.
Multichannel detection is also possible. In this case, the exit dit fkom the spectrometer
is eliminated and ai l the wavelengths of the scattered light can be dispersed over a
multichannel detector such as a photodiode amy or a charge coupled &vice detector.
The multichannel detector provides a multiplex advantage that an entire specmun (or
any part thereof) can be recorded in the tirne required for a single point on a single
cbannel device. Tbus, a large number of spectra may be averaged to improve the signal-
to-noise ratio.
In most modern Raman instruments a computer controls the spectrometer and
acquires spectral data Photon counters can be easily c o ~ e c t e d to microcornputers to
coilect &ta in a digital format Once collected the data can be easily treated on the
computer. Baseline correction, spectral averaging, bandfitting, etc., allow the extraction
of useful information (both qualitative and quantitative) even fiom relatively weak peaks.
la2*4 Appücations of Raman Spectmscopy
Because of its several advantages Raman spectroscopy has found widespread
application. It is a technique that may be appiied to gases, liquids or solids. In practice,
gases, because of their low densities and the inherent weakness of the Raman effect, are
not as commonly studied as Liquids and solids. Raman spectroscopy is ofkn used in the
study of solutions. Because water is such a poor Raman scatterer, Raman spectroscopy
is especiaily good for studying aqueous systems (13,17). Application to biological
systems foilows quite nahirally fiom this property (18). Bands may shift, change
intensity, or develop in ilesponse to structural changes in the solution. In some cases
kinetic (1) or thermodynamic (2) variables can be quantifieci. Raman spectroscopy has
also found application in the study of electrodes and processes occuning at electrode
surfaces. Certain molecules when adsorbad on particdar metals (gold, silver, and copper
being the primary exampies) have greatly enhanced Raman signals - an effet known as
surface enhanced Raman scattering (SERS). It dows the study of species adsorbed on
metal surfaces at mono- or sub-monolayer concentrations (19). Raman spectroscopy can
also be used in the study of the dynamics of non-electrolytes. ResuIts from the
anisotropic and isotropic spectra can be used to caicuiate vibrational and reorientatïonal
correlation hctions (20). Clearly, based even on this short List, Raman spectroscopy is
a technique of great utiiity.
13 Resonance Energy TrPnsfer
In pure liquids vibrations of neighbouring molecules are coupled because of the
interrnolecular interactions between them (21)- If the molecular orientations are random,
the net effect is the broadening of vibrationai bands. If, however, the aiignment of the
molecules is not random, then the transition dipole moments of two neighbouring
molecules may couple. This will give rise to in-phase and out-&phase modes of this
larger unit When this phenornenon occurs, resonance energy transfer (RET) has taken
place, and it can be observed spectroscopicaliy. RET most clearly manifests itself in a
Raman non-coincidence effect (NCE) which is a difference in the maxima of the isotropic
and the anisotropic components of the spectrai bands. ï h e difference, defineci as AV =
22
v-- - v, (in miL), is h o s t always positive. When the ciifference is negative, it is
referred to as the anomalous NCE (22) and this has been observed in alcohols (23).
Furthemore, RET provides a "new" pathway for vibrational dephasing, so it may affect
vibrational bandwidths.
Changes in the conditions of the substance uader investigation lead to changes in
the spectra. If the species is diiuted in some inert solvent, the NCE graduaily disappean.
Mirone and Fi (24) reported that Av becomes zero at a finite, non-zero concentration,
somewhat dependent on the nature of the solvent They reported that the shape of the Av
vs. concentration graph depends on the relative values of the dielectric constants of the
solute and solvent The slope increases with increasing concentration of the solute if the
solvent has a higher dielectric constant than the solute. The slope decreases when the
reverse is true. Also, when the solute is diluteci, the frequency of the maximum in the
anisotmpic spectnim was found not to change signifïcantly (25). However, the kquency
of the isotropic maximum inmased and tended toward the fiequency of the anisotmpic
maximum. Secondly, when the tempe- was raised, Av demaseci (21). Thirdly,
inmeashg the pressure usually causes the fkquency maxima of both the isotropic and
anisotropic spectra to shift in the same direction (26) but not necessarily by the sarne
amount.
Different workers have taken different approaches to the development of a theory
23
to explain the non-coincidence effect (NCE) (24,27-36). In chapter 4 ody some of these
models (24,29-34) are applied to solutions of methyl formate in methyl d-formate and in
acetonitde. However, for the sake of completeness, each of these approaches will be
bnefiy summarked here.
1.3.1 Theory of Scheibe (279)
Scheibe and Doge (27) and Scheibe (28) deveioped a theoretical matment of the
non-coincidence effat. Their treatment did not include the effects of dilution. They
began by writing the dipole potentid between two molecules 'A' and 'B' as:
where
R = the distance between the dipoles
Km = a factor related to the orientation of the dipole moment vectors.
This dipole interaction cari cause an additional energy differenfe between the ground and
the hrst excited vibrational states. By applying perturbation theory to moiecule 'A' this
additional energy difference is given by:
The fust terni in the large square brackets arises h m mechanical anharmonicity and
disappears if a harmonic potential is used. The second term is nom the electrical
anharmonicity and occm if the dipole moment is not a linear fimction of the normal co-
ordinate. A vibrating molecuie will interact with the field created by the dipole moments
of its neighboun. The fust and second te- in the large square bmckets arise from this
interaction and the interaction leads to a shift in the unperturbed frequency. The last term
originates fiom transition dipole coupling between 'A' and 'B'. This wiU ody occur if
'A' and 'B' are identical and the same vibrational mode for each is considered- This will
lead to splitthg of modes which are normally singly degenerate, i.e., a non-coincidence
effect. The size of the spiitting WU be ditectly atfected by 'R' and 'Km'.
1.3.2 Theory of Fini and Minwn (21,t139)
Fini and Mirone (21) proposed a fairly simple mode1 to explain RET. They
assurned aprotic, dipolar liquids consist of small m o l d a r clusters within which there
exists some partial order. The molenilar dipoles of the molecules in each cluster c m
align thernselves either paraUeI or anti-paraile1 to a cornmon direction. The presence of
a permanent dipole moment, therefore, ailows the formation of some short range order.
The transition dipole moments may then couple and resonance energy transfer c m take
place. The orientational order will exist up to a distance such that the energy of
electrostatic interaction between the two dipoles equals the thermal agitation energy (2 1).
Typicaily. this distance is a value that allows the molecules in the fmt coordination sheIl
to anain a preferential orientation with respect to the central molede. Because E T oniy
occurs berneen identical molecules, dilution (which replaces soiute moIecuies in a co-
ordination shell with solvent moIecules) will decrease the ability of the solute molecules
to couple. As dilution continues, RET will decrease and the non-coincidence effect will
duninish. Evenhiaily, as mentioned above, Av vankhes at a finite, non-zero
concentration. At this point the isotropie, anisoaopic, and infrared peak maxima should
ail coincide. This mode1 can also explain the effm of increased temperature. As the
temperature increases, the greater thermal agitation reduces the size of the clusters and
disrupts alignment of the molecular dipoles inside them. This reduces the extent of
resonance energy transfer and reâuces Av.
Fini and Mirone derived an empirical equation to relate the non-coincidence (Av)
to the concentration of the soiute and the dielectric constants of the solute and soivent
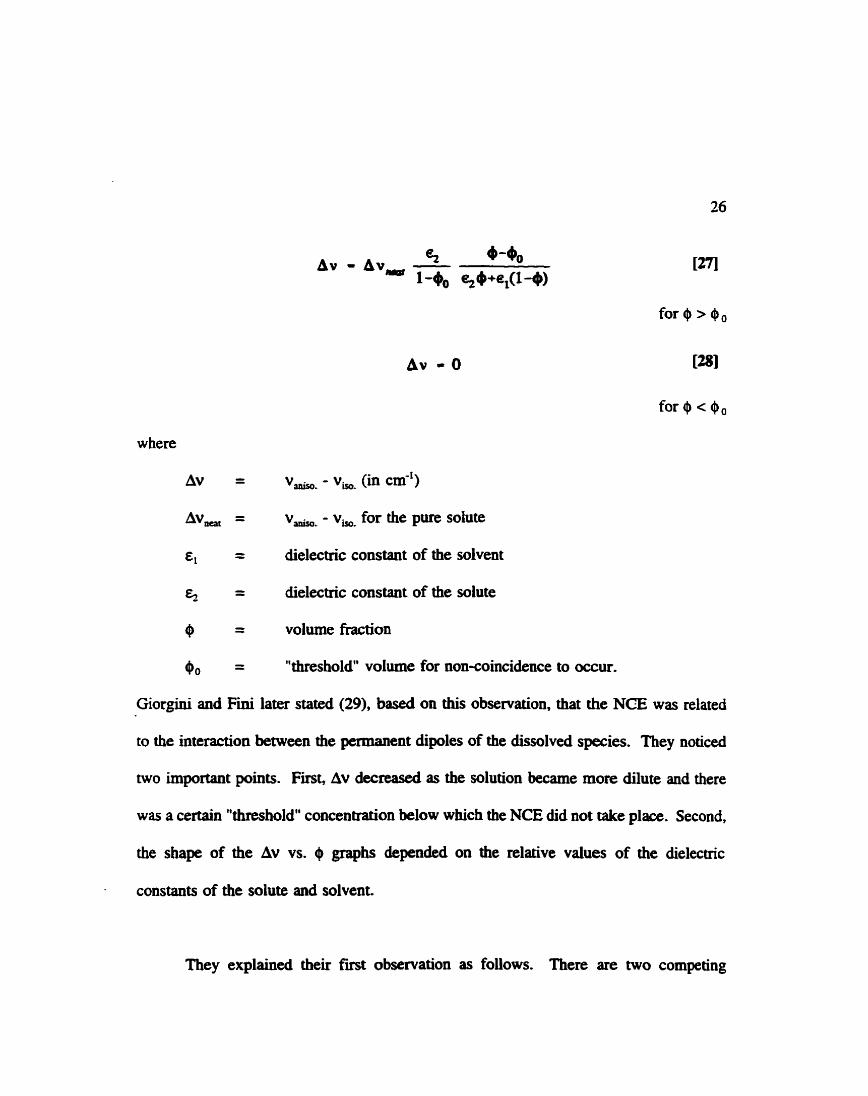
(24):
where
Av = v-. - v, (in cm")
Av, = v-* - v, for the pure solute
€1 O - dielectric constant of the solvent
Ez O - dielectric constant of the solute
4) O - volume fraction
O 0 - - "threshold volume for non-coïncidence to occur,
Giorgini and Fini later stated (29), besed on this observation, that the NCE was related
to the interaction between the permanent dipoles of the dissolved spezies. They noticed
two important points. First, Av decreased as the solution became more diiute and there
was a certain "threshold" concentration below which the NCE did not take place. Second,
the shape of the Av vs. graphs depended on the relative values of the dielectric
constants of the solute and solvent.
They explained their fmt obmvation as follows. There are two competing
processes for vibrational depûasing. The first is resonance energy transfer in which a
quantum of vibrational energy is traasferred b r n one oscillator to another. The second
is simple energy dissipation through collisions and the me. If two oscîllators are coupled
at time t = O, there is a finite, non-rero probability of vibrational energy transfer fiom the
excited oscillator to the second osciilator. As time passes the probability that transfer has
occurred inmeases. At some tirne, T, the probability will be unity. If .t is long relative
to the t h e for simple energy dissipation resonance energy transfer does oot take place.
As the solution is diluteci, t becomes longer and longer so RET becomes less "efficient".
At some f ~ t e concentration T is so large RET does not take place and the splitting
disappears.
The explanation of the second observation (that the shape of the Av vs. @ graphs
depended on the dielectric constants of the "active" and "solvent" species) was based on
two assumptions. Fit, the coupiing of the two modes takes place by transition dipole -
transition dipole (TD-TD) coupling. Each molecuie will conaibute to Av a term which
is proportional to:
28
where 'r' is the distance fiom the reference molecule. Secondly, the isotropic -
anisotropic separation is directly related to the orientational correlation induced by static
dipolar interactions. Under these assumptions, they showed that:
where
E - - dielectric constant of the solution
N - - number density of solute
d - - minimum distance of approach between two molecules
Therefore, the Av versus concentration c w e will have a dependence on E. This value
can be calculated assuming a linear relationship between the solution dielectric constant
and the volume fiaction of the active species (31):
w here
EL - - dielecaic constant of the solvent
E2 = dielectric constant of the solute
@ - - volume firaction of the "active" species
In some cases they found their mode1 did not agree with the observed nsults. Two
possible explanations were given. Fit, E might not be a hear function of volume
fraction. Second, and most importantly, specific, possibly short range, interactions might
29
not be adequately described by the bullc dielectric constant Furthemore, such
interactions could affect the transition dipole moments leading to even pater errors.
If the vibrationai coupling which le& to RET occurs through the transition dipole
moment, then Av shouid be proportional to laCi /a~I~ (37). In other words, the
separation of the isotropie and anisotropic peak maxima should be related to the intensity
of the infrared transition. Indeed, it is generally the case that the largest non-coincidence
effects are observed for strmgly absorbing modes (e.g., the carbonyl stretch). The NCE
has been observed, howevcr, for the V, vibration of 1,25-thiadiazole (38) which is very
weak in the iafrared. McHale has asserted (30,31) that the transition dipole - transition
dipole interactions are not the only means of couphg. ûther possible sources are
hydrogen bonding, quadmpoIequadrupole, and dipole-dipole interactions. McHde
determineci that orientation-dependent intermolecular forces can give rise to an NCE even
in the absence of local order.
Wang and McHale (30) performed an extensive and detailed thwretical analysis
of the non-coincidence effect. They concluded, contrary to the prevailing wisdom, that
short range order is unnecessary for a non-coincidence effect to be observed. Short range
30
order may enhance the non-coincidenfe effect, but it is not at the rmt of the efiect. The
fundamental reasoa is that the resonance coupling potential between two molecules is
angle dependent The angle dependent intemoledar forces modify the force constants
of the harmonic osciliators Ieading to an anisotropic frequency disaibution. Isotropie
Raman scattering samples the average of the frequency dimibution but anisotropic Raman
scattering samples the anisotropy of the distribution. Because of this, the fmt spectral
moments in the isotropie and the anisotropic are different and a NCE is observed.
Further, Wang and McHale's derivation showed the splitting is proportional to the number
density ("concentration") of the solute and inversely proportional to both the free
oscillator fiequency and the effective mas. At infinite dilution the spiining should vanish
and this is commonly observed. In addition. McHale and Wang showed that if the
couphg is assumed to arise from iaduced dipole interactions the relative splitting (i.e.,
the non-coincidence splitting for a given solution divided by the non-coincidence splitting
for the pure solute) relies linearly on the infrared intensity parameter 1 ap/w 1 and is
always positive. Therefore, the size of the NCE should be related to the infrared
intensity. As was mentioned above, strongly intense infrared transitions are most iikely
to have a large NCE.
In a subsequent paper (31) McHale examined the dependence of the non-
coincidence effect on the concentration of the active (solute) species. Shc argued that a
strong angle dependent intermolecular potential could result in concenaaiiondependent
31
peak positions for the isowpic and anisotropic spectra, Furthenaore, any intermolecular
forces strong enough to give an NCE could also be expected to cause the bandwidths in
both the infiared and Raman spectra to depend on the concentration.
The derivations carried out in this paper (3 1) were tested for a mixture at dilute
concentration (the so calied "weak interaction regime") where the effects of molecular
association can be neglected; the primary means of vibrational coupling is through the
transition dipoles. (However, this is not the only means by which resoaance energy
transfer may occur. Hydrogen bonding is another type of interaction which cm lead to
a large isotropic-anisotropic splitting (3941)). Widiin these assurnptions the following
expression was derived for the splitthg:
- - Avogadro's number
- - rnolar volume
- - reduced oscillator mass
- - volume fraction of the active species
- - l WaQ I
- - the dipole moment
- - fne oscillator angular frequency
E - - static dielectric constant of the solution
d - - minimum intermolecular distance
= aaisotropic spectral first moment (in angular kquency)
M, = isotropie spectrai Wt moment (in angular frequency)
To make cornparisons to experimentai obsemations, it is necessary to know the
dependence of the dielectric constant on concentration. McHale assurned E is a function
of the volume fiaction (see equation [31])- It is then possible to re-write equation 1321:
AM - AM,
For systems in which x>l or x=l this nsult is in fairly good agreement with experimental
results. For xcl the appiication of McHale's mode1 (because of some underlying
assumptions) is not really appropriate. This is the case for polar molecules in a non-polar
solvent where molecular association (short rage order effects) may be important.
33
Mirone (33) disputed McHale's result given above. He believed McHale's
equation (equation 1321) was too simplistic anci needed to be replace& He suggested
McHaie's equation shodd be re-written as:
where
n - - refractive index of the solution.
Mirone compared the splitting (for neat acetone) predicted by his equation with that of
McHale and found his modification gave a better result.
13.4 Theory of Logan (34,359
Logan outlined his theones on the non-coincidence effect in two papers. One of
these (34) dealt with isotopic binary mixtures and the second (35) with more general
systems. bgan accepteci Wang and McHale's (30) hypothesis of an angle dependent
interaction potential (arising from permanent dipolar interactions) whicii preferentially
weights the relative alignment of a pair of molecules between which resonance energy
transfer can take place. He stated that many-bdy molecular interactions are responsible
for the details of liquid structure and thus îhe appearance of the non-coincidence effect
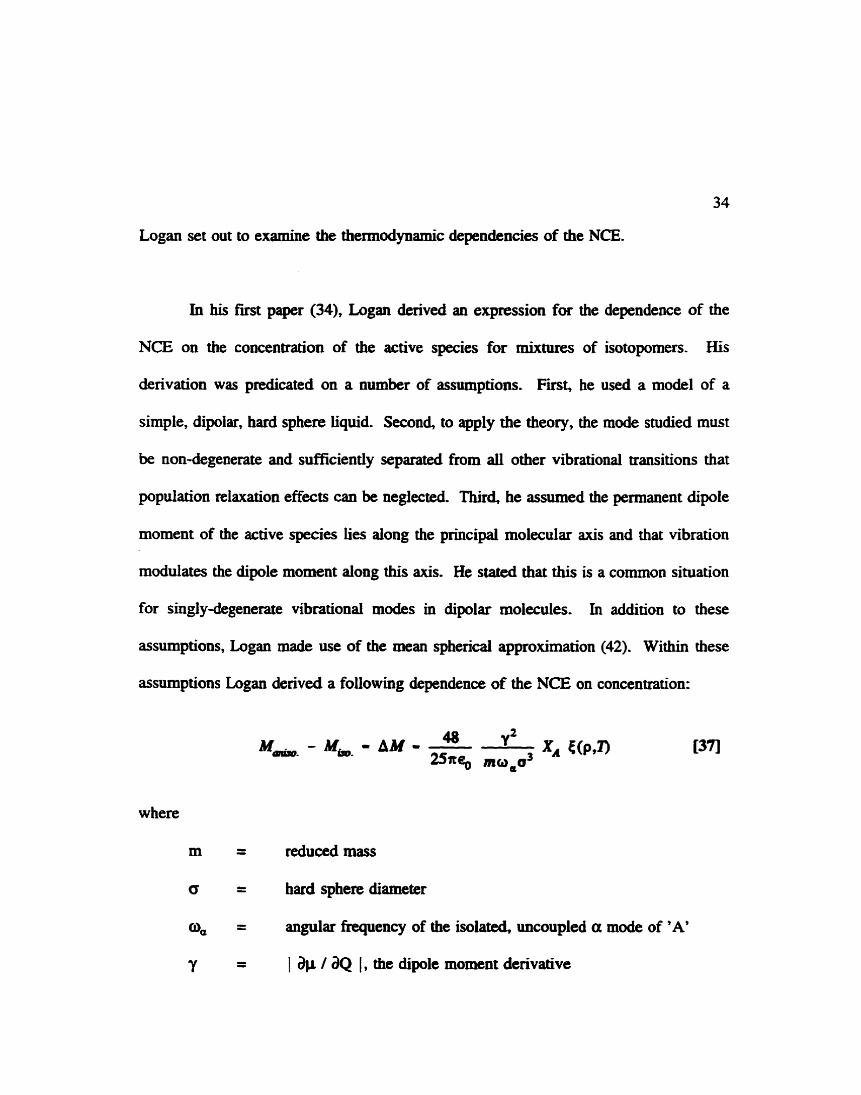
Logan set out to examine the thennodynamic dependencies of the NCE.
In his fust paper (34)' Logan derived an expression for the dependence of the
NCE on the concentration of the active species for mixtures of isotopomers. His
derivation was predicated on a number of assumptions. First, he used a mode1 of a
simple, dipolar, hard sphere liquid Second, to apply the theory, the mode studied must
be non-degenerate and sufficiently separated from all other vibrational transitions that
population relaxation effects c m k negiected Third, he assumed the permanent dipoie
moment of the active species lies along the principal molecuiar axis and that vibration
modulates the dipole moment along this axis. He stated that this is a common situation
for singly-degenerate vibrational modes in dipolar molecules. In addition to these
assumptions, Logan made use of the mean spherical approximation (42). WiKithin these
assumptions Logan derived a following dependence of the NCE on concentration:
48 M-- - AU'- - AM- - XA F b l ) 25n% m 0 p 3
where
m - - reduced mass
Q = hard sphere diameter
- a= - angular fquency of the isolated, uncoupled a mode of 'A'
Y - - 1 av 1 aQ 1, the dipole moment denvative
P = number density of the solution
Eo = permittivity of a vacuum
M = spectral fust moment of the anisotropic or isotropic specmim
- XA - mole fraction of the active species, 'A'.
c(p,T) is a value fond by solving:
whene
p,, = permanent dipole moment
e = U P ? ~
&,T) is a function of p and T alone, independent of X,. Therefore. if number density
and temperature are constant,
where
mmt spiitting for pure species 'A'.
This linearity only applies to an isotopic mixture.
Logan then extended his study to examine non-isotopic mixtures (35). His
36
analysis was based on the same assumptions as in his previous paper (34). UnWEe the
isotopic mixtures, the spiitting does not necessarily have a iinear dependence on the mole
fraction of the active species (see, for example, (21,24,43,44)). For a non-isotopic
dilution the abilities of the solute and solvent molecules to orient a solute pair ciiffer.
Dilution can cause new intermolecular forces to become important These new forces
may arise fiom sources other than the active pair and will have d i f f e ~ g abilities to aiign
the active pair than for the original, pure solvent. Therefore, there is no simple h e m
dependence of the NCE on the mole fraction even at constant temperature and number
density. Furthemore, most experimental work is done at constant temperature and
pressure, so the mole fraction and number density dependencies of the NCE become
entwined.
In this second paper (35) Logan examineci a simple dipolar, hard sphere mixture
(of the "active" species, 'A', and the "solvent" species, 'B') in which the interaction
potential consisted of two parts: 1) a sum of pairwise additive bard sphere interactions
with hard sphere diameters a, and 4; 2) a dipolar part arising from the mutual
interaction of the permanent dipole moments of both spezies. Logan then defined a
function:
w here
P - - total nwnber density
R - - distance between interacting molecules.
The function h/(R) gives the 'R' dependence of the contn'bution of an anglar function
(which is related to the relative orientation of the active species) to the painuise
distribution function. The splitting depends on @X,&I'):
w here
speed of light
& - &- for the a mode of species 'A' - a function of
xA' p a d 'I'
effective m a s for the a mode of species 'A'
ftee osciilator angular frequency for the a mode of species
'A'
hard sphere diameter of 'A'
1 &L / aqd for the a mode of species 'A'
perminivity of a vacuum
(and t, has dimensions of the). In the low number density b i t :
where
The splitting can then be written as
where
and
(eAo(p,T) is defmed by equation [44D. In the low awnber density domain the alignrnent
effects which facilitate resonance energy transfer (and therefore non-coincidence splitting)
arise from the interaction of the permanent dipoles on a pair of "active" moleniles. The
quantity cA0(p,T) embodies the pair-wise aiignments of the active molecules. Outside the
low number density limit, o k r molecules of other species wil l act to preferentially
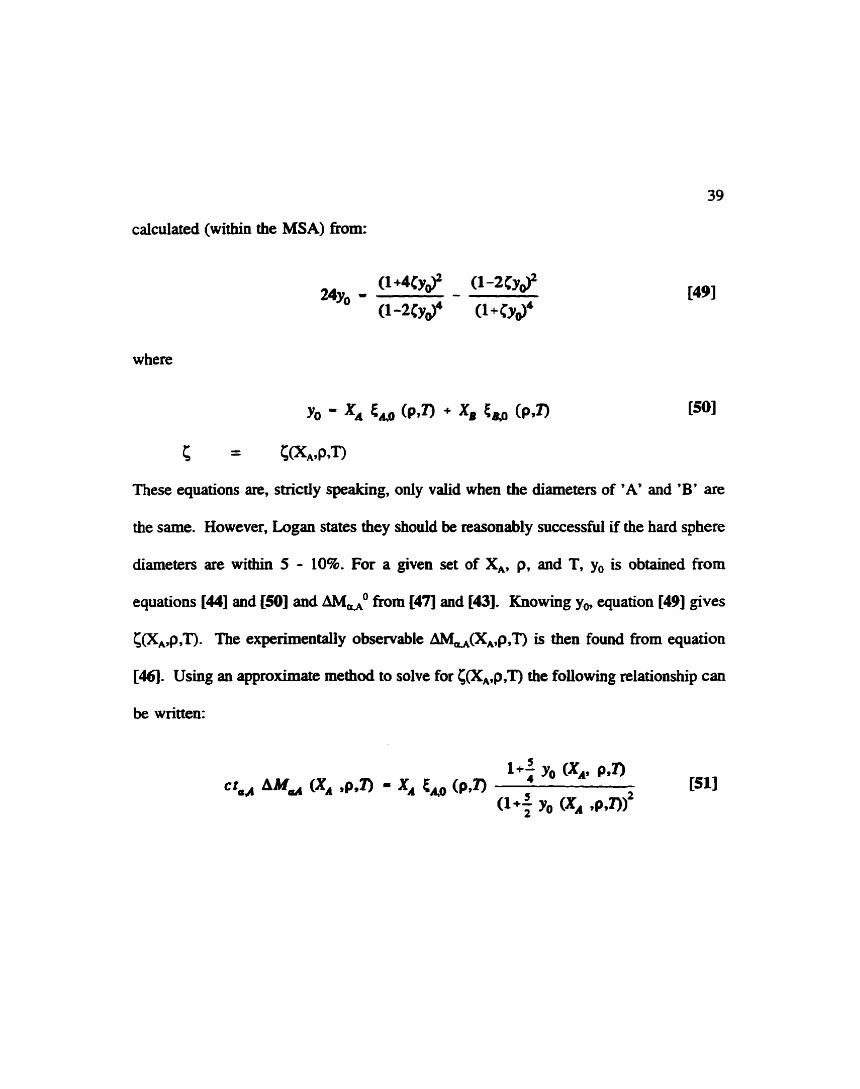
weight the relative alignment of any pair of RET active molecules. c(X,9,T) may be
calculated (within the MSA) fiom:
where
Y(, - X, trio (9.1) + x, e, cm
c = C(X,,P.T)
These equations are, strictly speaking, only valid when the diameters of 'A' and 'B' are
the same. However, Logan States they should be reasonably successful if the hard sphere
diameters are within 5 - 108. For a given set of X,, p, and T, y, is obtained from
equations 1441 and 1501 and fkom 1471 and 1431. Knowing y , equation [49] gives
c(XAp9T)- The experimentally observable aM,(XA,p.T) is then found nom equation
1461. Using an approximate method to solve for C(X,.p,T) the foliowing relatiomhip can
be written:
40
Application of this theory requkes the experimenter to rneasure the number density of the
solutions at each concentration.
According to Logan. previous workers (24,î9,3 1,32,33) trïed to simpliv this result.
Simple dielecaic screening or continuum dielecaic theory arguments were employed to
scale the low number density pair alignment effects embodied in t,,(p,T) by a function
dependent on the index of refraction andor the dielectric constant of the solution. Logan
feels this approach is not Wrely to adequately reflect the microscopie origins of the NCE.
Logan made some important assumptions. First, the dominant anisotropic
intermolecular forces responsible for alignment effects are fiom dipolar interactions.
Second, the species involved are dipolar hard spheres with comparable effective hard
sphere diameters. Furthermore, Logan omitted from his theoretical treatment the effects
of short range anisotropic intermolecular interactions. Such interactions c m lead to
orientational alignment and either a positive or negative contribution to the non-
coincidence effect.
13.5 Sr imm~rg
The preceding sections have presented a brief o v e ~ e w of the three main
41
theoretical approaches to the NCE and its dependence on concentration. The main result
of the treatments of Wang and McHale (30) and McHale (31) is that short range order
in the Liquid is not necessary for the noncoincidence effect to occur. The fMdrunenta1
reason is because of an angle dependent intermolecular potential. Fini et al. (24,29)
derived an empirical equation for the dependence of the splittïng on the concentration.
They dso poshilated the existence of a "threshold volume" below which the NCE does
not appear. These two approaches made use of dielectric screening arguments to simpw
the interaction of two dipoles in the solution. On the other hand, Logan developed a
theory to explain the effect without ushg this type of simplification. He derived a more
detailed equation for the dependence of the splitting on concentration using a more
rigorous model of liquid structure. Because of this, its range of application is narrower
and certain more restrictive conditions must be met, Later in this thesis the data for
methyl formate in methyl d-formate are compared to Logan's theory for isotopic dilution
(34) while the data for methyl forniate in acetonitrik are compared with the models of
Fini and Mirone (24,29), McHale (3 1-32) and Mirone's modification of McHale (33).
Without knowing the bard sphere diameten of methyl fonnate and acetonitde,
cornparison to Logan's model for non-isotopic dilution (35) is pointless.
R. J. Bartholomew, M.&. Thesis, 1992, University of Waterloo
J. S e d e r , Pk D. Thesis, 1989, University of Waterloo J. Semmler, D. E. Irish, J. Solution C k m , L988 17 805 J. Semmier, D. E. Irish, J. Mol. Liqudr, 1990 46 1
E. Plichta, M. Salomon, S. Slane, M. Uchiyama J. Sol. C h 1987 16 225
A. Smekal, Natmviss. 1923 11 873
C. V. Raman, K. S. Krishnan, Nature 1928 121 501
G. Landsberg, L. Mandelstam, Nohvwiss. 19% 16 557
R. N. Jones in Chernical, Biological and Industrial Applications of Infared Spectroscopy, Chap. 1 (J. R. M g EL), John Wiley and Sons Inc., Toronto, 1985
W. A. Guillory, Introduction tu Moleczhr Structure mid Spectroscopy, Allyn and Bacon, Boston, 1977
D. A. Long, Raman Spectroscopy, McGraw-Hill, London, 1977
G. Placzek, Hundbuch der Radiologie (E. Marx, Ed) Vol. 6, p. 205, Aicademie- Verlag, Leipzig, 1934
B. J. Bulkin in Analytical Raman Spectroscopy, Chap. 1 (S. G. Grasselli and B. J. Buikin Eds.), John Wiley and S o n s Inc., Toronto, 1991
J. R Scherer in Analytical R m ~ n Spectroscopy, Chap. 3 (J. G. Grassefi and B. J. Bullcm Eds.), Job Wiley and Sons Inc., Toronto, 1991
M. H. Brooker in nie C h i c a l Physics of Solvation Part B (J. Ulsmp, R. R. Dogonadze. E Kalrniin, A. A. Kamyshev Eds.), Elsevier, Netherlands, 1986
M. H. Bmker, O. F. Nielsen, E. Praestgaard, J . Ruman Spectrosc., 1988 19 71
W. F. M q h y , M. H. Brooker, O. F. Nielsen, E. Praestgaard, J. E. Bertie, Raman Spectrosc., 1989 20 695
D. L. Gerrard in Analyticul RoiMn Spectroscopy, Chap. 9 (J. G. GrasseUi and B. J- Bulkin mm), John Wiley and Sons Inc., Toronto, 199 1
D. E. Irish, M. H. Brooker in Advances in hfiared and Raman Spectroscopy, Vol. 2, Chap. 6, (R. J. H. Clark, R. E. Hester Eds.), Heyden and Son Ltd., London, 1976
Biologicd Applications ofRaman Spectroscopy, Vol. 1 - 3, T. G. Spiro Ed., John Wiey and Sons Inc., Toronto, 1987
E. S. Brandt, T. M. Cotton in Investigations of Su@aces and Interfocs - Pan B, Chap. 8, (B. W. Rossiter, R C. Baetzold Eds.), John Wiey and Sons Inc., Toronto 1993
G Fini, P. Mirone. J. Chem. Soc. Faraday Trans. 11974 70 1776
H. D. Thomas, J. Jonas, Ch- Phys. 1989 90 4632
P. Mirone, G. Fini, J. Chem. Phys. 1979 71 2241
M. Kamoun, P. Mirone, Chem. Phys. Lefi. 1980 75 287
W. Schindler, T. W. Zerda, J. Jonas, ' Chem. Phys. 1980 81 4306
D. Scheibe, G. Doge, Ber. Bunsenges. Phys. C'hem 1981 85 520
D. Scheibe, R m ~ n Spectmsc. 1982 13 103
M. G. Giorgini, G. F i , J. C h e n Phys. 1983 79 639
C. H. Wang, I. McHale, J. Chem. Phys. 1980 72 4039
J. L. McHale, J. Chem. Phys. 1Ml 75 30
J. L. McHale, J. Chem Phys. 1982 77 2705
P. Mirone, J. Chem. Phys. 1982 77 2704
D. E. Logan, Chem Phys. 1986 103 215
D. E. Logan, Chem. Phys. 1989 13 1 199
V. Shelley, J. Yarwood, Mol. Phys. 1991 72 1407
G. Fini, P. Mirone, Spectrochim Acta 1916 32A 625
D. R. Jones, C. H. Wang, O. F. Nielsen, J. Chrn. Phys. l976 64 4475
B. Desbat, P. V. Huong, J. C h m Phys. 1983 78 6377
C. Perchard, J. P. Perchard, Chem. Phys. Lett. 1974 27 445
J. P. Perchard, Chen. Phys. L a 1976 44 169
M. S. Wertheim, .L Chem P h y ~ y 1971 55 429 1
V. M. Shelley, J. Yarwood, Chem Phys. î989 137 277
G- Fi, P. Mirone, J. Chem Suc. Faraday Trans. 2 1973 69 1243
2.1 Chernicals and Solutions
In general chemicals were used "as received fiom suppiiers - no m e r
purification was performed. The details of the chernicals and the preparation of solutions
wili be discussed in the relevant chapters.
For spectra collected of samples under LOOOC, the samples were sealed in glas
capillary tubes held in a thermos- copper block. The sampIe was placed in the tube
using a syringe and a length of Teflon tubing. As the plunger of the syringe was pressed,
the tubing was slowly removed. Next, using the syringe and tubing, some of the sample
was removed fiom the top half of the capillary. This made sealing the tube somewhat
easier. Any bubbles in the tube were removed by tapping the tube. After tbis, the
capillary aibe was sealed using a Bunsen bumer. The copper block is illustrated in Fig.
46
'sr out
Fig. 2.1: Copper Block for Holding Capillary Tubes (2) A - Sample Tube Entrauce; B - Laer Beam Entrante; C - Raman Scatteted Light; LP - Locking Pin to Hold Copper Block in Place.
2.1. Water nom a regulated bath circdated through the block to maintain a constant
temperature.
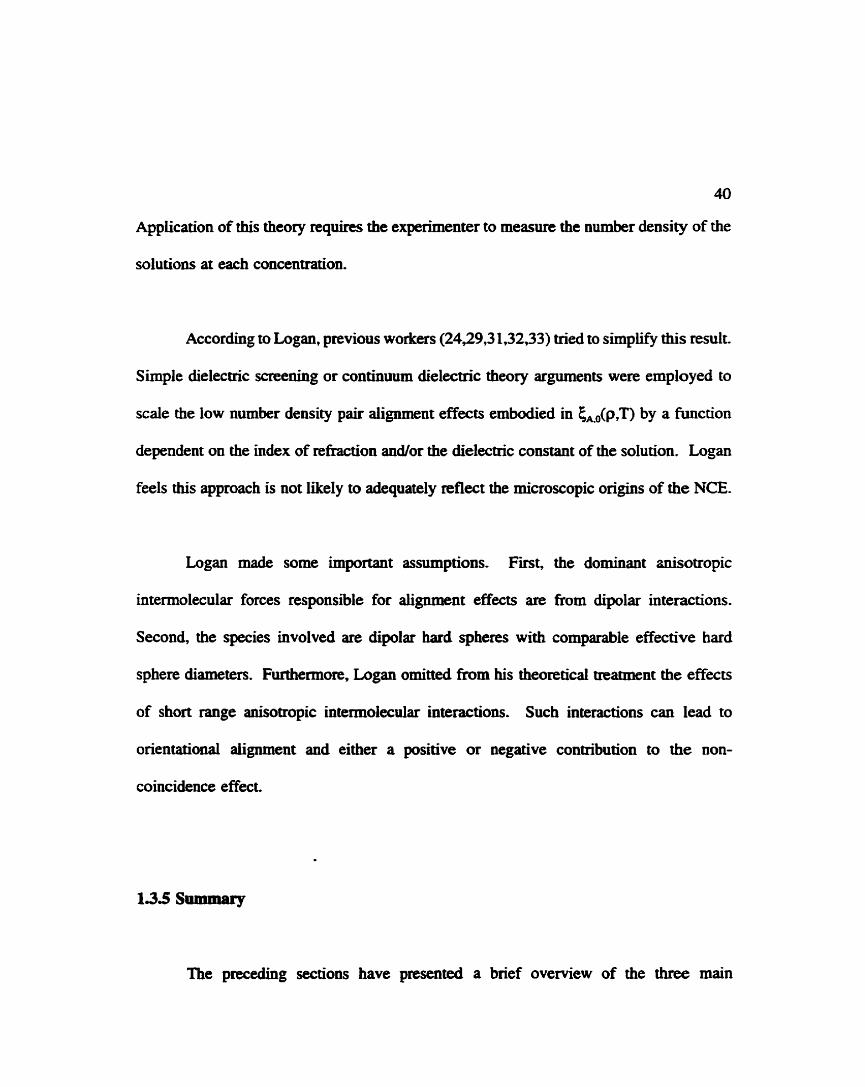
23 High Temperature Fumace
At the beginning of this project it was anticipated that high temperature (Le., >
100°C), high pressure experiments would play a significant role. The furnace used to
generate the high temperahms is illustrateci in Fig. 2.2. To perfom these experiments,
the furnace was re-designed to give better spectra (as described below). Detailed
descriptions of the fumace, the high pressure apparatus, and their use are readily available
elsewhere (1-4) and are not provideci here- However, a bnef description of the re-
designed furnace is given. As the project evolved, the role of the hi@ tempera-, high
pressure equipment greatly diminished.
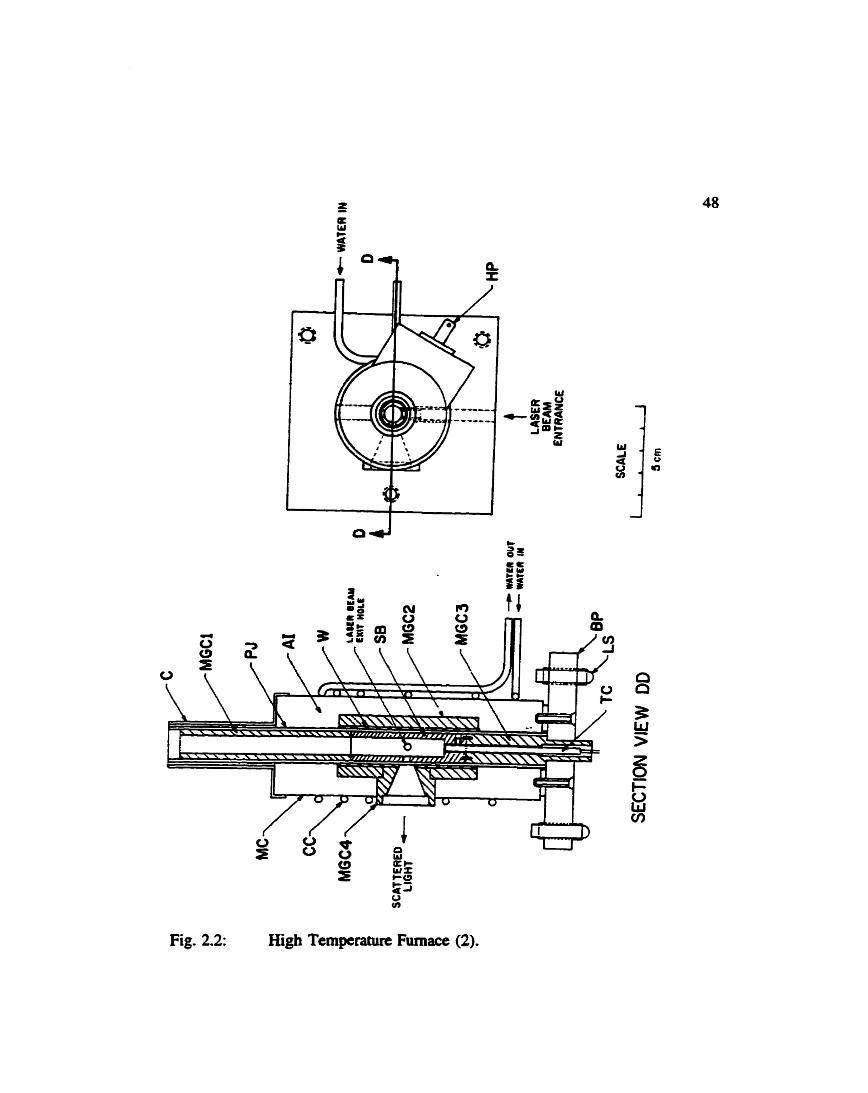
Originally the furnace was positioned in the sample chamber so that the sample
tube was perpendicuiar to the floor of the sample chamber. It was subsequently pointed
out this did not take bill advaatage of the slit geometry (5). To impmve the signal, the
furnace was recoostn~cied by rotating it and mounting it on its si&. In this way the
sample tube was parailel to the floor. As showa in Fig. 2.3, a tube parailel to the floor
gives much better signal than oae perpendicular to t&e floor. There is, however, a d e -
Fig. 2.2: High Temperature Fumace (2).
High Temperature Fumace
- asbestos based insulation
- base plate
- removable metal cap
- copper coils for coolhg water
- plug connectirtg heating wire to taperanire controiier
- h a c e feet
- metai casing
- machinable g l a s ceramic sections surrounding fimace
- Pyrex jacket
- silver block to minimize heating gradients dong sampiing
region
- chromel-alumel thennocouple
- heater wire
Raman Shift / cm"
Fig. 2.3: Cornparison of Horizontal (Parailel to the Fioor) and Vertical (Perpencluluar to the Fioor) Orientations of the Furnace Sample Celi for 2.8 m ZnSO,.
51
off. When the tube is perpendicular, any bubbles which may form wiU rise to the top of
the tube and their residence tirne in the beam will be very short. Obviously this wül not
happen when the tube is paralle1 to the floor. Second, mixing of the sample and the
hydraulic fluid (generally, water) can be a p a t e r problem in the parailel arrangement,
leading to contamination of the sample.
Raman spectroscopy is based on an inherently weak effect and this leads to weak
signals. It is fiequently ciifficuit to obtain spectra with a good signal-to-noise (SN) ratio.
Improvements to the signal-to-noise ratio can generaliy be made in two ways: 1)
mathematically by the use of smmthing and 2) experimentaiiy. Experimentally, the
signai-to-noise ratio can be improved by 1) increasing the measurement t h e , 't', at each
point; 2) increasing the number of measurements (which are averaged) at each point; 3)
increasing the number of SC- of the spectrurn which are then averaged. More wiil be
said about these options in the section, "Cornputers and Software". It is, in generai, better
to improve signal-to-noise experirnentally rather than mathematically.
The laser and spectrometer pedormed admirably over the course of this research
causing no speciaï problems. There is, however, a small recmhg problem with the
52
detector housing and window. The photomultiplier tube must be kept cold (-40°C) to
reduce thermal emission of electrons h m the photocathode. Under humid conditions
(such as a southem Ontario summer!) this leads to condensation and formation of ice
across the lem and the lens holder in fiont of the phoiamultïplier tube. Leaks (which
develop over time) in the dry argon-filled holder cause this problem. This leads to a
dramatic loss of signal. In severe cases this can lead to cracking of the lens holder.
When this problem is evident, it is necessary to dry out the housing, leas, and lens holder-
The detector must be disassembled in such a way that the photomultiplier tube is not
exposed to bright light. It must be stored in a cool, dark, dry place. The lens and lens
holder are removed fiom the housing and dried and cleaned. The housing is "baked out"
at -30°C overnight. Then, the detector is re-assembled.
2.5 Excitation and Detection
The configuration used in these experiments was typical for Raman spectroscopy.
Excitation was achieved with a Coherent Mode1 305 argon ion laser operathg at either
488.0 nm (in air, blue) or 514.5 nm (in air, green) with the latter king used for the
majority of the experiments. The blue line was occasionally employed to avoid problems
with laser plasma lines interfering with spectral bands. Powen were measured with the
laser's interna1 meter and were set at 1.5 W or 2.0 W depending on the experiment. In
53
oeneral, low temperature (< 1000C) capillary work was done at 1.5 W and high b
temperature, high pressure work was done at 2.0 W. In some cases, because of the
volatility of species, the laser power was reduced to prevent bubble formation. No
problems with fluorescence were encountend The laser iight followed the path
iliustrated by the dashed iine in Fig. 2.4.
The light scattered from the sample was coiiected and focused on the entrance dit
of the monochromator by a simple camera lem. A Jarteil-Ash spectrometer with a 1 .O
m focal length scanning Czerny-Turner double monochromator was used. The 1 180
grooves mm-' grating is blazed for 514.5 nm to give a hear dispersion of 8 2 A mm-'.
Mechanical slitwidths were nonnally set at 100 pm or 150 pn depending on the
particular experiment. Where signal strength made it practicai, the namwer width was
used. These mechanical slitwidths translate to -3 cm" and -4.5 cm" (at 514.5 nm)
spectral siitwidfhs, respectively. Spectral slitwidths become smafler for a given
mechanical slitwidth as the absolute wavenumber decreases. In other words, specaal
slitwidth improves as the monochromator moves h m the exciting Line to greater Raman
shift. This is iliustrated in Fig. 2.5. Control of the monochromator and acquisition of
spectral data were by an IIM. PSR 286 cornputer.
The Qtector was a themralectricaüy cooled RC.A. 3 1034 photomultiplier tube.
Photon counting was employed using a combination of an SSR Instruments mode1 1120
Fig. 2.4: The Sample Cornparmient of the JamII-Ash Spectrometer (2)-
AM 1 -2
AM 1H-2H
a
CSH
FL10
FLlOH
FL15
FM 1 -4
FR
FRH
LA
MUSS
PF
PFH
PSA
SA
SLC,SWCl-2
XC,YC
X Y S
The JarreIl-Ash Sample Cornpartment
adjustable mirrors'
adjustable minor holders'
collection lens
capillary sample holder
10 cm focal length leas*
10 cm focal length Iens holder'
adjustable lens
fixed mirrors
Fresnel pris&
Fresnel prîsm hoider'
lens assembly
multiple use sample stage
plasma filter
plasma filter holder
polarization and scrambler assembly
slit assembly
slit width and length contmls
X,Y controls of lens assembly
translation stage
(* not required in the parallel arrangement for high temperature, high pressure work.)
O 1300 2600 3900 5200
Raman Shift from 20492 cm"
O 1400 2800 4200
Raman Shift trom 19435 cm''
Fig. 2.5: Spectral Resolution as a Function of Raman Shift a) Shift h m 20492 cm*' (488.0 nm, in air) b) Shin fiom 19435 cm*' (5 14.5 nm, in air)
amplifïer / discrimiaator and a mode1 1105 data converter.
For conducting polarization studies, a polarization analyzer was used. This
apparatus was attached at the entrance slit to the monochrornator and consisted of two
parts: a thin piece of Polaroid film to discriminate one polarization fiom another and a
scrambler plate just after the Polaroïd film. The Polaroid Nm had a cucular holder which
allowed easy rotation of the Nm to select either parallel or perpendicular radiation for
analysis. Because gratings do not have equal transmission efficiencies for palle1 and
perpendicular radiation. a "scrambler" (see section 1.2.3) is necessary. In these
experiments, a quarter wave plate made fiom calcite was used as the scrambler.
2.6 Cornputers and Software
AU data collection and manipulations were performed on LBM PC's or compatibles
using software designed (or adapted) and written in our laboratory.
Most important among the pmgrams was the aptly named "Raman" program. This
program controlled the monochrornator and acquind spectral data. This program allows
the collection of spectral data in four independent regions with a maximum of 2000 points
in each region. The user enters five experimental parameters: i) the spectral region; ii)
58
the number of points per wavenumber; 5) the time constant; iv) the number of
measurements at each point and v) the number of scans. Coiiecting a spectrum is then
a matter of optimuiag each of these parameters to get the best spectra (in ternis of quality
and quantity) in the shortest time. The user's choice of the first parameter is, obviously,
a matter of which specnal region is being studied. It is the latter four parameten where
the real "juggling" takes place. By increasing the number of points per wavenumber, the
spectrum is sampled more frequently. Clearly, sampiing more often is desirable as it wiIl
give a more accurate representation of the spectrum. Furthemore, when applying
statistical tools such as bandfitting, it is desirable to have as many points as possible.
Equatly obvious, of course, is that the total experimental the wiU increase markedly.
The time constant is the length of time for a given measurement at a given point.
-1ncreasing this variable increases the total signal (which is good) but also the total time
(which is bad). The number of measurements is perhaps the most important parameter.
This sets the number of rneasutements of time constant, 'TC', at each point Tbese
measurements are then averaged to give a finia intensity value at each point. Because
signal rises as n and noise rises as dn, the S/N ratio rises as dn. Therefore, increasing
the number of measurements incteases the S N ratio. Udortunate1y, it also increases the
total experimental time quite dramaticaliy. Varying the number of scans should achieve
the same resuit as changing the aumber of measutements at each point. In this case,
however, it is the entire speccn~n which is averaged by CO-adding several different scans.
Unfortunately, if any flaws exïst in the monochromator drive, the monochromator may
59
not be re-set to precisely the same position at the beginniag of each nui and this might
lead to poor spectra Therefore, this parameter was always set to one.
In addition to wliecting data, the "Raman" program was used for some data
manipulation. The fmt of these is baseline correction. Baseline correction using this
program is interactive. The user chooses points in the spectrum which model the baseline
and then chwses a function to which to fit these points. The avaiiable functions are a
iine and polynomials to the fifth degree. There is also an option to model the baseline
using line segments drawn fiom point to point. A least squares procedure is used to fit
the chosen function to the chosen points. Once an acceptable (to the user) fit is found
it is subtracted and the modifîed data can be stored. Good baseiine correction is
important because, if poorly appiïed, it can lead to misleadhg or erroneous resuits when
bandfitting is appiied. A second type of data modification possible using this program
is the generation of "reduced" or "R" spectra (see section 1.2.1). This correction was
suggested by Brooker, Nielsen and Raestgaard (6).
Freguently in Raman spectmscopy vibrational bands overlap. This is especially
pronound when workhg with con&nsed phase systems such as solutions. This is a
problem which may be overcome, in some cases, by applying statistical methods to
decompose the spectral contour into its component bands. Bandfitting was pefiormed
using a routine originally written by Pitha and Jones (71, modifieci by Murphy and
60
Bernstein for Raman spectroscopy (8), and slightly modified in our labofatory to nui on
PC's. In Raman spectroscopy, the bandshape is the convo1ution of two functioas: a
Lorentzian function, which accounts for homogeneous Ihe broadening, and a Gaussian
function, which accounts for inhomogeneous Iine broadening. The Lorentzian hinction
is given by:
- - intensity at Raman shift of v
- - peak height
- - peak position
- - bandwidth parameter.
nie Gaussian function is given by:
Ka) - x1exp(-x,2(o - q2)
X4 = Gaussian bandwidth parameter
M q h y and Bernstein's routine replaces the coavohition of equations [l] and [2] with a
simple product of Lorentzian and Gawian functions. When using this routine, the user
is rquind to enter the band position, intensity, half Mdth at half maximum and the
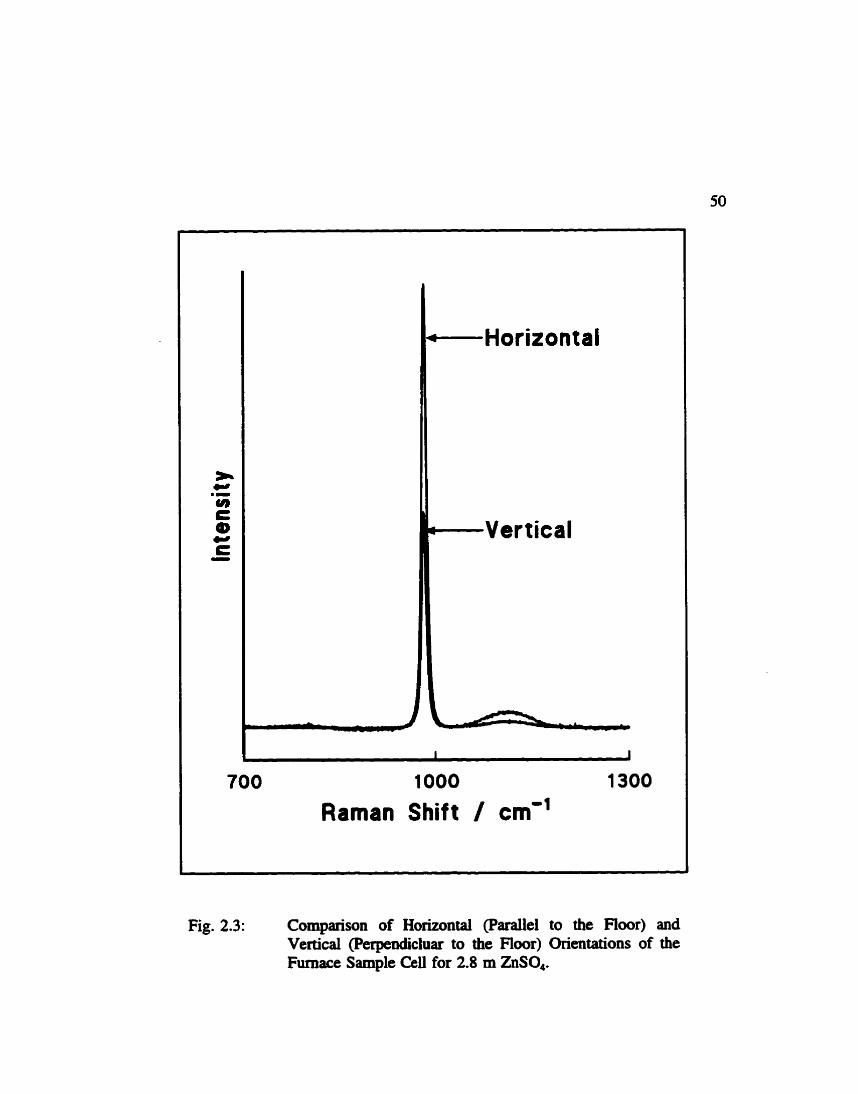
relative Lorentzian "character". This "character" is embodied by a quantity 'R' - the
Gauss - Lorentz shape ratio:
When R = 1 the band is completely Lorenaian aad when R = O the band is completely
Gaussian. The fitîing routine uses a non-ünear, le& squares method and varies the
parameters untii a best fit of the spectnim is constructed. It was found there was some
variation in the calculated parameters. This was especially tme if a large number of
bands was used or if overlap of component bands was quite signifiant. Generally, band
positions were reproducible and the largest variations were found with band areas and
widths. Furthemore, the final d t s were somewhat dependent on the initial guesses of
the user. To deviate this problem, bandfitting was applied to a given file several times
and averages used. The emr bars used in this thesis reprisent the spread of results
obtained fiom these repeated bandfits. In some cases the differences between bandfit
solutions was m e r than in other cases and the wider error bars are seen. In some cases
the spread of results was very smaU and the sizes of the enor bars are smaller than the
marken themselves. In lïght of these problems it is necessary to apply careful judgement
in the evaluation of bandfitting results.
In the course of this project, two other cornputer routines had to be developed (see
Appendix I). The fmt of these was to perform spectral subtraction. As mentioned in
chapter 1, the isotmpic spectrum is defined as:
The subtraction routine simply subtracts the second from the first on a point by point
basis. The user enten a subtraction factor by which the second N e is multiplied pnor
to subtraction. By changing the sign of this factor, two spectra may be added. The
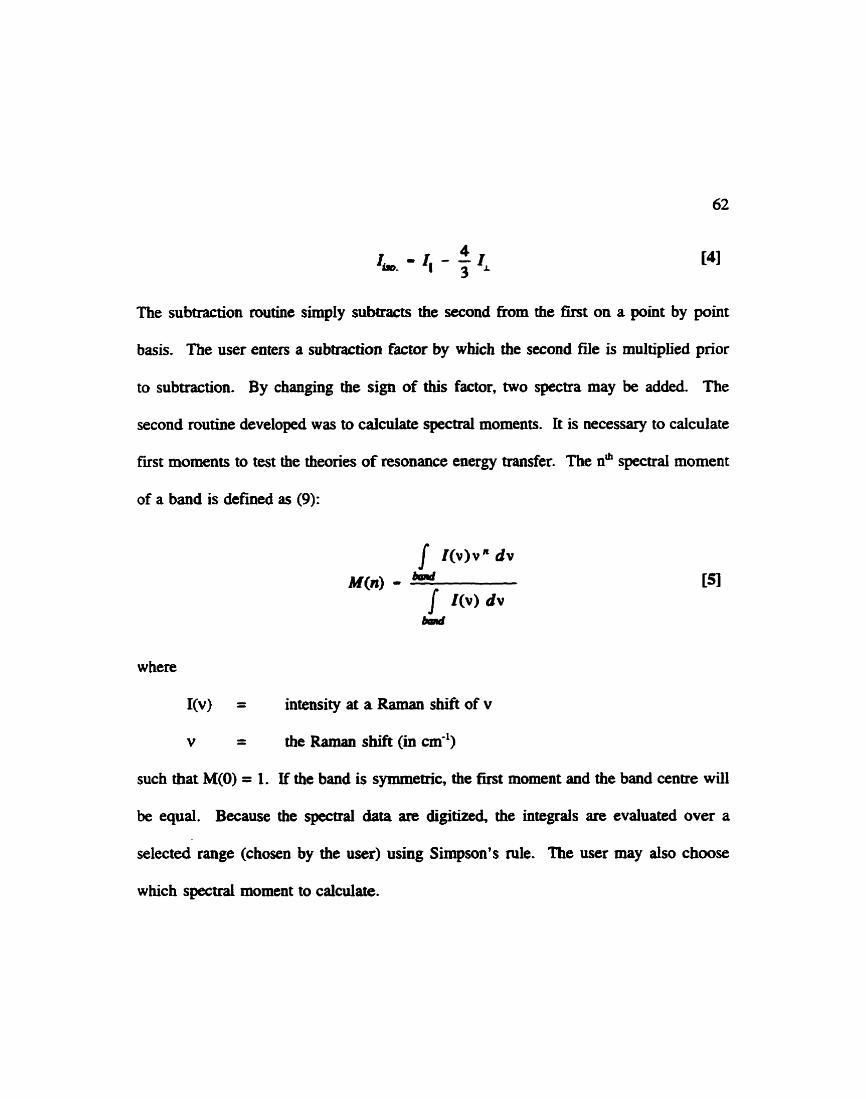
second routine developed was to calcuiate spectral moments. It is necessary to calculate
fïrst moments to test the theories of resonance energy transfer. The n" spectral moment
of a band is defined as (9):
w here
I(v) = inteusity at a Raman shïft of v
v - - the Raman sbift (in cm-')
such that M(0) = 1. If the band is symmetric, the first moment and the band centre will
be equal. Because the spectral data are digitked, the integrals an evaluated over a
selected range (chosen by the user) using Simpson's de. The user may also chwse
which spectral moment to calculate.
D. E. Irish, T. Jarv, C. 1. Ratcliffe, Appl. Spectrosc. 1982 36 137
T. Jarv, Ph. D. Thesis, 1980 University of Waterloo
J. Semder, Ph. D. Thesis, 1989 University of Waterloo
R. J. Bartholomew, M. Sc. Thesis, 1992 University of Waterloo
M. H. Broûker, private conmumication
M. H. Brooker, O. F. Nielsen, E. Praestgaard, J. Romcm Spectrosc. 1988 19 71
J. Pitha, R N. Jones, Cmc. J. Chem 1966 44 3031
W. P. Murphy, H. J. Bernstein, J. Phys- Chem 1972 76 1147
M. H. Brooker in Z?ze Chernicd Physics cf Solvation Part B (J. Ulstrup, R R. Dogonadze, E. Kalmin, A. A Karnyshev Eds.), Elsevier, Netherlands, 1986
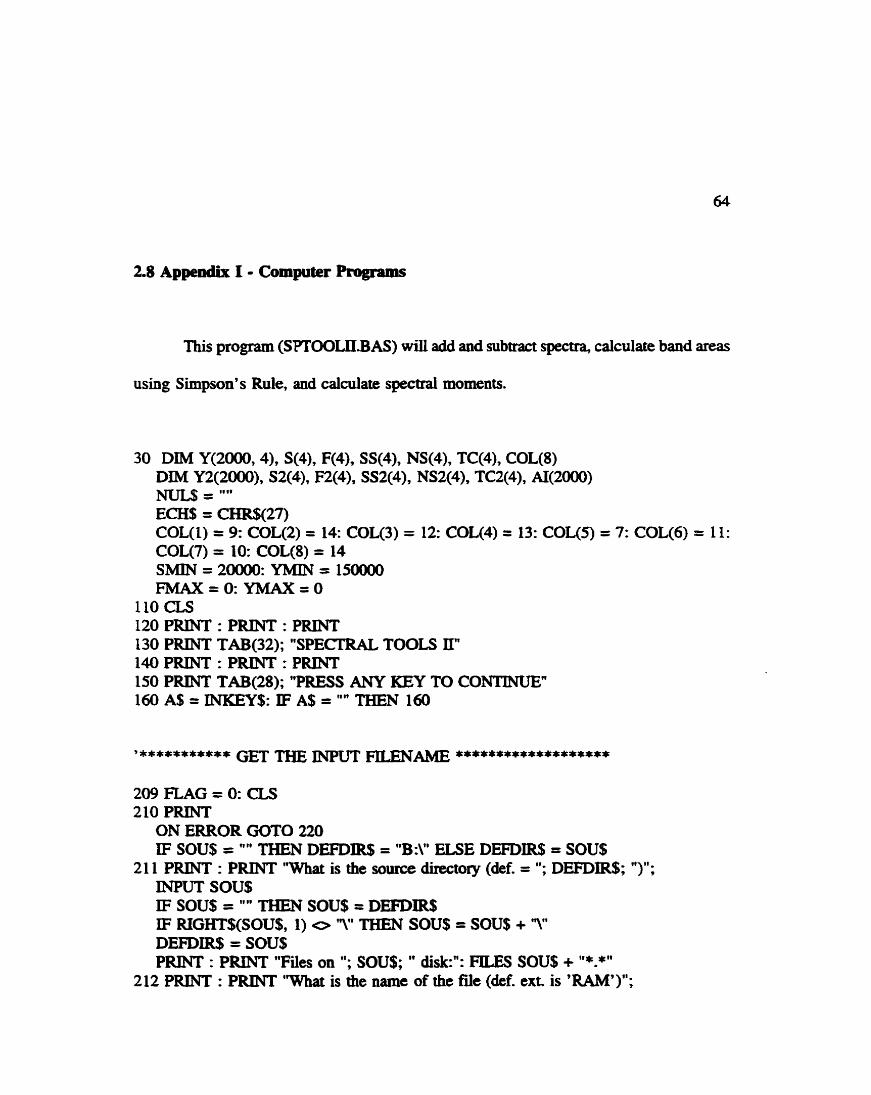
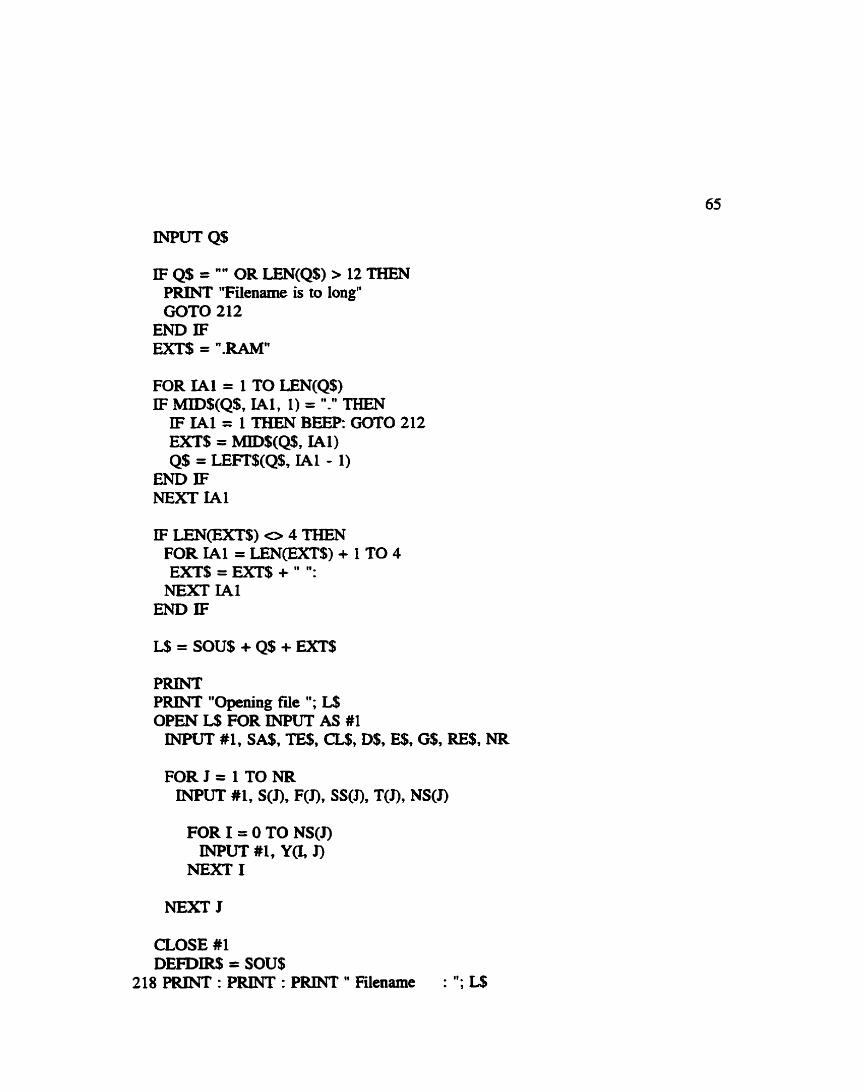
This program (SPTOOLILBAS) wil i add and subtract spectra, calculate band areas
using Simpson's Rule, and caldate spectral moments.
30 D M Y(2000,4), S(4), F(4), SS(4), NS(4), TC(4), COL(8) D M Y2(2000), S 2(4), F2(4), SSS(4), NS2(4), TC2(4), AI(2W) NUL$ = "" ECH$ = CHR$(27) COL(1) = 9: COL(2) = 14: COL(3) = 12: COL(4) = 13: COL(5) = 7: COL(6) = 11: COL(7) = 10: COL(8) = 14 SMIN = 20000: YMIN = 150000 F M A X = O : Y M A X = O
110 CLS 120 PRNI' : PRINT : PRINT 130 PRINT TAB(32); "SPECTRAL TOOLS II" 140 PRINT : PRINT : PRJNT 150 PRINT TAB(28); "PRESS ANY KEY TO CONTINUE" 160 A$ = INKEY$: IF A$ = "" THEN 160
209 FLAG = O: CLS 210 P m ON ERROR GOTO 220 TF SOU$ = "" THEN DEFDIR$ = "BA" ELSE DEFDIR$ = SOU$
21 1 PRINT : PRINT "What is the source directory (def. = "; DEFDfRS; ")"; INPUT SOU$ IF SOU$ = "" THEN SOU$ = DEFDrn IF RXGHT$(SOU$, 1) O 'l" THEN SOUS = SOU$ + ''Y' DEFDLR$ = SOU$ PRJNT : P m "Files on "; SOU$; " disk:": FILES SOU$ + "*.*"
212 PRINT : PRINT "What is the name of the file (clef. ext- is 'RAM')";
INPUT Q$
IF Q$ = "" OR LEN(Q$) > 12 THEN PRINT "Filename is to long" GOTO 212
END IF m$ = ".RAM"
FOR IAI = 1 TO LEN(Q$) IF MID$(Q$, IAl, 1) = "-" THEN IF IAl = 1 THEN BEEP GOTO 212 EXTS = MID$(Q$, ml) Q$ = LEEir$(Q$, IAI - 1)
END IF NEXT IAI
IF LEN(EXT$) O 4 THEN FOR IAl = LEN@XT$) + 1 TO 4 E n $ = ExT$ + ":
NEXT IAl END IF
P m PRINT "Opening N e "; OPEN L!§ FOR INPUT AS #1 INPUT #1, SA$, TE$, CL$, D$, Es, G$, RE$, NR
CLOSE #1 DEFDIR$ = SOU$
218 PRINT : PRINT : PRINT " Filename : "; L$
PRINT " Temperature : "; TE$ PRINT " Line/power : "; CL$ PRINT " Polarkation : "; D$ PRINT " Slits : "; E$ PRINT " Remarks : "; RE$ PRINT " Region Start End Step Sue TWstep"
FOR J = 1 TO NR: PRINT J, S(J), F(J), SS(I), T(J): NEXT
219 PRINT INPUT "1) AdcüSubtraction 2) Simpson's Rule Area 3) Spectral Moment 4) Run 5) Exit"; TC PRINT : ON TC GOSUB 25222,30000,40000,60000,610ûû CLS : GOTO 218
60000 GOTO 110
61000 END
IF ERR = 53 THEN LOCATE CSRIAN - 1,301 PRINT "-> FILE DOES NOT EXTST !!!" BEEP IF FLAG = 1 THEN RESUME 2601 1 ELSE RESUME 210
END IF
IFERR=71 ORERR=72THEN PRINT : PRINT "Disk not d y . " BEEP PRINT "Insert disk and press any key to continue"
D O U N T I L K $ o " " K$ = INKEY$
LOOP
IF K$ = ECH$ AND FLAG = 1 THEN RESUME 2601 1 IF K$ = ECH$ AND FLAG O 1 THEN RESUME 21 1 IF K$ O ECH$ THEN RESüME
END IF
IF ERR = 75 OR ER. = 76 THEN BEEP: P m PRINT "Paîh does not exist or cannot be found!" IF FLAG = 1 THEN RESUME 2601 1 ELSE RESUME 210 END IF
IF ERR = 68 OR ERR = 24 OR ERR = 25 OR ERR = 57 THEN BEEP: PRINT PRINT "Some form of device error has occurred." PRINT "Check disk drive connections etc. then press any key to C O ~ M U ~ " a = ""
IF K$ = ECH$ AND FLAG = 1 THEN RESUME 26011 IF K$ = ECH$ AND FLAG O 1 THEN RESUME 21 1 IF K$ O ECH$ THEN RESUME
IF ERR = 64 OR ERR = 52 THEN PRINT : PRINT "Bad Nename" BEEP IF FLAG = 1 THEN RESUME 2601 1 ELSE 210
END IF
PRINT : PRINT "The addition/substraction feature wül replace all the original data Continue"; INPUT AN$ IF LEFT$(AN$, 1) = "N" OR W $ ( A N $ , 1) = "no THEN RETURN
25225 IF NR = 1 THEN OREG = 1 GOTO 26000
END IF
25500 PRINT : INPUT "Which region do you want to use in the subtraction"; OREG
IF OREG > NR THEN BEEP GOTO 25500 END IF
IF OREG <= O THEN 209
26000 'CLS 26010 'CLS : PRLNT 26011 FLAG = O
ON ERROR GOTO 220 FLAG = 1 PRINT : INPUT "Which directory do you want to search for the fie to be subtracted "; DR$ IF Dm$ = "" THEN D m = DEFDIR$ IF RIGHT$(DIR$, 1) O "Y1 THEN DR$ = DI= + "Y1 PRINT : PRINT "Files on "; DI=; " disk:": FiLES DR$ + "*.*"
26012 PRINT : INPUT "What is filename (default extension is RAM !!!) "; Q$ IF Q$ = "" THEN 26011
IF LEN(Q$) > 12 THEN BEEP: PRINT "Fiename is to long" GOTO 26000
END IF
FOR IAl = 1 TO LEN(Q$)
IF MID$(Q$? IA1, 1) = "-" THEN IF IAl = 1 THEN BEEP: GOTO 26012 EXTS = MID$(Q$, Ml) Q$ = LEFT$(Q$, IA1- 1) END IF
NEXT Ml
FOR IA1= LEN(EFiT$) + 1 TO 4 ExT$=ExT$+""
NEXT IAl
END IF
L$ = DIR$ + Q$ + m$ PlW"ï:REFLAG= 1 PRINT "Openhg N e "; L$
DISPFL = O PRINT : PRINT : PRIM' " Fiename : "; SA2$ PRINT l1 Temperature : "; TES PRINT " Linelpower : "; C U PRINT " Polarization : "; d2$ PRNI' " Slits : "; E2$ P W " Remarks : "; RE2$ PRINT " Region Start End Step Size Time/stepW FOR J = 1 TO NR2: PRINT J, S2(J), F2(J), SS2(1), T2(J): NEXT P m
IFNR2=1THEN SREG = 1 GOTO26û18 - END IF
26017 PRINT : INPUT ' W c h region do you want to use for subtraction"; SREG
IF SREG <= O THEN 26000
IF SREG > NR2 THEN BEEP GOTO 26017 END IF
26018 IF SS(0REG) O SSZ(SREG) AND NR2 > 1 THEN BEEP PRINT : PRINT "The step size is ciiffereut Born the original spectnun!" GOTO 26017
END IF
IF SS(0REG) O SS2(SREG) AND NR2 = 1 THEN BEEP PRINT : PRINT "The step size is different hm the original spectnun!" GOTO 26011
END IF
IF S2(SREG) O S(0REG) THEN BEEP PRINT : PRINT "The starting wavenumbers are different!" IF NR2 > 1 THEN 26017 ELSE 26011
END IF
IF TZ(SREG) O T(0REG) THEN BEEP: PRINT PRINT "The time constant is not the same for the two spectra! Continue"; INPUT AN$ IF LER$(AN$, 1) O "y" AND LEFT$(AN$, 1) O "Y" AND NR2 = 1 THEN
26000
IF =$(AN!§, 1) O "y" AND =$(AN$, 1) O "Y" AND NR2 > 1 THEN 26017
END IF
IF E2 O E THEN B E P : PRINT PRINT "The slits are not the same for the two spectra! Continue"; INPUT AN$ IF LEFï$(AN$, 1) = "N" OR LEFT$(AN$, 1) = "n" THEN 26000
END IF
IF NS2(SREG) > NS(0REG) THEN INS = NS(0REG) ELSE INS = NSZ(SREG)
SSI = SS(SREG) SI = S(0REG) FI = SI + SSI * DVS
FOR 1 = O TO NS2(J) mm #2, Y20
NEXTI NEXTJ CLOSE #2
PRINT : INPUT "What is the scaiing factor
FOR J = O TO INS Y(J, 1) = Y(J, OREG) + SF * Y2(J) NEXT J
(default = - 43)"; SF
FOR T = INS + 1 TO 2000 Y(T, 1) = O NEXT T
FORR=2TONR FOR J = O TO NS(R) Y(& R) = O
NEXTJ N E m R
NR = 1: SS(1) = SSI: S(1) = SI: F(1) = FI: NS(1) = INS
REFLAG = O PRINT : INPUT "Do you want to view the results"; AN$
IF =$(AN$, 1) = "Y" OR m $ ( A N $ , 1) = "y" OR AN$ = "" THEN GOSUB 1050
CLS PRINT : INPUT "Do you want to store the results"; AN$ IF m $ ( A N $ , 1) = "N" OR LEFï$(AN$, 1) = "n" THEN RETURN
lm RETURN
1050 CLS XV = SI: NSP = SI SW=SI:EW=FI NNS = INS TSS = SSI
YMAX = O: YMIN = 1500000
FOR T = O TO INS IF Y(T, 1) > YMAX T ' E N YMAX = YCT, 1) IF Y(T, 1) < YMIN THEN YMIN = Yfl, 1) NEXTT
MI=YMIN 1150 CLS
SCREEN 12 '64ûx480 pixels LOCATE 1, I 'set up the plot screen p m w "; SA$; w - "; SA^$ '(identify the files)
1 155 VIEW (20, 43)-(620,413)' O, O 'set view port at 600x370 pixels LOCATE 27, 1 'set x axis label PRINT TAB(3); USING "####"; SW; TAB(75); E W PRINT TAB(3S); "SHFï (CM-1)" LINE (O, 0)-(0, 370), 11 'draw axes LINE -(600, 370), 11 PPWN=600/(EW-SW) 'determine pixeldwaveno. PfINT=37O/(MX-MI) 'detemine pkelsTmtensity XHS=(EW-SW)/5: YHS=(MX-MI)/5 XH=SW:YH=MI
FORT= 1 TO5 'place hatchmarks XHP=(xH-SW)*PPwN XHPI = INT(XHP) IF(XHP-XHPII)>=.5THENXHPI=XHPI+ 1 YHP=(YH-MI)*PPINT YHPI = INT(YHP) lFcyHp-YHPI)>=.5THENXHPI=MiPI+ 1 PSET @HP, 370) LINE -@€PI, 365)' 11 PSET (O, YHPI) LINE -(5, YHPI), 1 1 XH=XH+XHS YH=YEI+YHS m T
1165 W = Y(0, 1) 'determine first x pixel position FX=(NSP-SW)*PPWN 'and fhd integral value for it. FXI=INT(FX) 'Round it off if necessary. IF(FX- FXI) >= .5THENFXl=FXI+ 1 'do the sameforthefirst y FY = 370 - ((YV - MI) * PPINT) 'position Fn=INT(FY) I F ( F Y - F Y I ) > = . 5 T H E N M = M + l
PSET (FXI, Fn), C O L 0 'set the first point in the spectnun FORJ= 1 T O N S 'draw the spectnmi by drawing lines XV = XV + TSS 'to the next pixel position YV = Y(& 1) W=(Qcv-Sw)*PPWN) XPI = INTOcp) IFfXPr-XP) >=.5THENxPI=xPI+ 1 w=370-((yv-h4c) *PPlNT) YPI = INT(YP) IF (YP - YPI) >= .5 THEN YPI = YPI + 1 LINE -(XPI, Wl), COL(2) NE= J
1175 VIEW PRINT 29 TO 30 K$ = ""
PRINT "Press any key to continue"
26200 PRINT : PRINT "The spectra wiU be recorded with the foilowing descriptors:" PRINT D$ = "Isotropie" PRINT " Temperature : "; TE$ PRINT " Line/power : "; CLâ P R N ï " Polarization : "; D$ PRINT " Slits : "; E$ PRINT " Remarks : "; RE$ PRINT : INPUT "Do you want to change any of this information"; AN$
IF LEFI:$(AN$, 1) = " Y OR LEFZ$(AN$, 1) = "y" THEN P m PNNT "'ENTER' does not change the default value." PRINT : INPUT "Temperature"; Ab6
IFAN$ O "" THENTE$ =AN$ INPUT **Line/powerff ; AN$ IF AN$ O "" THEN CL!§ = AN$ INPUT "PoIarization"; AN$ IF AN$ O "" THEN D$ = AN$ INPUT "Slits"; ANS IF AN$ O "" THEN E$ = AN$ INPUT "Remarks"; AN$ IF AN$ O "" THEN RE$ = AN$
END IF
RE$=DATE$+"" +RE$ LRE = LEN(RE$)
26500 EXT$ = "ISO" IF DEST$ = "" THEN D D W = SOU$ ELSE DDIR$ = DEST$
26505 DEF$ = SA$: D m $ = m$ LSA = -(SA$)
FOR T = 1 TO LSA
IF S$ = "." THEN SA$ = LEFT$(SA$, (T - 1)) EXIT FOR
END IF
DEF$ = SA$: DEFEX$ = EXT$ PRINT : PRINT "If ail the defaults are chosen, the results will be stored as: " PRINT D D W + DEF$ + "." + DEFEX$ PRIM' : PRINT "What is the destination diractory (def. is "; DDIRS; " )"; INPUT DEST$ IF DEST$ = "" THEN DEST$ = D m $ IF RIGHT$@EST$, 1) O ''Y' THEN DEST$ = DEST$ + *'Y'
265 10 PRINT : PRLNT "What is the permanent name for the N e (def. is "; DE'S; " )"; INPUT F!§
IF LEN(F$) > 8 THEN BEEP: PRINT : PRINT "Fileaame is too long" GOTO 26510 END IF
DEFEX$ = EXT$ 2651 1 P W : PRINT "Mat is the extension (def. is "; DEFEX$; " )";
INPUT Exn
IF Lm-$) > 3 THEN BEEP: PRINT PRINT "Extension is too long" GOTO 265 1 1
END IF
ON ERROR GOTO 265 12
P m : FILES FILEN$ PRINT "Fie aiready exists": BEP: EXT$ = RIGHT$(EXT$, 3): GOTO 26510
26513 PRINT "Saving fiie as "; FiLEN$: PRZNT 26514 OPEN FILEN$ FOR OUTPUT AS #1
PRNI' #1, F$; ","; TE$; ","; CL$; tt,ne; D$; t y ; mi 11 , gr. , MG$; ","; RE$; I*,"; NR PRINT #1, S(1); F(1); SS(1); T(1); NS(1)
FOR 1 = O TO NS(1) PRINT #1, Y(r, 1)
NEXT 1
PRINT #1, ZE
IF ERR = 53 AND REFLAG = O THEN PIUNT : PRINT "New fie" RESUME 26513
END IF
IFERR=61 ORERR=71 ORERR=72ORERR=57ORERR=68OR ERR=24 OR ERR = 25 AND REFLAG = O THEN BEEP: PRINT PRINT "Disk Mi or not ready" PRINT "Check drive ancilor insert a new diskette" PRINT "Press any key to continue" I($ = "fl
DO UNTIL K$ O "" K$ = m E Y $
LOOP
CLOSE #I IF K% = ECH$ THEN RESUME 26500 ELSE RESUME 26514
END IF
IF (ERR = 64 OR ERR = 52) AM) REFLAG = O THEN PRINT : PRINT "Bad filename" BEEP: EXT$ = RIGHT$(EXï!§, 3) RESUME 26510
END IF
IF ERR = 75 OR ERR = 76 THEN PRINT : PRINT "Path not found or access error" BEEP: EXT% = RIGHT$(EXT$, 3) RESUME 26505
END IF
ON ERROR GûTO O ' tum off emr oappiag y*********************** endofemor~pping ******************************
30000 F m = ITHEN CH= 1 GûTO 31000
END IF
PRINT : INPUT "For which region do you wish to calculate the areal'; CH
3 1000 GOSUB 35100 'arrange array for integration
GOSUB 50000 'perform Simpson's M e integration"
PRINT : PRINT "The calculateci area is"; AREA PRINT : PRINT
IF NR > 1 THEN PRINT : INPUT "Do you want to calculate the area of another region"; AN$ IF AN$ = "Y" OR AN$ = "y" THEN 30000
END IF
35100 PRINT : INPUT "What is the starting wavenumberl'; SWN
IF S W N < S(CH) OR SWN > F(CH) THEN BEEP PRINT : PRINT "Starting wavenumber is not within the range of the data" GOTO 35100
END IF
35200 PRINT : INPUT "What is the final wavenumber "; JWN
IF EWN < S(CH) OR EWN c= SWN OR EWN > F(CH) THEN BEEP PRINT : PRINT "Final wavenumber is invalid!" GOTO 35200
diffraction methods (10). The conclusions regarding the structure of liquid formic acid
have been almost as diverse. Several workers have concluded the iiquid contains
polymeric species (2,4,5,7,9,10). Todinson, Cumutte and Hathaway were specific in
concluding the liquid consists of helical polymers (4). Other workers have concluded
iiquid formic acid contains of dimers (3,8,l1). Waldstein and Blatz concluded liquid
formic acid was composed of either polymers, an open dimers, or a mixture of tbe two
(6). Clearly, the structure of fonnic acid is not weU characterized.
Pure formic acid was studied both at room temperature and at elevated
temperatures and pressures in a previous work (12). A swey spectrum (100 - 2000 cm",
in R(v) format) is presented here for completeness (Fig. 3.1) and partial assignments are
given in Table 3.1.
Dr. Murray Brooker (13) suggested a series of experiments on formic acid diluted
1 OS 735 1365 1995
Raman Shift 1 cm"
2000 3000 4000
Rmrn Shift / cm"
Fig. 3.1: S w e y Spectrum of 98% Formic Acid
Table 3.1: Partial Assignment of Fomiic Acid (4).
F~quency I cm-' Assignment
1600 - 1750 C=O stretch
1 1398 C-H bend 1 WOHO) + C-O mctch
1208 C-O stretch
1 650 - 725 1 OC0 bend
1 1060 1 C-H bend
86
in water. Dilution should lead to a reduction of any iatermolecular coupling (which gives
rise to resonance energy traasfer) and therefore to consequent changes in the spectrum.
As the "active" species is diluted the degree of association should decrease and this
should be observable in the spectruxn. Similar work has already been done in our
Iaboratory on acetic acid (14,lS). Those studies showed a dependence on concentration
of the nature and relative amounts of the associated species in acetic acid Studies of
solutions of formic acid were undeden, in part, to see if similar effects rnight be
observed. Such effects, if they do occur, may shed some light on the structure of pure
formic acid However, as was found from the previous work (12), the behaviour of
forrnic acid is quite different from that of acetic acid.
The chemicals used in these experiments were: 98 - 100% fomùc acid, 99%
acetonitrile, 99.9% dichloromethane (aii supplied by B.D.@, 99.9% 1,4-dioxane (Fisher)
and Milli-Q water. The fonnic acid and the organic solvents were used "as nceived",
ic., without fkther purification. The small amount of water present in the formic acid
is not expected to have a sigaincant effect on the results. Binary solutions of formic acid
with each of the solvents were prepared. Ternary solutions of formic acid, acetonitrile
and dichloromethane were prepared to constnict a Job plot. As shown in section 3.3.2
87
(formic acid I acetonitrik) formic acid and acetonitde form some sort of "complex". The
"method of continuous variations" (which generates a Job plot) (16) allows the
determination of the relative amounts of "ligand and "metal" in a complex. This method
was applied to the formic acid - acetonitrile system with the objective of detemiiniog the
relative amounts of formic acid and acetonitrile in the "complex". More will be said
about this later (section 3.3.6).
The binary solutions of iormic acid were prepared on a mole fiaction basis using
25 mL volumetric flasks. The required volume of fonnic acid was measured using a
graduated cylinder and poured into the flask The mass of the fonnic acid was then
detennined. The volwnetric flask was Nled to the mark with solvent and the mass of the
solvent was recorded. The volumetric flasks were capped, wrapped with Parafilm and
stored in a refkigerator.
Portions of the solutions were added to thin-wded capillary tubes using a syringe
and a length of Teflon tubing. The binary solutions were added using a plastic syringe
and this did not appear to have any adverse effect on the spectra. For the solutions
containhg dichioromethane, however, the use of plastic syringes gave quite high
backgrounds. A glas syringe was tned and it alleviateci the problem. The syringes (both
plastic and glass) were rinsed thomughly with the intended solutions before ffing the
capillary and rinsed with Milli-Q water aftetwards. The capillary was then placed in the
thermosauted copper block that has already been d e s c f l i (section 2.2).
AU spectra were collected usiag the 5 14.5 nrn line at 1.5 W (rneasured at the laser
head) as the excitation source. Survey spectra and spectra of the C O stretching region
of the binary solutions were coUected with a mechanical slitwidth of 150 pm. For
solutions involving acetonitrile, spectra of the CkN stretching region (2100 - 2400 cm-')
were collected with dits of 100 p. For the ternary solutions, spectra were coîlected in
three spectral regions. The i%t was 585 - 885 cm-'. This ~ g i o n includes a band fiom
the solvent, dichiorornethane, that was used as an intensity standard. It exactly overlaps
the O-Ca bending bands of formic acid but is very m n g while the O-C-O bending
bands are very weak. The error in intensity fiom the contribution of the O - C S bands
was estimated to be less than 1% and therefore not significant. The second region was
the stretching region of the acetonitrile. For both of these regions the slits were set
at 100 p. The third region was the carbonyl region of focmic acid (1500 - 1900 cm-')
where the sIits were set at 200 p. The binary solution spectra were coïiected at 25OC
while the spectra for solutions containhg dichloromethane were coikcted at 200C. The
tempe- was reduced for the latter solutions because of the low boiüng point of
dichloromethane (WC).
3 3 Resuits and Discussion
Solutions of formic acid in four Merent solvents (water, acetonitde, 1,4-dioxane
and dichloromethane) were studied. The results for each solvent will be presented in tum.
3.3.1 Formic acid / Water
A senes of solutions of HCOOH I H,O was prepared from X(HC00H) = 0.900
to X(HCO0H) = 0.510, The concentrations are summarized in Table 3.2.
Figure 3.2 shows a survey spectrum for formic acid at X = 0.510. The most
ciramatic effects are in the o-C=û deformation region (600 - 750 cm-') and the carbonyl
region (1475 - 1875 cm-'). Also, some slight change appean in the low kquency band
at -200 cm''.
The carbonyl spectrai region was studied in the gnatest àepth. Figure 3.3 shows
the effect of dilution on this spectral region. As the formic acid is diluteà the band
maximum moves to higher fkquency and the high frequency shoulder becornes less
prominent The band maximum moves towards coincidence with the high frequency
shoulder. In the spectra of more dilute formic acid, low frequency asymmetry occurs
Table 3.2: Concentrations of HCûûH I H20 SoIutions.
Code x(HCOOH) C(HCooH) C @ D / mol L" f mol L" / mol L"
Fig. 3.2: Smey Spectnmi of HCOOH I H,O X(HC0OH) = 0.501.
1675
Raman Shift / cm"
Fig. 3.3: Carbonyl Modes of HCOOH / H,O.
93
because of overlap with the v, mode of water. n i e appearance of this mode necessarily
precludes continuing studies below X(HCOOH)-O.S for HCOOH I H,O.
Figures 3.4 - 3.5 show the isotropic and anisotmpic spectra of fonnic acid under
various conditions. A non-coincidence of the isotropic and anisotropic band maxima is
very clear. From the spectmm of 98% formic acid it is evident the maximum in the
isotropic spectnim corresponds to a shoulder in the anisotropic and vice versa The
maximum in the anisotropic is at -1725 cm-' and this frequency is essentially constant
throughout the concentration range. At 100°C (98% HCOOH) the anisotropic maximum
is at -1728 cm-'. Tomluison, Curnutte? and Hathaway (4) report an infiareci maximum
at 1715 cm-' that shifts upward by 4 cm" when the temperature is raised from lO0C to
80°C. They assigned this to C S stretchg. In the Raman, however, they assigned the
peak at 1654 cm" to C=û stretching and a shoulder at 1740 cm-' to a combination of CH
bending (1060 cm-') and OC0 bending (675 cm*'). Unfomately, these assignments
seem to be based on spectra at O°C and pure fomic acid h z e s at g°C!
Figure 3.6 shows the separation of band maxima as a function of formic Md mole
fraction. The separations are given in Table 3.3. At X(HC00H)-1 (98% B.D.H. formic
acid) the separation is -64 cm*'. in other molecules with carbonyl groups the non-
coincidence is typically < 15 cm-' (17). However, di the other evidence suggests a
resonance energy transfer (RET) effect is taking place in fomiic acid As the acid is
1475 1675 1875 Raman Shift / cm"
1475 1675 1875
Raman Shift I cm"
Fig. 3.4: Polarizaîion Studies of HCOOH / H20: a) 98% HCOOH b) X(HCO0H) = 0.510 (nonnalized).
A n i s o .
1675
Raman Shift 1 cm''
Fig. 3.5: HCOOH (98%) Polarization Studies at -100°C (normalized).
Table 3.3: NCE for HCOOH / H,O.
xmc~l i ) NCE / cm"
1 .O00 64
98
diluteci, the separaiion of the isotropic and anisotropic peaks decreases and has a fairly
strong dependence on the mole fhction. The anisotropic peak position does not change
as the formic acid is diluted, remaining fked ai -1725 cm-'. The isotropic peak shifts.
Concentrations of formic acid below X(KCOOH)-CJ were not used because of the
overlap with v, of water at -1600 c d . Further, the NCE at -100°C is smaller than at
25°C- A reduction in NCE as temperature is r a i d is characteristic of resonance energy
transfer (18). The splitting in fonnic acid is very large and indicates a significant
interaction between formic acid molecules. This is not surprising considering the
possibility of quite strong hydrogen bonding in this system.
The low fkequency band at -200 - 210 cm'' shifts very slightly h m 208 cm''
(98% HCOOH) to 201 cm-' (X(HC00H) = 0.510) as the concentration fails. The " R
spectrum (19) suggests some high frepuency asymmetry in this band (see Fig. 3.7). This
band has been assigned to an H-O-H bending mode associated with hydrogen bonding
(Blatz and Waldstein (6)). The presence of this band throughout the dilution range
impiies the continuation of hydrogen bonding. Therefore, the hydrogen bonding in fonnic
acid is quite strong and may partialiy explain the very large non-coincidence effect.
The third region studied in detail was the OGi) deformation region (625 - 750
cm"). In neat formic acid this band envelope had an unusual shape suggesting the
possibility of three underlying bands. At lower concentrations (X(HC00H) c 0.7) this
225
Raman Shift 1 cm''
Fig. 3.7: Effect of Dilution on the "Association" Band of HCOOH.
100
envelope had a more "conventional" appearance ( s e Fig. 3.8). Using three band fi6 on
aU the spectra reveal interesthg changes. The lowest fiequency band shifted to higher
frequency (hm -672 cm-' to -679 cm-'), but the change occurs almost entirely below
X(HCOOH)-O.7. The relative intensity also decreased. The second band shifted (681
cm-' to 693 cm") but, again, the change is greatest for concentrations below
X(HCOOH)-0.7. The relative intensity of this band increased. The third band increased
in fkequency, but the change was spread more evenly. The relative intensity of this band
increased and then decreased. The @ C O bending band, just iike the C=O band, is
likely to change as the intermolecular forces change. Tùerefore, these spectral changes
indicate changes in the nature of the intennolecuiar forces.
Formic acid in aqueous solutions behaves differently k m acetic acid. Semmler
(l4,lS) studied acetic acid at elevated temperatures and in solutions. She concluded neat
acetic acid was a mixture of polymers, cyclic dimers, open dima, and monomen. As
the acetic acid was heated or diluted, the level of association decreased. No polarization
results were reported. In formic acid the results strongly suggest resonance energy
transfer is occUmng. The isotropie and the anisotropic peaks are noncoincident and the
separation is quite large. The separation decreases with diiution and with a rise in
temperature. Both observations strongly suggest RET because diluting or heating the
fomiic acid should lead to a dismption of ordcr, a decouplhg of the oscillators, a
reduction in the effectiveness of RET and consequently a decrease in the non-coincidence
700
Raman Shift / cm''
Fig. 3.8: Effect of Dilution on the O-&o Deformation Modes of HCOOH-
102
effect. The occurrence of RET suggests Som type of order in the Iiquid that allows the
oscillators to couple. This local order is induced by dipole - dipole forces in conjunction
with hydrogen bonding. The hycùogen bonding is present throughout the dilution range
(as proven by the continued presence of the "association" band at -200 cm-'). This
observation suggests formic acid forms very stabk hydrogen bonds.
33.2 Formic Acid / Acetoiiitrile
These experiments were originaliy undertaken to study the RET effect in fomiic
acid using a solvent whose bands do not overlap those of formic acid. The ideal solvent
must meet other conditions as weU. It should not react with formic acid and should
provide a wide range of formic acid solubility. Acetonitrile seemed an appropriate choice
and a series of solutions QL(HC0OH) = 0.898 to X(HCO0H) = 0.157) of formic acid in
acetonitrile was prepared. A summary of the concentrations is presented in Table 3.4.
The results were unexpected. The changes in the formic acid spectra (see Fig.
3.9a) are completely different from those seen for dilution in water. The first impression
was that the acetonitrile and the formic acid had reacted. Hydrolysis of acetonrmle (to
form acetic acid) occm under acidic conditions but is very slow (20). Furthemore, in
this system only smaU amounts of water and few protons are present. Other possible
Table 3.4: Concentration Summary for HCûûH / CH,CN Solutions.
Code X(HCo0H) C r n C ~ H ' C ( 0 / mol L-' / mol L"
RB940520A 0.898 22.75 2.577
RB940520B 0.702 16.54 7.010
RB94û520C 0.503 11.09 10.94
RB94052OD 0.305 6.327 14-41
RB94052OE -- - -
O- 157 3.106 16.69 -
RB940526A 0.782 18.96 5.283 1
RB940526B 0.580 13-10 9.482
RB940526C 0.397 8.468 12.88
RB940526D 0. 198 3-988 16.1 1
* Y .- Y) t m w C -
b
300 1150 2000
Raman Shift / cm''
Fig. 3.9: Spectra of HCOOH 1 CH,CN X(HC00H) = 0.503: a) S w e y Specûum b) Spectrai Region when an NH Stretching Band would be Expected (above 3200 cm-').
105
reactions between formic acid and acetonitde might reasonably be expected to lead to
a product exhibithg an NH stretching mode. Therefore, a spectrum of X(HC00H) =
0.503 solution was recorded between 2800 cm-' and 3600 cm-'. This spectnim shows no
evidence of an NH stretch (see Fig. 3.9b). Furthemiore, if proton transfer had taken place
the C=O vibrations would disappear and two vi'brations fnmi the COi group would appear
(21). This is not the case. These d t s suggest no reaction tmk place and so the
carbonyl (1500 - 1900 cm-') and the nitrile (2100 - 2400 cm*') regions were examined
more closely.
In the carbonyl region of pure formic acid a maximum with a hi@ frequency
shouider is evident As formic acid is diluted in acetonitrile, this profde changes
dramaticaliy. Figure 3.10 illustrates this very well. Three bands are obviously present
and low kquency asymmetry suggests a fourth band underlying this profile. Bandfitting
was applied to the spectra using four-band fits and the cesuits are summarized in Table
3.5. At X(HC00H) = 0.898 the spectrum suggested only three bands. Figure 3.1 la
shows the dependence of each band position on mole fraction. The band positions of the
two higher frequency bands (v, and v,,) are viroually independent of concentration. The
lowest f'requency band (v3 appears to pass thmigh a maximum at X(HCû0H) = 0.580.
The remaining band's (vJ position decreases with increasing fonnic acid concentration.
Another set of parameters that is of interest in this study is the fraetion of the total
carbonyl intensity from each band, a. As can be seen in Fig. 3.1 lb, the intensity of band
Table 3.5: Summary of Bandfitting for HCOOH / C H P .
Note:
a is the fraction of the total carbonyl band intensity.
os0
X (HCOOH)
Fig. 3.11: Variation of the Band Parameters for the Carbonyl Region of HCOOH / CH,CN: a) Position b) Fraction of Total Intensity O - Band a; . - Band b; A - Band c; + - Band d.
109
(a) incteases with increasing formic acid concentration whereas bands (c) and (d)
decrease. Band (b) shows considerable fluctuation but no systematic aend The reason
for this variation is unknown. Because of the occurrence of four bands (as opposed to
two in neat formic acid) and the behaviour of their relative integrated intensities, the
formation of some sort of formic acid - acetonitrile association or complex was
hypothesized Evidence in the e N stretching region gave M e r support to this
hypothesis.
Cleanr evidence to support the existence of some son of "association" is found
in the n i d e (210 - 2400 cm-') region. In pure acetonitrile the strongest band in this
region is the C=N stretch. It is a very intense band When formic acid is added to
acetonitriie, a shoulder appears at higher frequency (see Fig. 3.12). This shoulder (-2270
cm-') increases in intensity relative to the band at -2255 cm-' as the formic acid
concentration increases (see Fig. 3.13 and Table 3.6). This band has aïs0 been observeci
for solutions of acetonitrile with silver ions (22), methanol (23), ortho-cresol (24), IBr
(25), and phenol(26) and suggests significant formic acid - acetonitrile binding. Fawcett
(27) studied the interaction of acetonitrile with a wide range of solvents of varying Lewis
basicity or acidity. He found a solvent induced frequency shift (SES) of the C=N band.
For solvents more basic than acetonitrile, the SIFS was negative but for more acidic
solvents the SIFS was positive. Formic acid is more acidic than acetonitrile, so the
development of the peak at 2270 cm-' is consistent with the results of Fawcett
2150 2275 2400
Raman Shift / cm''
21 50 2275 2400
Raman Shift / cmœ1
Fig. 3.12: C=N Stretching Region of: a) Rire CH3CN b) HCOOH I C H p (X(HCû0H) = O S 10).
Table 3.6: Fraction of Total Nitrile Intensity of 2270 cm'' Band
113
Having established the existence of a formic acid - acetonitrile association, the
naturai question to ask is, "how are these two molecules bound together?". One would
expect acetonitrile to "bond" through the aitrogen atom as this atom possesses an electron
lone pair. The development of the high frequency shoulder on the e N stretching band
supports this belief. (The move to bidm frequency has been explained by Fawcett (27)
in the foilowing way. The molecular orbital forming the bond to the electmphilic species
(in this case, formic acid) has substantial nitrogen lone pair character. However, there
are also considerable CoN and C-C anti-bonding contriiutions. Because charge is
removed &om the anti-bondinq orbital, the C=N bond is strengthened and the bond shifts
to higher frequency.) Uniüre acetonitrile. formic acid has two possible sites for bonding:
the carbon atom and the hydrogen of the OH group. If association were through the
hydrogen atom, a change in the formic acid band at -200 cm*' (OH-H bend) rnight be
anticipated. However, any changes in this region might be ciifficuit to see. An alternative
approach is to replace the acidic proton with a non-acidic group. Such a group (and the
simplest) is the methyl group. If evidence is found of association (either through the
carbonyl bands or the CkN band), the association in the formic acid / acetonitrile system
is most iikely through the carbonyl group. Therefore, a solution of rnethyl formate in
acetonitrile was stuclied.
A solution of methyl formate in acetonitrile W O - 0 . 5 ) was prepared and the
Raman spectrum collected. It is presented in Fig. 3.14. In the carbonyl stretching region
1700 1900
Raman Shift / cm''
21 O0 2250 2400
Raman Shift / cm''
Fig. 3.14: Spectra of Solutions of Methyl Formate / Acetonitrile mm-OJ): a) Carbonyl Region b) CkN Region.
115
three bands, the strongest of which is at -1720 cm", are present As an aside, this
frequency is almost identical to the band maximum position of the anisotropic spectrum
of pure formic acid. This observation may be quite significant. The spectrum of the
carbonyl region is identical to that of pure methyl formate (Fig 4.1 and (28)). The G N
stretchiog region of acetonitrile shows no change, unlike the formic acid spectra, These
results suggest the interaction between the acetonitrile and formic acid occurs through the
acidic hydrogen of the formic acid.
Having established (possibly) the naaire of the interaction between acetonitrile and
formic acid the next logical step is to try to determine the "co-ordination number" of the
formic acid This can be calcuiated by using the Job method or "methd of continuous
variations" (16). To do this, a suitable solvent must be found so the sum of the anaiytical
concentrations of the two species can be held constant (ie., Ç = C(HCûûH) +
C(CH3CN) = constant). Also, obviously, the solvent should not have overlapping bands
with either species and both species should have a wi& range of solubility. 1.4-dioxane
appeared to fit the requirements quite nicely. Between 1500 cm-' and 2600 cm'' it has
no bands of its own and fomùc acid and acetonitrile are quite soluble in it. In a
preliminary experhent a small amount (-2.5 mL) of an HCOOH / CH3CN solution
@(HCûûH) = 0.501) was added to -2.5 mL of 1,4dioxane. As seen in Fig. 3.15, some
major changes occur in the spectrum. Fit, the relative intensity of the band at -1730
cm-' increases markedly while shihing to slightly lower frequency. Second, the shoulder
1500 1700
Raman Shift / cm"
2100 2250 2400
Raman Shift / cm"
Fig. 3.15: (HCUûH + CH3CN) 1 1,440xane: a) Carbonyl Region b) C=N Stretching Region.
117
at -2270 cm-' is greatly reduced in relative intensity (with respect to the 2255 cm-' band).
This suggests 1,4-dioxane is quite effective at reducing the interaction between acetonitriie
and formic acid or that 1,4-dioxaw cornpetes with acetonïtrile to solvate the formic acid.
These preliminary results prompteci a closer investigation of solutions of formic acid in
1,4-dioxane.
3 3 3 Formic Acid / 1,4dïoxane
A set of solutions of formic acid in 1,440xane was prepared and the
concentrations are summarized in Table 3.7. When the solutiom were preparecl, two
observations were made. First, the mixing of the two liquids is exothermic. Second the
volume of the solution increases with mixing.
The spectra of formic acid in 1,4-dioxane are best discussed by breaking them into
particdar regions. The spectrum of pure 1,440xane has aùeady been reported by
Malherbe and Bernstein (29) and a spectnim is shown here for completeness (Fig. 3.16a
and Table 3.8). Assignments are taken fiom Malherbe and Bernstein and are based on
C& symrnetry, i.e., the chair conformation. A survey spectrum of HCOOH I 1,4-dioxane
(X@COOH) = 0.509) is also presented (Fig. 3.16b).
Table 3.7: Summary of Concentrations for HCOOH I 1,edioxane.
1 O0 1050 2000
Raman Shift 1 cm"
1 O0 1 OS0 2000
Raman Shift / cm''
Fig. 3-16: S w e y Spectra of:
Table 3.8: Assignment of l&dioxane Spectrum (29).
Frequency I cmSL Assignment
422 v, , ring bending
433 v9, ring bending
486 v3@ ring bending
834 v,, ring siretchhg
852 1 v,, rocking
1015 v,, ring stretching
1109 v,, ring stretching
1 127 V, wagging A
1461 v3 , deformation
2662 V3 + V33
121
Between 100 and 950 cm-' the most interesthg effeas occur between 400 and 500
cnïL. In pure 1.4-dioxane three bands are present between 400 cm-' and H)O cm": at 419
cm-' ( v , ring bend, A& 432 cm" (v,, ring benci, AJ, and 485 cm-' ( v , ring ben& BJ.
As formic acid is added to the system, a new band develops (see Fig 3.17). This band
is f î t apparent at X(HC00H) = 0.305 at a shift of 444 cm-'. T h i s new band, like the
432 cm-' of pure 1.4-dioxane, is polarized. As the concentration of formic acid increases
so does the relative intensity of this band The shift also increases slightly to 450 cm-[.
At the same time the band of 1,4-dioxane at 432 cmeL decreases and by X(HC0OH) =
0.903 the 432 cm-' band has disappeared. The polarization characteristics of these t h e
bands do not change with changing concentration of fomùc acid. Another region of
interest is the O-- deformation region (650 - 750 cm-') of fonnic acid. As the formic
acid is diluted, the effects seen here are aimost identical to those seen in water. With
dilution this band becornes more symmetrical and the high frequency shaulder less
pronound. The remaining two bands in this region (100 - 950 cm") are fiom the l , d
dioxaw. The intense band at -832 cm-' is a ring stntching mode (v,. A$ and the weaker
shoulder at -852 cm" is a CH, rocking mode (v,, A& They are unaffecteci by the
presence of fomiic acid.
Between 900 and 1600 cm-' 1,4-dioxane bas many bands. Most of these (at 1127
cm-', 1217 cm-', 13 W cm-', 1397 cm-', 1441 cm-' and 1459 cm*') have been assigned to
various types of CH, bending modes. Of the remainder, two are ring stretching modes
= C .- (II C m c. C C
350 550 750
Raman Shift / cm"
350 550 750
Raman Shift / cm''
Fig. 3.17: a) 1,4-dioxane b) HCOOH I l,4-dioxane (X(HC00H) = 0.50) 1 - 419 cm*'; 2 - 432 cm*'; 3 - 444 cm*'; 4 - 485 cm*'.
123
at 1014 cm-' (v,, 4) and 1 108 cm-' (v,, Ba and one is a combination mode at 1335 cm-L
(v, + vd . The most interesting changes occur between 1090 cm-' and 1150 cm-' (Fig.
3.18). In this interval pure 1,Qdioxane has two peaks of almost equd intensity. With
increasing formic acid concentraiion a new, depolarized peak at 1096 miL forms. This
peak is fmt apparent at X(HC0OH) = 0.305 and grows as the concentration of formic
acid increases. At the same time the 1,4-dioxane mode at 1108 cm-' decreases. Another
change which can be seen in this region is the development of a band at 1166 cm-'. This
arises from fonnic acid and so its increase in intensity with increasing X(HCO0H) is
hardly surprising. However, in pure formic acid it underlies a broad, asymmetrical profde
ascribed to C-O stretching (see Fig. 3.1). The cornpanion band in pure HCWH is
slightly more intense and centred at 1202 cm-'. In the solutions in 1,4-dioxane this band
(at - 1 170 cm") is distinct fkom the band at 1202 cm-'. The band at 1202 cm-' does not
become apparent until X(HCO0H) = 0.712. The remaining bands in this region do not
seem much affected.
The next important region saidied was between 1500 and 1900 cm-' (Fig. 3.19).
In this region 1,4-dioxane bas no bands of its own and ail the bands arise from carbonyl
stretching of the formic acid. Just as with the diiution of forrnic acid in acetonitrile, some
very pronounceci changes take place. At X(HCo0H) = 0.904 thme underlyhg bands
were obvious for the carbonyl contour. Unfortunately, the bandfitting was not very
reiiable for tbis solution when the-band fi6 were used. At lower concentrations four
900 1025 1150
Raman Shift I cm"
900 1025 11SO 1275
Raman Shift / cm''
Fig. 3.18: a) Rire 1,4-dioxane b) Upper Trace - X(HC00H) = 0.509;
The q u e fit does have a (very slightly) betîer correlation but the relative errors in the
coefficients were much higher. The cubic polynomial gives n = 1.36 (ic., HCOOH :
CH3CN = 3:4) while the quartic polynomial gives n = 1.47 (ie., HCOOH : CH3CN =
2:3). Obviously, then' ambiguity surrounds the mie value of 'a'.
The question now, of course, is "what is the cause of this ambiguity?". The
integrated intensity for the solution with f = 0.904 had an anomalously high value. This
point was not used in the calculations but illustrated the possible limitations of the
bandfitting program used in the analysis. This program, then, may contribute to the
ambiguity surrounding 'n' . However, the biggest problem may Lie in the assumption that
there is only one complex. Possibly, a number of complexes is present. A combination
of a 1 : 1 and a 1:2 complex could yield a distorted Job plot similar to that obsmed here.
Despite the difficulty in detennining the value of 'n', another valuable quaatity can
be extracted from the data. This is the fiaction, a, of acetonitrile which "reacts" to form
the complex. More precisely, it is the fiaction of acetonitrile which exists in a "bound
state. In order to cietennine this, it is necessary to determine the relationship between the
molar scattering coefficients for "hW (JF) and "bound (J,) acetonitrile.
151
In the C=N stretching region of the HCOOH + CH,CN solutions there are three
bands. The high fiequency band (-2270 cmeL) is assigneci to acetonitde "bound to
formic acid. The remaining two bands underlie an asymmetricai band contour centred at
about 2255 cm-'. Even in pure acetonitrile the (=rN stretching band has some low
frequency asymmtry. The asymmetry in the C-N stretching band has been investigated
by a number of workers who gave different explanafions as to its meaning. Bulm (42)
suggested there was association of acetonitrile into dimers; the two bands aise fkom the
dimer - moaomer equilr'brium. Griffiths (43) did not accept this, suggesting instead the
spectral feaaires "a ise fiom s o n unspecined molecular interaction which may well be
localized on the C m pazt of the molecule..". Loewenschuss and YeW (44) argued
the spectral features were not due to an equilibrium between monomers and dimers but
aise because of the existence of clusters in liquid acetonitrile. For the purpose of this
discussion, this is a moot point It indicates the low frrquency asymmetry of the band
at -2255 cmL is not fiom an acetonitrile - fonnic acid or acetonitrile - dichloromethane
interaction. Two bands were useci to fit this envelope.
Assume the two bands underlying this asymmetric contour arise from the C=N
stretch of two "different" kinds of "fiee" acetonitde. k t the concentrations of the two
"fomis" of fiee acetonitrile be CA# and CA. so that:
- when CF - the total concentration of fiee acetonitrile.
Let
The integraîed intensity of the asymmetrical contour is qua1 to the sum of the integrated
intensities of the underlying bands. 'ilmefore,
The individual values of CA,, CA-? Je , and JA- an not known but are implicitly included
in equation 1151.
Let the concentration of "bound acetonitrile be CB. Under m a s bal-:
where C is the formai concentration of acetonitrile.
It is thea possible to calculate JF and JB (cf. Campbell et al. (24)).
Therefore, a plot of IF / C vs. 1, 1 C should yield a line with a slope of JF / JB and an
intercept of Jp Such a plot is given in Fïg. 327. Linear regression gives the following
resuit:
r, 1 C = 8.612 - 1.097 cB / C) r = 0.98 t
From which J, = 7.85 f 1.32 and JF = 8.61 + 0.41.
Calcuiating 'a', the fraction of acetonitrile present in a "bound" state, is now a
fairly simple matter. Mathematically, 'a' is defined as follows:
Fig. 3.27: Determination of JB and JF for the C=N Bands in the (HCOOH + CH3CN) / CH2Q System.
155
Values of a are given in Table 3.12. A plot of 'a' versus ' f is shown in Fig. 3.28a and
shows a steady daxease in a as 'f increases. An increasing 'T ïs quivalent to an
increasing C(CH3CN). Because the expriment is designed to hold the total formal
concentration (Ç = C(CH3CN) + C(HCOOH)) constant, C(HCO0H) must necessdy
decrease. Therefore, CC(CO0H) I C(CH3CN) also decreases and so does the number of
eligible "partners" per acetonitrile molecule. Consequently. the chances of a given
acetonitrile molecule king in a "bound state are lower. Ergo, 'a' kcreases. Figure
3 .î8b shows the variation of 'd as a function of 'R' (= C(HCO0H) / C(CH,CN)). At
high relative amounts of acetonitrile (Le., low 'R'), 'a' is quite srnaIl. Initidly, 'a'
increases very rapidly with 'R' but begins to level off at higher values of 'K.
An "equilibrium constant", "K", was dculated for the two possible complex
stoichiometries (Le., 2:3 and 3:4). The values of "k' were calculated on the basis of the
general equation:
The concentration of "frae" acetonitrile is obtained k t l y fkom the intensity and J,.
From it, the appropriate mole ratios, and the necessary m a s balance, the concentrations
of formic acid and the complex were calculated The "eqdibrium constants" are
summarized in Table 3.13. Also included in Table 3.13 are "K" values assuming a 1 : 1
complex. A numkr of precedents exist in the Literahue (24,26,45-48) for assuming 1: 1
156
Table 3.12: Summary of 'a' values for (HCOOH + CH,CN) I CH2C12.
R = Ç(HCO0H) / Ç(CH3CN)
a = fraction of acetonitde present in a "bound state
Fig. 3.28: Fraction of Bo& Acetonitrile as a Function of: a) 'f and b) 'R' for the (HCOOH + CH3CN) 1 CH2Q System.
158
Table 3.13: Values for "K" for Various Models of HCOOH + CHQT / CH2CI2-
A) HCOOH : C&CN = 3:4
"f' K = 3 C N l f / mol L"
[HCoOHIF / mol L"
[complex ] / mol L-l I
Table 3-13 conrinued.
C) HCOOH: CH,CN= 1:1
ICH3CN]:~ / mol L"
WOOKJ, / mol L-'
[cornplex] / mol L-' I
160
association between nitrile containing and 'OH' containing species, so these "K" values
were calculated for cornparison. Figure 3.29 illustrates "k as a function of f(Cfi3CN).
At low values of 'f, the "k' value is nearly constant- Once 'f is pater than
approximately 0.6 the value of "k' increases sharply. h a study of ortho-cresol and
acetonitrile in a binary system, Campbell, Park and Shwell (24) also fond a strong
dependence of "K" on the concentrations of the species involved A number of possible
reasons for this can be advanced. First, concentrations were used to calculate "K" instead
of activities. At the very high concentrations (on a therrnodynamic scale) used here, this
approximation may not be valid Second, intensity has been assurned to be a iinear
function of concentration. Third, no allowance for possible self association of formic acid
or acetonitrile has been made- In snidies of methanol and acetonitrile Yarwood et al.
(23,49) showed the necessity of doing just this. The dependence of "K" on 'f and the
ambiguous result for 'n' fiom the Job plot suggest the possibility of forming a mixture
of complexes. Because the equilibrium constant increases sharply above f-û-6, the
assumption of a single complex rnay break d o m at this point.
The average solvation number, sh-, for formic acid was also calculated (see Table
3.14). The average solvation number is defined as:
Fig. 3.29: "K" as a Function of 'f': a) 1: 1 Model b) - 2:3 Model; . - 3:4 Model for the (HCOOH + CH3CN) 1 CH& System.
Table 3.14: Average Solvation Numbers fot (HCOOH + C H , O I CH&
where
Pw% = the concentration of "bound" acetonitrile
C(HC00H) = total stoichiometric concentration of formic acid,
Figure 3.30 illustrates the dependence of i4, on [CHjCN], Not surprisingly, as
[CH3w, (and by extension. C(cH,CN)) increases, so does the average solvation number.
While the studies of these solutions necessarily focused on the (rN stretching
region, specm of the carbonyl region were also collected. The C=O stretch of formic
acid is not nearly as good a scatterer as the C-N stretch of acetonitrile. With this in
mind and considering the relatively low concentrations of formic acid, the slits were
opened to 200 p. The spectra are shown in Fig. 3.31a The changes in this region
appear to be a "superposition" of the changes for HCOOH / CH,CN and HCOOH /
CH2C12 The two peaks at 1735 - 1740 cm-' and -1765 c d becorne more and more
prominent (as &scribeci previously) as the formic acid is diluted, consistent with the
results fkom the binary solutions. Bandfitting was applied to these spectral contours.
Unfortunately, the band overlap is quite severe and acceptable fits could not be obtained.
Despite this, intensities of the -1765 cm-' band were estimated from peak heights. This
is, admittedly, a rather cmde means of obtaining intensities, but may be valid to a first
approximation. The band at -1765 cm-' was pnviously assigned to "bound formic acid.
As such, the intensity of this band should have a lin- dependence on the concentration
of the cornplex. Figure 3.31b illustrates the dependence of 1 (1765 aïL) on Eomplex].
1500 1700
Raman Shift / cm"
O O25 050 0.75
kompkxl I moi L''
Fig. 3.3 1: a) Carbonyl Region of (HCûûH + CHSCN) I CH,Cl, 1 - ' f = 0.104; 2 - 'f = 0.507; 3 - 'f = 0.799 b) htensity of 1760 cd band vernis [cornplex]
- 1: 1 Model; H - 2:3 Modei; A - 3:4 Model.
166
These are not relative interisities as debed by equation [Il] but iatensities from spectra
normalized using the 702 cm-' band of CHZCl2. For each of the models the dependence
appears to be roughiy linear. The comlations are not particuiarIy good (r c 0.9) but thu
may arise because of the peak height approximation. The apparent linear dependence of
1 (1765 cm") on Eomplex] gives support to assigning the band at -1765 cm-' to "bound"
fonnic acid.
This chapter describes studies of various solutions of liquid formic acid in an
attempt to elucidate its structure. A second, serendipitous result was found: a pronounced
effect on the acetonitrile spectnim indicative of a formic acid - acetonitrile cornplex.
Formic acid was studied in a number of solvents: water, acetonitriie, t ,4-dioxane
and dichioromethane. The aqueous d t s are consistent with a phenornenon known as
resonance energy transfer occuning in Iiquid formic acid. This, in mm, implies a degree
of structural order in the liquid that allows the oscillators to couple. The hydrogen
bonding pnsent in the liquid formic acid facilitates this coupling and explains the large
noncoincidence effect and great width of the bands in the carbonyl region. Dilution in
acetonitrile and 1,4-dioxane le& to dramatic changes in the Ca band of formic =id.
167
The development of peaks at -1730 cm-' and -1765 cm-' arises from the breaking of the
coupled monomers to fonn "isolated" monomers (-1730 cmeL band) and the formation of
a fomiic acid - solvent complex (-1765 cm-' band). Ia solutioas of formic acid in
acetonitrile a new band (-2270 cm-') in the G N stretcbing region develops and is
assigned to a fomiic acid - acetonitrile complex.
This complex was then studied in temary solutions using dichloromethane as the
solvent. The Job plot gave an ambiguous result. The molar scattering coefficients were
calculated for the " f k " and the " b o d acetonitrile and fiom these the fiaction of
acetonitrile existing in a "bound state was calculateci. This value decreases as the
concentration of acetoniûile increases. The "equilibrium constant'' for the reaction was
also determineci assuming several different formic acid : acetoaiaile ratios. Unfortunately,
for ail the models the equilibriurn constant is not constant. At lower concentrations of
acetonitrile (c -3.0 mol L-') it is nearly constant but above thïs concentration the value
increases sharply. This may indicate some of the underlying assumptions are not valid
or that, in solutions with high formal concentrations of acetonitrile, a mixtures of
complexes is fomed.
H. Susi, J. R. Scherer, Spectrochim Acîa, 1%9 25A 1243
D. Chapman, J- Chen. Soc. B. 1956 225
S. Bratof, D. HadZi, Na Sheppard, Spectrochim. Acta 1956 8 249
G. E. Tomüson, B. ainiutte. C. E. Hathaway, J. Md Spec 1970 36 26
S. M. Blumenfe1d, H- Fast, Spectrochim Acta 1968 24A 1449
P. Waldstein, L. A. Blatz, J. Phys. Chem. 1967 71 2271
H. Geisenfelder, H. Zimmerman, Ber. Bullsenges. Phys* Chem 1%3 67 480
E. Constant, A. Lebnm, J. Cnun Phys. 1964 61 163
G. 1. Swan, N.A.T.O. A.S.I. Seci. C 1991 329 139
A- A. Shubin, IW. M. Nauk Ser- Fiz 1950 14 442
R. J. Bartholomew, M.Sc Thesis, 1992, University of Waterloo
M. H. Brooker, private cornmunicarion
J. Semmler, D. E. Irish, J. Solution Chenz. 1988 17 805
J. Semmier, D. E. Msh, J. Mol* ïüpids 1990 46 1
P. Job, Ann ChUn Phys. 1928 9 113 L. Meites, H. C. Thomas, Advunced Analyhkal Chemistry, pp 297 - 298, McGraw Hill, New York, 1958 M. T. Beck, Chemistry of Cornplex EquilibM, pp 86 - 89, Van Nosaand Reinhold Co., Toronto, 1970
G. Fini, P. Mirane, J. Chem Soc. Faraday T m 1W4 70 1776
M. H. Brmker, O. F. Nielsen, E. Raestgaard, Rmnmt Spec. 1988 19 71
Y-K Sze, D. E. Irish, C a Chem 1975 53 427
R Lindemann, G. Zundel, J. Chem Soc. Far* Tram 2 1972 68 979
T. G. Chang,. D. E. Irish, J. Solution. Chem. 1974 3 16 1
M. Besnard, M. 1. Cabaço, F. Strehle, J. Yarwcmi, Chmr Phys., 1992 163 103
J. M. Campbell, Y. S. Pa, H. F. Shurvell, C m J. Appl. Spec., 1991 36 147
B. Cohen, S. Weiss, J- Phys. C'km, 1984 88 3974
S. C. White, H. W. Thompson, Proc. Roy. Soc.. 1966 A291 460
W. R. Fawcett, G. Liu, T. E- Kessler, J. Phys. Chem 1993 97 9293
2. Deng, D. E. Irish, C a J. Chsn 1991 69 1766
F- E. Malherbe, H. 3. Bernstein, Amer. Chem. Soc., 1952 74 4408
1. Yokoyama, Y. Miwa, K. Machida, J. Amer. Chem Soc.. 1991 1 13 4408
1. Yokoyama, Y. Miwa, K. Machida, J. Phys. Chem, 1991 95 9740
Y-T Chang, Y. Yamiguchi, W. H. Miller, H. F. Schaefer Ill, J. Amer. Chem Soc., 1987 109 7245
J. E. Bertie, K. H. Michaelian, Ji Chem Phys., î982 76 886
EL C. Millikan, K. S. Pitzer, J. Amer. Chem. Soc., 1958 80 3515
V. M. Shelley, J. Yarwood, Chem. Phys., 1989 137 277
J. Jonas, H. D. Thomas, I. Chem Phys., 1989 90 4632
V. M. Shelley, A. Talintyre, J. Yarwood, R. Buchner, Faraday DiscussS Chem. Suc., 1988 85 21 1
B. Desbat, P. V. Huong, I. C h a Phys., 1983 78 6377
C. Perchard, J. P. Perchard, Chem Phys. Lett., 1914 27 445
D. E. Irish, T. Ozeki, in Anulj&aL RmMn Spectroscopy, Chap 4 (J. G. Grasseni and B. J. Bulkin Eds.), John Wiley and Sons Inc., Toronto, 199 1
B. J. Bulkin, Helvet. C h i . Acta 1969 52 1348
A. Loewenschuss, N. Yelün, Spectmchh. Acta 1975 31A 207
M. C. S. Lopes, H. W. Thompson, Spectrochàn Acta 1%8 24A 1367
J. C. F. Ng, Y. S. Park, H. F. Shwell, SpectrochM. Acta 1992 48A 1139
J. C. F. Ng, Y. S. Park, H. F. Shumell, J. Raman Spectrosc. 1992 23 229
S. S. Farwaneh, J. Yarwood, 1. Cabqo, M. Besnard, J. Mol. Liq. 1993 56 317
4. SOLUTIONS OF METHYL FORMATE
4.1 Introduction
Methyl formate is stmcnirally very simüar to formic acid; the acid proton k i n g
replaced by a rnethyl group. As illustrated in Table 4.1, such a small structural change
Ieads to dramatic changes in the physical properties. Despite having a lower molar mass
and a lower dipole moment, f o d c acid has much higher melting and boiling points.
These differences are directly attributable to the hydrogen bonding present in formic acid
The hydrogen bonding has a profound effbct on the specmim which is illustrated in
Figures 3.3 ( C a region of HCOOH) and 4.1 (sa section 4.3).
By studying methyl formate some light may be shed on the problem of the liquid
srnichue of formic acid. The isotrûpic aud anisotropic spectra of fomiic acid reveal an
unmistakeable non-coincidence effcct RJCE, see Fig. 3.4) and this is one of the
manifestations of resonance energy transfer (RET, see chapter 1). Unfortmately, rhe
madels developed to explain the NCE are not applicable to solutions where hydrogen
bonding is present. Methyl formate is the nearest structural analogue to formic acid
where hydrogen bonding is absent. Therefore, solutions of methyl formate were studied
Table 4.1 : Cornparison of the Physical Properties of Formic Acid and MethyI Formate (1).
173
to gain a better un&rstanding of the NCE and RET and to set how good the various
models for the NCE are for solutions of methyl formatc. Methyl formaîe U also of
intriasic interest because, despite its limited liquid range, it has been suggested as a
possible solvent for lithium battery electm1ytes (2).
Infrared (3-7) and Raman (8-10) studies of rnethyl formate have been reponed. I
Two normal coordinate analyses have been performed on methyl formate (13.14) and its
âeuterated analogues (13). Most studied the vapour and liquid (3-6.9) states, but two
have attempted to study the solid (7.9). The infrand (3,S) and Raman (9) spectra have
been assigned and general agnement exists in the literan~e on these assignments.
However, some slight disagreement over structure does exist. The first issue concerns the
existence of two conformers of methyl forniate. Microwave absorption experiments have
established (1 1) that the C a , C-O, and 0-CH3 bonds lie in a single plane. Within this
structural restriction. huo conformations are possible:
The literanire is inconsistent about the application of the tams 'cis' and 'tram' to these
coaformers. Almost al l workers (3-5,9,12) agree methyl formate exists only as conformer
174
1. However, Byrne et al. (6) argued for the presence of a srnail amount of conformer II.
This argument was based on the presence of one band at 1768 miL in C q solutions.
Wilmshunt (3) had stated this band amse from a combination band (CH, symmetric bend
+ C-O bend). Harris et ai. (9) based their Raman assignments on the exclusive presence
of conformer 1. The second issue is the existence of associated species. Wilmshurst
suggested liquid methyl formate was a mixture of associated and unassociated molecules.
Harris et al., however, stated no evidence existed in the Raman spectra to support this
hypothesis.
The NCE has b a n snidied in a wide variety of molecules. The major* of these
systems have contained the carûonyl bct ionai group. Ketones (15-18) and amides (19-
22) have been the most fiequently studkd, but other molecules including liquid S 4 (23),
nitriles (24) and CS, (26), have also been studied, Almost no work has b e n doue on
esters. Therefore, a study of methyl formate (the very simplest ester!) was undertaken
to study its NCE and to shine some light on the structure of liquid formic acid.
Resonance energy tmsfer not only c a w s a non-coincidence effect, it also affects
the vibrational bandwidth. The bandwidth may be written as the sum of individual
components (2 1):
175
where î,,,, is the contributon from pure dephashg and T, is the dephasing contribution
of RET . The third tenn arises h m the "interference" of the fvst two and is only
sifl~cant if the fmt two tenns are of comparable magnitude and if there are statistical
correlations between the processes. The sign of T, may be positive or negative, but thïs
cannot be predicted h m theory. Thus, depending on the sign, the band may be
broadened or n m w e d by resonant transfer. Therefore, dilution (which t u m s RET "off')
can either broaden or narrow the band. If T,, and I', are uncorrelatecl (Le., T, = O), then
RET should always Iead to band broadening.
Knapp (26). however, has argued that when resonant coupling is present, the band
broadening or narrowing c m be explained without considering the cross terms. The
broadening or narrowing of bands is explained on the basis of the nature and raie of the
fluctuations (of the molecale - bath interactions) that Iead to dephasing. Knapp explaiwd
the effect on Raman band positions and widths h m dephashg by using a model based
on the concept of "reactive coupüng" between an active site and a neighbouring site. The
cross tenn, ï,, was assuwd to be zero. With ihis model "reactive coupling" is revealed
by: a) a band shift to lower frrquency (compared to the position at infinite dilution); b)
asymmetry to the high fkquency si& of the isoaapic band; c) broadening or narrowing
of the band which depends on whether the fluctuations are rapid or slow compared with
the "inna&' vibrational dephasing rate. When the total amount of intersite couphg
between the reference site and aii other sites is varied (because of variations in difision
176
or molecular orientations), the presence of RET leads to a broadening of the band If
these variations are counteracted by other changes in the intersite interactions so that the
total coupling is constant, RET will lead to a narrowing of the band. If this latter case
is mie, the removai of RET (by, for example, isotopic dilution) couid lead to band
broadening.
The chernicals used in these experiments were: methyl formate, anhydrous, 99%
(Aldrich), methyl d-formate, 99% (Cambridge Isotope Laboratones) and acetoairnle 99%
(BDH). AU the reagents were used withaut M e r purification. Methyl formate has a
low boiling point, so it was kept refiigerated. Furthermore, to prevent decomposition or
ra t ion with air, it was blanketed under argon.
Because of the small amount of avdable methyl d-formate, the solutions were
made by successive dilution. 10 mL volumetric flash were used. The required amount
of methyl d-formate was measund with a graduateci cylinder, added to the volumetric
flask and its mass recordeci. Methyl formate was then acided to the mark and the solution
weighed again. This solution then became the "stock'' solution for the next highest
concentration. Almost aii of any given "stock solution was used to prepare the next
177
concentration. Using this method, 12 solutions of methyl formate in methyl d-formate
were prepared. The concentrations are given in Table 4.2.
Solutions of methyl formate in acetonitrile were prepared in much the same way
as solutions of formic acid in acetoniaile (see section 3.2). Solutions were prepared in
25 mL volumetric flasks. The required volume of acetonitrile was pipetted using a Mohr
pipette and the mass of the acetoaitrïie recorded. Methyl formate was added to the mark
and its mass recorded. The acetoniaile was pipetted because the high volatihty of methyl
formate makes it ciifficuit to pipette. The voluwaic flasks were capped, wrapped with
Parafilm and stored in a refiigerator. Nine solutions were prepared this way and the
concentrations are given in Table 4.3.
A 5 mL glass syringe was used to fd the sample capillary tubes. For the
solutions of methyl formate in acetonitrile there was sufficient solution to allow the
rinsing of the syringe. However, for the methyl formate I methyl d-formate solutions this
was not the case. For these solutions no rinsing was possible, so the syringe was
dismantled and aliowed to air dry. Because of the volatility of both species, this was
judged to be adequate. Making a good seal on the capiilary tube was essential to
obtaining good spectra. Without a good seal, bubble formation (because of the high
volatility of all the components) was a real problem. Additionaiiy, ailowing the Sealeci
tubes to sit ovemight seerned to alleviated this problem.
Table 4.2: Concentration Summary for MF / d-MF Solutions.
Solution x(d-MF)
pure d-MF 1,000 0.000
RB95101 1A 0.885 0-1 15
Table 4.3: Concentrations Summary for MF / Acetonitrile.
Solution XOMF) @(MF) "
PW 1 -00 1 .O0
RB950622A 0.899 0.9 10
RB950627A 0.799 0.820
a - volume fraction; see section 4.3.2.
180
Ail spectra were collecteci using the 514.5 nm line of an argon ion laser. The
details of the spectrometer, laser, etc. are discussed in chapter 2. For the solutions of
methyl formate in acetonitrile the laser power was 1.5 W. For the methyl formate /
methyl d-fonnate solutions the power was reduced to 750 mW. Bubbles fomed in the
tube at higher laser powers. For ail spectra, the mechanical slitwidth was set at 150 p.
Only the carbonyl region (1625 - 1825 cm-') was studied. AU the spectra were recorded
at 20°C. To coUect the parallel and perpendicular spectra, a polarization aaalyzer was
used Details of this device are given in section 2.5. The orientations of the Polaroid
f h and the scrambler wedge were checked by ninniog spectra of CCl, each day. The
average values for the bands of CC4 were:
= 0.782 P3u = 0.774 P459 = 0.022
which compare reasonably well to the theoretical values of0.75,0.75 and 0. These errors
may arise from imperfections in the film, the wedge, or k a u s e the analyzer is not
properly aligned with the dit andlor optic axis. Also, the theoretical values apply to
isolated, non-interacting molecules.
Figure 4.la shows a survey spectrum of methyl formate and assignments (taken
form Harris (9)) are given in Table 4.4. The work presented in this chapter is concemed
100 575 1050 1525 2000
Raman Shift / cm"
1625 1725 1825
Raman Shift / cm''
Fig. 4.1 : a) S w e y Spectnun of Methyl Formate b) Carbonyl Region of Methyl Formate.
Table 4.4: Assignment of the Methyl Formate and Methyl d-Formate Spectra (29).
Frequency / cm"
Assignment Frequency / cm-'
v19 CH, stretch
- -
v,, v3,
CH, and CH stretch 1 V49 7 2 2 3
C=O stretch -- -- - - - - - - - - -
v149 1689 CH, deformation
V69 1456 CH, deformation
V79 1433 C-H in plane bend
v89 1215 C-O ~Cretch
--- - -- - -
1162 v97 1159 O-CH, in plane bend
1030 169 1050 CH out of plane kad
907 v 109 869 0CH3 saetch
767 VIL* 849 O-C-O bend
l v179 skeletai torsion 1
VI29
~ C-O-C bend
Assignment
"19
CH, stretch
'729
CH, stretch
v39 CD stretch
VL4S
CH3 deformation
V69
CH3 deformation
V89
C-O stretch
v99 OCH, in plane bend
v79 C-D in plane bend
v 109
O-CH, stretch
167
CD out of plane bend
V1'9
O-C-O bend
"129 V17*
C-O-C bend skeletal torsion
183
exclusiveiy with the behaMour of the carbonyl band at -1720 cm". This band is show
in more detail in Fig. 4.lb. Even a cwsory look at the specaum shows then are at least
3 bands in the carbonyl region: one strong, asymmetricai band at -1720 cm'' and nnro
weak bands, one to higher fiequency and one to lower fkquency. Harris et al. (9) did
not assign these bands. The bands are centred at -1695 cm-' and 1762 cm-'. Byme et
al. (6) assigned a band at 1768 cm-' to the C O stretch of conformer II, but Harris
assumed methyl formate to be entirely conformer 1.
43.1 Methyl Formate 1 Methyl d-Formate
Raman spectra were recorded of 12 soiutions of methyl forniate (MF) in methyl
d-formate (d-MF) plus pure MF and pure d-MF. As mentioned in the experimental
section, the solutions were proàuced by successive dilution of the d-MF in methyl
formate. The mole fiactions of each solution are s w d in Table 4.2.
Figure 4.2 presents the isotropie and anisotropic spectra for pure MF and pure d-
MF. The carbonyl band shifts nom -1720 cm-' to -1691 cm" with isotopic substitution.
Unlike the MF, the à-MF has a prominent band - 175 1 cm*'. Harris (9) assigned this band
to 2v,, Susi (5) observed similar spectral feanue~ with IR spectroscopy ami suggested
Fermi resonance was taking place.
I\r Isotropie
1625 1725 1825
Raman Shift / cm"
L Isotropie
1625 1725 1825
Raman Shitt / cm''
Fig. 4.2: Isotropie and Anisotropic Spectnc a) Methyl Formate b) Methyl d-Formate.
185
Figure 4.3 shows the isotropic and ankotropic spectra of a solution of MF / d-MF
(?CO = 0.504)- Not unexpectedly. the carbonyl mode is strongly polarized The band
overlap of the carbonyl modes of the two isotopomers is significant but not severe. In
order to study the behaviour of the spectral contour atuibuted to one or other of the
isotopomers. the band parameters for the individual contours must be calculated. This
was done by applying bandfitting (see section 2.6). The total contour was fitted with six
bands. Then. the individual compments of the C=û mode were added together to
reconstmct the carbonyl contour of the isotopomer of interest. A cornparison of the
original spectnim and the reconsmicted contour is shown in Fig. 4.4a and the individual
band components for the complete contour are given in Fig. 4.4b. An example of the
recombinatioa procedure is show for the C=û mode of MF (X(MF) = 0.504) in Fig. 4.5.
The recoastructed contours were used for the subsequent data analysis.
The most obvious thing to extract from the re-constnrcted spectra is the position
of the peak maximum in the isotmpic and anisotmpic spectra The isotropic band is
clearly asyrnmetric and more wiii be said about this later. The isotropic and anisotropic
peak maxima (for MF) are summarized in Table 4.5. The isotropic band shows an
obvious shift to higher fnquency as the MF is diluteci (see Fig. 4.6a). Yamood (21)
made the same observation for isotopic mixtures of N,N-dirnetbylformamide. In aqueous
solutions of formic acid, a similar effect is seen. If a Iinear extrapolation is applied to
the data an isotropic position of 1733 cm-' is found at infinite dilution. Admittedly, no
1725 Raman Shift 1 cm''
Fig. 4.3: htropic and Anisotmpic Spectra of Methyl Formate I Methyl d-Formatt (X(MF) = 0.504).
1625 1725 1825 Raman Shift / cm"
1725
Raman Shift / cm"
Fig. 4.4: Bandfittiag Results for Methyl Formate / Methyl d-Formate @(MF) = 0.504): a) ûverall Calcdatcd Contour and Original Data b) Overall Calcuiated Contour and Components.
Fig. 4.5: Overall Calculateci Contour and Component Bands for the Carbonyl Stretch of Methyl Formate I Methyl d-Formate (x(MF) = 0.504).
Table 4.5: Summary of the Band Positions for MF / d-MF.
Fig. 4.6: Peak Positions for Methyl Formate / Methyl d-Formate: a) Isotropie b) Anisotropic.
191
theoretical b a i s exists for using a linea. extrapolation on these data However, the data
do suggest a linear extrapolation is misonable. The anisotropic peak data are not quite
as "well behaved (see Fig. 4.6b). Only the most optimistic eye wouid claim any
defintive dependence on mole fraction. The (very) gross tendency, however, appears to
be a slight shift to higher fkquency as the MF becomes more dilute. This, too, is similar
to the behaviour of fotmïc acid (in waier) where the anisotropic peak shifted, but only
very slightiy, to higher fiequency. As an obvious consequence, the difference v,, - v,
(Le., the NCE) decreases as the MF becomes more dilute. The differences are tabulated
in Table 4.5 and plotted in Fig. 4.7. The plot shows the Merence tends to zero (just as
expected) as the concentration f d s to zero.
A close look at the isotmpic spectmm of MF shows the C--O band (at l e s t in the
reconstxucted fom, Fig. 4.5) is asymmetric on the "blue" side. Because of this
asymmetry, Logan's theones (27*28) cannot be applied directly because the band maxima
cannot be equated to the fmt moments. The band fmt moments, M, must be calculated
and are given in Table 4.6. The more asymmetrical a band, the greater is the difference
between the fmt moment and the band maximum. Figure 4.8 shows - v, as a
function of mole fiaction of mthyl formate. The isotropic band becomes more and more
symmetrical as the mthyl formate is progressively diluted. At fairly dilute (but non-zero)
concentrations the diffexence is essentiaily zero indicating the band is symmetrical. More
WU be said below about this asymmetry.
Table 4.6: Summary of the Fit Moments for MF / d-MF.
Fig. 4.8: 4, ( = M, - v,) vs. X O for Methyl Fomate I Methyl d-Formate .
195
For a simple isatopic dilution, Logan developed a mode1 (27) (see section 1.3.4)
to calculate the dependence of the NCE on mole fiaction of the active species:
M,-M-- - A-X 121
where
L- L - the anisotropic f h t moment
MW. - - the isotropie fmt moment
&=a = the splitting in the pure active species
X - - mole hction of the active species
A plot of M.-,- - M, versus X(MF) is given in Fig. 4.9. The splining has a linear
dependence on X O , but the correlation of the line is not very good If the two points
at X O = 0.357 and X(MF) = 0.884 are neglected, the correlation is much improved
(r = 0.939) and the equation of the Line is given by:
Ma-M' - 5.1X - 0.658 131
In neat methyl formate the noncoincidence is 4.1 cm". Within the confidence interval
of the linear regression the dope is the same as &. The intercept also lies within the
confidence interval.
Lastly, the data show an important effect of dilution on the halfwidths of the
bands. This is most pronounced for the isotropic band Because it is asyrnmetric, the
haifwidths at half height are different for the low ("red) ftequency and high ("blue")
Fig. 4.9: Test of Logan's Mode1 (26) for the NCE of Methyl Formate 1 Methyl d-Formate.
197
fiequency sides of the band. Table 4.7 and Figure 4.10a show the variations of these two
halfwidths as a function of mole fiaction. At high MF concentrations the ciifference in
the two values is quite large. As the MF is diluted the high frequency halfwidth is
virtuaily constant until X(MF')-0.5 at which point it fdls dramaticaily. The low frequency
halfwidth increases very slowly and then decreases slightly. The increase is only very
slight and is surprising. Necessarily, then, the IWHM of the isotropic band uiitially
increases as the MF is diluted. It rises to a maximum at X0-0.5 and then f d s quite
steeply (Fig. 4.10b). An increase followed by a decrease in bandwidth is unusual.
Normally, as the solute is diiuted the cesonance energy transfer becomes less and Iess
effective because solute molecules in the solvation shell are replaced by solvent
molecules. This should lead either to band broadening or narrowing, but not botb.
The results for MF / d-MF cm be summarized as follows. F i t ly , the peak
maximum of the isotropic band moves toward higher kquency as the MF is diluted The
data suggest a linear dependence. The anisotmpic peak is not as definitive. Second, there
is high frequency asymmetry on the isotropic band. The asymmetry decreases as the MF
is diiuted. Third, the NCE behaves just as pedicted by Logan's mode1 (27)- i.e., it has
a linear dependence on the mole fraction. Logan argued thaî RET was responsible for
the NCE. Founh, the FWHM of the isotropic band initiaily increases as the concentration
decreases but fds dramatically for concentrations below X(MF)-0.5.
Table 4.7: H W ? i M ' s and FWHM's for MF / d-MF-
Fig. 4.10: Effect of Dilution on Bandwidth of Methyl Formate / Methyl d-Formate: a) HWHM (solid line - low fkequency HWHM, dashed line - high fresuency HWHM) b) FWHM.
200
As mentioned above, the band of C-O in MF does show a shifi to higher
frequency with dilution and a very distinctive high fiequency asymmetry. Under Kaapp's
(26) mode1 this is evidence of reactive coupling in methyl formate. The loss of the
asymrnetry is also quite typical of this model. The behaviour of the FWEM of the
isotropic band is rather unusual. Yarwood's (21) work on dimethyl formamide showed
a steady increase in the HWHM as the dimethyl forniamide was dilutd Yarwood argued
this was consistent with Knapp's model because reactive coupling couid lead to
broaàeaing or narrowing of the band with dilution. The behaviour of the FWHM does
not conform with Knapp's model (26) for resonant coupling. At fïrst it increases but then
decreases having a fairly distinctive maximum at X(MF)-OS. Clearly, this is not
expected from Knapp's model. If the observation is r d (as opposed to an artifact of
bandfitting or experimeatal error), it implies a significant change in the nature of the
intersite coupling. Lnitially (that is, for solutions concentrated in MF). the amount of
coupiing at a given reference site nmains fUed This leads to band broadening as the
MF is diluteci. At X(MF)4.5 the aniou11t of coupling is no longer fixeci- Diffusional and
reaientational effkcts (as weil as any other phenornena affecthg the totai amount of
couphg) then cause variations in the totai amount of vibrational coupling. As this
happens, the band begins to n m w with dilution. An alternative explanation exists.
Knapp's model is predicated on the assunption that the pure dephasing and the RET
contributions to vibrational dephasing are uncomlated (Le., T, of equation [l] = O). If
r, is not zero, the band may be broadened or narrowed with dilution depending on the
201
sign of î,. For the methyl formate system these two dephasing mechanisms may, indeed,
be cornlateci and the sign of T, may change with dilution.
So far the emphasis bas been very much on the behaviour of the C=O band of
methyl formate. The obvious question to ask, then, is, "what about the C S band of
methyl d-formate?". This band is centred at about 1690 cm-' in pure d-MF (Fig. 4.2b)
but with dilution shows a smdl shin to -1698 cm-' at X(d-MF) = 0.1 16. In pure d-MF
the NCE is much srnailer (-2.4 cm-') than in pure MF (-7.0 cm''). Yarwood's (21)
resdts for dimethyl formamide showed the NCE for the two isotopomers to be warly
identical. Furthemore, unlike pure MF, the isotropie band of d-MF does not appear to
have any high fiquency asymmetry. However, a possible complication exists. Harris
et al. (9) assigned the band at -1751 cm'' to 2v, It has rather high intensity for an
overtone band and this raises a question about the possibility of Fermi resonance with the
C=û fiuidamentai. Susi (5) assigned two bands at 1712 cm-' and 1751 cm-' ( h m
infkared spectroscopy) to C=û stretching in Fermi monance with a combination band
(1441 + 304 cm''). Fetmi resonance. of course. affects the intensities and fiequencies of
the bands involved. If Fermi resonance is occurring, any attempt to study the N(3E of the
C=û band is futile. For this nason, a detailed investigation of the C=O band of d-MF
was not performed
The advantage of using acetonitrile as a solvent is that it has no bands which
overlap those of the carbonyl region of methyi formate. This makes band resolution and
reconstruction that much easier (see Fig. 4.1 1). Unfortunately, using non-isotopic dilution
leads to greater theoretical complexity (27-30,33). Certain assumptions can no longer be
made. That king said, the resuits for solutions of methyl formate in acetonitrile are
qualitatively quite similar to those seen for MF / d-MF.
Ten solutions of methyl formate in acetonitrile were prepared and the
concentrations are summarized in Table 4.3.
The dependences of the isotmpic and anisotropic band positions on mole fraction
are illustrateci in Table 4.8 and Fig. 4.12. Qualitatively, the dependences are very simiiar
to those seen in the isotopic dilution. The isotropic band position depends much more
strongly on the mole fraction than the anisotropic band. For the isotopic dilution, a linear
extrapolation gives an isotropic band position of 1733 f 1.3 cm-' at M i t e dilution
compared to 1730 f 0.91 cm-' in acetonitrile. When the statistical error limits are
considemi, these two values are vimially the same. The comlation of the line is not as
good for the isotopic dilution and this is probably a d t of greater bandfitting
uncertainty. The dependence of the isotropic band position on mole fraction (i.e., the
1625 1725 1825 Raman Shift / cm''
1725
Raman Shift / cm"
Fig. 4.1 1: Bandfitting in the Carbonyl Region of Methyl Formate I Acetonitde @(MF) = 0.494): a) Overail Calculated Contour and Onginal Data b) O v e d Calculateci Contour and Components.
Table 4.8: Summary of the Band Positions, N a ' s and Relative NCE's for MF / Acetooitde.
Rel- NCE
Fig. 4.12: Carbonyl Band Positions for Methyl Formate / Acetonitrile: a) Isotropie b) Anistropic.
206
slope of the line) is virtually the same for both the isotopic and non-isotopic dilutions.
As with the soIutions in d-MF, the NCE (v,. - v,) decmses as the MF is diluted (see
Fig. 4.13). The RET is king "tumed off just as it was in the isotopic dilutions.
However, the NCE disappears "faster" in the isotopic dilution. Imposing a linear fit on
the data gives a slope of 8.9 I 1.2 for the isotopic dilution but only 7.0 + 1.4 for dilution
in acetonitrile. Considering the emr limits, however, these values are the same. This
is an unfortunate result of the poor correlations on the lines. It seems reasonable to posit
that the NCE decreases more rapidly with isotopic dilution than with non-isotopic
dilution. The implication then becornes that E T is reduced / elirninated "quicker" (with
respect to concentration) by isotopic dilution, for which solvent molecules are more
s M a r in size and mass.
The ability of several models (presented in chapter 1) to describe the dependence
of the NCE of MF on concentration was tested. To begin, however, the "relative
splitting" must be defined. This quantity is given by:
Fig. 4.13: NCE (= v,. - v ~ ) for Methyl Formate / Acetonitrile vs. Mole Fraction.
where
A(@) - the splitting at a given volume fraftion
A(@ = 1) C - the splitting for the pure solute
AU the models are baKd on using volume fiaction as the concentration scale. This is to
take advantage of the assumption that the dielectrïc constant can be wrïtten as a simple
linear function of the concentraiion of the solute:
where
El - - dielectric constant of the solvent
E2 - - dielectric constant of the solute
@ - - volume fiaction of the solute
All the models have a is0 asswned ideal solutions (3 1). Therefore, al1 the concentrations
on a mole fiaction scale are easily converted to volume fiactions using the densities of
the solute and solvent. This conversion is given in Table 4.3. Obviously, the dielecaic
consta-nts must also be known. The solutions were run et 20°C and at this temperature
the dielectric constant of acetonitrile is 36.94 (32) and of methyl formate is 8.5 (1). The
models of Fini and Mirone (15-17), McHale (29,30) and Mirone's modification (33) of
McHale9s model were examined. Logan's model (28) for non-isotopic dilution was not
tested This model assumes the hard sphere diameters of the solute and solvent are within
10%. Without knowing the bard sphere diameters, examining his mode1 is pointless.
209
Fini and Mirone's model (15-17). an empincal derivation. gives the following
dependence of splitting on volume fraction:
for @ c 0 ,
where $is some "thnshold volume" below which there is no Na. The fmt thing to do,
then, is determine the threshold volume for MF I acetonitriie. The plot of Av versus 9
(MF) was extrapolated using a bear fit to obtain O, (see Fig. 4.14). The equation of the
line is given by:
Av = 7.07 @ - 0.678 r = 0.971
fiom which $, = 0.096. If the point at + = 0.467 (which appears to be anornabus, see
Fig. 4.13) is neglected, the equation becomes:
Av = 7.22 @ - 0.878 r = 0.985
and @, = 0.122. Figure 4.15 gives a cornparison of the obsewed splitting and the splitting
predicted by Fini and Mirone's mdel. Three predicted curves comsponàiug to @, = O,
0.096 and 0.122 are plottecl. The model fails badly. Other workers have found a fairly
aood agreement between their work and the model (18,20). In the examples given in Fi &
and Mirone's own paper (16). the dielectric constant of the solute was generally hi&
Fig. 4.14: NCE (= v, - v,) of Methyl Formate / Acetonitrile vs. Volume Fraction-
Fig. 4.15: Test of Fini and Mirone's Mode1 (15-17) for the NCE of Methyl Formate in Acetonitrile: Dashed Line: 0, = O; Dotted Line: 0, = 0.096; Solid Line: 4, = 0.122.
212
of the solvent and several times the solvent was non-polar. Here. both the solute (MF)
and the solvent (acetonitde) are quite polar and the dielecnic constant of MF is quite low
relative to that of acetonitde. Furthemore, the assumption of ideal solutions is suspect
To assume two Iiquids as polar as these two do not interact is probably not valid
Figure 4.16 shows the theory of McHale (2930) and Fig. 4.17 shows Mirone's
modification (33) of McHale's theory. As an aside. Mirone's modification requires
knowledge of the index of refkaction of the solution. McHale's theory gives:
where
AM = the difference in the band d t moments: M-,- - ly,
fwaE= M-,,. - M, for the pure liquid.
(see equations 1331 - 1351 of chapter 1). These values for methyl formate are summarized
in Table 4.9. Mirone modified this equation to give
Fig. 4.16: Test of McHale's Mode1 (29,30) of the NCE for Methyl Formate 1 Acetonirrile.
Fig. 4.17: Test of Mirone's (33) Modification of McHak's Model (29,30).
Table 4.9: Summary of the Band Moments, NCEs and Relative N a ' s for MF / CH&N.
mm w s o . wl"S0. NCE / cm" / cm-' / cm"
0.095 o. 107 1728.6 1729., O*,
O. 199 0.221 1727, 1729, 1%
0.296 0.325 1726., 1727, 1-0
0.434 0.467 1726, I72gmg 3 -4
0.494 0.528 1 726.3 1 727.g l - 6
0.594 0.627 1726, 1 728 .2 1-7
0.699 0.727 1 72Se6 1727, 2* 1
0.799 0.820 1724., 1727, 2-5
0.899 0.9 10 1722, 1726, 3-7
1 .O0 1 .O0
Rel. NCE
where C is a constant given by:
(the subscript '2' designates values for the pure solute). Therefore, the refractive indices
had to be measme& The refractive indices of MF and acetonitrile are virtudy identical
(1.3433 and 1.3423, respectively (1)). A plot of 'n' versus volume fraction is shown in
Fig. 4.18 (and Table 4.10). This plot has considerable scatter but suggests the 'n' values
maximize near X O = 0.5. The "rippling" in the Fig. 4.17 is because of this scatter.
As shown in Figs. 4-16 and 4.17 the behaviour of MF in acetonitrile does not conform
with either one of these models. McHale (29) has stated her theory is only applicable in
the "dilute solution regime" where aggregation is negiected, For a polar species such as
methyl formate at the concentrations used here, this model may not be appropriate.
Additionally, the ideal solution assumption has been made. Further, Torii (34) has shown,
using Monte Car10 simulations, that in the case of acetone the dieleceic screening
approach of McHale is hadequate for explainhg the NCE. Logan's (27,28) is bener.
In amending McHale's model, Mirone (33) made no assertions about the range of
applicability .
The asymmetry present in the isotropie band of MF 1 d-MF is also pnsent in the
solutions of MF I acetonitrile. Just as before, the asymmetry (as measured by M, - v,)
Fig. 4.18: Index of Refkaction of Methyl Formate I Acetonit.de Solutions.
Table 4.10: Indices of Refiaction of the MF / Acetonitrile Solutions.
219
decreases as the MF is diluted (see Fig. 4.19). If a hear fit is imposed on the M, - v, versus X(MF) plot, the slope is 45 + 0-75. For the isotopic dilution, however, the slope
is 4.7 f 0.47. Within the statistical errors the slopes are the same. Just as with the
isotopic dilutions, the asymmetry of the band is vividiy shown by comparing the two half-
widths. The high frequency half-width is somewhat greater than the low frequency
asymmetry (Fig. 4.20 and Table 4.1 1)- This agrees with Knapp's d e l (26) in which
high frequency asymmetry is seen for coupled osciliators. The "blue" haif-width is also
more strongly Hected by dilution. decreasing quite rapidly below X(MF)-0.7.
The behaviour of the full-width at half maximum of the isotropic C=O band is
somewhat different for the two solvents. In d-MF the FWHM initiaily rises and then,
below X0-0.5, falls rapidly. In aceton.it.de the initial rise is much smaller. As
mentioned above, within Knapp's mode1 (26) this sort of behaviour is unexpected. Bands
may broaden as the solute is diluted and Yarwood (21) observeci this in solutions of
dimethyi formamide. However, an initial increase followed by a decrease is unusual. In
the case of the acetonitriie solutions. the largest FWHM reached is 15.5 cm-' at X(MF)
= 0.699 (see Table 4.1 1 and Fig. 4.20) This is just banly sigaificant compared to the
EWHM of pure MF (14.7 cm-'). The largest FWHM for the isotopic dilution is 16.8 cm-'
at X O = 0.504 (see Table 4.7 and Fig. 4.10) and this LF significantly pa te r than the
pure methyl formate. These resuits imply that vibrational &phashg follows a dinerent
mechanism in acetonitrile than in d-MF. The intermolecular potentiai and coupling
Fig. 4.19: 4, (= M, - v ~ ) vs. X O fot Methyl Formate / Acetonitrile.
22 1
between methyl formate molecules must be different in the two solvents. Interestingiy,
after the maximum bandwidth is reached it f a s more sharply in acetoniaik than in d-
MF. In acetonitrile, then, the concentration range over which the total amount of inteaite
coupling is nxed is quite srnaIl. Dinusional and orientational effects (as welI as any other
phenornena affecthg the total amount of coupling) become sigaificaot at higher
concentrations of methyl formate, leading to a denrase in bandwidth below these
concentrations. Possibly, as explained in section 4.3.1, the pure dephasing and RET
contributions to bandwidth are correlated (i.e., T, of equation [l] # 0) and the sign of T,
may change with dilution.
The results for methyl formate in acetonitrile cm be summarized as follows. First,
the dilution of methyl formate leads to a progressive shift of the isotropic band to higher
fiequency. A hear extrapoiation gives a Raman shift of 1730 cm" at infite diiution.
The high frequency asymmetry of the isotropic band decrwes as the MF is diluted.
These two observations are qualitatively identical to those seen for the isotopic dilution.
The NCE decreases with dilution but does not conform to any of the thne models tested
It must be saiâ, however, that McHale's mode1 (29,30) was derived for diiute solutions
so its application here may be invaliâ. The FWHM of the isotropic band shows an initial
(but very slight) increase foiiowed by a de-; different in degree fiom the FWHM
behaviow in the isotopic shidies where a clear maximum was observed.
Table 4.1 1: H W H M ' s and FWHM's for MF / AN.
HWHM ("red") HWHM ("blue") I I
Fig. 4.20: Effect of Dilution on Bandwidth for Methyl Formate / Acetonitrile: a) HWHM (solid line - low fnquency HWHM, dashed line - high frequency EWHM) b) FWHM.
The results lead to some important conclusions about the nature of liquid methyl
formate. Resonance Energy Transfer is one avenue for vibrational dephasing in organic
liquids. It manifests itself most clearly in a non-coïncidence of the isotropic and
anisotropic peaks which decreases as the solute is diluted A number of models (15-
17,27-30,33) have been suggested to account for its dependence on concentration. The
studies of methyl formate clearly indicate this effect is occurring in the liquid. The
isotopic dilution studies conform with the theory of Logan (27) wherein the NCE has a
linear dependence on mole fraction of the "active" species. Unfortunaiely, for the non-
isotopic dilution (in acetonitde), the NCE of methyl formate does not confonn with any
of the models t e s a The reasons for this nonconforrnity are not known. It may, in part,
be a result of assuming ideal solution behaviour. Fini and Mirone did suggest two
reasons for possible failures of their modei. First, the dielectric constant might not be a
linear function of volume ktion. Second, specific, short range interactions might not
be adequaîely described by the dielectrïc constant. In the case of McHale's mode1 (2930)
application to solutions as concentrated as those used here is not likely valid. However,
the NCE is decreased as the MF is diluteci. In addition, the "rate" of the decrease of the
NCE is greater for the isotopic dilution thm for the non-isotopic dilution. Because the
NCE disappears faster with isotopic dilution, the methyl formate oscillators are king
225
decoupled more quickly. Methyl d-fonnate is better at dismpting the preferential
alignment required for RET to take place. Intuitively, thû &es sense. A deuterated
analogue should find it easier to penetrate the solvation shell than a completely "foreign"
species.
One of the oddities of these results is the behaviour of the full-width at half
maximum of the isotropie band Under ICnapp's (26) model RET can broaden or narrow
a band even when pure dephasing and RET are uncomlated. Yarwood (21) has found
band broadening with isotopic dilution and explaineci it in temu of Knapp's model. For
both the isotopic and non-isotopic dilutions, the FWHM fmt increases and then decreases.
Thus, according to Knapp's model (26), the total amount of intermolecular coupling is
constant for the concentrated solutions of MF and the band broadens with dilution.
At some concentration (X(MF)-0.5 for isotapic and X(MF)4.7 for non-isotopic
solutions) this is no longer, true and the band nanows with dilution. Aiternatively, the
pure dephasing and resonant energy eansfer may be correlated (see equation cl]).
Because the initiai rise is smaller and the concentration at which nanowing begins is
higher, the nature of the intermolecular potential for methyl formate molecules must be
solvent dependent.
CRC Hancibook of Chemistry and Physics, 1' Student Edition, CRC Press, Boca Raton, 1988
Z Deng, PhD. Thesis, m3, University of Waterloo
J. K. Wilmshurst, J. MOL Specnosc. W57 1 201
T. Miyazawa, Buil. Chem. Soc. Jpn 1%1 34 691
H- Susi, T Ze& SpectmchUn. Acta 1963 19 1933
J. S. Byme, P. F. Jackson, K. J. Morgan, N. Unwin, J. Chem Soc. Perkh Trans. 2 1973 845
J. E. Katon, N. L. Ranieri, Spec. Lem 1978 11 367
H. V. Venkatasetty, J. Electrochenr Soc. 1975 122 245
W. C. Harris, D. A. Coe, W . O. George, Spectrofhim. Acta 1976 32A 1
Z. Deng, D. E. Irish, Cim. J. Chmr 1991 69 1766
R. F. Curl, J. Chem Phys. 1959 30 1529
E. Bock, Can. L Chem l967 45 2761
EX. Susi, I. R Scherer, Spectrochim. Acta 1969 25A 1243
P. Matzke, O. Chacon, C. Andrade, J. MOL Struct. lW19 255
G. Fini, P. Mirone, J. Chem Sac. Faraday Trmrs. 1974 70 1776
P. Mirone, G. Fini, J. Chem Phys. 1979 71 2241
M. G. Giorgini, G. Fi. J. Chem. Phys. 79 639
M. Runoun, P. Mirone, Chem Phys. Le#. 1980 75 287
H. D. Thomas, J. Jonas, J. C k P M 1989 90 4144
V . M. Shelley, J. Yarwood, Chmr Phys. l989 137 277
V . Shelley, J. Yarwood, MOL Phys. 1991 72 1407
A. Mortensen, O. F. Nielsen, J. Ymood, V. Sheiley, J. Phys. Chem. 1994 98 5221
M. Kamoun, J. Raman Spectrosc. 1197 8 225
G. Fini, P. Mirone, Spectrochmi. Acta 1976 32A 625
S. L. Wallen, L. Nikiel, Y. Yi, J. Jonas, Chem Phys. Le#. 1994 82 229
E. W. Knapp, J. Chem. Phys. 1984 81 643
D. E. Logan, Chem Phys. 1986 103 215
D. E. Logan, Chem. Phys. 1989 13 1 199
J. L. McHale, J. Chem Phys. 1981 75 30
C. H. Wang, J. McHaie, J- Chem. Phys. 1980 72 4039
J. Yarwood, privufe communicarion
A. Würfiinger, Ber. Bunsenges Phys. Chem. 1980 84 653
P. Mirone, I. Ckm, Phys U82 77 2704
H. Torii, J. Molec. Stnurt. (Tkeochenr) 1994 31 1 199
5. SUMMARY AND CONCLUSIONS
5.1 Formic Acid
Fonnic acid was snidied in a number of solvents: water, acetonitrile, 1 -4-dioxane
and dichloromethane. Each of these solvents had a different effect on the spectnrm of
formic acid, although the spectra for the acetoaitrile and 1,4-dioxane solutions were
somewhat simiiar. For the aqueous solutions a very pronounced noncoincidence effect
(which decreased as the formic acid was diluted) was seen. The size of the NCE
(especiaily when compand to non-hydrogen bonded methyl formate) and the great width
of the bands strongly suggest resonance enetgy transfer is occunhg. The presence of
RET implies considerable "structurai order" (no doubt augmented by the hydrogen
bonding) in the liquid which dows the individual oscillators to couple. Dilution in
acetonitrile and 1,4-dioxane led to the development of two peaks at -1735 cnïi and at
-1765 cm-'. The band at -1735 cm" is almost coincident with the carbonyl fiequency
of dilute methyl formate. Because methyl formate is a "model" for non-hydrogen bonded
formic acid the -1735 cm-' band was assignecl to "free" formic acid. The -1765 cmeL
band does not appear in soiutions of fonnic acid in water nor in solutions in
dichloromethane. Because independent evidence existed for a formic acid--solvent
229
complex in acetonitrile and 1,Qdioxane solutions (perturbations in the spectra of pure
acetonitrile and pure 1,4-dioxane), the band at -1765 cm-' was assigned to a formic
acid-solvent complex.
For the formic acid / acetoaitrile solutions, this complex was studied in more
detail. A shoulder at -2270 cm" developed on the CoN stretch at -2255 cm-' and was
assigned to the C=N stretch of acetonitrile "bound" to formic acid A Job Plot gave an
ambiguous result. Equiübrium constants were calculated using several different
stoichiometries. For ail models the equilibtium constants increased dramatically at high
formal concentrations of acetoniaile. The formation of more than one complex is
possible and at the higher concentrations of acetonitrile a mixture of complexes may exist
Future work on solutions of formic acid should focus on achieving a beiter
understanding of the formic acid--acetonitrile complex. The most immediate question is
the possibility of a mixture of complexes at high relative arnounts of acetonitrile. The
"Job" plot constructed nom these experiments was based on rather hi@ formal
concentrations of both acetonitrile and fonnic acid. The preparation of a second Job plot
with lower formai concentrations wouid be useful. Furthemore, it might help resoIve the
ambiguity concernïng the CO-ordination numkr. Solutions with a constant concentration
of formic acid but varying concentrations of acetonitrile should also be shidied. Such
studies couid sheà some light on the question of the presence of more than one complex-
230
In addition to these immediate suggestions, the project codd be expanded dong two other
lines. Fht, formic acid and its "association" with other nitriles (e.g., butyronitrile or
acrylonitrile) couid be examined- Second, the "association" of other carboxylic acids
(e.g., acetic acid) and acetoninile couid be studied-
5.2 Methyl Formate
Originally, methyl formate was studied to gain a bettex understanding of the
structure of liquid formic acid. This was not quite as successfbl as ho@ However,
experiments on rnethyl formate did yield some important observations. Fht, the carbonyl
band is mucb narrower and the non-coiiiciàence effect is much smaller for methyl formate
than for formic acid. Unlike mthyl formate, formic acid can be expected to be
extensively hydrogen bonded. The large ciifferences in baudwidth and NCE (between
formk acid and methyl formate) support this assertion. Second, in both acetonitrile and
methyl d-formate the carbonyl band maximum at infinite dilution was - 1730 c d , almost
coïncident with a band in solutions of formic acid. Consequently, the band at -1735 cm-'
in fonnic acid was assigneci to "free" formic acid monomer. Third, the spectrum of
methyl formate in acetonitriie did not show any association between methyl formate and
acetonitrile. ûther than reducing the size of the NCE, the acetonitrile did not affect the
carbonyl region of methyl formate. Furthemore, the G N stntch of acetonitrile was
23 1
unaffecteci. These observations led to the conclusion that (not Surpnsingly!) association
between formic acid and acetonittile occm t h u g h the acid proton and the nitrogen of
acetonitrile.
In addition to these observations, the experiments revealed some interesting facts
about the structure of liquid methyl formate. A non-coincidence effect in methyl formate
indicates resonance energy transfer is taking place in iiquid methyl formate. The size of
the NCE decreases as the methyl formate is diluted. Qualitatively, the behaviour of the
isotropic band - a) a band shZt to higher frequency with dilution; b) high frequency
asymmetry wùich decreases with dilution; c) change of bandwidth with dilution - is
consistent with Knapp's (1) model for "reactive coupling". For the isotopic düution the
methyl formate NCE effect shows reasonably good agreement with Logan's model (2).
Unforiunately, the non-isotopic dilution shows very poor agreement with the models (3-8)
tested. The existence of RET in liquid methyl formate suggests some significmt short
term, short range order in the liquid that aliows the transition dipoles to couple. This
short range o&r should not be interpreted as the formation of dunes in the "traditionaltt
sense. If this were true, far more ciramatic results would have been seen in the carbonyl
region. The behaviour of the FWHM of methyl formate was also quite interesting. In
both the isotopic and non-Wtopic dilutions, the FWnM initially increased and then
decreased. Under Knapp's mode1 (1) this indicates the total amount of intermolecular
coupling is initially constant but varies below some "threshold concentration. The
232
variation of the FWHM was also ciiffereut for the two different dilutions indicating (not
surprisingly) that the intenûolacular potential for methyl formate is solvent dependent.
The behaviour of the bandwidths may also suggest that the pure dephasing and RET
contributions to the bandwidth are not uncorrelated-
Expansion of the work on methyl formate could follow several paths. First, a
different solvent for non-isotopic dilution could k used. Logan's model for isotopic
dilution (2) was reasonably successful and the non-isotopic model (9) is an expansion
(albeit a complex expansion) of the isotopic model. To do this, a solvent which has a
hard sphere diameter within 10% of the hard sphere diameter of methyl formate must be
found The data needed to find such a solvent may be difficult to discover. Furthemore,
in a different, non-isotopic, solvent methyl formate might confona with the other models
(3-8). Second, the effect of ions on the NCE could be studied. Methyl formate has been
suggested as a solvent for lithium battery eleztrolytes (10). Of course, ions must be
added. A study of the NCE as a hction of salt (e-g., LiAsFd concentraiion would be
quite interesting. Eteplachg methyl formate molecules in the solvaîion shell with ions
should disrupt the local order and lead to a decrrased NCE. A third, broader, path is to
study the NCE of other simple esters (e.g., methyl =tate).
E. W. Knapp, J. Chem Phys. î984 81 643
D. E. Logan, Chen. Phys. 1986 103 215
G. Fini, P. Mirone, J. Chem. Soc. Fara&y Trmu. 1974 70 1776
P. Mirone, G. Fini, J. Chem, Phys. 1979 71 2241
M. G. Giocgini, G. Fini, J. Chun. Phys. 1983 79 639
J. L. McHale, J. Chem Phys. 1981 75 30
C. H. Wang, J. McHale, J. C h n Phys. 1980 72 4039
P. Mirone, J. Chem. Phys. 1982 77 2704
D. E- Logan, Chem Phys. 1989 13 1 199
E. Plichta, M. Salomon, S. Slane, M. Uchiyama J. SOL Chem. 1987 16 225