51
RAMAN SPECTROSCOPY PRESENTATION BY ZAKIA AFZAL PHD STUDENT
| Date post: | 12-Aug-2015 |
| Category: |
Education |
| Upload: | zakia-afzal |
| View: | 66 times |
| Download: | 1 times |
RAMAN SPECTROSCOPY
PRESENTATION BY
ZAKIA AFZAL
PHD STUDENT
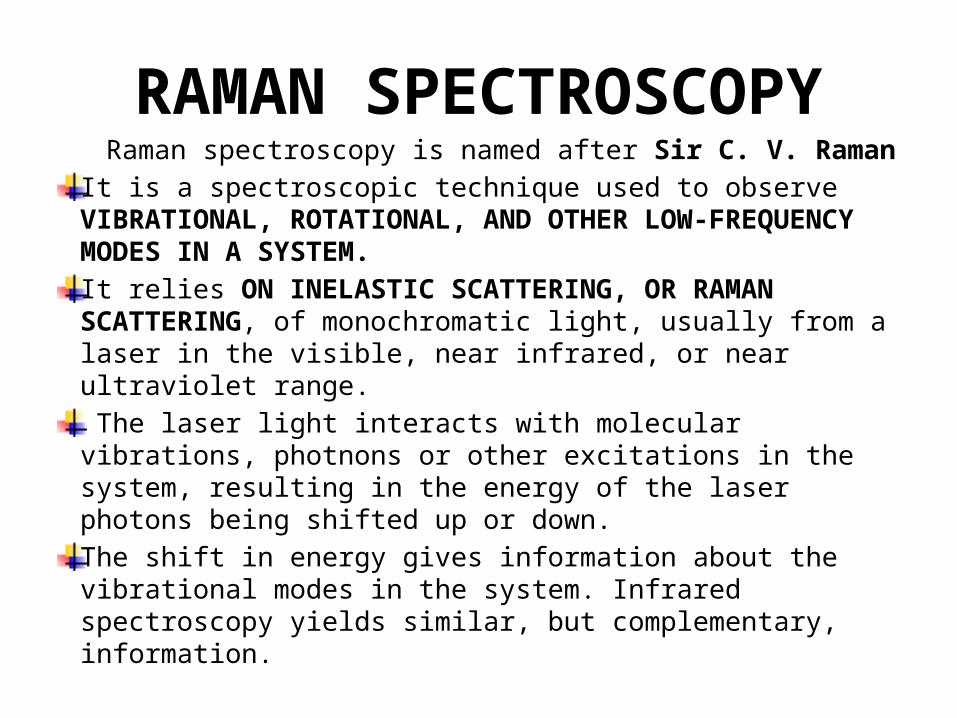
RAMAN SPECTROSCOPY Raman spectroscopy is named after Sir C. V. Raman
It is a spectroscopic technique used to observe VIBRATIONAL, ROTATIONAL, AND OTHER LOW-FREQUENCY MODES IN A SYSTEM.
It relies ON INELASTIC SCATTERING, OR RAMAN SCATTERING, of monochromatic light, usually from a laser in the visible, near infrared, or near ultraviolet range.
The laser light interacts with molecular vibrations, photnons or other excitations in the system, resulting in the energy of the laser photons being shifted up or down.
The shift in energy gives information about the vibrational modes in the system. Infrared spectroscopy yields similar, but complementary, information.
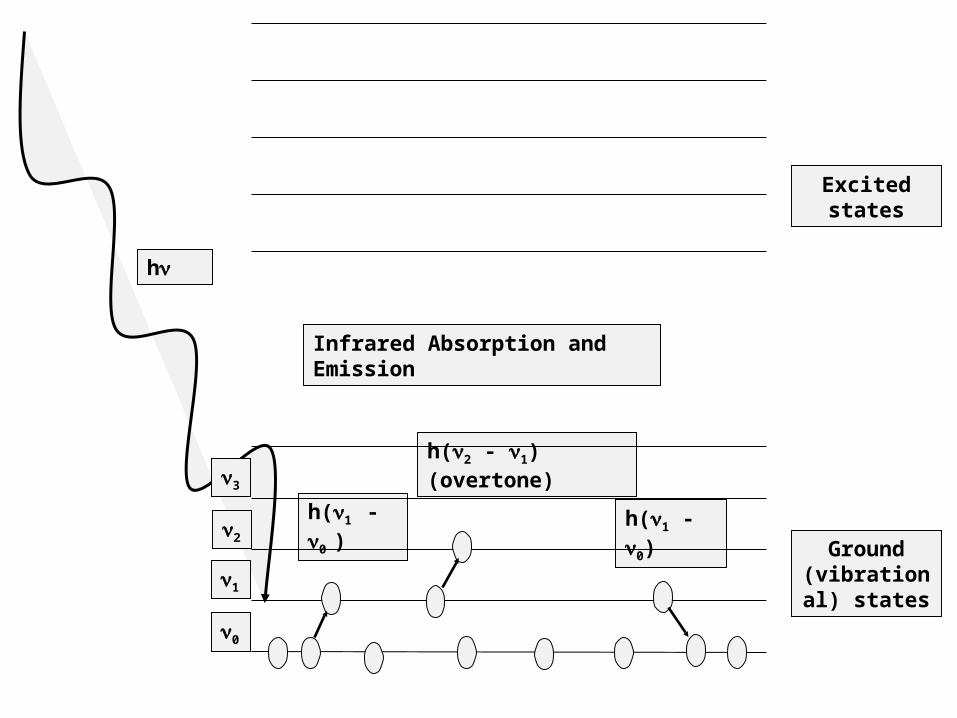
hn
Excited states
Ground (vibrational)
states
h(n1 - n0 ) h(n1 - n0)
h(n2 - n1) (overtone)
Infrared Absorption and Emission
n1
n2
n0
n3
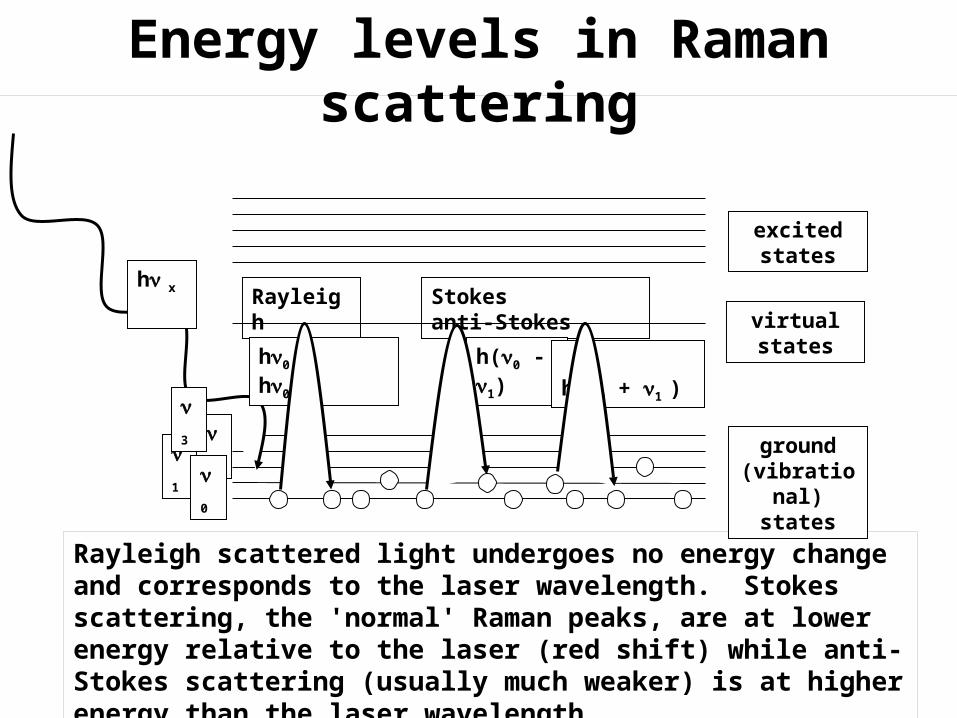
Energy levels in Raman scattering
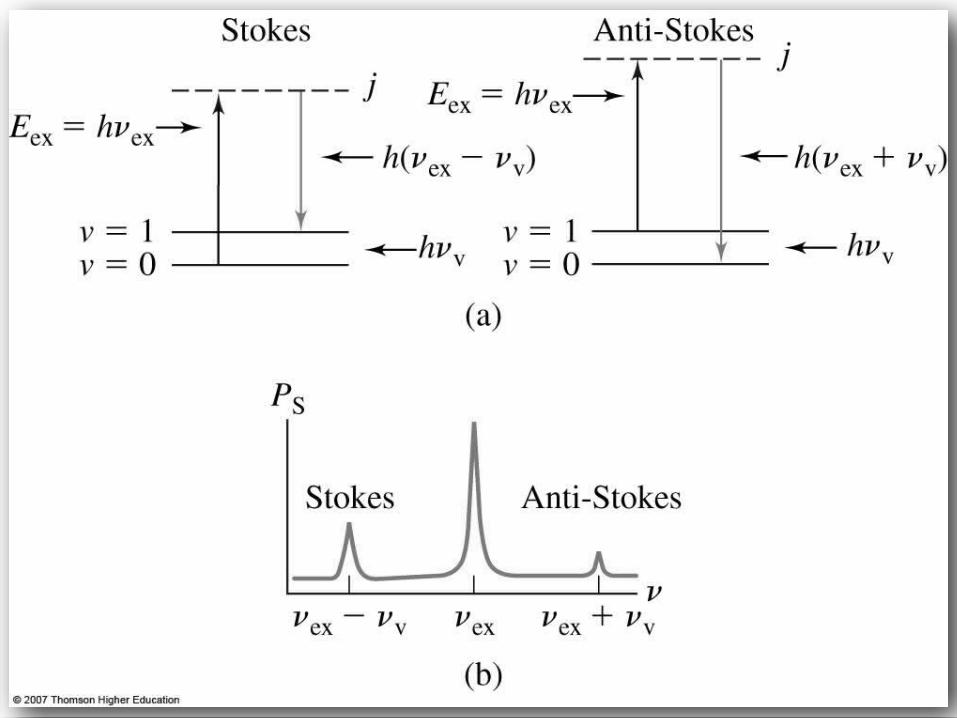
Rayleigh scattered light undergoes no energy change and corresponds to the laser wavelength. Stokes scattering, the 'normal' Raman peaks, are at lower energy relative to the laser (red shift) while anti-Stokes scattering (usually much weaker) is at higher energy than the laser wavelength.
excited states
ground (vibrational)
states
Rayleigh Stokes anti-Stokes
hn0 hn0 h(n0 - n1) h(n0 + n1 )
hn x
n1
n2n
0
n3
virtual states
SAMPLE HANDLING
• Typically, a sample is illuminated with a laser beam. Light from the illuminated spot is collected with a lens and sent through a monochromator.
• Wavelengths close to the laser line due to elastic Rayleigh scattering are filtered out while the rest of the collected light is dispersed onto a detector.
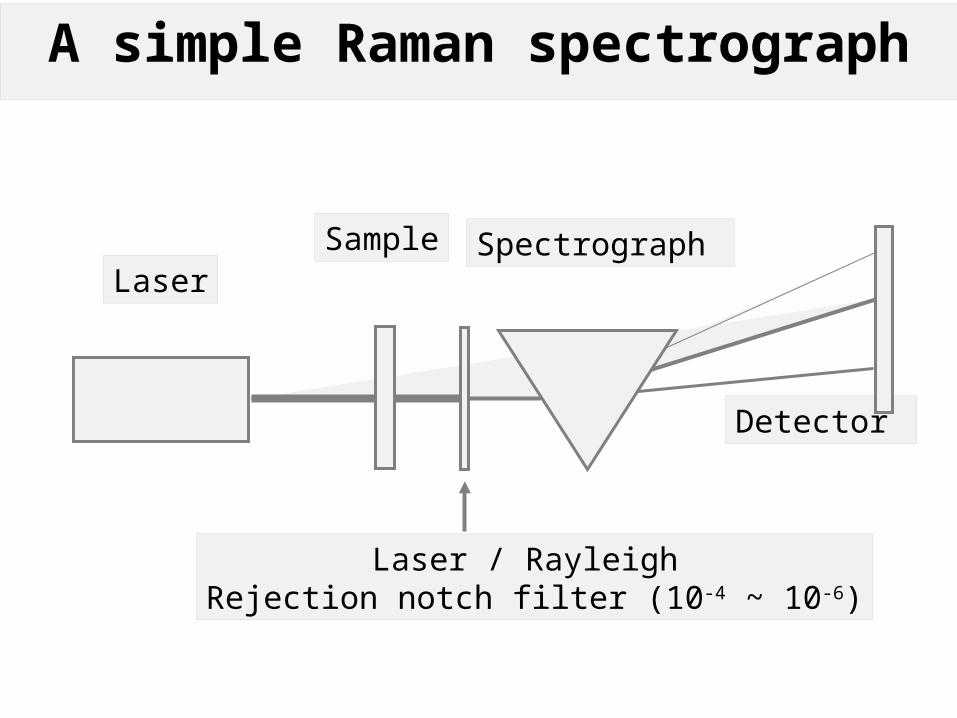
A simple Raman spectrograph
LaserSample Spectrograph
Detector
Laser / Rayleigh Rejection notch filter (10-4 ~ 10-6)
• The Raman effect occurs when light impinges upon a molecule and interacts with the electron cloud and the bonds of that molecule.
• For the spontaneous Raman effect, which is a form of light scattering, a photon excites the molecule from the ground state to a virtual energy state.
• When the molecule relaxes it emits a photon and it returns to a different rotational or vibrational state.
• The difference in energy between the original state and this new state leads to a shift in the emitted photon's frequency away from the excitation wavelength.
• The Raman effect, which is a light scattering phenomenon, should not be confused with absorption (as with fluorescence) where the molecule is excited to a discrete (not virtual) energy level.
• If the final vibrational state of the molecule is more energetic than the initial state, then the emitted photon will be shifted to a lower frequency in order for the total energy of the system to remain balanced. This shift in frequency is designated as a Stokes shift.
• If the final vibrational state is less energetic than the initial state, then the emitted photon will be shifted to a higher frequency, and this is designated as an anti-Stokes shift.
• Raman scattering is an example of inelastic scattering because of the energy transfer between the photons and the molecules during their interaction.
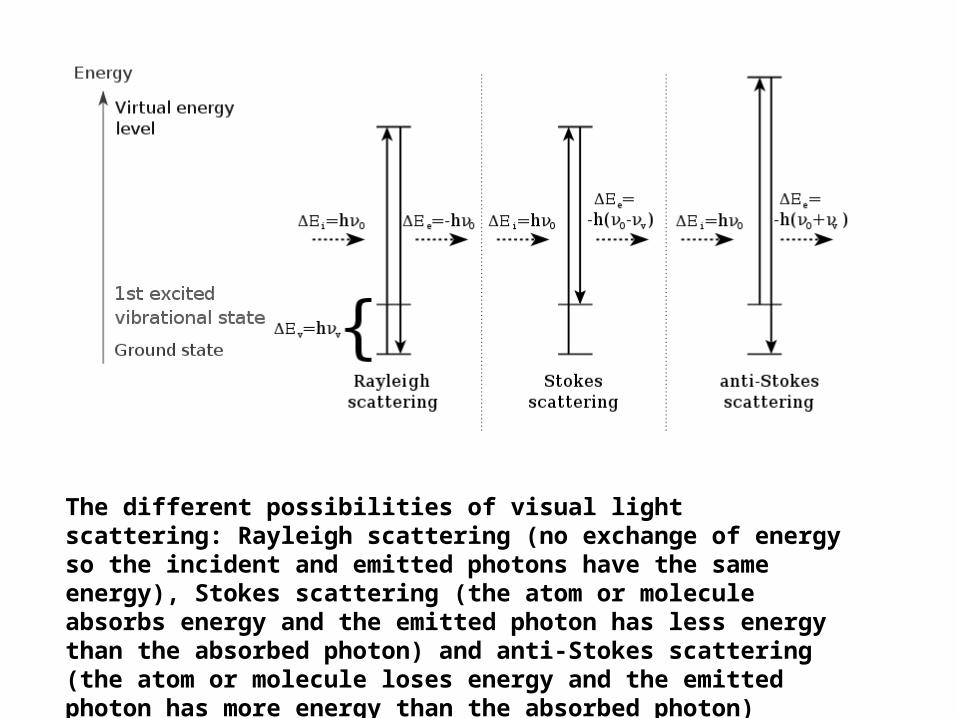
The different possibilities of visual light scattering: Rayleigh scattering (no exchange of energy so the incident and emitted photons have the same energy), Stokes scattering (the atom or molecule absorbs energy and the emitted photon has less energy than the absorbed photon) and anti-Stokes scattering (the atom or molecule loses energy and the emitted photon has more energy than the absorbed photon)
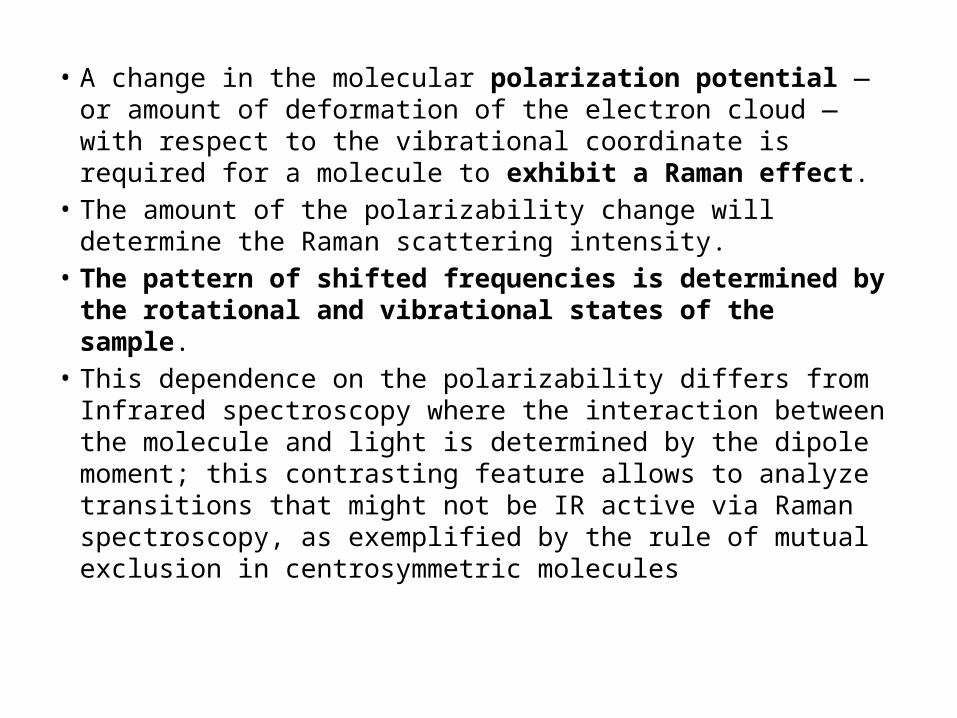
• A change in the molecular polarization potential — or amount of deformation of the electron cloud — with respect to the vibrational coordinate is required for a molecule to exhibit a Raman effect.
• The amount of the polarizability change will determine the Raman scattering intensity.
• The pattern of shifted frequencies is determined by the rotational and vibrational states of the sample.
• This dependence on the polarizability differs from Infrared spectroscopy where the interaction between the molecule and light is determined by the dipole moment; this contrasting feature allows to analyze transitions that might not be IR active via Raman spectroscopy, as exemplified by the rule of mutual exclusion in centrosymmetric molecules
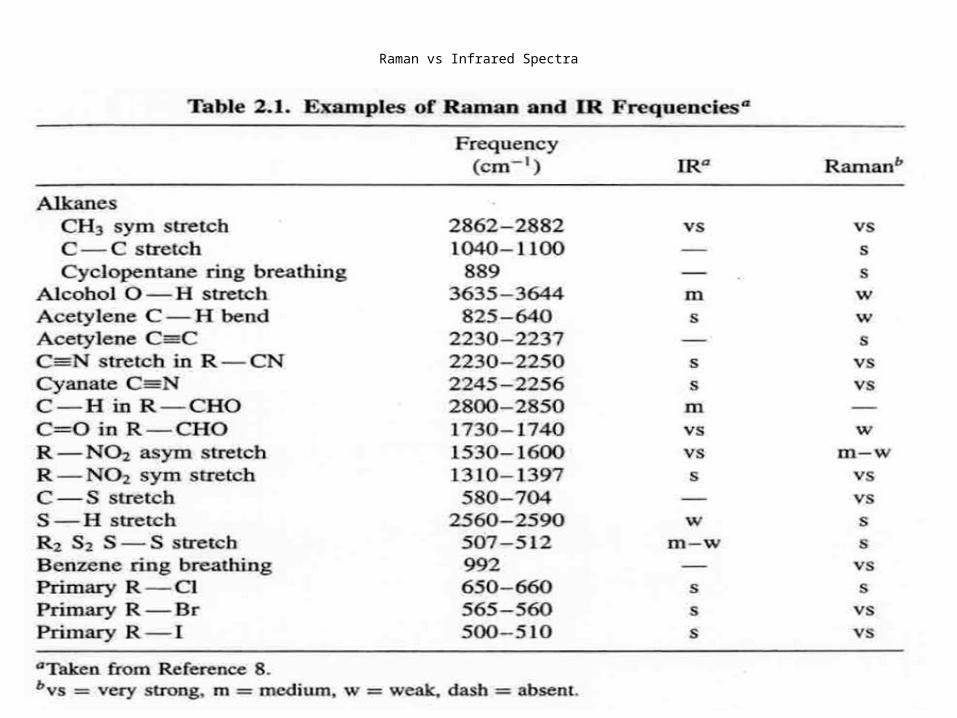
Raman vs Infrared Spectra
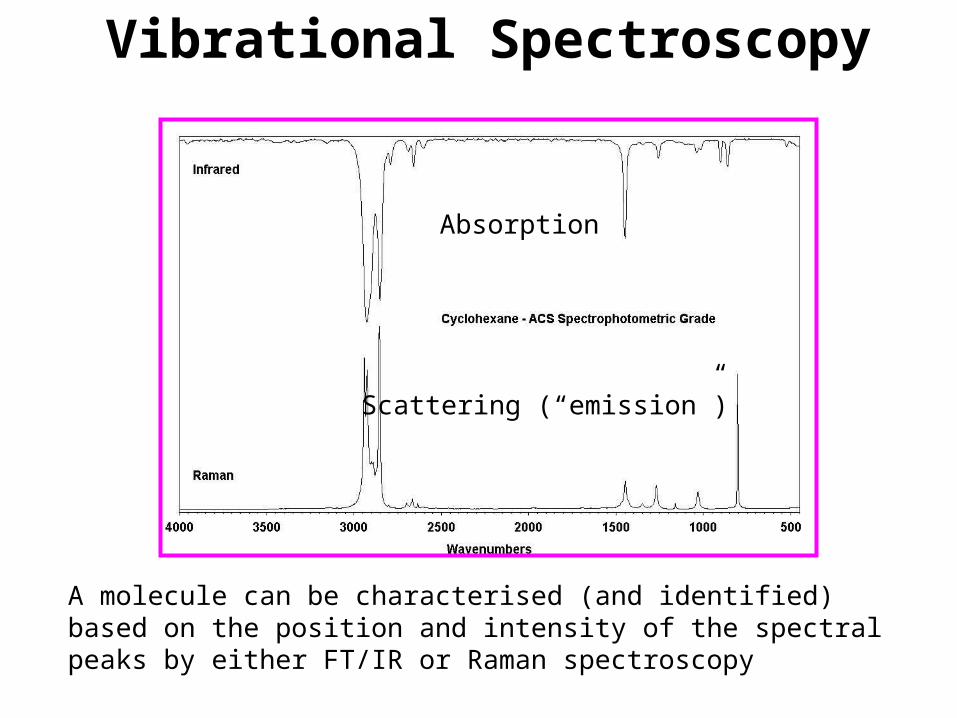
Vibrational Spectroscopy
A molecule can be characterised (and identified) based on the position and intensity of the spectral peaks by either FT/IR or Raman spectroscopy
Absorption
Scattering (“emission”)
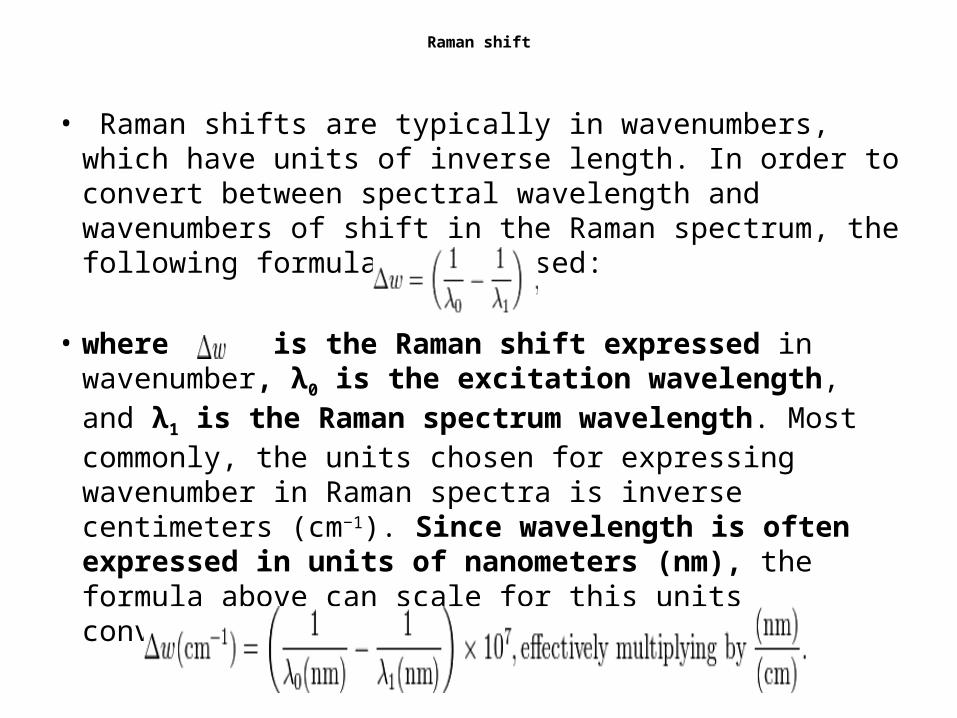
Raman shift
• Raman shifts are typically in wavenumbers, which have units of inverse length. In order to convert between spectral wavelength and wavenumbers of shift in the Raman spectrum, the following formula can be used:
• where is the Raman shift expressed in wavenumber, λ0 is the excitation wavelength, and λ1 is the Raman spectrum wavelength. Most commonly, the units chosen for expressing wavenumber in Raman spectra is inverse centimeters (cm−1). Since wavelength is often expressed in units of nanometers (nm), the formula above can scale for this units conversion explicitly, giving
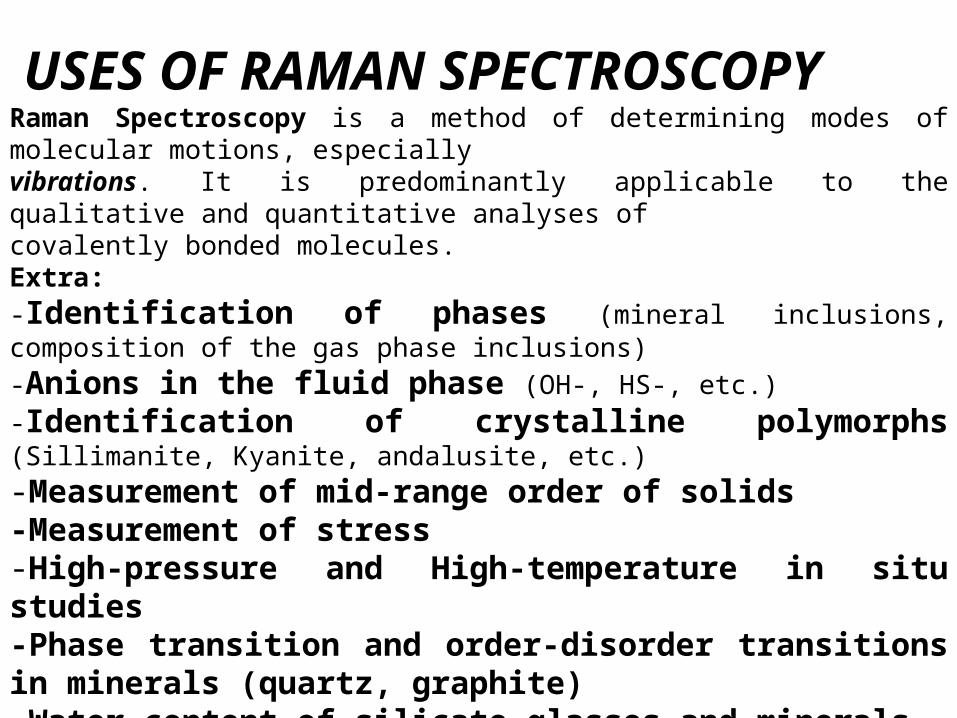
USES OF RAMAN SPECTROSCOPYRaman Spectroscopy is a method of determining modes of molecular motions, especiallyvibrations. It is predominantly applicable to the qualitative and quantitative analyses ofcovalently bonded molecules.Extra:
-Identification of phases (mineral inclusions, composition of the gas phase inclusions)
-Anions in the fluid phase (OH-, HS-, etc.)
-Identification of crystalline polymorphs (Sillimanite, Kyanite, andalusite, etc.)
-Measurement of mid-range order of solids-Measurement of stress-High-pressure and High-temperature in situ studies-Phase transition and order-disorder transitions in minerals (quartz, graphite)-Water content of silicate glasses and minerals-Speciation of water in glasses
.
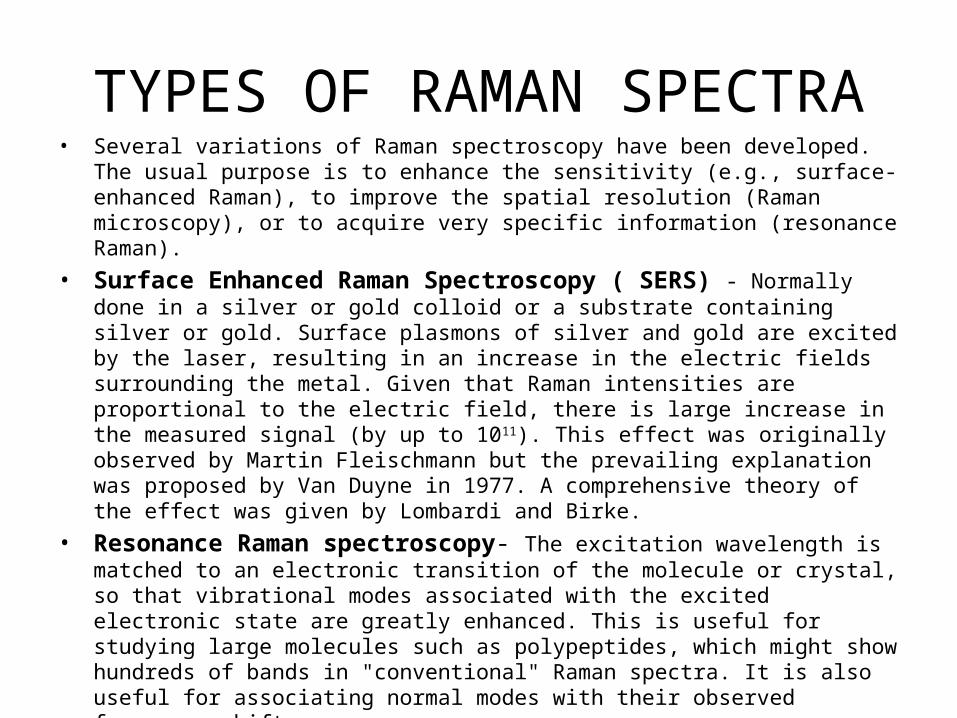
TYPES OF RAMAN SPECTRA• Several variations of Raman spectroscopy have been developed. The usual purpose is to
enhance the sensitivity (e.g., surface-enhanced Raman), to improve the spatial resolution (Raman microscopy), or to acquire very specific information (resonance Raman).
• Surface Enhanced Raman Spectroscopy ( SERS) - Normally done in a silver or gold colloid or a substrate containing silver or gold. Surface plasmons of silver and gold are excited by the laser, resulting in an increase in the electric fields surrounding the metal. Given that Raman intensities are proportional to the electric field, there is large increase in the measured signal (by up to 1011). This effect was originally observed by Martin Fleischmann but the prevailing explanation was proposed by Van Duyne in 1977. A comprehensive theory of the effect was given by Lombardi and Birke.
• Resonance Raman spectroscopy- The excitation wavelength is matched to an electronic transition of the molecule or crystal, so that vibrational modes associated with the excited electronic state are greatly enhanced. This is useful for studying large molecules such as polypeptides, which might show hundreds of bands in "conventional" Raman spectra. It is also useful for associating normal modes with their observed frequency shifts.
• Surface-Enhanced Resonance Raman Spectroscopy (SERRS) - A combination of SERS and resonance Raman spectroscopy that uses proximity to a surface to increase Raman intensity, and excitation wavelength matched to the maximum absorbance of the molecule being analysed.
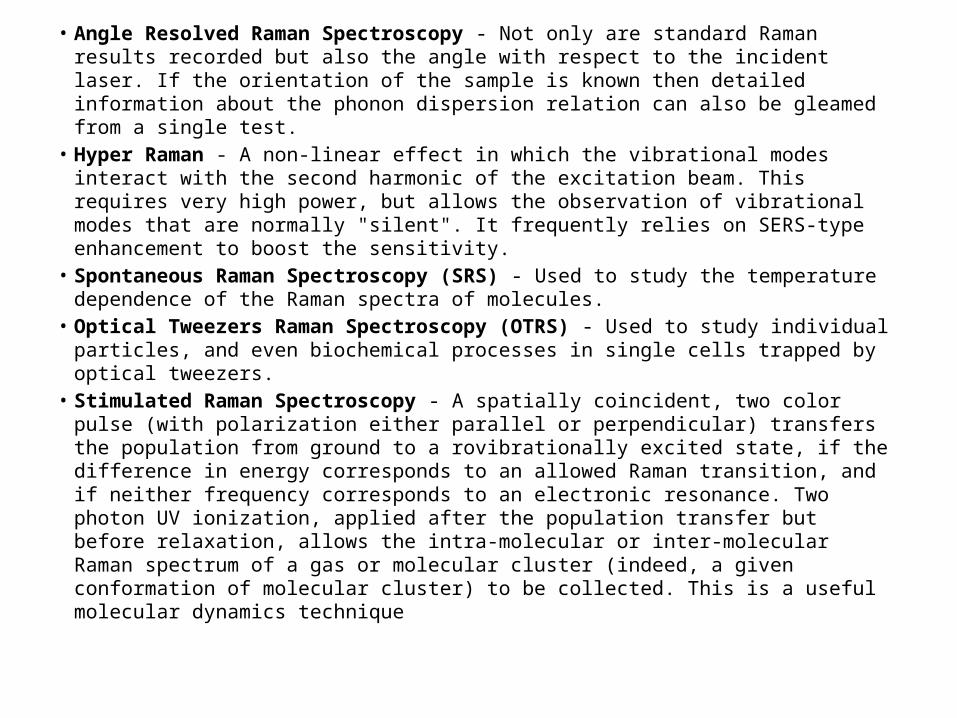
• Angle Resolved Raman Spectroscopy - Not only are standard Raman results recorded but also the angle with respect to the incident laser. If the orientation of the sample is known then detailed information about the phonon dispersion relation can also be gleamed from a single test.
• Hyper Raman - A non-linear effect in which the vibrational modes interact with the second harmonic of the excitation beam. This requires very high power, but allows the observation of vibrational modes that are normally "silent". It frequently relies on SERS-type enhancement to boost the sensitivity.
• Spontaneous Raman Spectroscopy (SRS) - Used to study the temperature dependence of the Raman spectra of molecules.
• Optical Tweezers Raman Spectroscopy (OTRS) - Used to study individual particles, and even biochemical processes in single cells trapped by optical tweezers.
• Stimulated Raman Spectroscopy - A spatially coincident, two color pulse (with polarization either parallel or perpendicular) transfers the population from ground to a rovibrationally excited state, if the difference in energy corresponds to an allowed Raman transition, and if neither frequency corresponds to an electronic resonance. Two photon UV ionization, applied after the population transfer but before relaxation, allows the intra-molecular or inter-molecular Raman spectrum of a gas or molecular cluster (indeed, a given conformation of molecular cluster) to be collected. This is a useful molecular dynamics technique
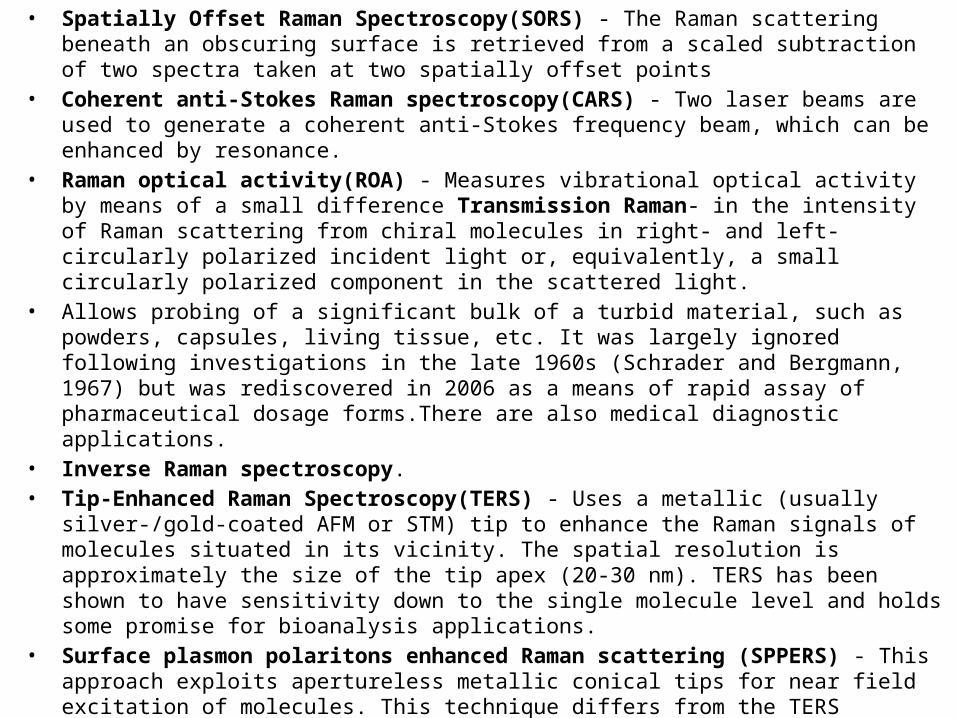
• Spatially Offset Raman Spectroscopy(SORS) - The Raman scattering beneath an obscuring surface is retrieved from a scaled subtraction of two spectra taken at two spatially offset points
• Coherent anti-Stokes Raman spectroscopy(CARS) - Two laser beams are used to generate a coherent anti-Stokes frequency beam, which can be enhanced by resonance.
• Raman optical activity(ROA) - Measures vibrational optical activity by means of a small difference Transmission Raman- in the intensity of Raman scattering from chiral molecules in right- and left-circularly polarized incident light or, equivalently, a small circularly polarized component in the scattered light.
• Allows probing of a significant bulk of a turbid material, such as powders, capsules, living tissue, etc. It was largely ignored following investigations in the late 1960s (Schrader and Bergmann, 1967) but was rediscovered in 2006 as a means of rapid assay of pharmaceutical dosage forms.There are also medical diagnostic applications.
• Inverse Raman spectroscopy.• Tip-Enhanced Raman Spectroscopy(TERS) - Uses a metallic (usually silver-/gold-coated AFM or
STM) tip to enhance the Raman signals of molecules situated in its vicinity. The spatial resolution is approximately the size of the tip apex (20-30 nm). TERS has been shown to have sensitivity down to the single molecule level and holds some promise for bioanalysis applications.
• Surface plasmon polaritons enhanced Raman scattering (SPPERS) - This approach exploits apertureless metallic conical tips for near field excitation of molecules. This technique differs from the TERS approach due to its inherent capability of suppressing the background field. In fact, when an appropriate laser source impinges on the base of the cone, a TM0 mode (polaritonic mode) can be locally created, namely far away from the excitation spot (apex of the tip). The mode can propagate along the tip without producing any radiation field up to the tip apex where it interacts with the molecule. In this way, the focal plane is separated from the excitation plane by a distance given by the tip length, and no background plays any role in the Raman excitation of the molecule
Selection rules
• The distortion of a molecule in an electric field, and therefore the vibrational Raman cross section, is determined by its polarizability.
• A Raman transition from one state to another, and therefore a Raman shift, can be activated optically only in the presence of non-zero polarizability derivative with respect to the normal coordinate (that is, the vibration or rotation):
• Raman-active vibrations/rotations can be identified by using almost any textbook that treats quantum mechanics or group theory for chemistry. Then, Raman-active modes can be found for molecules or crystals that show symmetry by using the appropriate character table for that symmetry group.
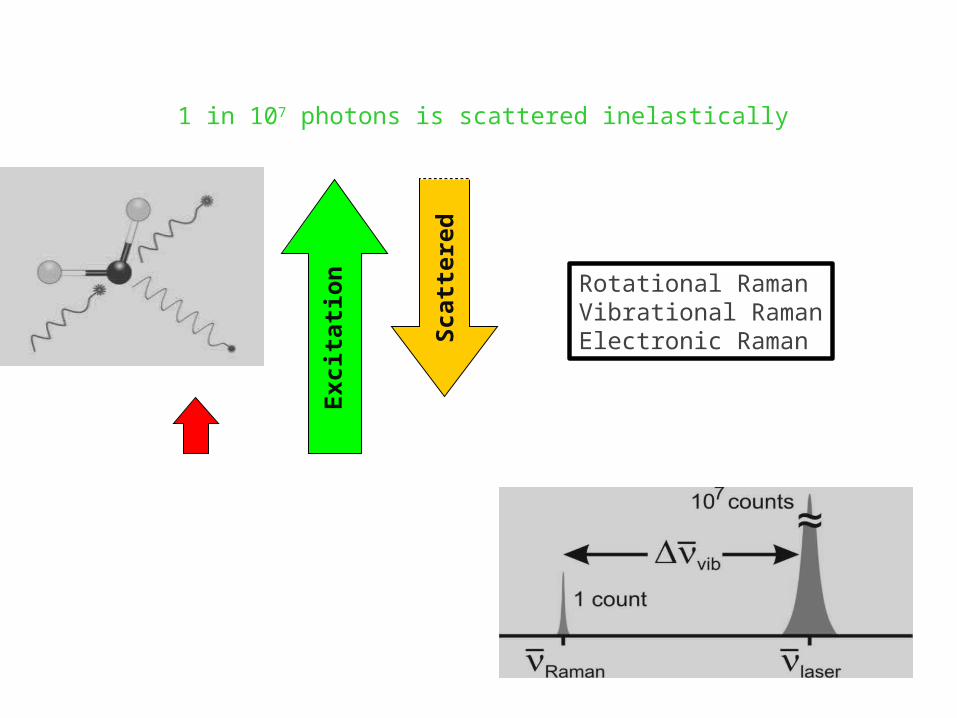
Raman Spectroscopy1 in 107 photons is scattered inelastically
Infrared(absorption)
Raman(scattering)
v” = 0
v” = 1
virtualstate
Exc
itat
ion
Sca
tter
ed
Rotational RamanVibrational RamanElectronic Raman
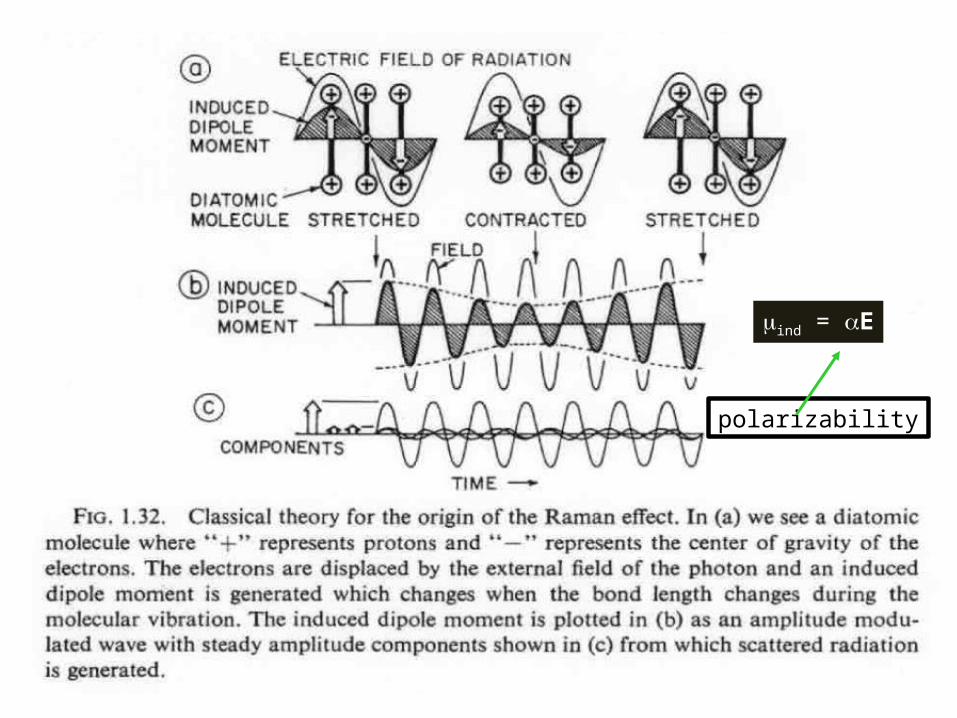
Classical Theory of Raman Effect
mind = aE
polarizability
max 0
max max 0
max max 0
( ) cos 2
1cos 2 ( )
21
cos 2 ( )2
equilz zz
zzvib
zzvib
t E t
dr E t
drd
r E tdr
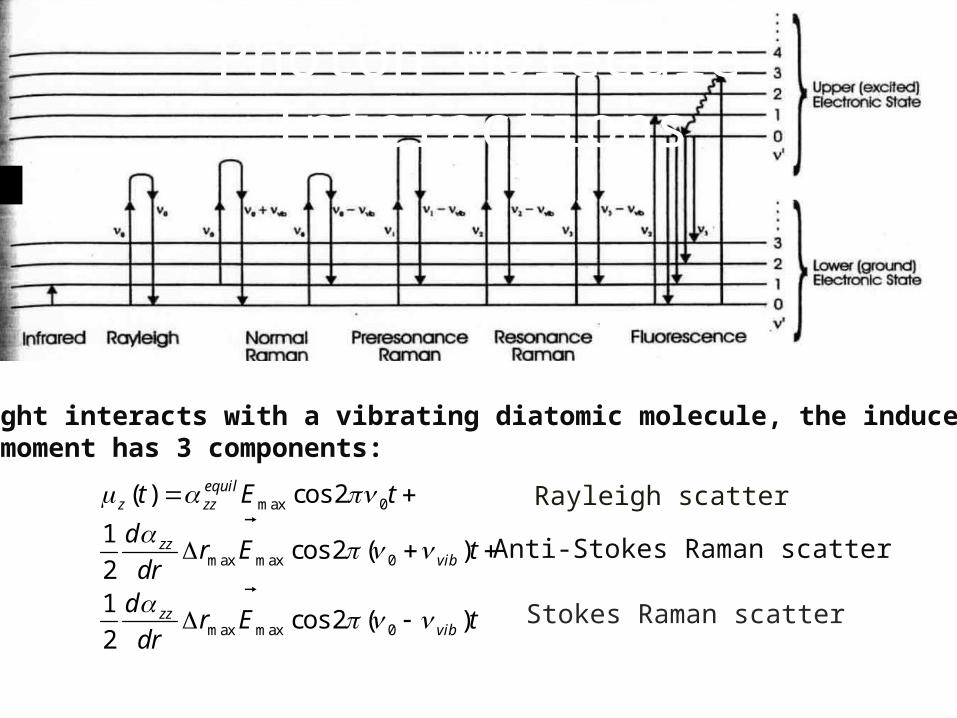
When light interacts with a vibrating diatomic molecule, the induceddipole moment has 3 components:
Photon-Molecule Interactions
Rayleigh scatter
Anti-Stokes Raman scatter
Stokes Raman scatter
max 0
max max 0
max max 0
( ) cos 2
1cos 2 ( )
21
cos 2 ( )2
equilz zz
zzvib
zzvib
t E t
dr E t
drd
r E tdr
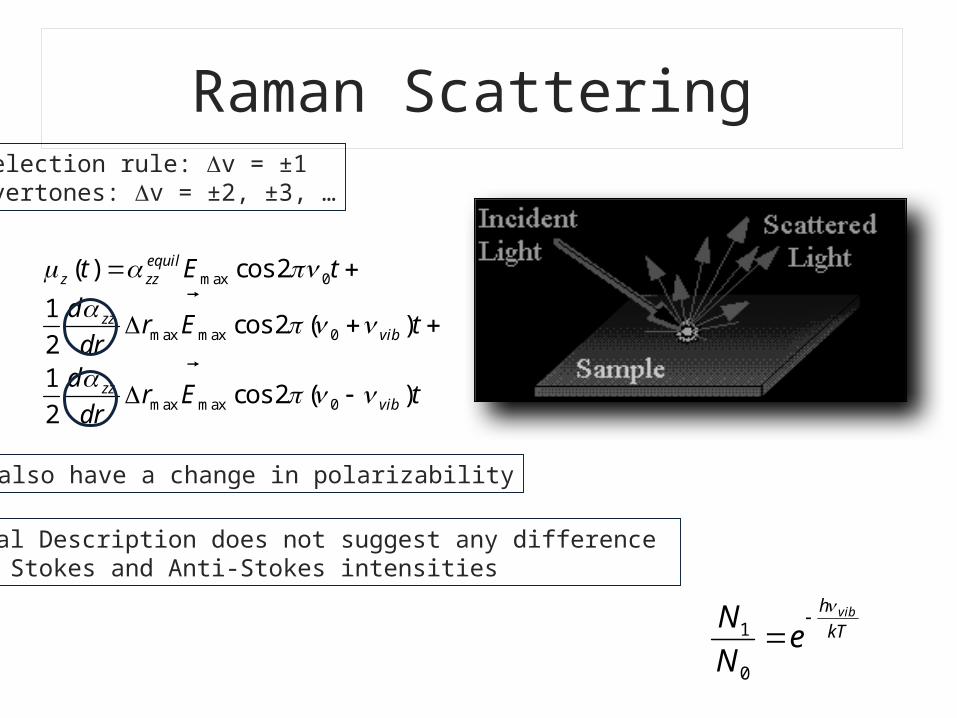
Selection rule: Dv = ±1Overtones: Dv = ±2, ±3, …
Raman Scattering
Must also have a change in polarizability
Classical Description does not suggest any difference between Stokes and Anti-Stokes intensities
1
0
vibh
kTN
eN
Theory of atomic vibrations and Raman scattering
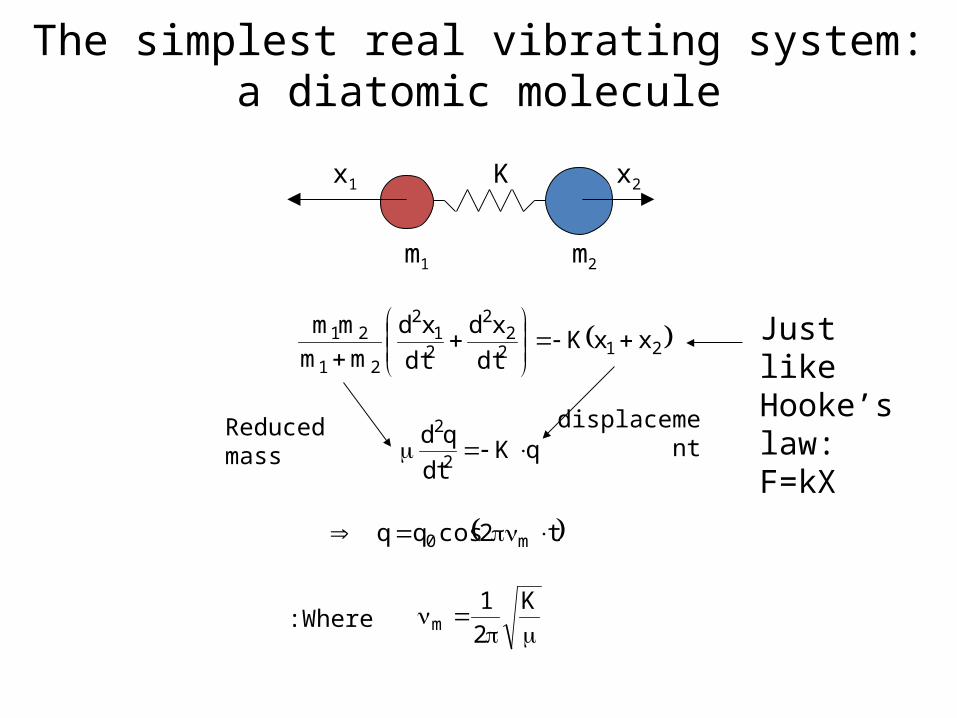
The simplest real vibrating system:a diatomic molecule
2122
2
21
2
21
21 xxKdt
xd
dt
xd
mm
mm
qKdt
qd2
2
Reduced mass displacement
x1 x2
m1 m2
K
t2cosqq m0
K
2
1mWhere:
Just like Hooke’s law: F=kX
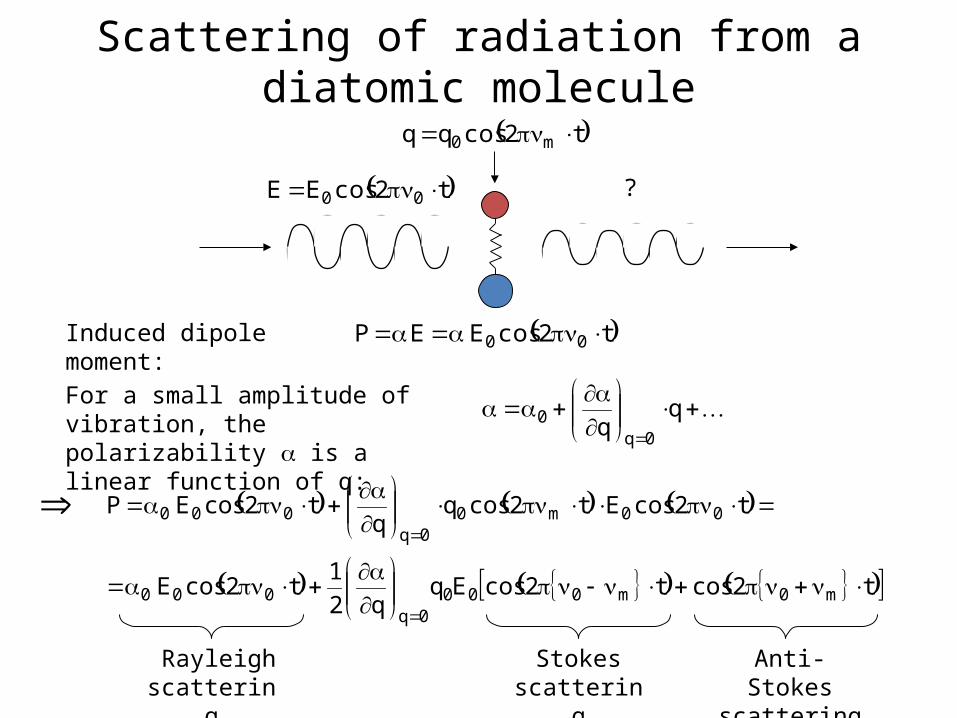
Scattering of radiation from a diatomic molecule
t2cosEE 00
t2cosqq m0
?
t2cosEEP 00 Induced dipole moment:
For a small amplitude of vibration, the polarizability a is a linear function of q:
qq 0q
0
t2cost2cosEqq2
1t2cosE
t2cosEt2cosqq
t2cosEP
m0m0000q
000
00m00q
000
Rayleigh scattering
Stokes scattering
Anti-Stokes scattering
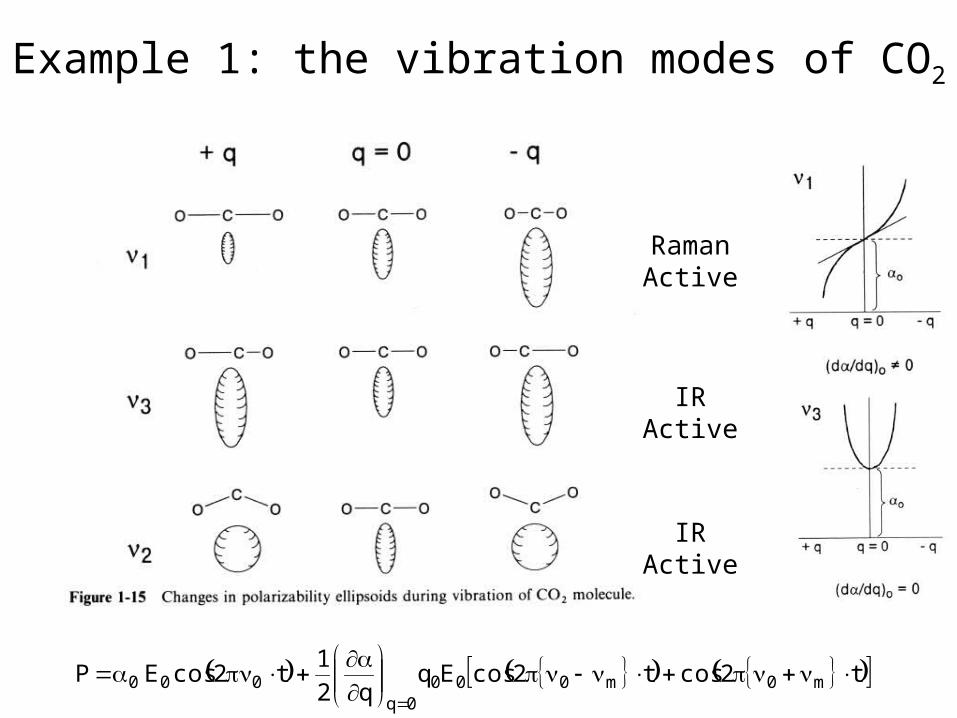
Example 1: the vibration modes of CO2
Raman Active
IR Active
IR Active
t2cost2cosEqq2
1t2cosEP m0m000
0q000
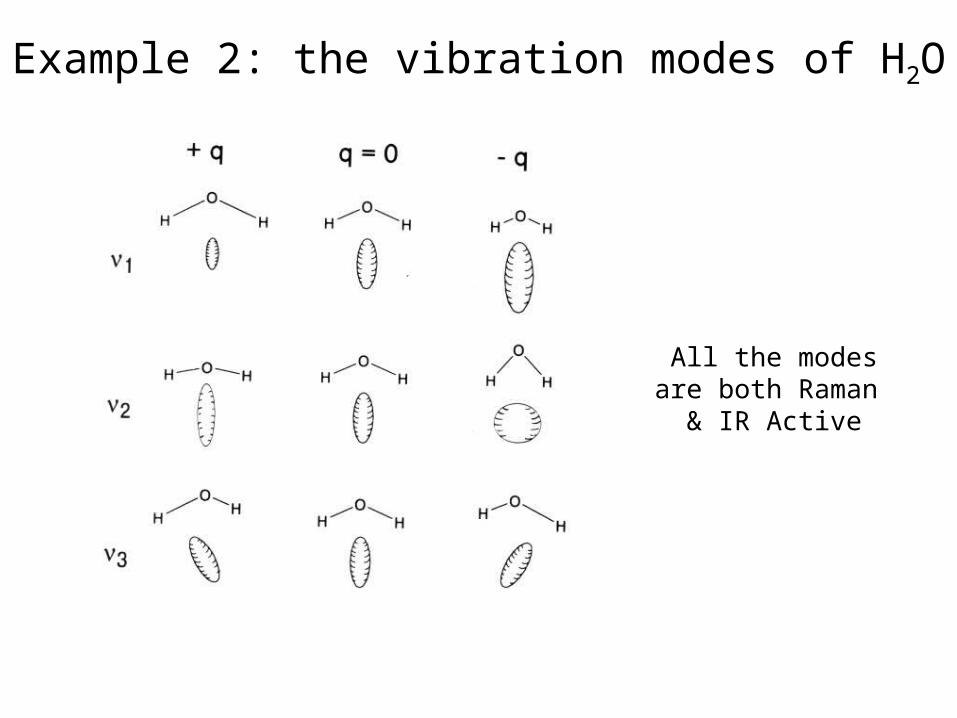
Example 2: the vibration modes of H2O
All the modes are both Raman & IR Active
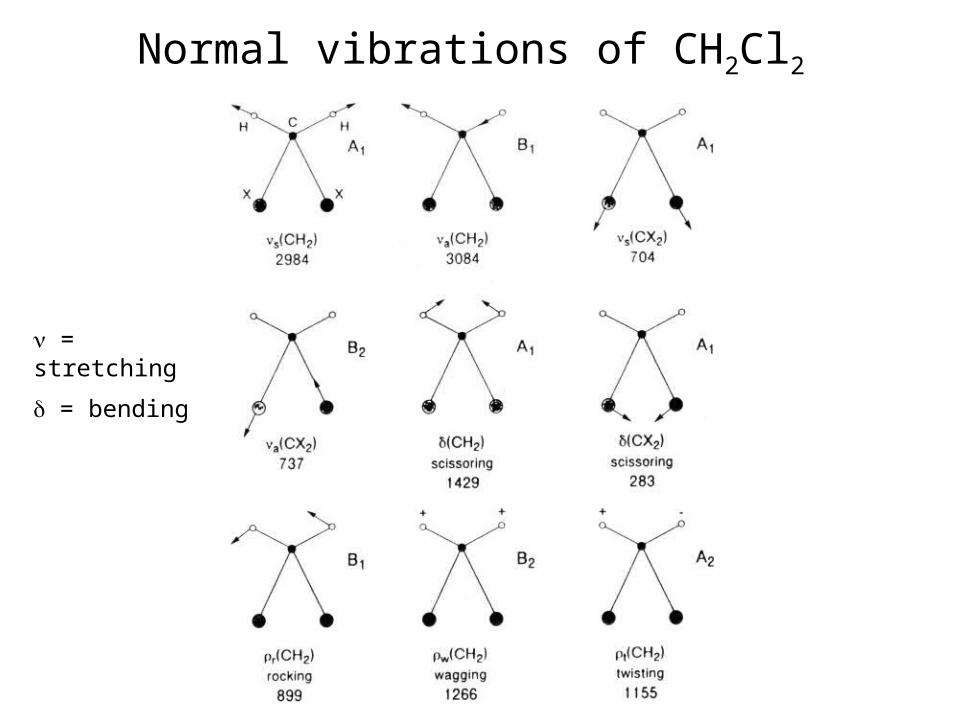
Normal vibrations of CH2Cl2
n = stretching
d = bending
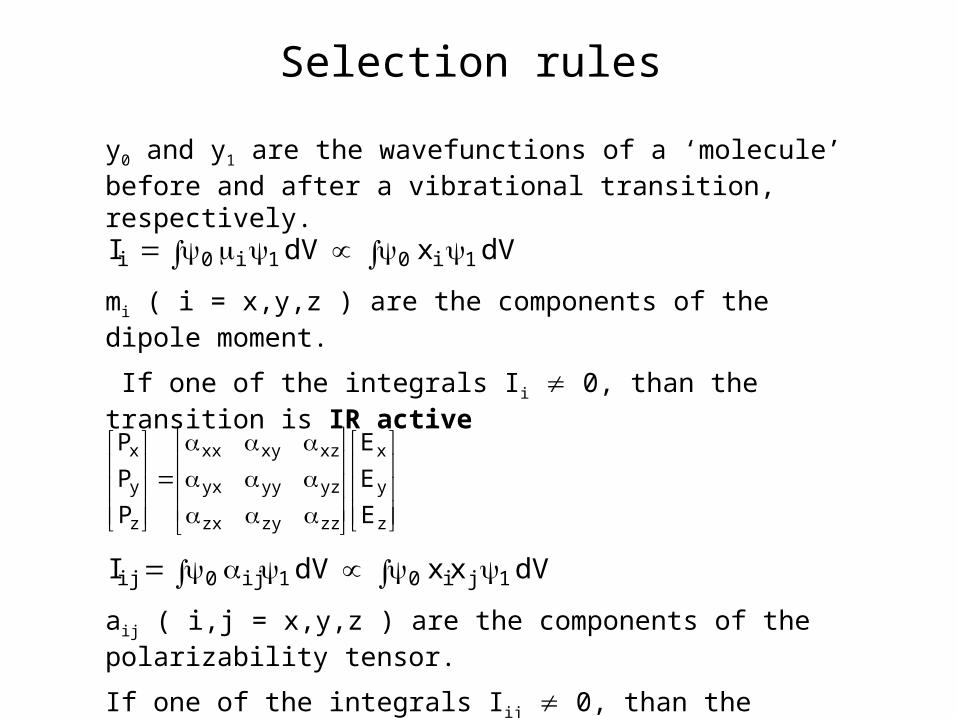
Selection rules
dVxdVI 1i01i0i
dVxxdVI 1ji01ij0ij
mi ( i = x,y,z ) are the components of the dipole moment.
If one of the integrals Ii 0, than the transition is IR active
aij ( i,j = x,y,z ) are the components of the polarizability tensor.
If one of the integrals Iij 0, than the transition is Raman active
y0 and y1 are the wavefunctions of a ‘molecule’ before and after a vibrational transition, respectively.
z
y
x
zzzyzx
yzyyyx
xzxyxx
z
y
x
E
E
E
P
P
P
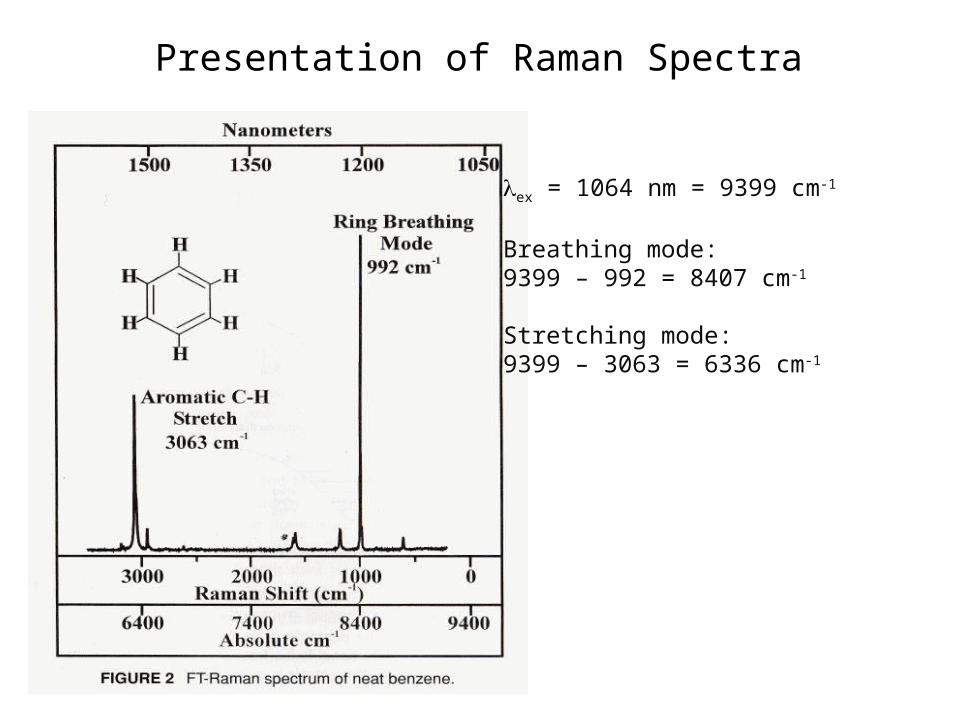
Presentation of Raman Spectra
lex = 1064 nm = 9399 cm-1
Breathing mode:9399 – 992 = 8407 cm-1
Stretching mode:9399 – 3063 = 6336 cm-1
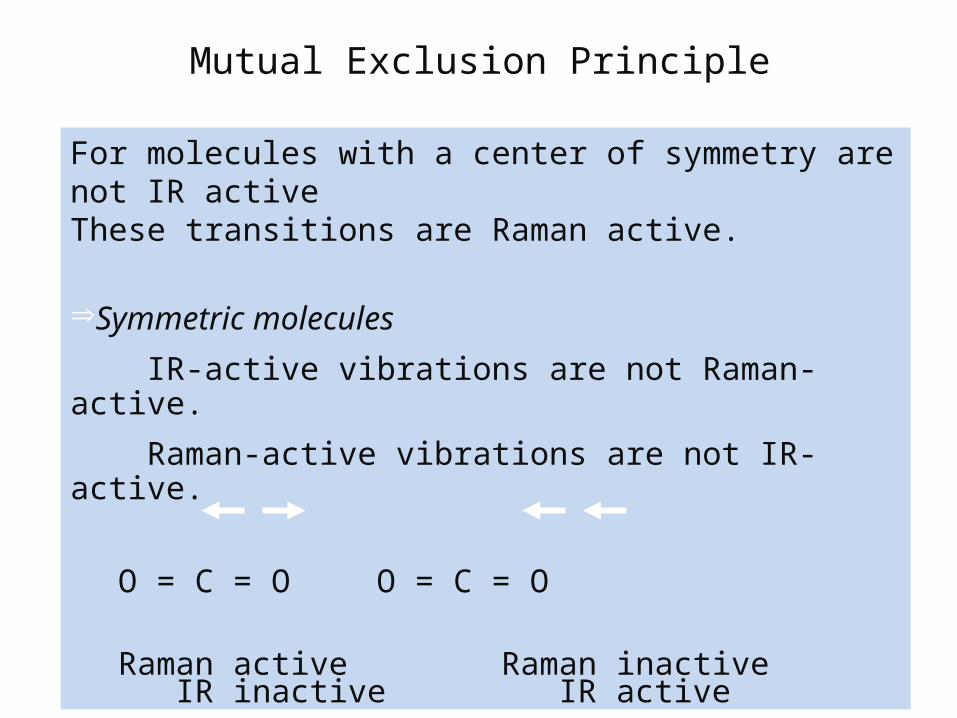
Mutual Exclusion Principle
For molecules with a center of symmetry are not IR activeThese transitions are Raman active.
ÞSymmetric molecules
IR-active vibrations are not Raman-active.
Raman-active vibrations are not IR-active.
O = C = O O = C = O
Raman active Raman inactive IR inactive IR active
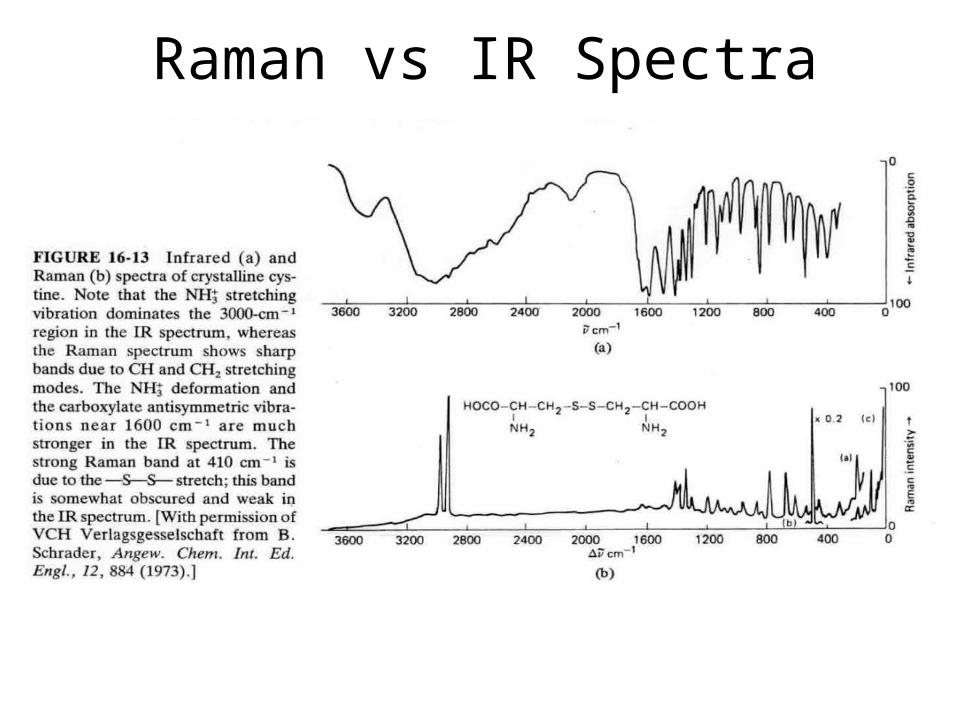
Raman vs IR Spectra
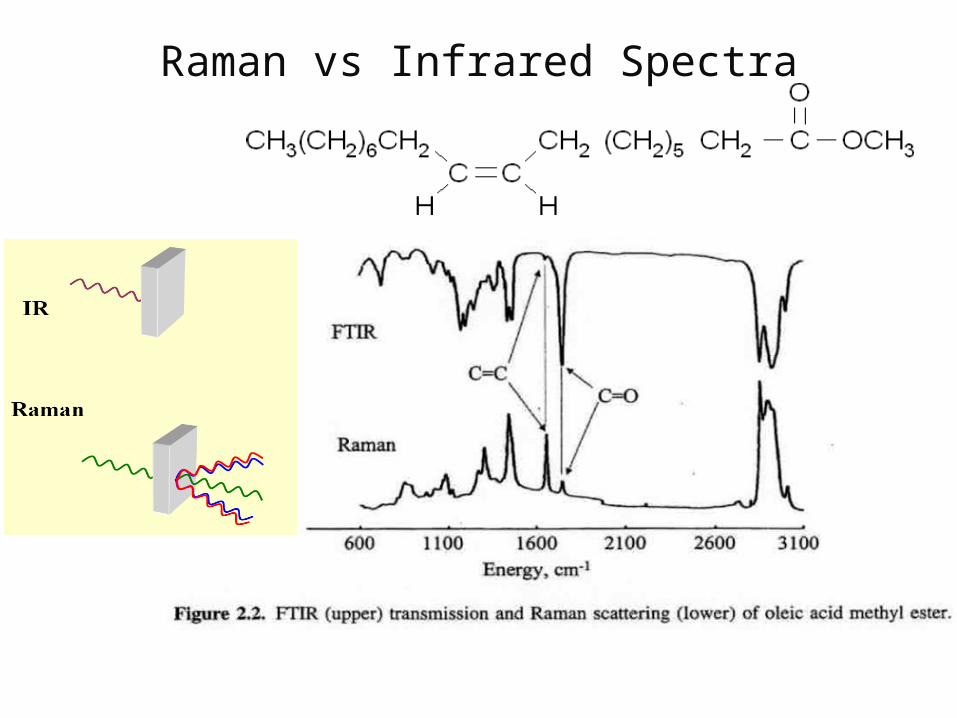
Raman vs Infrared Spectra
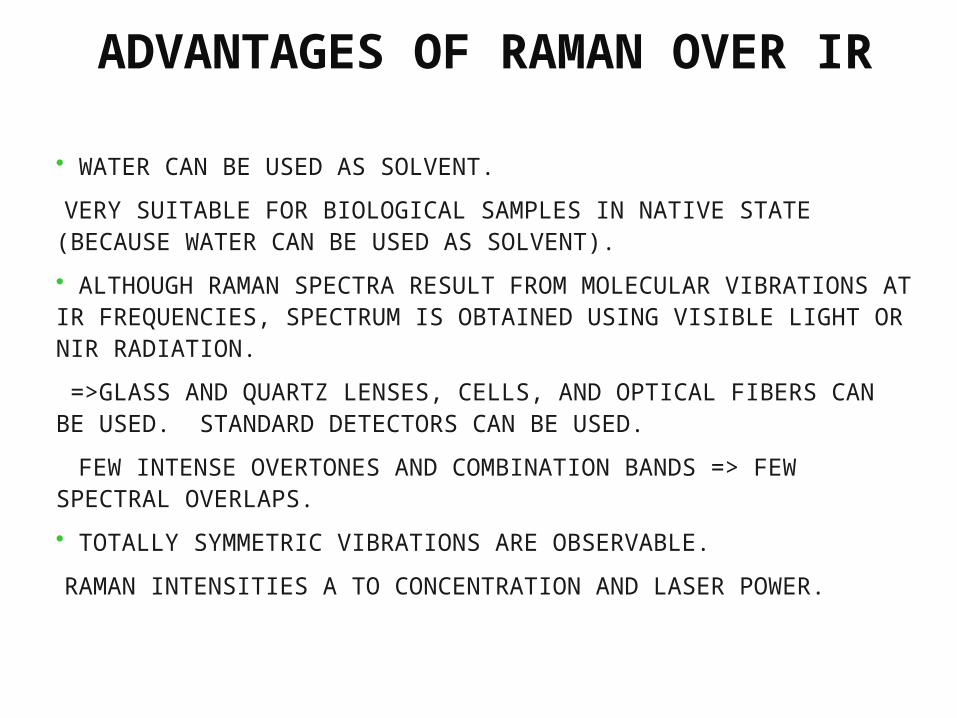
ADVANTAGES OF RAMAN OVER IR
• WATER CAN BE USED AS SOLVENT.
•VERY SUITABLE FOR BIOLOGICAL SAMPLES IN NATIVE STATE (BECAUSE WATER CAN BE USED AS SOLVENT).
• ALTHOUGH RAMAN SPECTRA RESULT FROM MOLECULAR VIBRATIONS AT IR FREQUENCIES, SPECTRUM IS OBTAINED USING VISIBLE LIGHT OR NIR RADIATION.
=>GLASS AND QUARTZ LENSES, CELLS, AND OPTICAL FIBERS CAN BE USED. STANDARD DETECTORS CAN BE USED.
• FEW INTENSE OVERTONES AND COMBINATION BANDS => FEW SPECTRAL OVERLAPS.
• TOTALLY SYMMETRIC VIBRATIONS ARE OBSERVABLE.
•RAMAN INTENSITIES A TO CONCENTRATION AND LASER POWER.
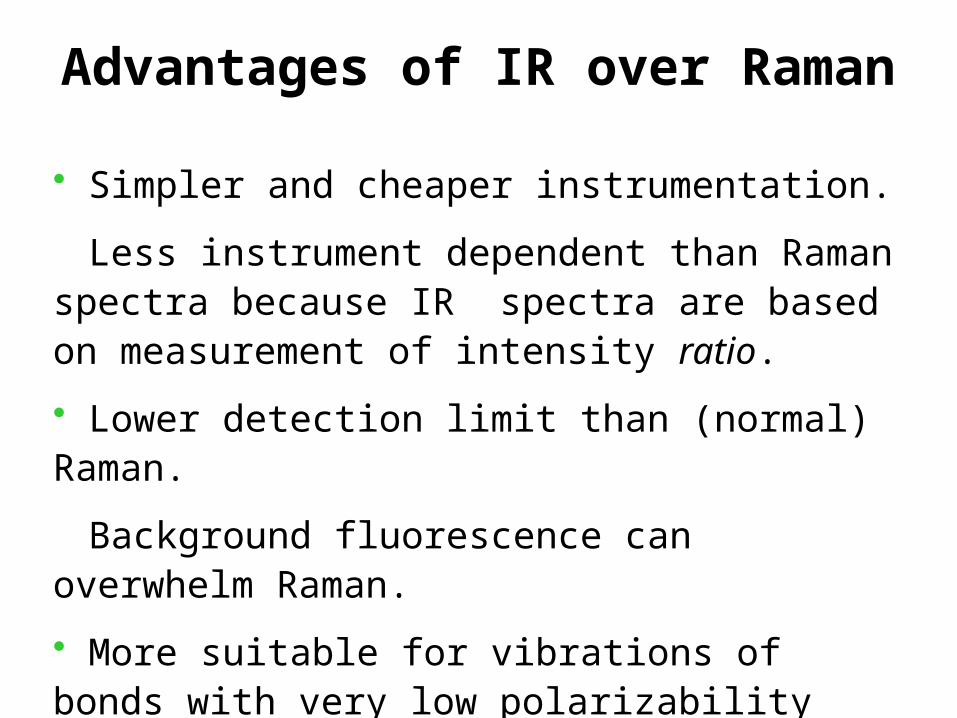
Advantages of IR over Raman
• Simpler and cheaper instrumentation.
• Less instrument dependent than Raman spectra because IR spectra are based on measurement of intensity ratio.
• Lower detection limit than (normal) Raman.
• Background fluorescence can overwhelm Raman.
• More suitable for vibrations of bonds with very low polarizability (e.g. C–F).

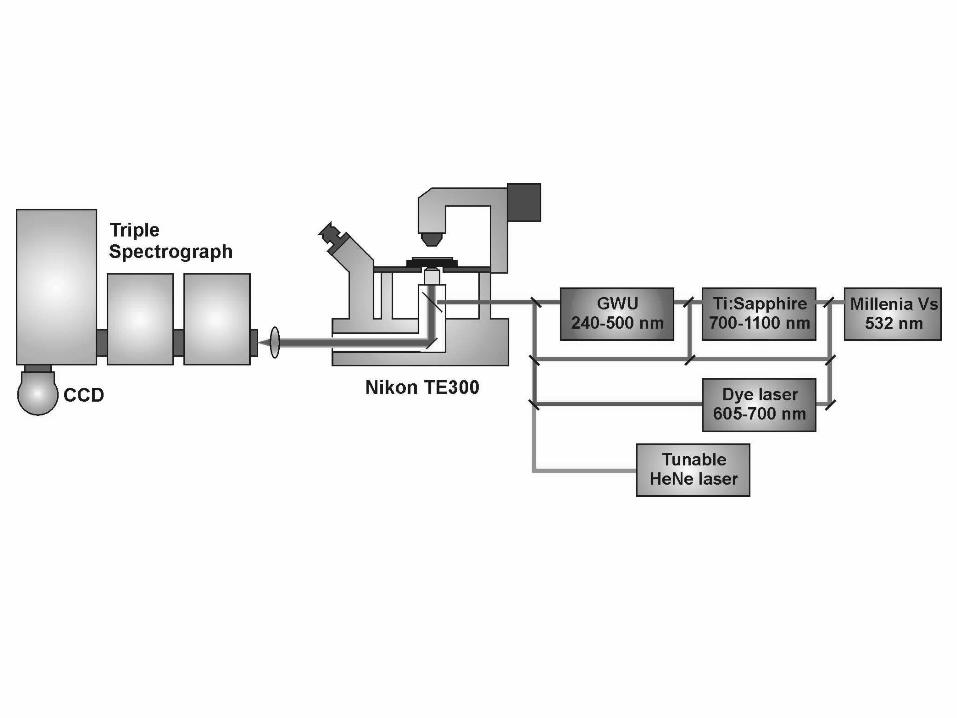
Raman Instrumentation
Tunable Laser System Versatile Detection System
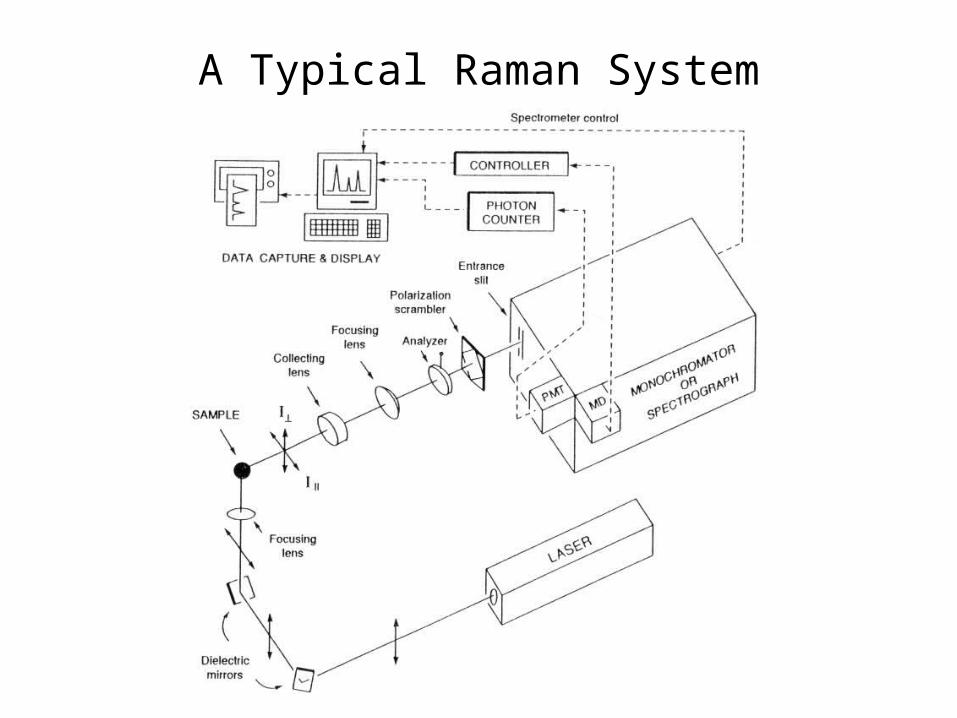
A Typical Raman System
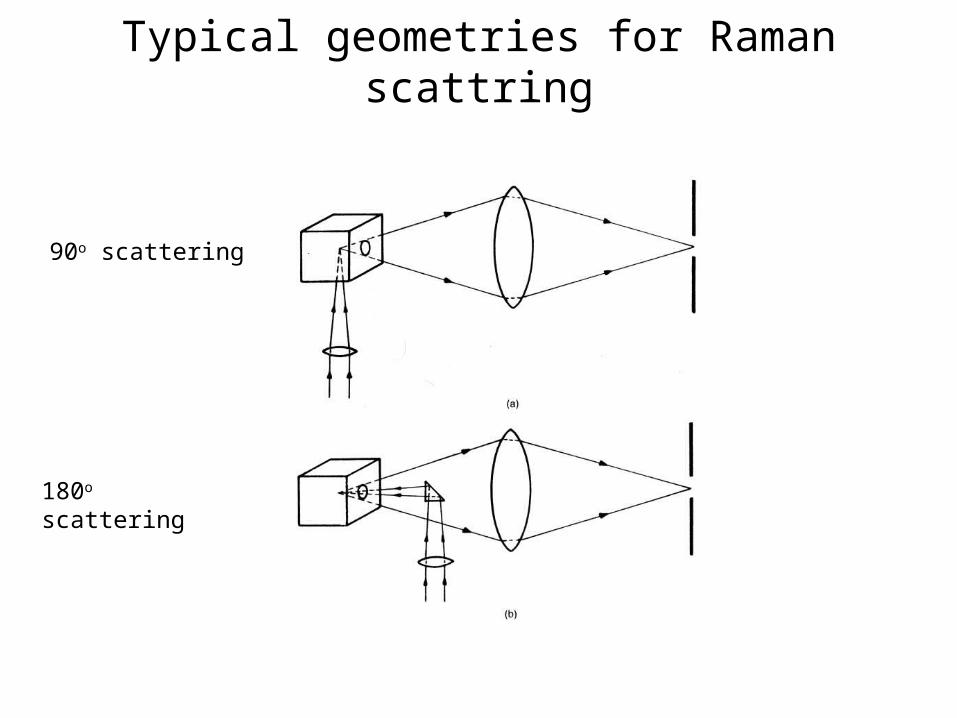
Typical geometries for Raman scattring
90o scattering
180o scattering

Spectrographs for Raman
Spex 1877 triple monochromator
Spex 1403/4 double monochromator
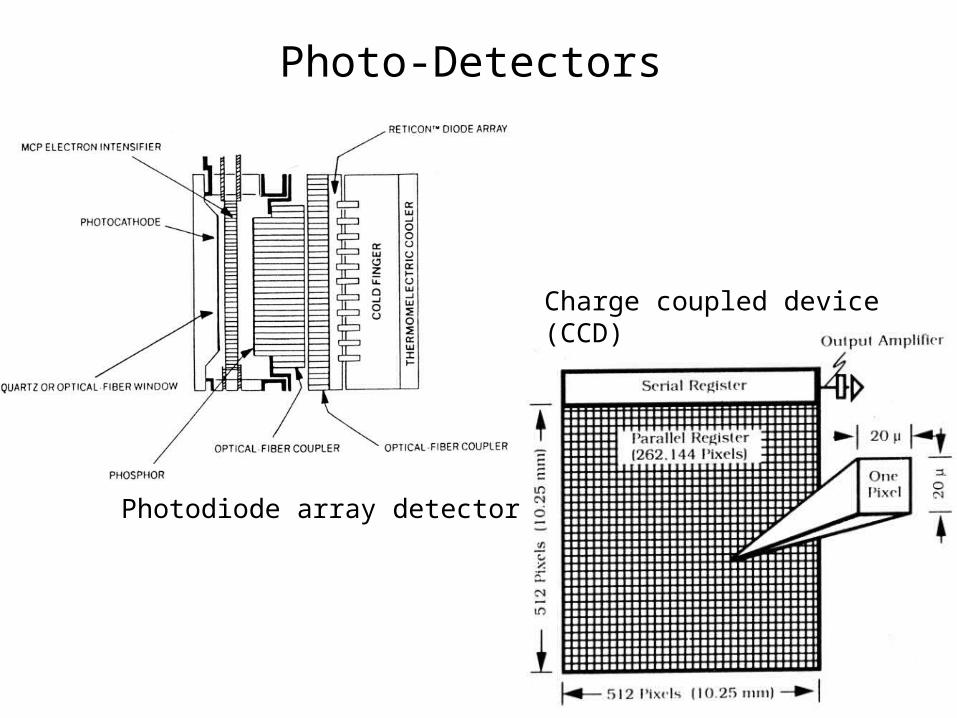
Photo-Detectors
Photodiode array detector
Charge coupled device (CCD)
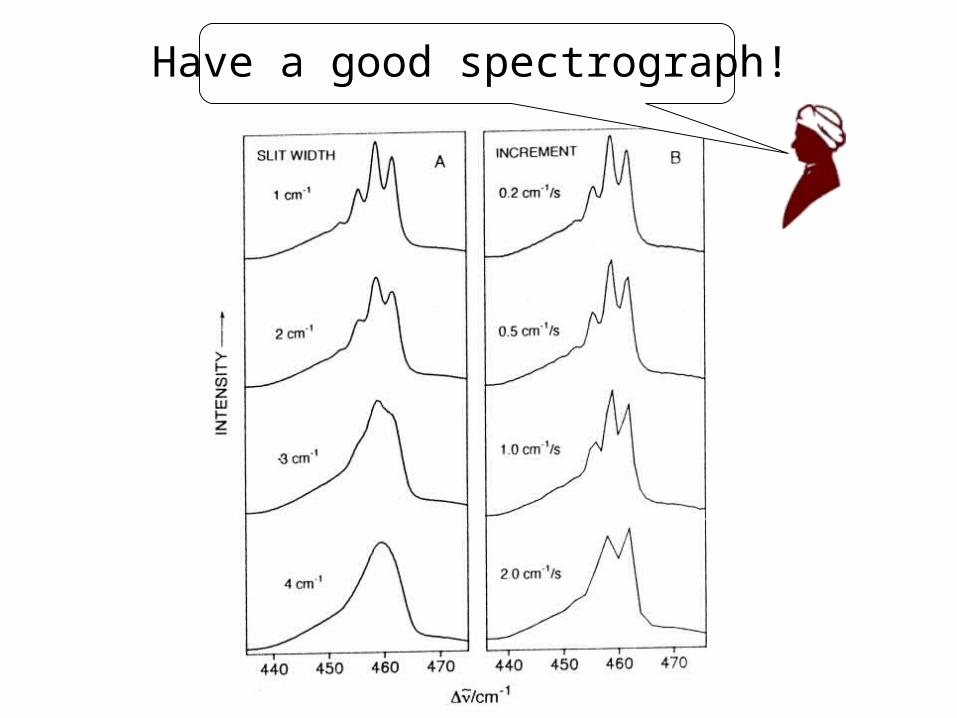
Have a good spectrograph!
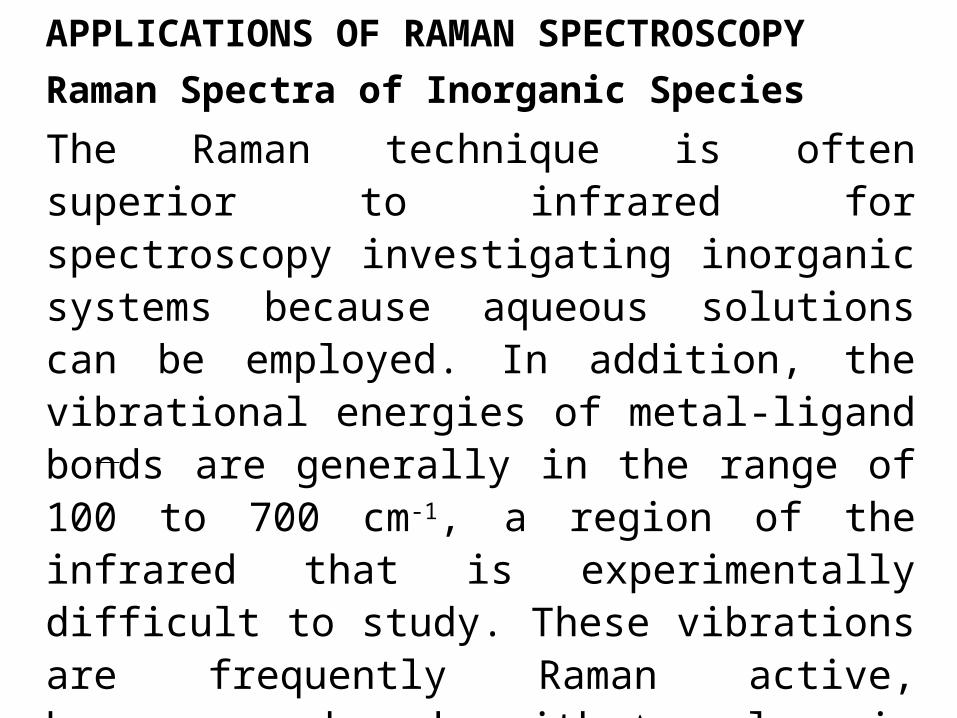
APPLICATIONS OF RAMAN SPECTROSCOPYRaman Spectra of Inorganic Species
The Raman technique is often superior to infrared for spectroscopy investigating inorganic systems because aqueous solutions can be employed. In addition, the vibrational energies of metal-ligand bonds are generally in the range of 100 to 700 cm-1, a region of the infrared that is experimentally difficult to study. These vibrations are frequently Raman active, however, and peaks with values in this range are readily observed. Raman studies are potentially useful sources of information concerning the composition, structure, and stability of coordination compounds.
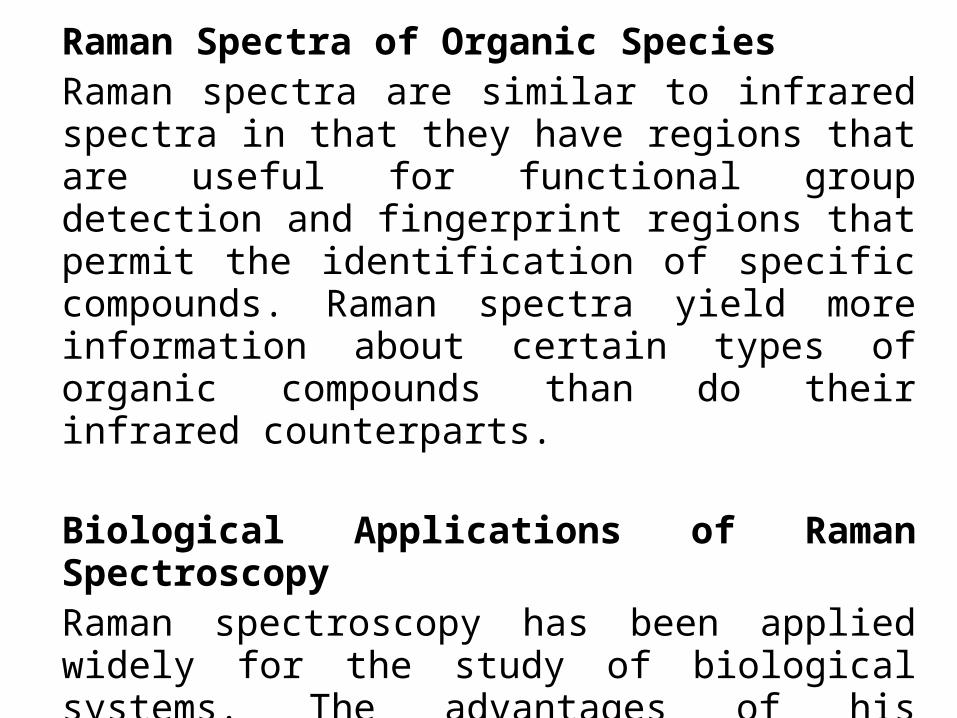
Raman Spectra of Organic SpeciesRaman spectra are similar to infrared spectra in that they have regions that are useful for functional group detection and fingerprint regions that permit the identification of specific compounds. Raman spectra yield more information about certain types of organic compounds than do their infrared counterparts.
Biological Applications of Raman SpectroscopyRaman spectroscopy has been applied widely for the study of biological systems. The advantages of his technique include the small sample requirement, the minimal sensitivity toward interference by water, the spectral detail, and the conformational and environmental sensitivity.
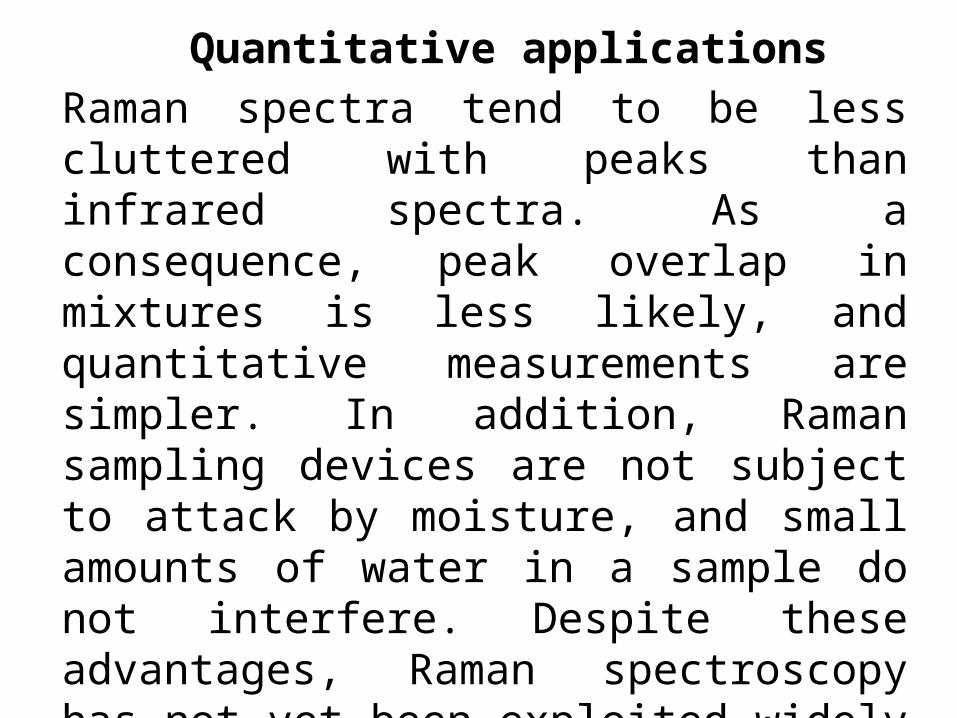
Quantitative applicationsRaman spectra tend to be less cluttered with peaks than infrared spectra. As a consequence, peak overlap in mixtures is less likely, and quantitative measurements are simpler. In addition, Raman sampling devices are not subject to attack by moisture, and small amounts of water in a sample do not interfere. Despite these advantages, Raman spectroscopy has not yet been exploited widely for quantitative analysis. This lack of use has been due largely to the rather high cost of Raman spectrometers relative to that of absorption instrumentation.
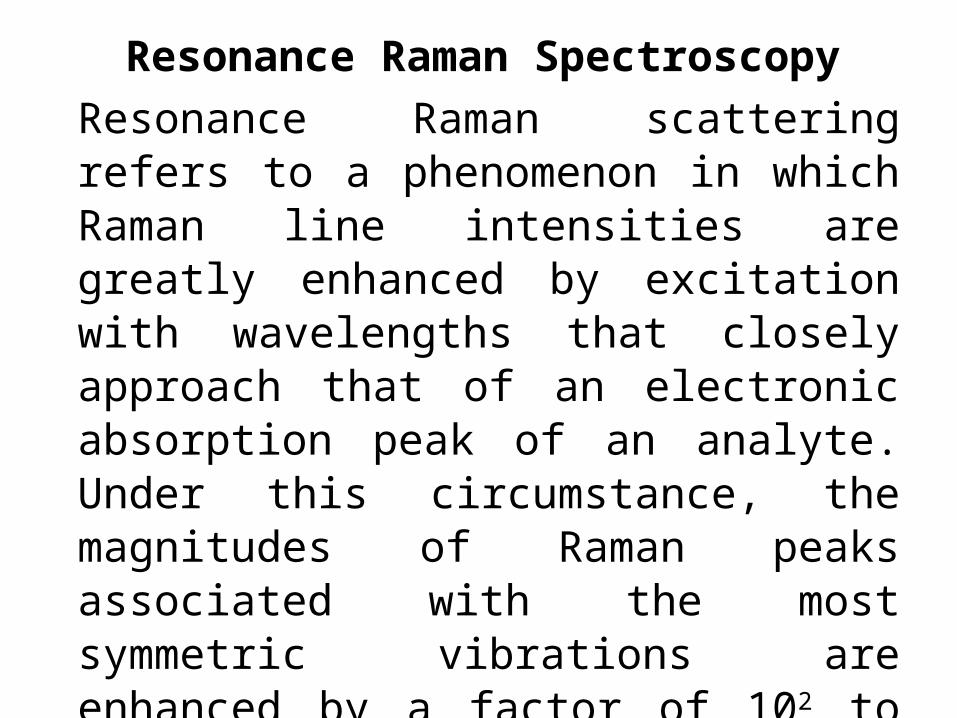
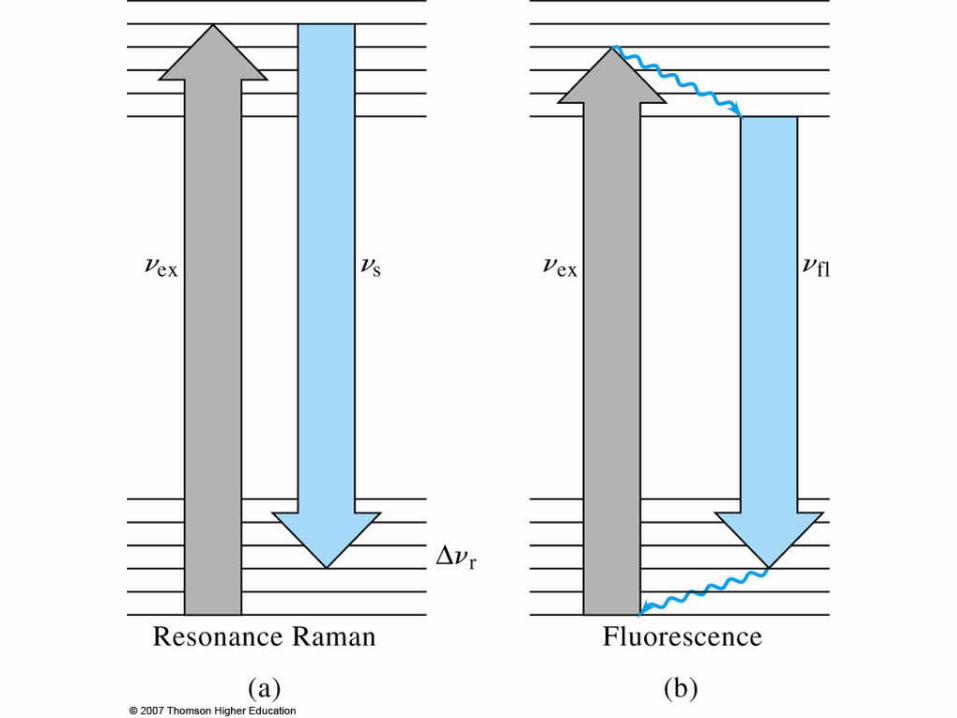
Resonance Raman SpectroscopyResonance Raman scattering refers to a phenomenon in which Raman line intensities are greatly enhanced by excitation with wavelengths that closely approach that of an electronic absorption peak of an analyte. Under this circumstance, the magnitudes of Raman peaks associated with the most symmetric vibrations are enhanced by a factor of 102 to 106. As a consequence, resonance Raman spectra have been obtained at analyte concentrations as low as 10-8 M.
Resonance Raman Spectroscopy
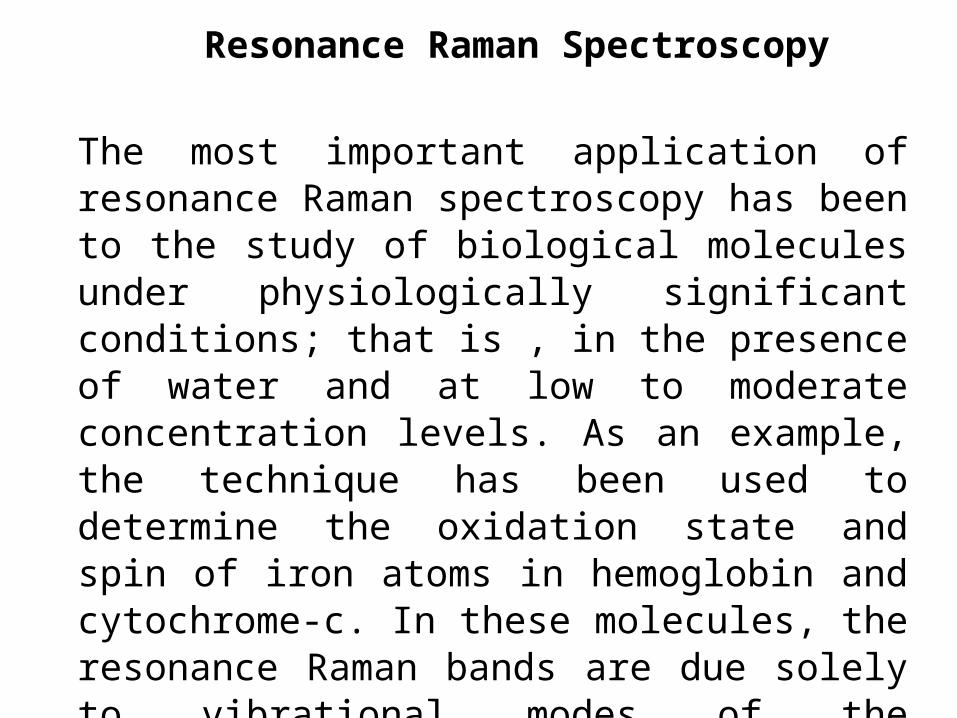
The most important application of resonance Raman spectroscopy has been to the study of biological molecules under physiologically significant conditions; that is , in the presence of water and at low to moderate concentration levels. As an example, the technique has been used to determine the oxidation state and spin of iron atoms in hemoglobin and cytochrome-c. In these molecules, the resonance Raman bands are due solely to vibrational modes of the tetrapyrrole chromophore. None of the other bands associated with the protein is enhanced, and at the concentrations normally used these bands do not interfere as a consequence.
Surface-Enhanced Raman Spectroscopy (SERS)Surface enhanced Raman spectroscopy involves obtaining Raman spectra in the usual way on samples that are adsorbed on the surface of colloidal metal particles (usually silver, gold, or copper) or on roughened surfaces of pieces of these metals. For reasons that are not fully understood, the Raman lines of the adsorbed molecule are often enhanced by a factor of 103 to 106. When surface enhancement is combined with the resonance enhancement technique discussed in the previous section, the net increase in signal intensity is roughly the product of the intensity produced by each of the techniques. Consequently, detection limits in the 10-9 to 10-12 M range have been observed.


