33
Ramanujan IT City -A case study (Optimum Design for Energy Efficiency) 25 th October 2013 AGENDA
Ramanujan IT City
-A case study
(Optimum Design for Energy Efficiency)
25th October 2013
AGENDA

COMMERCIAL OFFICE SUPPLY
Source: Jones Lang LaSalle (JLL)
COMMERCIAL OFFICE SUPPLY:
IT, IT SEZ & Non-IT
(in Million sq.ft)(in Million sq.ft)
� Any economic development requires Industrialization (Manufacturing, Services,
etc.), that may in turn drive the need for Infrastructure, Residential, Amenities and
related demand.
� Such developments impacts the Environment on many ways:
1. Deforestation
2. Alteration to Soil Strata
3. Depletion of Natural Resources
4. Higher Emissions
Sustainable developmentSustainable development
� Since burdening the environment is unavoidable in such a scenario, looking at
minimization of the impact on the environment as lower as possible, will provide
Sustainability.
� Using Green Building Principles right from the design stage provides a solution to both
Operational efficiency, Social & Environmental aspects.
� Demand for the natural resources will keep on increasing. We need to adopt
alternative methods in order to fill up the shortfall
• Energy
• Renewable energy sources
• Optimal energy efficient building design
• Water
• Need for recycle and reuse.
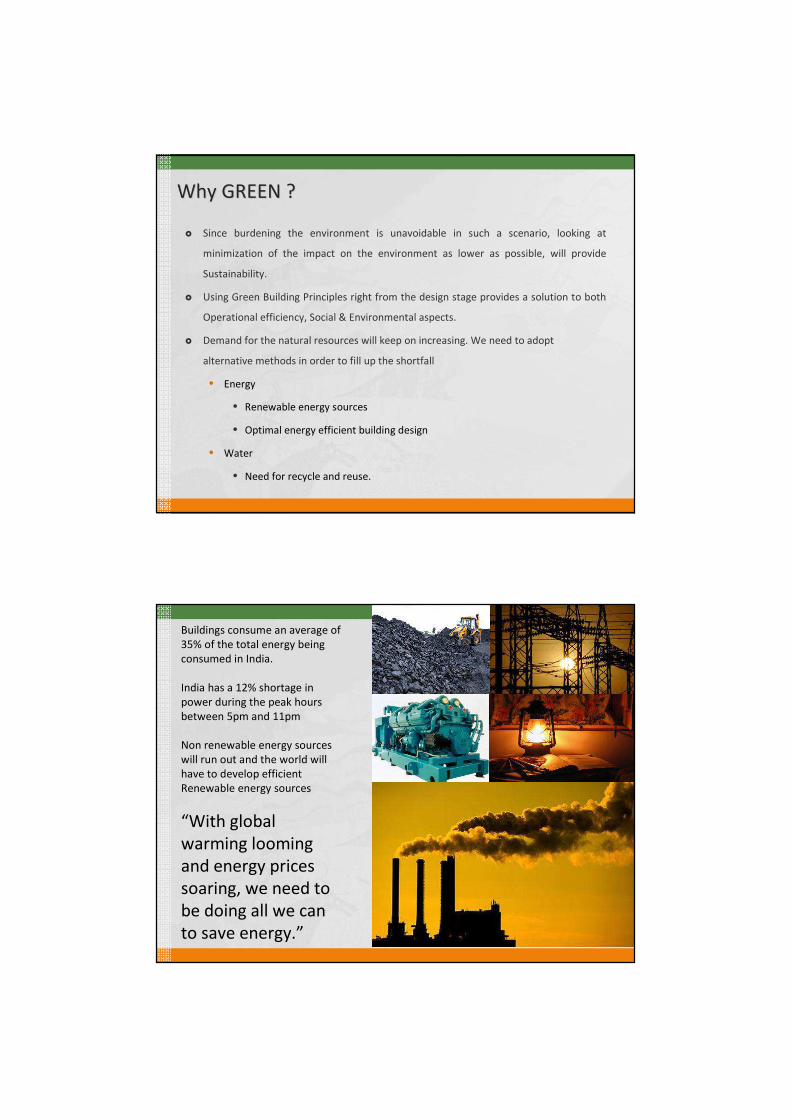
Why GREEN ?Why GREEN ?
Buildings consume an average of
35% of the total energy being
consumed in India.
India has a 12% shortage in
power during the peak hours
between 5pm and 11pm
Non renewable energy sources
will run out and the world will
have to develop efficient
Renewable energy sources
“With global
warming looming
and energy prices
soaring, we need to
be doing all we can
to save energy.”

Depletion of oil & natural gas:
India – oil production and consumption,
2001-2011
India – natural gas production and
consumption, 2001-2012
Source: US Energy Information Administration: International energy statistics
We spend an average of 80% of our time indoors including office & home stay and 55% of our time inside our homes.
The poor indoor air quality has many negative effects like,
•Sick Building Syndrome
•Inadequate daylight & views
•Lower Productivity
•Harmful Chemicals & pollutants

71% of the Earth is covered in
water but only 2.5% is
freshwater
70% of that freshwater is
trapped in polar ice caps or
underground
Only 1% of the total water is
in easy to access rivers and
lakes.
Currently 1.1 billion
people lack access to
safe, clean drinking
water globally.
Sustainable Development is the way forwardSustainable Development is the way forward
SUSTAINABLE
DESIGN
Ecological value
Health & Wellness
Transport
Sustainable materials
Renewable Energy
Whole Life CostsSustainable Materials

"A green building uses less energy, water and natural
resources, creates less waste and is healthier for the people
living inside compared to a standard building”
Indian Green Building Council
What is a “Green Building”?
Ramanujan IT City – A Case Study
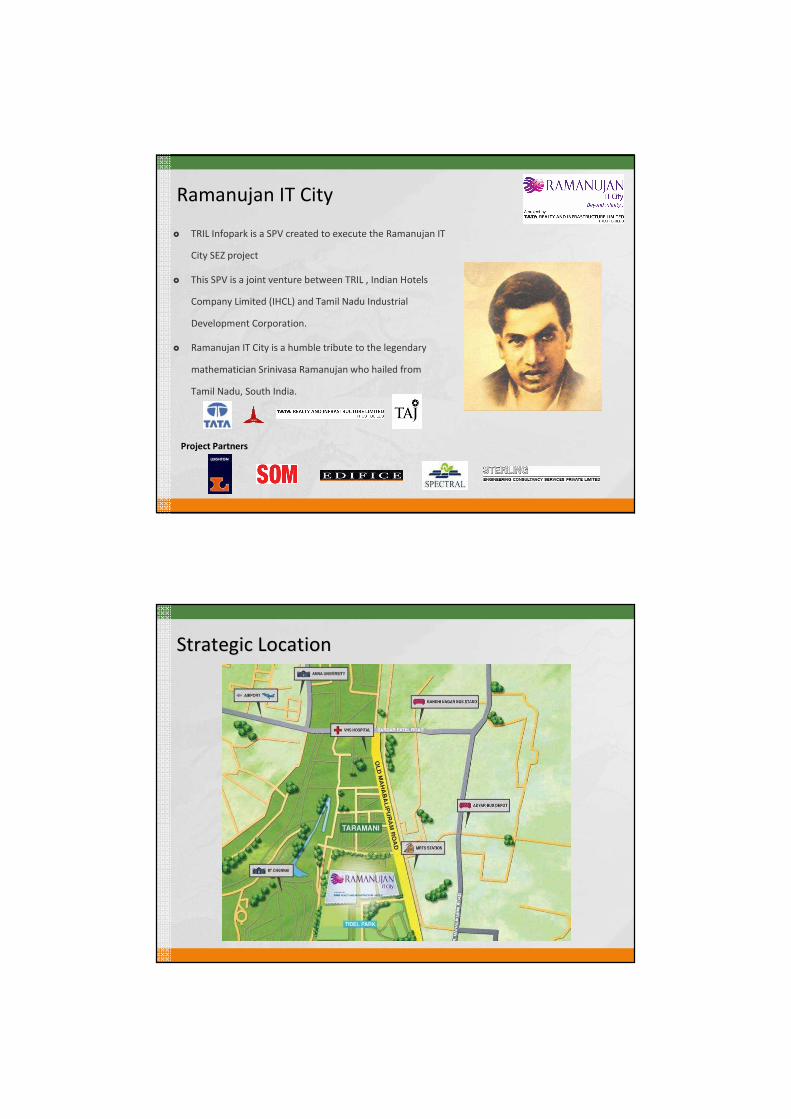
Ramanujan IT City
� TRIL Infopark is a SPV created to execute the Ramanujan IT
City SEZ project
� This SPV is a joint venture between TRIL , Indian Hotels
Company Limited (IHCL) and Tamil Nadu Industrial
Development Corporation.
� Ramanujan IT City is a humble tribute to the legendary
mathematician Srinivasa Ramanujan who hailed from
Tamil Nadu, South India.
Project Partners
Strategic LocationStrategic Location
Project Site InformationOMR
OMR
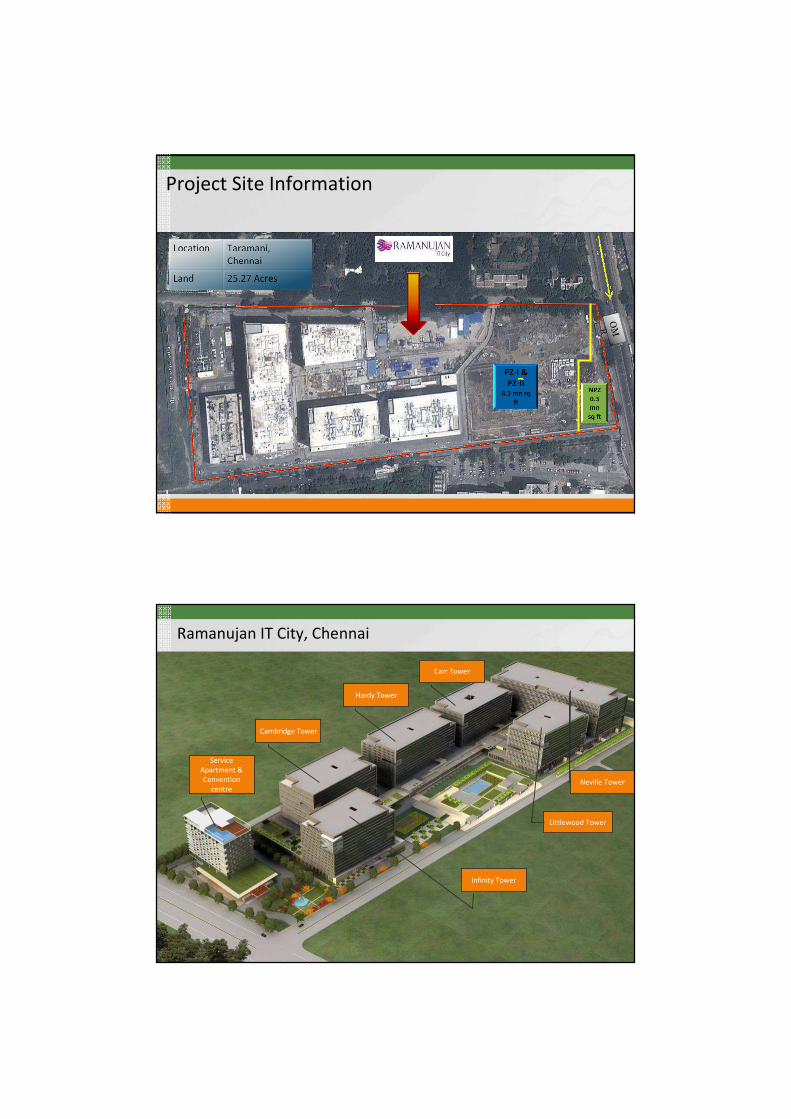
Ramanujan IT City, Chennai
Littlewood Tower
Service
Apartment &
Convention
centre
Infinity Tower
Neville Tower
Carr Tower
Cambridge Tower
Hardy Tower

� Ramanujan IT City being a multi-tenanted campus, the focus was
LEED Gold - Core and Shell.
� The approach was in three phases
• DESIGN PHASE
• CONSTRUCTION PHASE
• OPERATIONAL PHASE
Ramanujan IT City - Approach
DESIGN PHASE

� Ramanujan IT City building design was done @ LEED-
GOLD Rated level in the following areas
� Energy
�BUILDING ENVELOPE
�HVAC
�ELECTRICAL
� Indoor Air Quality
� Waste Recycle
� Exercising the operation with EnMS 50001 Certificate
Ramanujan IT City – Design Phase
� Hollow block for wall construction
� Energy efficient Façade design with composite ACP cladding (U-
Value – 0.14 Btu/hr ft2 °F)
� Covered Parking
� Window Wall ratio of 30%
� Over deck XPS Insulation
� Double Glazed Unitised glazing (U-Value – 0.32 Btu/hr ft2 °F)
� Punch windows on East & West Direction to control Heat radiation
� Strip glazing on North & South for Efficient Day lighting
� Centralised Services in Utility block
� Three basement & two stilt covered parking for the vehicles.
� Providing separate smoking provision away from building,
maintaining building as nonsmoking zone
ENERGY CONSERVATION MEASURES -Architectural

Façade Design
Punched windows on the East and West To
control heat radiation
Glazing on the North and South to
allow maximum day light
Unique Podium Concept @ Ramanujan IT City

Landscape Features
� Landscape has played a major part in reducing
the Heat Island effect in the campus
� Major portion of the podium area is covered
with greenery thereby reducing the heat
transmission to the lower floors and glare on to
the façade
� In the Ground floor too care has been taken to
reduce the glare with extensive vertical
landscaped compound wall and planters along
the entire stretch
� The top soil had been preserved at site during
excavation and same has been used for
landscape in site
� Care has been taken in choosing native species
of plants thereby reducing the water
requirement and survival of same.
Landscape Features
� Recycled water from STP is used for
landscape water requirement
� Sprinklers have been installed to minimize
wastage of water
� Recycling of water in water bodies has also
helped in reducing the water consumption
in landscape
� More than 90 % of the cars are located
under cover in basements.
� Care has been taken in choosing trees in
Ground level to see to it the same takes not
more than 5 years to grow full height and
give adequate cover to the open car parks
located in the external areas, thereby
reducing the Heat Island effect .
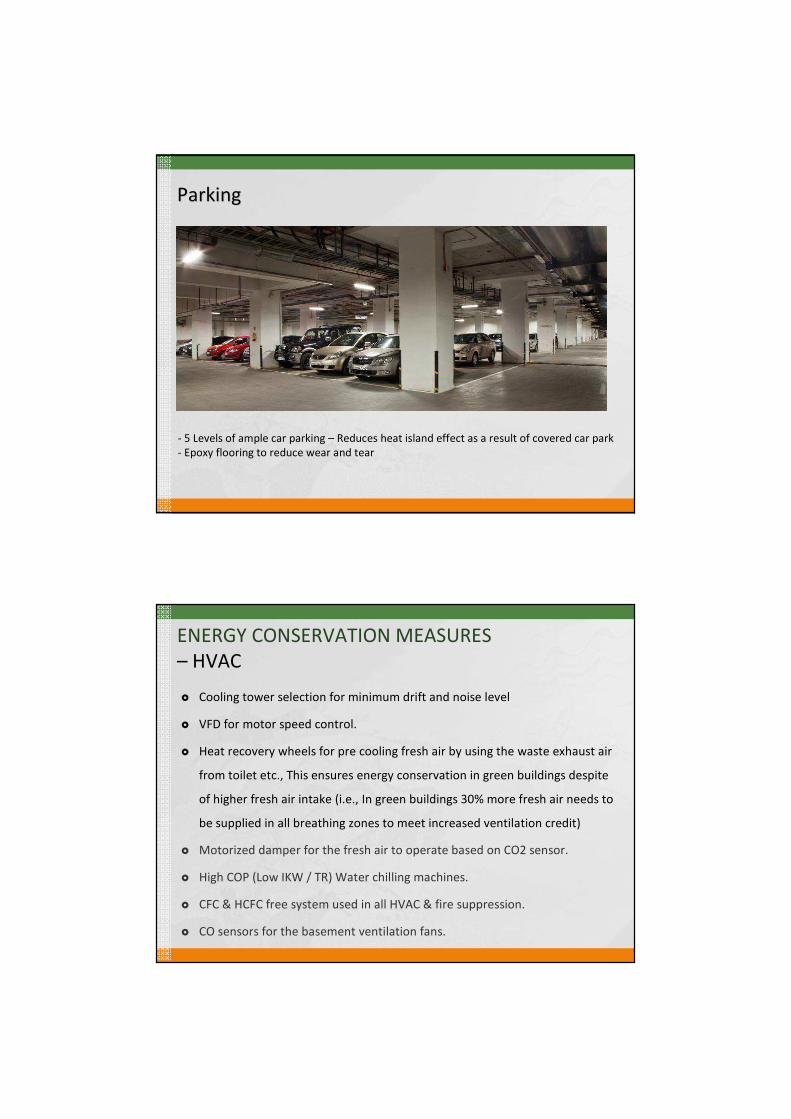
ParkingParking
- 5 Levels of ample car parking – Reduces heat island effect as a result of covered car park
- Epoxy flooring to reduce wear and tear
� Cooling tower selection for minimum drift and noise level
� VFD for motor speed control.
� Heat recovery wheels for pre cooling fresh air by using the waste exhaust air
from toilet etc., This ensures energy conservation in green buildings despite
of higher fresh air intake (i.e., In green buildings 30% more fresh air needs to
be supplied in all breathing zones to meet increased ventilation credit)
� Motorized damper for the fresh air to operate based on CO2 sensor.
� High COP (Low IKW / TR) Water chilling machines.
� CFC & HCFC free system used in all HVAC & fire suppression.
� CO sensors for the basement ventilation fans.
ENERGY CONSERVATION MEASURES
– HVAC

Indoor Air QualityIndoor Air Quality
� Intent
� Prevent Indoor Air Quality problems
� Enhance indoor air quality
� Comfort
� Well-being of the occupants
Good IAQ can enhance
Occupant productivity
by 5-15%
RITC – CFM 30 % more than ASHRAE standards
Indoor Air MonitoringIndoor Air Monitoring
� CO2 Monitoring
� All densely occupied spaces
� CO2 locations between 3’ and 6’ above the floor
� Non-densely occupied spaces
� A direct outdoor air-flow measurement
� Minimum air flow should be as per AHRAE 62.1-2004
� Increase air ventilation rates to all occupied spaces by at least 30%
above the minimum rate required by ASHRAE 62.1 2010
RECOMMENDED
CO2 LEVEL BY
ASHRAE 1000PPM

Space EnvironmentSpace Environment
MERV Filters
� MERV – Minimum Efficiency Reporting Value
� A number from 1 to 16 – relative to an air filter’s
efficiency.
�The higher the MERV, the more efficient the air filters is
in capturing particles.
MERV Filter
� Intent
�Thermal comfort to be met throughout the year
�Both temperature & humidity to be met
�RH control necessary
�Thermally comfortable environment
� Comply with ASHRAE standards 55-2004, including humidity control
Thermal Comfort
Water-cooled centrifugal ChillersWith series counter-flow arrangement
In spite of higher capital costs, water cooled
chillers were used due to the reduced
operational cost.
100% Recycled water used for Cooling tower
make up.

Energy Conservation Measures
� Air-conditioning
� Provided Water Cooled Chiller with higher COP
� Water cooled chiller - energy consumption less than Air cooled
Chiller
� Recycled water to Cooling Tower
� Energy efficient motors
89%
10% 1%
AC LIFE
CYCLE
COST
0.6
5 K
W/T
R
1.3
KW
/TR
POWER CONSUMPTION
Energy Conservation Measures Energy Conservation Measures
-- ElectricalElectrical
� Energy efficient fluorescent tube lights (T-5) shall be used.
� All fluorescent light fixtures are specified to incorporate electronic chokes
which have less watt-loss compared to electro-magnetic chokes and result in
superior operating power factor. This indirectly saves energy. Electronic chokes
also improves life of the fluorescent lamps.
� Energy efficient fluorescent lamps & CFL lamps which give approx. 30% more
light output for the same watts consumed and therefore require less nos. of
fixtures and corresponding lower point wiring costs.
� An APFC relay based on contactor switching is proposed to effect the power
factor correction / improvement.
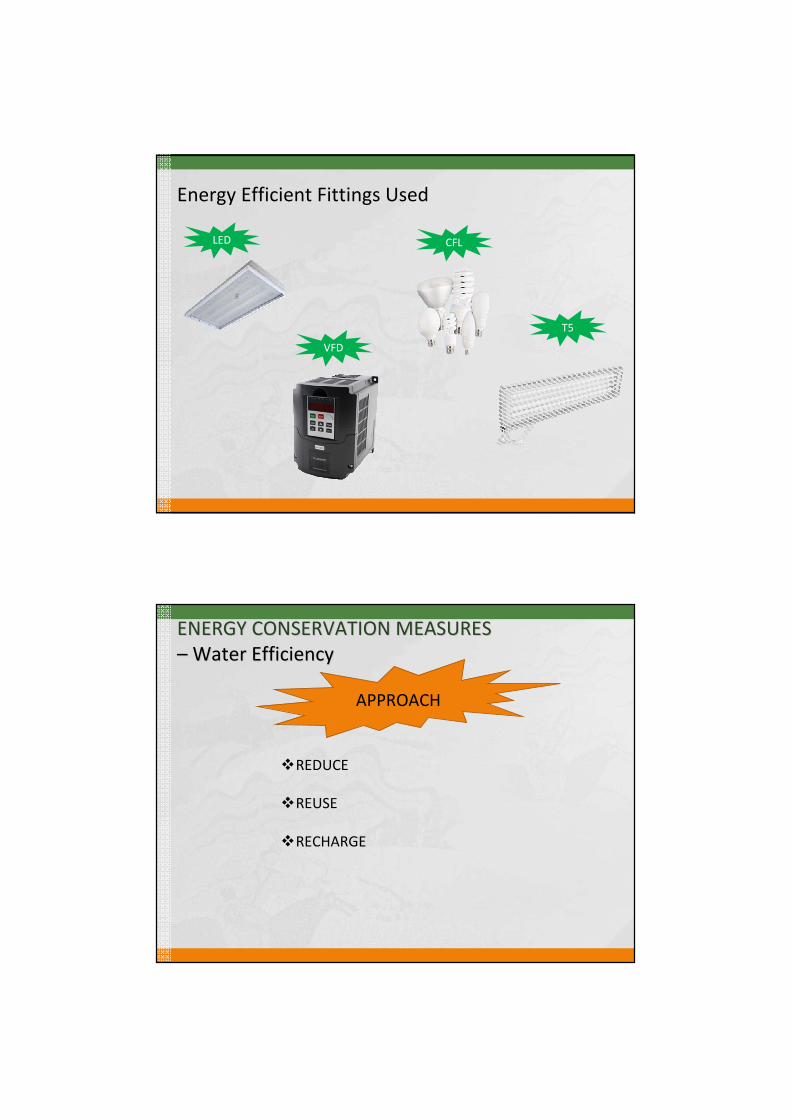
Energy Efficient Fittings Used
LED CFL
T5
VFD
APPROACH
�REDUCE
�REUSE
�RECHARGE
ENERGY CONSERVATION MEASURES ENERGY CONSERVATION MEASURES
–– Water EfficiencyWater Efficiency
� Rain water harvesting percolation pit with over flow connection to the system with
micro filter.
� STP has been designed to handle 100% waste water from the campus.
� Water efficient flush & flow fixtures have been adopted.
� Water recycling using treated water for the Toilet flush, landscape balance for the
cooling tower make up ,drift and evaporation losses (sewage recycled to the extent of
95 % )
� Variable speed secondary / tertiary pumps which ensure that chilled water is supplied
according to demand.
ENERGY CONSERVATION MEASURES ENERGY CONSERVATION MEASURES
–– Water RecyclingWater Recycling
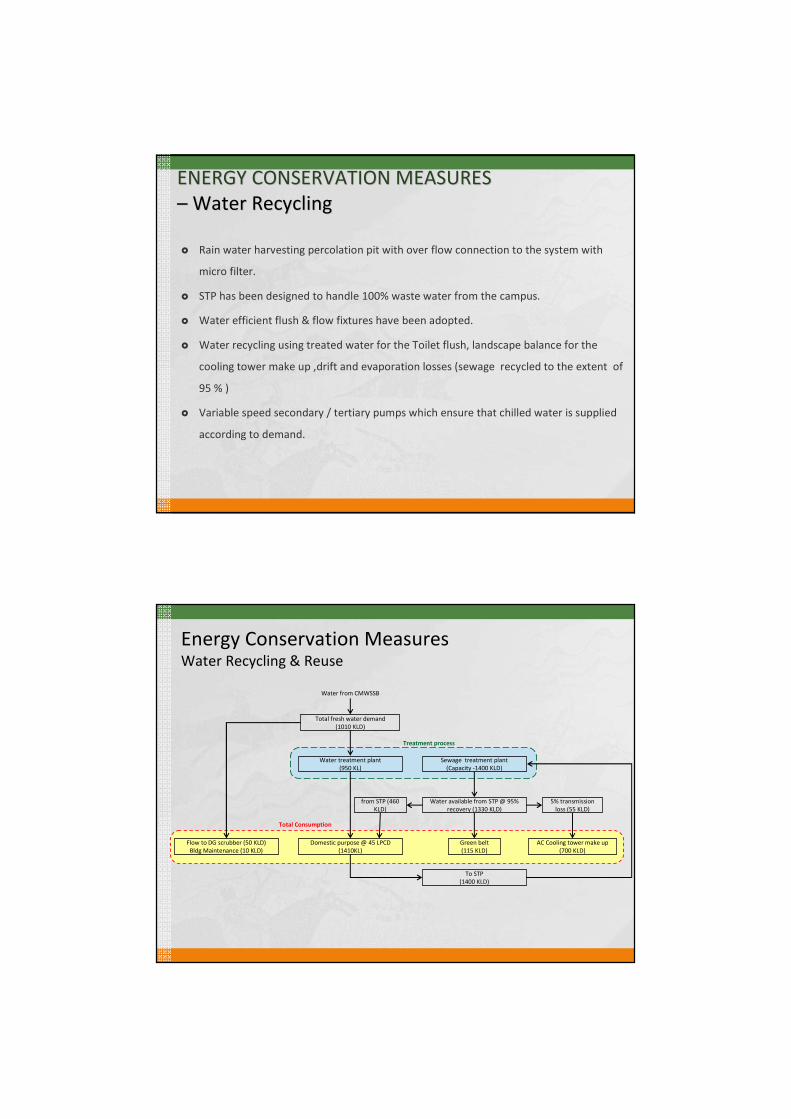
Energy Conservation MeasuresWater Recycling & Reuse
Total fresh water demand
(1010 KLD)
Water treatment plant
(950 KL)
Flow to DG scrubber (50 KLD)
Bldg Maintenance (10 KLD)
Sewage treatment plant
(Capacity -1400 KLD)
Water available from STP @ 95%
recovery (1330 KLD)
Domestic purpose @ 45 LPCD
(1410KL)
Green belt
(115 KLD)
AC Cooling tower make up
(700 KLD)
from STP (460
KLD)
To STP
(1400 KLD)
5% transmission
loss (55 KLD)
Water from CMWSSB
Treatment process
Total Consumption

STP STP –– Membrane BioMembrane Bio--reactorreactor
Sewage from user point WC and urinals
Coarse screen chamber
Oil and grease chamber
Collection / Equalization tank
Fine screen chamber
Anoxic tank
Bio-Aeration tank
MBR tank
UV lights
Hypo dosing
Treated water tank
To all blocks WC’s and urinals
Bio sludge to gardening
Liquid to collection pit
Decanter
Sludge holding tank
Softener
Softened water tank
Cooling tower makeup tank
Energy Analysis
TRIL infopark project ‘Ramanujan IT City’ at Chennai has a conditioned area of approximately
27,63,752 sq.ft. The overall Wall Window Ratio is approximately 35%. The office operates
throughout the year, with major spaces being used till late in the evening.
A baseline buildings as per the requirements
of ASHRAE/IESNA 90.1 – 2004 was modeled.
The average base case energy consumption
has been considered without modeling any
shades & overhangs in the building as
envisaged by the architects.
A zoning plan was developed for each floor &
entered into the simulation model. Each
zone was assigned a set of properties
including lighting power density, equipment
power density, occupancy rate, outside air
requirement etc. Each zone was also
assigned physical properties of floor-to-floor
height, material conductivity & fenestration
area etc.

Design Parameters
Building Envelop:
Exterior wall Construction: Metal
Frame
U Value= 0.12 Btu.in/hr sft 2 0F
Roof Construction:
Insulation above deck
U Value= 0.05 Btu.in/hr sft 20F
Floor Slab:
U factor= 0.35 Btu.in/hr sft 20F
Glazing:
U Value= 0.32 Btu.in/hr sft 20F
SC = 0.62
VLT = 75%
Wall window ratio= 30%
Occupancy:
Lobby- 30Sft/person
Office /Amenities- 70Sft/person
CFM/person- 30% over ASHRAE 62.1
Office/Amenities- 12cfm/person
Lobby: 8.8 cfm/person
Shading Device
Glazing Setback- 0.65ft East/West
Overhang- 1.3ft North/South
Lighting Equipment:
20% reduced LPD
Bldg envelope
data:
Win/Wall ratio
Glazing
Shading
Bldg site data:
Wall
Roof
Internal
loads:
LPD
HVAC:
HVAC Type
Fan control
Chiller:
parameter
DCV Ventilation
ENERGY SIMULATION
MISCELLANEOUS DATA - (FIXED)BUILDING DATA – (VARIABLES)
Output files
Operations
&
Scheduling
Occupancy
loads
Utility
rates
Economic
Parameter
s
Modelling process
A total of six design scenarios had been created including the conventional design and ASHRAE base design
configuration.
Scenario – 1: with conventional features & general specifications.
Scenario – 2: with ‘Green’ features
Scenario – 3: with modified ‘Green’ features
Scenario – 4: with modified ‘Green’ features
Scenario – 5: with actual / Design case features
Scenario – 6: with ASHRAE building standards
The Final Design was selected based on the ideal design scenarios

S. No
Model Input Parameter
Scenario 1(Original Design
Case)
Scenario 2 Scenario 3 Scenario 4 Scenario 5(As-Built Case)
Scenario 6(ASHRAE 90.1-2004 Baseline)
1 Exterior Wall
Construction
9 inch Brick Wall
U-value: 0.32
Btu/hr.ft2 0F
10 inch Cavity Brick
Wall
U-value: 0.24
Btu/hr.ft2 0F
Same as Scenario 2
(10 inch Cavity Brick
Wall
U-value: 0.24
Btu/hr.ft2 0F)
10mm thk. Concrete
board + 25mm XPS
insulation + 460mm
airgap + 4mm ACP
Cladding
U-Value = 0.14
Btu./hr.ft2 0F
Same as Scenario 4
(10mm thk. Concrete
board + 25mm XPS
insulation + 460mm
airgap + 4mm ACP
Cladding
U-Value = 0.14
Btu./hr.ft2 0F)
Steel Frame
U value-0.124
Btu/hr.ft2 0F
2 Roof
Construction
RCC Roof without
Insulation
U-value: 0.35
Btu/hr.ft2 0F
6” R.C.C slab + 3”
XPS Insulation + 4”
screed + 1” PCC
U-value= 0.05
Btu/hr.ft2 0F
Same as Scenario 2
(6” R.C.C slab + 3”
XPS Insulation + 4”
screed + 1” PCC
U-value= 0.05
Btu/hr.ft2 0F)
Same as Scenario 2
(6” R.C.C slab + 3”
XPS Insulation + 4”
screed + 1” PCC
U-value= 0.05
Btu/hr.ft2 0F)
Same as Scenario 2
(6” R.C.C slab + 3”
XPS Insulation + 4”
screed + 1” PCC
U-value= 0.05
Btu/hr.ft2 0F)
Insulation entirely
above deck
U value-0.063
Btu/hr.ft2 0F
3 Window to Wall
Ratio
40% 35% 35% 30% 30% 30%
4 Glazing Single Clear,
U Value: 1 Btu/hr.ft2
0F
SC : 0.87
DGU
U Value: 0.32
Btu/hr.ft2 0F
SC : 0.62
Same as Scenario 2
(DGU
U Value: 0.32
Btu/hr.ft2 0F
SC : 0.62)
Same as Scenario 2
(DGU
U Value: 0.32
Btu/hr.ft2 0F
SC : 0.62)
Same as Scenario 2
(DGU
U Value: 0.32
Btu/hr.ft2 0F
SC : 0.62)
U Value : 1.22
Btu/h.ft2°F
SC (All) : 0.29
5 Shading Devices None 6 Inches Recessed
Windows
Same as Scenario 2
(6 Inche Recessed
Windows)
Deep Recessed
Windows
Same as Scenario 4
(Deep Recessed
Windows)
None
Comparison of Scenarios for energy Modeling
6 Lighting Power
Density
Same as ASHRAE
Basecase
20% Reduction from
Basecase
LPD: 0.8W/Sq.ft
Same as Scenario 2
(20% Reduction from
Basecase
LPD: 0.8W/Sq.ft)
Same as Scenario 2
(20% Reduction from
Basecase
LPD: 0.8W/Sq.ft)
Same as Scenario 2
(20% Reduction from
Basecase
LPD: 0.8W/Sq.ft)
As per the Building
Area Method
ASHRAE 90.1-2004.
Office Floor - 1.0
W/ft2
Parking Area – 0.3
W/ft2
HVAC
System
Type
Constant Air Volume Variable Air Volume Same as Scenario 2
(Variable Air
Volume)
Same as Scenario 2
(Variable Air
Volume)
Same as Scenario 2
(Variable Air
Volume)
Table G3.1.1.B
System 8 –
PFP-VAV with reheat
with electric
resistance as heating
type
8 Fan Control in
A.H.U.’s
Constant Speed Variable speed Same as Scenario 2
(Variable speed)
Same as Scenario 2
(Variable speed)
Same as Scenario 2
(Variable speed)
Variable Speed
9 Chillers
Parameter
10X800 TR Water-
Cooled Rotary Screw
Chillers
COP – 5.5
10X800 TR Water-
Cooled Centrifugal
Chillers
COP – 5.5
20X400 TR Air-
Cooled Rotary Screw
Chillers
COP – 5.5
8X900 TR Water
Cooled Centrifugal
Chillers
COP - 6.1
Same as Scenario 4
(8X900 TR Water
Cooled Centrifugal
Chillers
COP - 6.1)
10X800 TR Water
Cooled Centrifugal
Chillers
COP - 6.1
10 Demand Control
Ventilation
None Yes Yes Yes Yes Not applicable
11 Ventilation None CO sensors in parking Same as Scenario 2
(CO sensors in
parking)
Same as Scenario 2
(CO sensors in
parking)
Same as Scenario 2
(CO sensors in
parking)
None
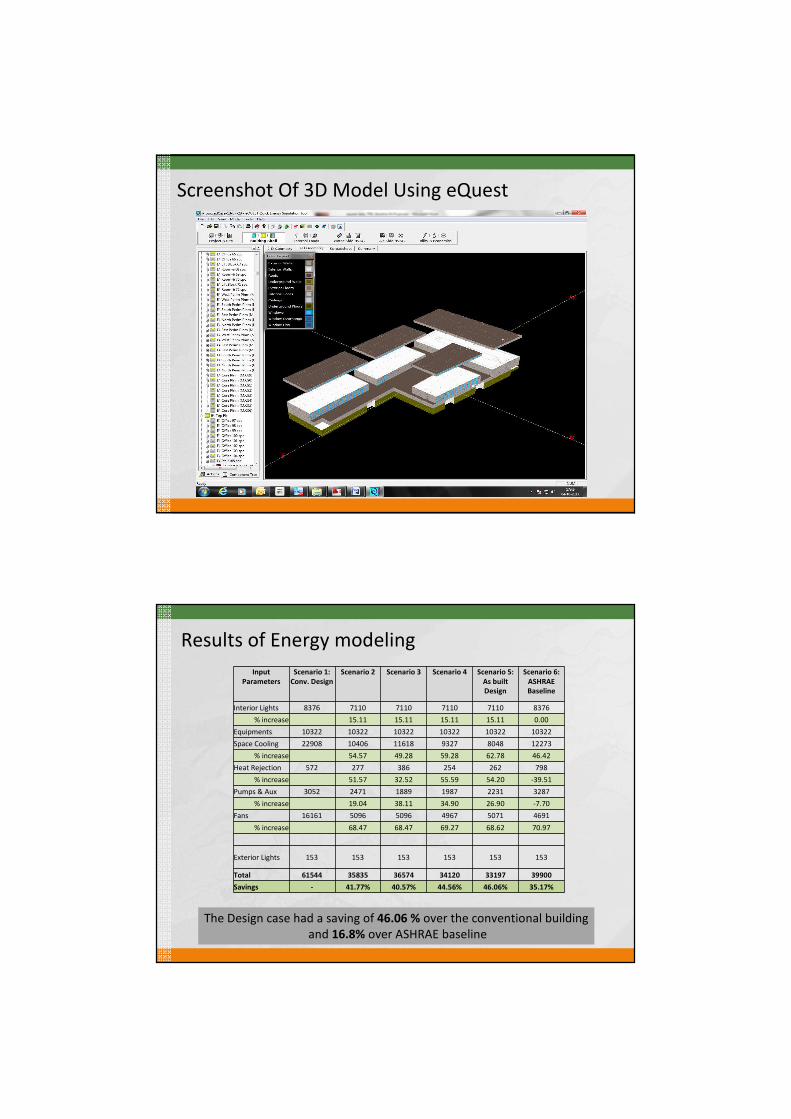
Screenshot Of 3D Model Using eQuest
Input
Parameters
Scenario 1:
Conv. Design
Scenario 2 Scenario 3 Scenario 4 Scenario 5:
As built
Design
Scenario 6:
ASHRAE
Baseline
Interior Lights 8376 7110 7110 7110 7110 8376
% increase 15.11 15.11 15.11 15.11 0.00
Equipments 10322 10322 10322 10322 10322 10322
Space Cooling 22908 10406 11618 9327 8048 12273
% increase 54.57 49.28 59.28 62.78 46.42
Heat Rejection 572 277 386 254 262 798
% increase 51.57 32.52 55.59 54.20 -39.51
Pumps & Aux 3052 2471 1889 1987 2231 3287
% increase 19.04 38.11 34.90 26.90 -7.70
Fans 16161 5096 5096 4967 5071 4691
% increase 68.47 68.47 69.27 68.62 70.97
Exterior Lights 153 153 153 153 153 153
Total 61544 35835 36574 34120 33197 39900
Savings - 41.77% 40.57% 44.56% 46.06% 35.17%
Results of Energy modeling
The Design case had a saving of 46.06 % over the conventional building
and 16.8% over ASHRAE baseline

Energy Use Characterization For All 6 Scenarios (Mwh)
ENERGY SAVINGS – 16.8%
CONSTRUCTION PHASE
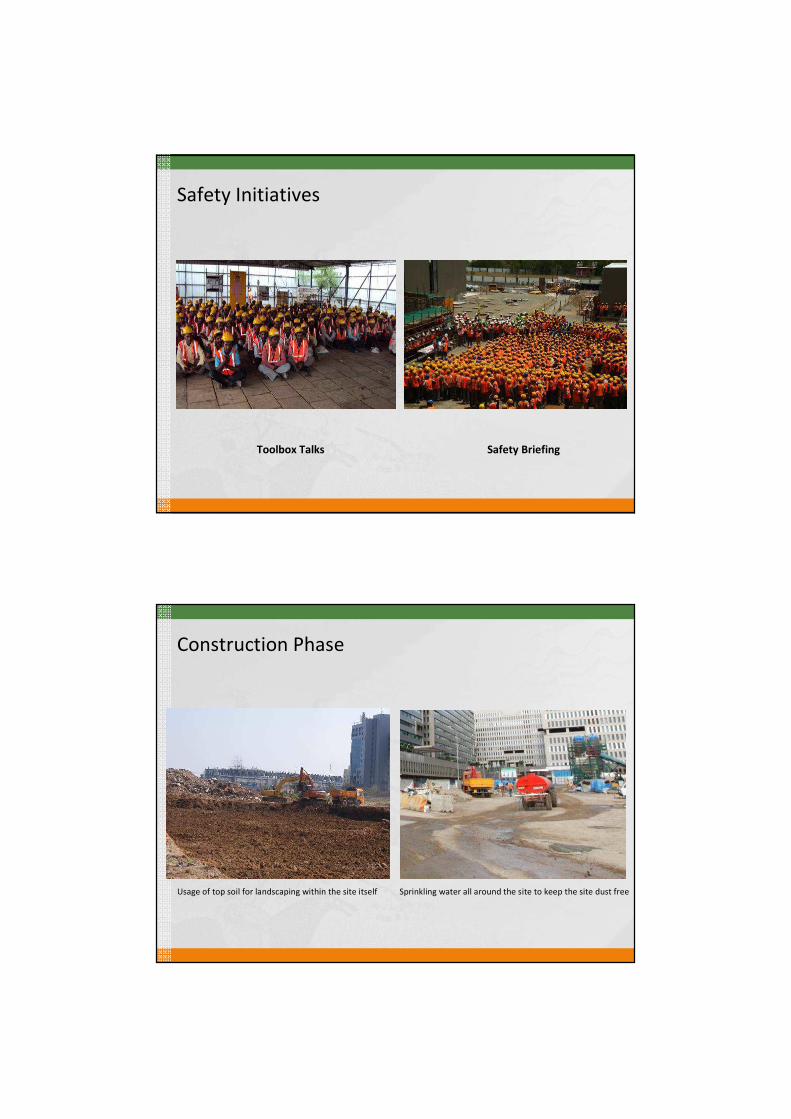
Safety Initiatives
Toolbox Talks Safety Briefing
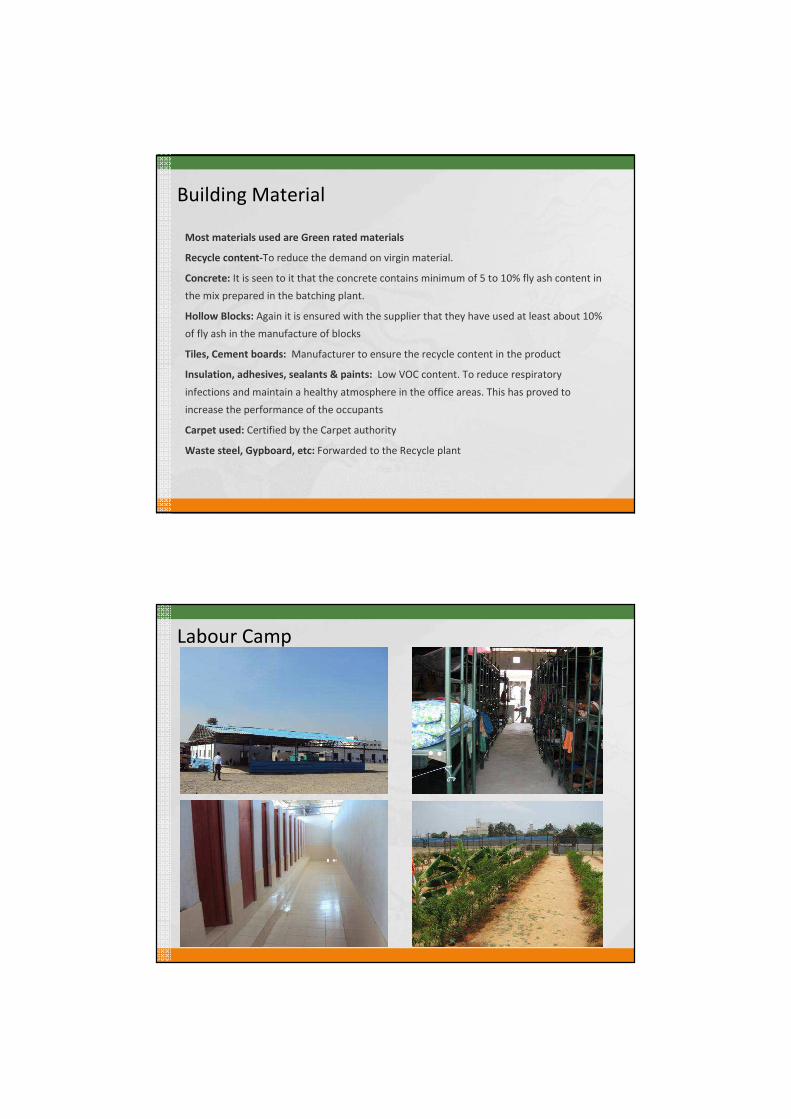
Construction Phase
Usage of top soil for landscaping within the site itself Sprinkling water all around the site to keep the site dust free
Building Material
Most materials used are Green rated materials
Recycle content-To reduce the demand on virgin material.
Concrete: It is seen to it that the concrete contains minimum of 5 to 10% fly ash content in
the mix prepared in the batching plant.
Hollow Blocks: Again it is ensured with the supplier that they have used at least about 10%
of fly ash in the manufacture of blocks
Tiles, Cement boards: Manufacturer to ensure the recycle content in the product
Insulation, adhesives, sealants & paints: Low VOC content. To reduce respiratory
infections and maintain a healthy atmosphere in the office areas. This has proved to
increase the performance of the occupants
Carpet used: Certified by the Carpet authority
Waste steel, Gypboard, etc: Forwarded to the Recycle plant
Labour Camp
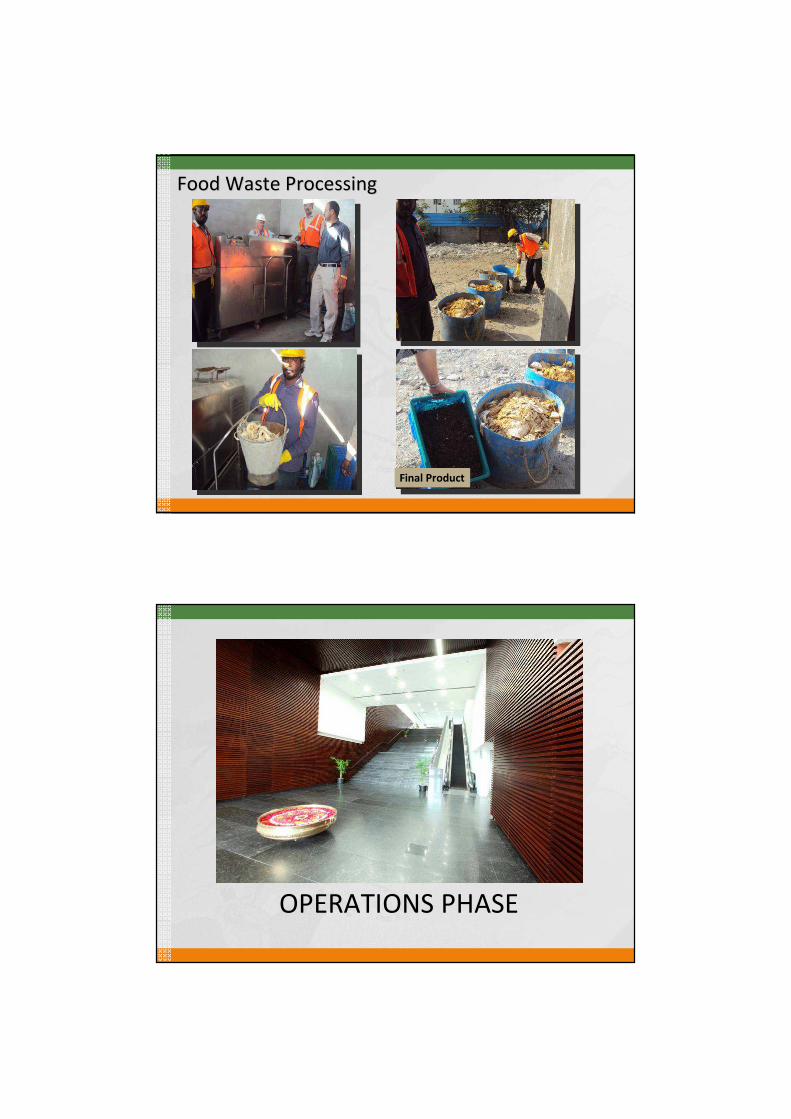
Food Waste ProcessingFood Waste Processing
Final Product
OPERATIONS PHASE
IMS Certification For operational efficiency
ISO 9001
QUALITY MANAGEMENT SYSTEMS
� Customer Confidence
� Export Business
� Competitive advantage
� Corporate Image
ISO 14001
ENVIRONMENTAL MANAGEMENT
SYSTEMS
� Threats from society ,
government on environmental
issues are minimized.
� Trade barrier from certain
customers is avoided.
� The unproductive time loss in
litigation is avoided.
BS OHSAS 18001
SAFETY
MANAGEMENT SYSTEMS
�Damage to Human beings is
avoided.
�Down Time is avoided
�Possible Litigations are avoided.
ISO 50001
ENERGY MANAGEMENT
SYSTEMS
�Reduce energy usage
�Effective use of energy
�Reduce operational costs
�Environmental impact
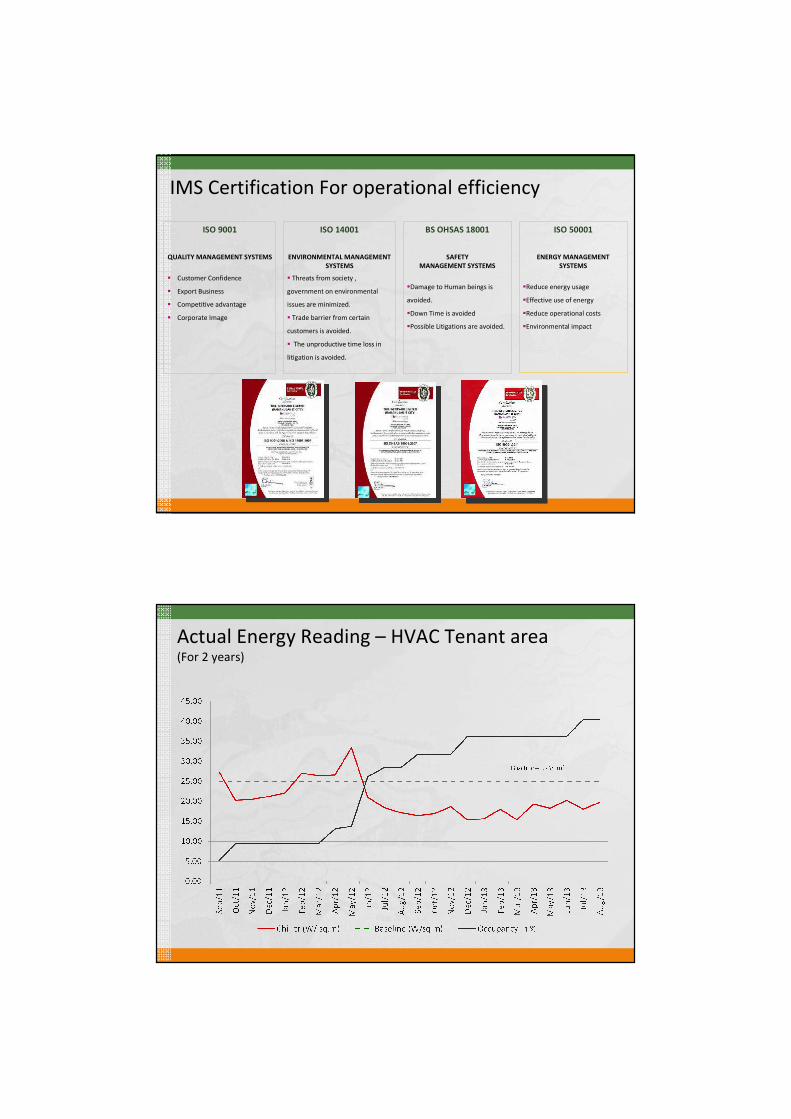
Actual Energy Reading – HVAC Tenant area (For 2 years)

Actual energy reading – HVAC Common area(For 2 years)
EPI (Energy Performance Index)Annually based on building occupation
Total Energy performance index for:
Conventional Non-green building = 240 kWh / m2 / year
Other bench marked Green buildings = 185 kWh / m2 / year
Ramanujan IT City = 170 kWh / m2 / year
Operational Cost Reduction
Operational Cost for 3.4 Million sq.ft of IT building with 16.8
% energy saving translates to:
�Actual Energy Cost = Rs. 7.57 Crores / Month, resulting in
savings of Rs. 18.5 Crores/ Annum
�Actual oil consumption = 795 KL/Month resulting in savings
of 1927 KL / Annum .
�Reduction in emissions = 15,000 Tons of Co2 (0.85
tCo2/MWh)
�Fresh water consumption reduced by 54% due to Recycling
& Reuse.
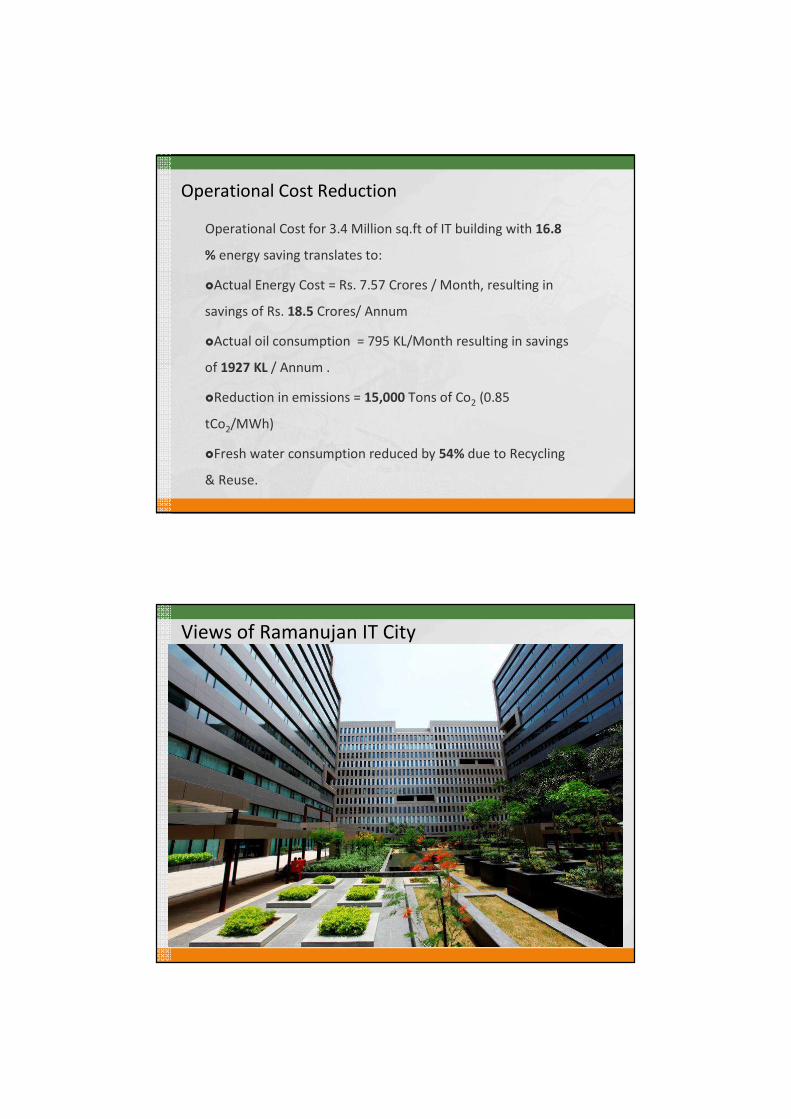
Views of Ramanujan IT City
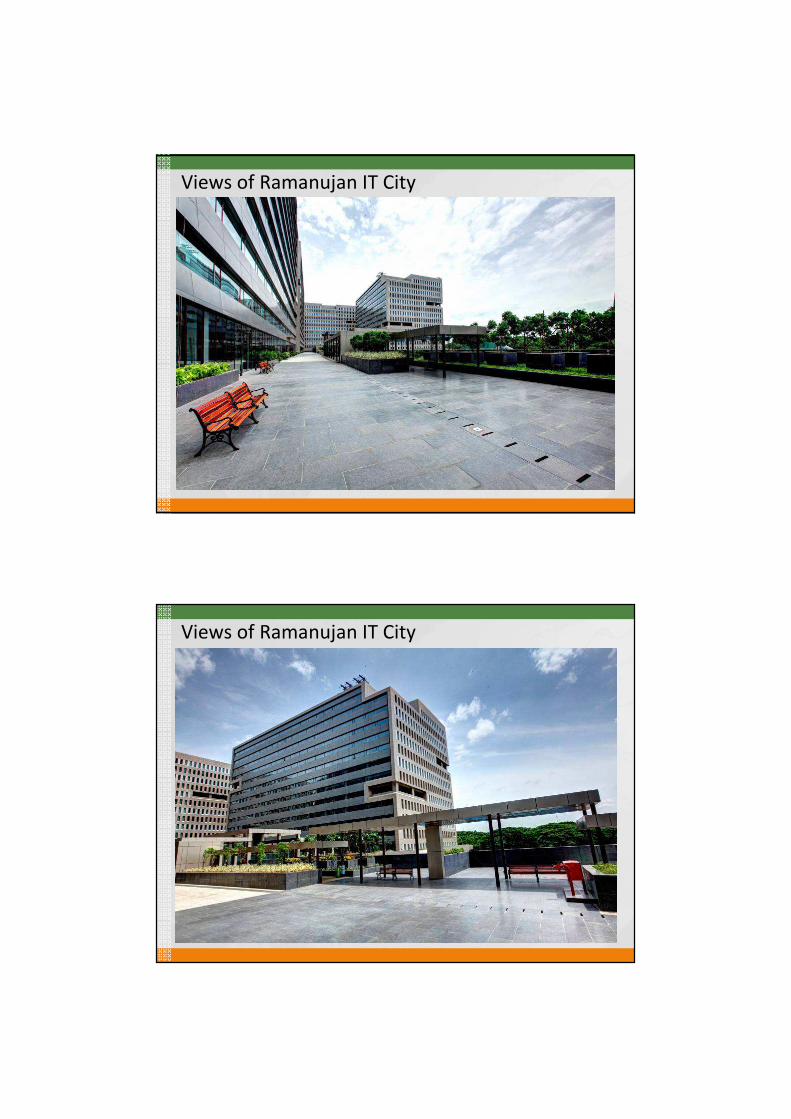
Views of Ramanujan IT City
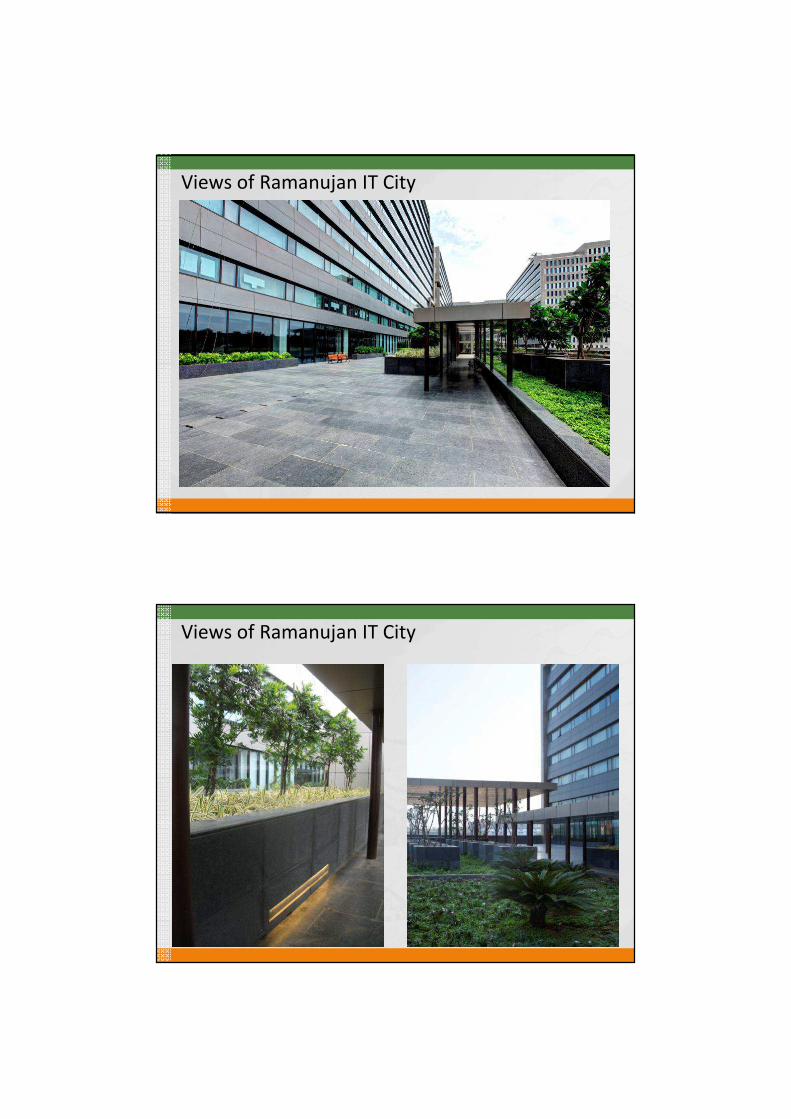
Views of Ramanujan IT City
Views of Ramanujan IT City
Views of Ramanujan IT City

To Sum Up
� Green Buildings
� Tremendous opportunity for tangible
& intangible savings
� Tremendous Benefits
� Individual
� Society
� Nation
� Instill in the citizens
� A Sense of Pride
� Contribution to society
Ultimately contribute towards a Greener Planet
As Responsible Citizens of India, we should not only look at the needs of
the present day but, also the needs of the generations to come and also
make sure the environment is completely protected.
This is what we mean by – “ The Value of Sustainability”
Sustainable Construction: Conclusion

THANK YOU
For the energy and patience sustained !


