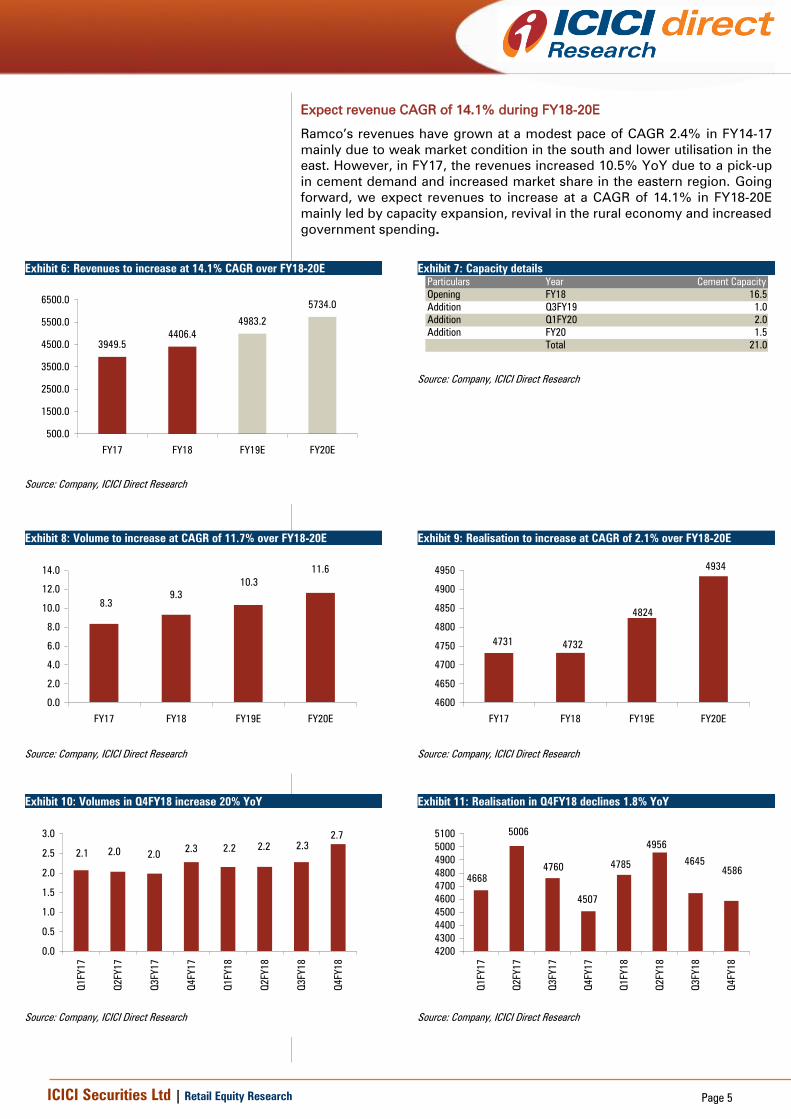
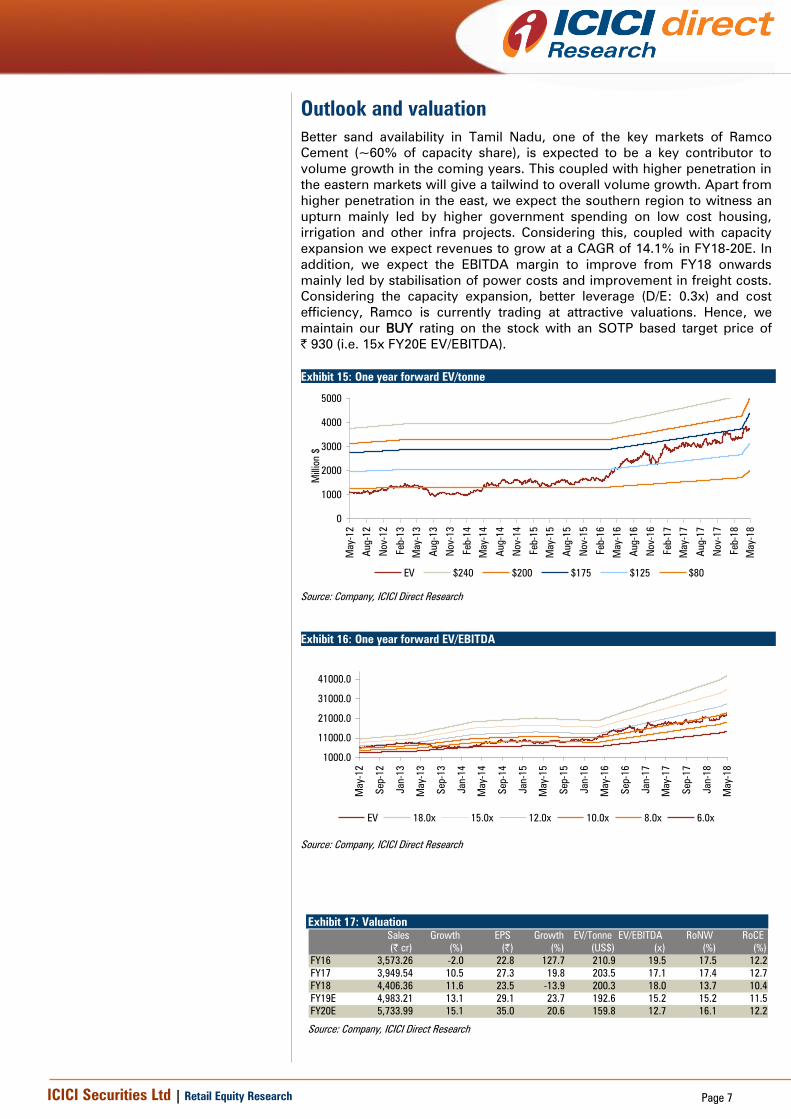
May 24, 2018 ICICI Securities Ltd | Retail Equity Research Result Update Healthy EBITDA/t despite input pressure… Ramco reported a mixed set of Q4FY18 numbers. Revenues increased 22.3% YoY to | 1,254.8 crore (vs. I-direct estimate of | 1,206.5 crore) led by 20.2% YoY increase in volumes to 2.7 MT (vs. I-direct estimate of 2.6 MT) due to higher sales in eastern region. Further, realisation increased 1.8% YoY to | 4,586 (vs. I-direct estimate of | 4,710) EBITDA/t declined 16.4% YoY to | 995/t (vs. I-direct estimate of | 1,098/t) mainly led by 30.7% YoY increase in power cost/t and 12.6% YoY increase in freight cost/t The company has reduced its debt by | 310 crore and recommended a dividend of | 3/share in FY18. The company plans to add 1.5 MT clinker capacity at Andhra Pradesh for | 680 crore. This expansion is in addition to 3 MT capacity expansion announced by the company previously Operating markets key beneficiary of increased infra spends… The pick-up in road tendering activity, improved sand availability in the company’s operating markets and healthy demand from government’s low cost housing programme are expected to be key drivers of cement demand. As a result, we expect demand (15 MT) to outpace supply (7 MT) positively impacting utilisation levels. Consequently, we expect Ramco’s operating markets to register growth of 7-8% over the next three to four years. Capacity expansion to further drive growth… The company has over the years penetrated the West Bengal and Odisha market. Ramco is planning to further penetrate in the east through capacity expansion. Of the 4.5 MT capacity expansion planned by the company, 2 MT will be in the east (1 MT each in West Bengal, Odisha) while 2.5 MT will be set up in the south (in Andhra Pradesh). The capacity expansion in the east will enable the company to remove capacity constraint and also increase its market share. Apart from expansion in the east, the capacity expansion in AP (south) will enable it to tap the growing opportunity of this market (that is expected to grow at 14% CAGR in the next two to three years). Healthy cash flow generation to keep balance sheet light! During the downturn in the south in FY10-15, efficient management of cash flows has enabled the company to reduce debt-equity from 1.6x to 1.0x in FY15 and further to 0.3x in FY18. Going forward, we believe the company’s robust cash flow generation (~| 2,500 crore in FY18-20E) will not only enable to fund its capex through internal accruals but also maintain its debt- equity at 0.3x. Better sand availability, improving margins key positives; maintain BUY Better sand availability in Tamil Nadu, one of the key markets of Ramco Cement (~60% of capacity share), is expected to be a key contributor to volume growth in coming years. This coupled with higher penetration in the eastern markets will give a tailwind to overall volume growth. Apart from higher penetration in the east, we expect the southern region to witness an upturn mainly led by higher government spending on low cost housing, irrigation and other infra projects. Considering this, coupled with capacity expansion we expect revenues to grow at a CAGR of 14.1% in FY18-20E. In addition, we expect the EBITDA margin to improve from FY18 onwards mainly led by stabilisation of power costs and improvement in freight costs. Considering the capacity expansion, better leverage (D/E: 0.3x) and cost efficiency, Ramco is currently trading at attractive valuations. Hence, we maintain our BUY rating on the stock with an SOTP based target price of | 930 (i.e. 15x FY20E EV/EBITDA). Ramco Cements (RAMCEM) | 795 Rating matrix Rating : Buy Target : | 930 Target Period : 9-12 months Potential Upside : 17% What’s changed? Target Price EPS FY19E EPS FY20E Rating Changed from | 822 to | 930 Changed from | 30.1 to | 29.1 Unchanged Changed from | 37.3 to | 35.0 Quarterly performance Q4FY18 Q4FY17 YoY (%) Q3FY18 QoQ (%) Revenue 1,254.8 1,026.2 22.3 1,056.4 18.8 EBITDA 272.2 270.8 0.5 235.3 15.7 EBITDA (%) 21.7 26.4 -470 bps 22.3 -58 bps PAT 108.6 134.5 -19.2 122.7 -11.5 Key financials FY17 FY18 FY19E FY20E Net Sales 3949.5 4406.4 4983.2 5734.0 EBITDA 1176.4 1099.4 1333.2 1587.2 Net Profit 649.3 555.7 684.5 825.1 EPS (|) 27.3 23.5 29.1 35.0 Valuation summary (x) FY17 FY18 FY19E FY20E P/E 29.0 33.7 27.3 22.6 Target P/E 34.1 39.6 32.0 26.5 EV/EBITDA 17.1 18.0 15.2 12.7 EV/Tonne (US$) 203.5 200.3 192.6 159.8 P/BV 5.0 4.6 4.1 3.6 RoNW (%) 17.4 13.7 15.2 16.1 RoCE (%) 12.7 10.4 11.5 12.2 Stock data Particulars Amount (| crore) Market Capitalisation 18855.7 Total Debt (FY18) 1113.2 Cash (FY18) 146.8 EV 19822.1 52 week H/L (|) 879/649 Equity Capital 23.6 Face Value (|) 1.0 Price performance 1M 3M 6M 12M ACC -12.7 -16.7 -22.0 -17.7 UltraTech Cement -3.3 -7.4 -9.6 -11.1 Ramco Cement 1.9 16.3 15.9 20.4 Research Analyst Rashesh Shah [email protected]Devang Bhatt [email protected]
Transcript
May 24, 2018
ICICI Securities Ltd | Retail Equity Research
Result Update
Healthy EBITDA/t despite input pressure…
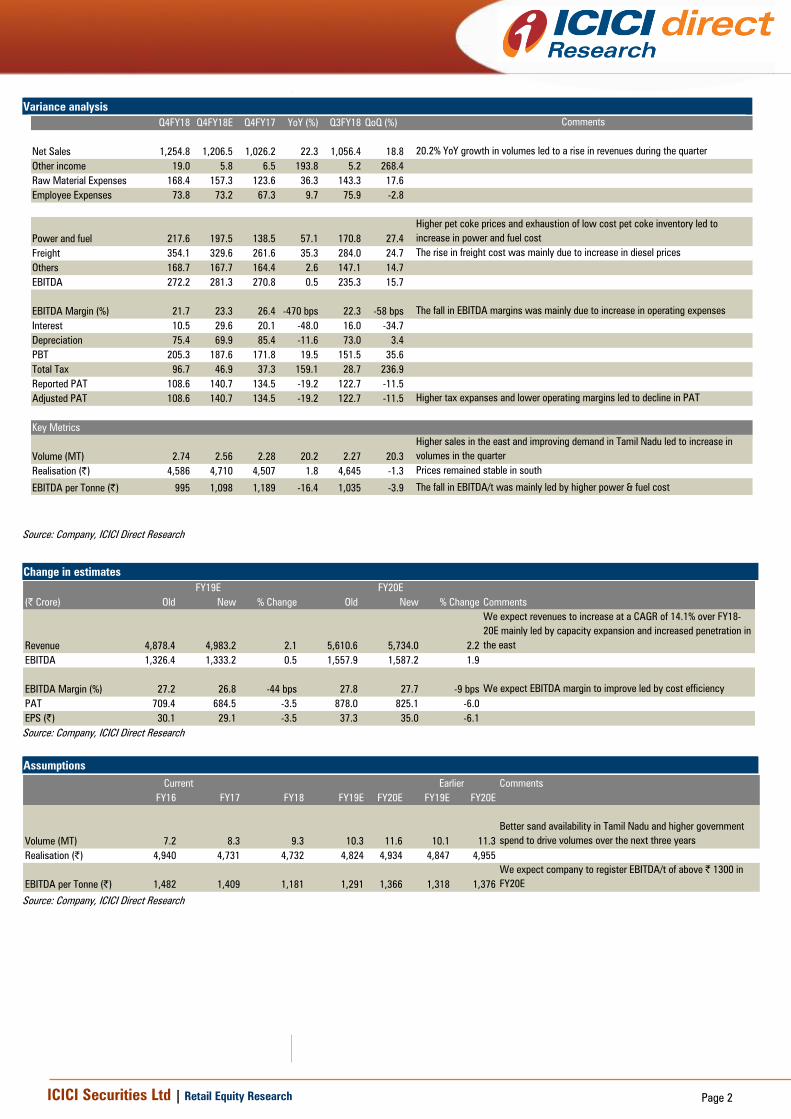
Ramco reported a mixed set of Q4FY18 numbers. Revenues increased
22.3% YoY to | 1,254.8 crore (vs. I-direct estimate of | 1,206.5 crore) led
by 20.2% YoY increase in volumes to 2.7 MT (vs. I-direct estimate of 2.6
MT) due to higher sales in eastern region. Further, realisation increased
1.8% YoY to | 4,586 (vs. I-direct estimate of | 4,710)
EBITDA/t declined 16.4% YoY to | 995/t (vs. I-direct estimate of
| 1,098/t) mainly led by 30.7% YoY increase in power cost/t and 12.6%
YoY increase in freight cost/t
The company has reduced its debt by | 310 crore and recommended a
dividend of | 3/share in FY18. The company plans to add 1.5 MT clinker
capacity at Andhra Pradesh for | 680 crore. This expansion is in addition
to 3 MT capacity expansion announced by the company previously
Operating markets key beneficiary of increased infra spends…
The pick-up in road tendering activity, improved sand availability in the
company’s operating markets and healthy demand from government’s low
cost housing programme are expected to be key drivers of cement demand.
As a result, we expect demand (15 MT) to outpace supply (7 MT) positively
impacting utilisation levels. Consequently, we expect Ramco’s operating
markets to register growth of 7-8% over the next three to four years.
Capacity expansion to further drive growth…
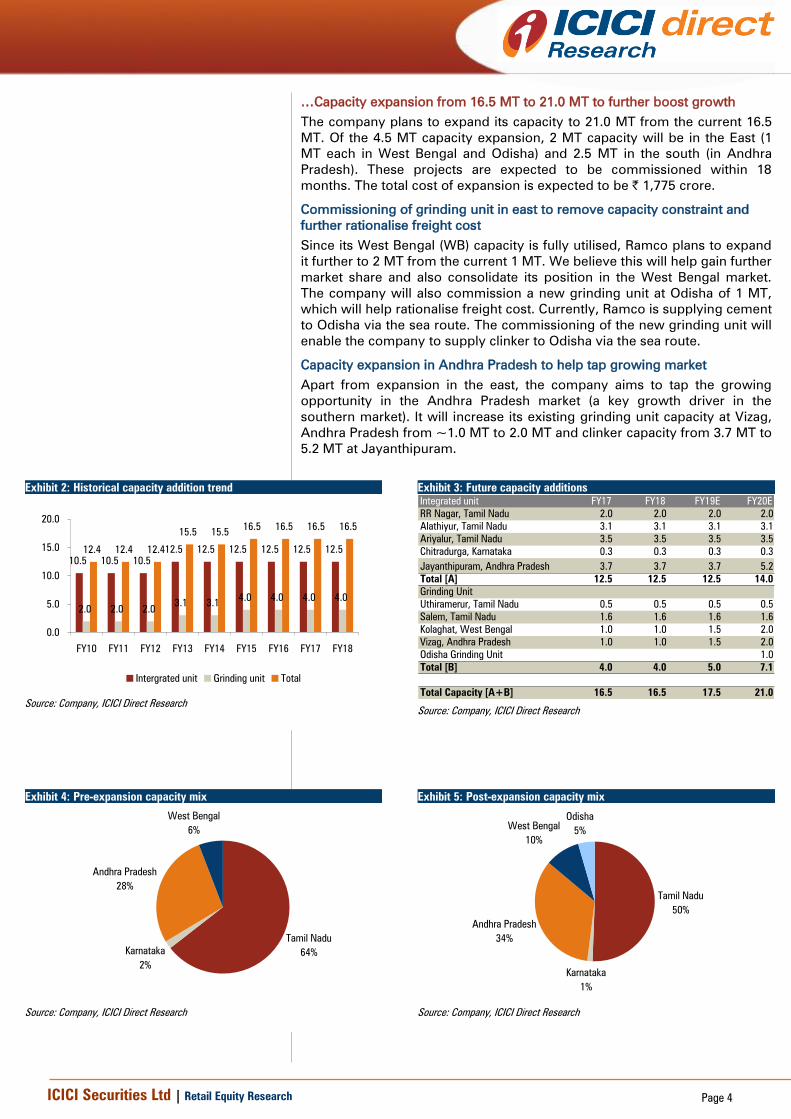
The company has over the years penetrated the West Bengal and Odisha
market. Ramco is planning to further penetrate in the east through capacity
expansion. Of the 4.5 MT capacity expansion planned by the company, 2 MT
will be in the east (1 MT each in West Bengal, Odisha) while 2.5 MT will be
set up in the south (in Andhra Pradesh). The capacity expansion in the east
will enable the company to remove capacity constraint and also increase its
market share. Apart from expansion in the east, the capacity expansion in AP
(south) will enable it to tap the growing opportunity of this market (that is
expected to grow at 14% CAGR in the next two to three years).
Healthy cash flow generation to keep balance sheet light!
During the downturn in the south in FY10-15, efficient management of cash
flows has enabled the company to reduce debt-equity from 1.6x to 1.0x in
FY15 and further to 0.3x in FY18. Going forward, we believe the company’s
robust cash flow generation (~| 2,500 crore in FY18-20E) will not only
enable to fund its capex through internal accruals but also maintain its debt-
We /I, Rashesh Shah CA, Darpan Thakkar MBA research analysts, authors and the names subscribed to this report, hereby certify that all of the views expressed in this research report accurately reflect our
personal views about any and all of the subject issuer(s) or securities. We also certify that no part of our compensation was, is, or will be directly or indirectly related to the specific recommendation(s) or
view(s) in this report. Analysts aren't registered as research analysts by FINRA and might not be an associated person of the ICICI Securities Inc.
Disclosures:
ICICI Securities Limited (ICICI Securities) and its affiliates are a full-service, integrated investment banking, investment management and brokerage and financing group. We along with affi liates are leading
underwriter of securities and participate in virtually all securities trading markets in India. We and our affiliates have investment banking and other business relationship with a significant percentage of
companies covered by our Investment Research Department. Our research professionals provide important input into our investment banking and other business selection processes. ICICI Securities
generally prohibits its analysts, persons reporting to analysts and their dependent family members from maintaining a financial interest in the securities or derivatives of any companies that the analysts
cover.
The information and opinions in this report have been prepared by ICICI Securities and are subject to change without any notice. The report and information contained herein is strictly confidential and
meant solely for the selected recipient and may not be altered in any way, transmitted to, copied or distributed, in part or in whole, to any other person or to the media or reproduced in any form, without
prior written consent of ICICI Securities. While we would endeavour to update the information herein on reasonable basis, ICICI Securities, its subsidiaries and associated companies, their directors and
employees (“ICICI Securities and affiliates”) are under no obligation to update or keep the information current. Also, there may be regulatory, compliance or other reasons that may prevent ICICI Securities
from doing so. Non-rated securities indicate that rating on a particular security has been suspended temporarily and such suspension is in compliance with applicable regulations and/or ICICI Securities
policies, in circumstances where ICICI Securities is acting in an advisory capacity to this company, or in certain other circumstances.
This report is based on information obtained from public sources and sources believed to be reliable, but no independent verification has been made nor is its accuracy or completeness guaranteed. This
report and information herein is solely for informational purpose and may not be used or considered as an offer document or solicitation of offer to buy or sell or subscribe for securities or other financial
instruments. Though disseminated to all the customers simultaneously, not all customers may receive this report at the same time. ICICI Securities will not treat recipients as customers by virtue of their
receiving this report. Nothing in this report constitutes investment, legal, accounting and tax advice or a representation that any investment or strategy is suitable or appropriate to your specific
circumstances. The securities discussed and opinions expressed in this report may not be suitable for all investors, who must make their own investment decisions, based on their own investment
objectives, financial positions and needs of specific recipient. This may not be taken in substitution for the exercise of independent judgment by any recipient. The recipient should independently evaluate
the investment risks. The value and return of investment may vary because of changes in interest rates, foreign exchange rates or any other reason. ICICI Securities and affiliates accept no liabilities for any
loss or damage of any kind arising out of the use of this report. Past performance is not necessarily a guide to future performance. Investors are advised to see Risk Disclosure Document to understand the
risks associated before investing in the securities markets. Actual results may differ materially from those set forth in projections. Forward-looking statements are not predictions and may be subject to
change without notice.
ICICI Securities and its affiliates might have managed or co-managed a public offering for the subject company in the preceding twelve months. ICICI Securities and affiliates might have received
compensation from the companies mentioned in the report during the period preceding twelve months from the date of this report for services in respect of public offerings, corporate finance, investment
banking or other advisory services in a merger or specific transaction. It is confirmed that Rashesh Shah CA, Darpan Thakkar MBA research analysts and the authors of this report have not received any
compensation from the companies mentioned in the report in the preceding twelve months. Our research professionals are paid in part based on the profitability of ICICI Securities, which include earnings
from Investment Banking and other business.
ICICI Securities or its subsidiaries collectively do not own 1% or more of the equity securities of the Company mentioned in the report as of the last day of the month preceding the publication of the
research report.
It is confirmed that Rashesh Shah CA, Darpan Thakkar MBA research analysts and the authors of this report or any of their family members does not serve as an officer, director or advisory board member
of the companies mentioned in the report.
ICICI Securities may have issued other reports that are inconsistent with and reach different conclusion from the information presented in this report. ICICI Securities and affiliates may act upon or make use
of information contained in the report prior to the publication thereof.
This report is not directed or intended for distribution to, or use by, any person or entity who is a citizen or resident of or located in any locality, state, country or other jurisdiction, where such distribution,
publication, availability or use would be contrary to law, regulation or which would subject ICICI Securities and affiliates to any registration or licensing requirement within such jurisdiction. The securities
described herein may or may not be eligible for sale in all jurisdictions or to certain category of investors. Persons in whose possession this document may come are required to inform themselves of and
to observe such restriction.
ICICI Securities Ltd | Retail Equity Research Page 12
ANALYST CERTIFICATION
We /I, Rashesh Shah, CA, and Devang Bhatt, PGDBM Research Analysts, authors and the names subscribed to this report, hereby certify that all of the views expressed in this research report accurately
reflect our views about the subject issuer(s) or securities. We also certify that no part of our compensation was, is, or will be directly or indirectly related to the specific recommendation(s) or view(s) in this
report.
Terms & conditions and other disclosures:
ICICI Securities Limited (ICICI Securities) is a full-service, integrated investment banking and is, inter alia, engaged in the business of stock brokering and distribution of financial products. ICICI Securities
Limited is a SEBI registered Research Analyst with SEBI Registration Number – INH000000990. ICICI Securities is a wholly-owned subsidiary of ICICI Bank which is India’s largest private sector bank and has
its various subsidiaries engaged in businesses of housing finance, asset management, life insurance, general insurance, venture capital fund management, etc. (“associates”), the details in respect of which
are available on www.icicibank.com.
ICICI Securities is one of the leading merchant bankers/ underwriters of securities and participate in virtually all securities trading markets in India. We and our associates might have investment banking
and other business relationship with a significant percentage of companies covered by our Investment Research Department. ICICI Securities generally prohibits its analysts, persons reporting to analysts
and their relatives from maintaining a financial interest in the securities or derivatives of any companies that the analysts cover.
The information and opinions in this report have been prepared by ICICI Securities and are subject to change without any notice. The report and information contained herein is strictly confidential and
meant solely for the selected recipient and may not be altered in any way, transmitted to, copied or distributed, in part or in whole, to any other person or to the media or reproduced in any form, without
prior written consent of ICICI Securities. While we would endeavour to update the information herein on a reasonable basis, ICICI Securities is under no obligation to update or keep the information current.
Also, there may be regulatory, compliance or other reasons that may prevent ICICI Securities from doing so. Non-rated securities indicate that rating on a particular security has been suspended
temporarily and such suspension is in compliance with applicable regulations and/or ICICI Securities policies, in circumstances where ICICI Securities might be acting in an advisory capacity to this
company, or in certain other circumstances.
This report is based on information obtained from public sources and sources believed to be reliable, but no independent verification has been made nor is its accuracy or completeness guaranteed. This
report and information herein is solely for informational purpose and shall not be used or considered as an offer document or solicitation of offer to buy or sell or subscribe for securities or other financial
instruments. Though disseminated to all the customers simultaneously, not all customers may receive this report at the same time. ICICI Securities will not treat recipients as customers by virtue of their
receiving this report. Nothing in this report constitutes investment, legal, accounting and tax advice or a representation that any investment or strategy is suitable or appropriate to your specific
circumstances. The securities discussed and opinions expressed in this report may not be suitable for all investors, who must make their own investment decisions, based on their own investment
objectives, financial positions and needs of specific recipient. This may not be taken in substitution for the exercise of independent judgment by any recipient. The recipient should independently evaluate
the investment risks. The value and return on investment may vary because of changes in interest rates, foreign exchange rates or any other reason. ICICI Securities accepts no liabilities whatsoever for any
loss or damage of any kind arising out of the use of this report. Past performance is not necessarily a guide to future performance. Investors are advised to see Risk Disclosure Document to understand the
risks associated before investing in the securities markets. Actual results may differ materially from those set forth in projections. Forward-looking statements are not predictions and may be subject to
change without notice.
ICICI Securities or its associates might have managed or co-managed public offering of securities for the subject company or might have been mandated by the subject company for any other assignment
in the past twelve months.
ICICI Securities or its associates might have received any compensation from the companies mentioned in the report during the period preceding twelve months from the date of this report for services in
respect of managing or co-managing public offerings, corporate finance, investment banking or merchant banking, brokerage services or other advisory service in a merger or specific transaction.
ICICI Securities or its associates might have received any compensation for products or services other than investment banking or merchant banking or brokerage services from the companies mentioned
in the report in the past twelve months.
ICICI Securities encourages independence in research report preparation and strives to minimize conflict in preparation of research report. ICICI Securities or its associates or its analysts did not receive any
compensation or other benefits from the companies mentioned in the report or third party in connection with preparation of the research report. Accordingly, neither ICICI Securities nor Research Analysts
and their relatives have any material conflict of interest at the time of publication of this report.
It is confirmed that Rashesh Shah, CA, and Devang Bhatt, PGDBM Research Analysts of this report have not received any compensation from the companies mentioned in the report in the preceding
twelve months.
Compensation of our Research Analysts is not based on any specific merchant banking, investment banking or brokerage service transactions.
ICICI Securities or its subsidiaries collectively or Research Analysts or their relatives do not own 1% or more of the equity securities of the Company mentioned in the report as of the last day of the month
preceding the publication of the research report.
Since associates of ICICI Securities are engaged in various financial service businesses, they might have financial interests or beneficial ownership in various companies including the subject
company/companies mentioned in this report.
It is confirmed that Rashesh Shah, CA, and Devang Bhatt, PGDBM Research Analysts do not serve as an officer, director or employee of the companies mentioned in the report.
ICICI Securities may have issued other reports that are inconsistent with and reach different conclusion from the information presented in this report.
Neither the Research Analysts nor ICICI Securities have been engaged in market making activity for the companies mentioned in the report.
We submit that no material disciplinary action has been taken on ICICI Securities by any Regulatory Authority impacting Equity Research Analysis activities.
This report is not directed or intended for distribution to, or use by, any person or entity who is a citizen or resident of or located in any locality, state, country or other jurisdiction, where such distribution,
publication, availability or use would be contrary to law, regulation or which would subject ICICI Securities and affiliates to any registration or licensing requirement within such jurisdiction. The securities
described herein may or may not be eligible for sale in all jurisdictions or to certain category of investors. Persons in whose possession this document may come are required to inform themselves of and