0 A RAND NOTE POTENTIAL FOR MILITARY RECRUITING FROM TWO-YEAR COLLEGES AND POSTSECONDARY VOCATIONAL SCHOOLS Richard J. Shavelson, Gus W. Haggstrom, John D. Winkler January 1983 N-1946-MRAL Prepared for Office of the Assistant Secretary of Defense/Manpower, Reserve Aifairs and Logistics DTIC E ELECTIE MAR 3119833 C:) LUJ Rand L-, publ;.-.r - -• •,' 2Iq ale: its Tbi~~~dOC uflb jjnit h eenapoe
Transcript
0
A RAND NOTE
POTENTIAL FOR MILITARY RECRUITING FROMTWO-YEAR COLLEGES AND POSTSECONDARYVOCATIONAL SCHOOLS
Richard J. Shavelson, Gus W. Haggstrom,John D. Winkler
January 1983
N-1946-MRAL
Prepared for Office of the Assistant Secretary of
Defense/Manpower, Reserve Aifairsand Logistics
DTICE ELECTIE
MAR 3119833
C:)
LUJ
Rand
L-, publ;.-.r --• •,' 2Iq ale: its
Tbi~~~dOC uflb jjnit h eenapoe
The research described in this report was sponsored by theOffice of the Assistant Secretary of Defense/Manpower, ReserveAffairs and Logistics under Contract No. MDA903-83-C-0047.
The Rand Publications Series: The Report is the principal publication doc-S umenting and transmitting Rand's major research findings and final research
_* sults. The Rand Note reports other outputs of sponsored research forgeneral distribution, Publications of The Rand Corporation do not ne'?es-sarily reflect the opinions or policies of the sponsors of Rand research.
P
Pulshdb TeRndCrorto
Rg..
L
[." .- -- - *- - ---
SEUIYCLX35IFICATION OF THIS PAGE (When DO*. EntoftI
4. TIT(LE (and Sublitle) III TYPE or REPORT a PERIOD COVERED
Potential. for Military Recruiting froia Two-Year InterimColleges and Postsecondary Vocational Schools _______________
4. PERFORMING *1111. REPORT NUMBER 1
7. AUTHOR(e) I. CONTRACT Oft GRANT NUMBERt(*)
Richard J. Shavelson, Gus W. Haggstrom,John D. Winkler MDA9O3-83-C-0047
S. PERFORMING ORGANIZATION NAME AND ADDRESS I.PROGRAM ELEtME, TROJECT, TASKThe Raind Corporation ASIOKN UBR
r 1700 Main StreetSanta Monica, CA. 90406
11. CONTROLLING OFFICE NAME AND ADDRESS It. REPORT DATE
Assistant Secretary of Defense January 1983MnoeReserve Affairs & Logistics 13. NUMBER OF PAGES
Wasn, MOIOIGAEC NM DRSI different from Controlling Office) 1:. ~SECURITY CLASS. (of this report)
[.Approved for Public Release; Distribution Unlimited
17. DISTRIBUTION STATEMENT (at the abstract entered In Block 20, It different boam Reoert)
No Restrictions
IS. SUPPL.EMENTARY NOTES
IS. KEY WORDS (Continun onl reverse aid* ii necessary and identify by block number)
RecruitingMilitary PersonnelTechnical Schools
20. ABSTRACT (Continue onre ,verse side. It necessary and Identify by block number) '
See Reverse Side
DD ~ 1473UNCLASSIFIEDSEIrURITY CLASSIFICATION OF THIS PAGE (When Date Entered)
-' - -' .W IM W W
- UNCLASSIFIEDTVcuI? CLASSIFICATION Of THIS PA@K(Wh, D., 3.,.,,
-1?his Vote is a proqress report on I studyof the recruiting potential in the tvo-yearcolleqe and postsecondary vocational schoolmarket--the institutions and theirstudents. Its purpose is to ascertainvhether (Atthese institutions miqhtprovide fruitful recruiting environments;
-b• most of tile students in then meetenlistment standards' Cd?-'the market can bepenetrated' -W--previous recruits haveproven their value to the military, and je)additiotal research is needed to developsuccessful recruitinq policies. Section IIreviews the literature as it bears on theinst.itutions and students, thepenetrability of the marketplace, theutility of recruits from it, and therecruitinq environment. Section III givesthe results of the analyses of existinqdata sets as they kear on accession policyissues. The final section presents therecommendations for the next steps indevelopinq accession policies for thismarket...
;-4
UNCLASSIFIED
SECURITY CLASSIFICATION OF THIS PAIR(WMIUM Data iXWOPe0
Fi
A RAND NOTE
POTENTIAL FOR MILITARY RECRUITING FROMTWO-YEAR COLLEGES AND POSTSECONDARYVOCATIONAL SCHOOLS
Richard J. Shavelson, Gus W. Haggatrom,John D. Winkler
January 1983
N-1946-MRAL
Prepared for Office of the Assistant Secretary ofDefense/Manpower, Reserve Affairsand Logistics
RandSANTA MONICA. CA. 50406
AFPEOVED FOE PUBLIC IELEASEj DISTRIBUTION UNLIMITED
;11.L iii
PREFACE
This Note presents the findings of the Rand research project
"E~xploratory Studies of the Recruiting Market in Two-Year Postsecondary
Institutions." Over the next 10 years, the services' requirements forI "high-quality" recruits are expected to increase, while the size of the
K manpower pool is expected to decrease. To meet accession needs, as yet
untapped recruiting markets need to be explored. The goal of this
project is to evaluate the recruiting potential of one such market--
the two-year postsecondary institutions. This Note is a progress report
on that evaluation. It was prepared as part of Rand's Manpower,
Mobilization, and Readiness Program, sponsored by the Office of the
Assistant Secretary of Defense (Manpower, Reserve Affairs, and
Logistics).
The authors wish to thank David Boesel, Arthur M. Cotten, and Anita
Lancaster for their critical reviews of this document. The authors are
responsible, nevertheless, for any errors of commission or omission.
0A*
S ~ '5 1 1
-V
A major goal of military accession policy is to recruit
high-quality manpower into the All Volunteer Force. Although accession
goals are currently being surpassed, this probal'ly will not continue far
into tl.e 1980s. With economic recovery and decreasing unemployment,
competition between the military and the civilian sector for
high-quality manpower will increase over the next 10 years as job
complexity increases with advancing weapon sophistication, enlistment ]standards are raised, and the pool of college age youth deireases in
size.
One way to increase the number of high-quality accessions is to
recruit from as yet untapped markets that contain large numbers of
potential high-quality recruits. One such market for accessions into
either the active or reserve forces includes postsecondary educational
institutions such as two-year colleges (junior and community colleges
and vocational training colleges) and noncollegiate institutions (adult
education centers, area vocational schools, private nonprofit
occupational institutes, and specialized proprietary schools).
The purpose of this study, in broad terms, is to examine this
postsecondary education market--the institutions and their students--
to ascertain whether (a) there are sufficient numbers of potential
recruits in th se institutions for recruiting to prove fruitful, (b)
most of the students in the market meet enlistment standards, (c) the
market can be penetrated, (d) previous recruits have proven their value
to the military, and (e) additional research is needed to develop
successful recruiting policies.
IPREVIOUSPAGELýIS BLANIK
-- 0
To meet these goals, we surveyed the literature on postsecondary
institutions and other research pertinent to recruiting in this market.
The more important of the two studies that directly address recruitmet
strategies is reviewed. In addition, we examined Defense Manpower Data
Center (DlDC) accessions data for 1981, as well as data from three large-
scale surveys of youth: The National Longitudina' urvey of the lHgh
School Class of 1972 (Levinsohn at al., 1978), Hij, School and Beyond
(Pen& at al., 1981), and the 1979 DoD Survey of Personnel Entering
Military Service (Doering et al., 1980).
There is no question that the postsecondary institutions under
study contain large numbers of potential high-quality recruits, but the
exact sizes of the subpopulations of primary interest are hard to pin
down. Ever, the estimates of total enrollments in the two-year colleges
vary from one source to another. The National Center for Education
Statistics (NCES) reported that 4.5 million students were enrolled in
these colleges in the fall of 1980, while the Bureau of the Census
estimated the total enrollment in October 1980 to be 3.1 million. In
any case, these figures grossly exaggerate the pool of potential
recruits because the majority of the students are either not eligible to
enlist or have career and family ccmmitments that effectively preclude
military service as an option. If the Bureau of the Census enrollment
figure is used as a base, there were appro:imately 1.3 million males in
the two-year colleges in October 1980, of whom approximately 720,000
were 21 or younger. Licluding a rough estimate of the number of
"military eligible males age 22 and above, we estimate that in 1980 there
-
---- -
• , o ~v i i -,
were something like one million male students in the two-year colleges
who fell within the targeted age range for nonprior service accession.
Although recruiting policies are ordinarily targeted to individuals
within the 18 to 21 ag group, older students should also be considered
for both the active forces and the reserves. Furthermore, students with
prior military service should also os considered in accession policy.
perhaps as important sources of manpa.er for the reserves. In FY81,
370,000 veterans attended two-year colleges under the Post-Korean
Educational Assistance Program and another 120,000 &ttanded vocational
and technical schools. These numbers suggest that two-year colleges and
vocational schools might serve as locales for recruiting prior
servicemen.
With respect to meeting enlistment standards--age, ability, single
without dependents, good morals, and physical health--recruiting fromI two-year colleges and postsecondary vocational schools promises to raise
the overall quality of the enlisted force. Two-year college students
are above average in aptitude, and over 90 percent of those between the
ages of 18 and 21 are single and report being in good physical health.
Thhv two-year college and postsecondary vocational school markets
have not been substantially penetrated to date. For example, less then
Spercent of all nonprior service accessious in 1981 had one or two
years of college. Less than 1 percent of the freshmen in the two-year
college class of 1981 indicated that they were considering the military
as a career option. Nevertheless, the market contains many students
whose educational and occupational aspirations are unstable, and their
changing aspirations are mirrored by their behavior. Over 60 percent of
the students are enrolled part-time; transfers into and out of college
S . ~viii -
art common. Instability in and mobility am" academic and vocational
tracks and the labor force characteraiz the behavior of many of these
students. Furthermore, many two-year college students have educational
and occupational plans that will not be realized. For example,
Approximately 7S percent of entering freshmen say they intend to
transfer to a four-year college or university; the transfer rates from
two- to four-year uolleges are, in fact, quite low--around 6 percent.
The career plans and behavior, then, of many students in two-year
colleges and postsecondary vocational schools are in a state of ,flux,
more sott or example, than high school graduates entering either four-
year colleges or universities. These students' changing educational and
career goals lead us to believe that, with the right recruitment
incentives and strategies, this market might be penetrated.
Recruits with some college are useful to the military if they
successfully complete training in a minimum amount of time, fill
critical occupational specialties, perform weli on the job, and are not
subjects of disciplinary actions. For recruits who entered mAlitary
service during FY78, enlistees with one or more years of college had
lower attrition rates than those with less education.
Additional research is required to determine what recruitment
strategies would be most fruitful. To this end, we identify four types
of studies: (1) analyses of existing data sets, (2) an examination of
effective uses of recruiters in the postsecondary market, (3) a market
survey of alternative recruiting packages and communication channels,
and (4) a targeted recruiting experiment in the postsecondary education
market.
-
"SUASR........................................ .. xiii
- . IN'TRODUCTIOt4 I
"The Nature of Taret Posecondary Institutions ..
SiTL and Control of Two-Year Collees ................. 8Locations and Dispersion. ............... ........... 10
Growth in Number of Institutions and Enrollments ........ 1iCurricular Functions ........... ....... .%... 16Financial Stability ..................................... 19Characteristics of Students in Two-Year Colleges ....... 21Numbers of Male Students between 18 and 21 Years ....... 21Profile of Two-Year College Students ................... 23Penetrability of the Market ............................. 27Utility of Enlistees from Two-Year Colleges ............. 39Recruiting Environment in Two-Year Colleges ............. 39
III, ANALYSIS OF THE MARKET PLACE: NEW DATA ................... 42Profile of Students in Two-Year Colleges:Methodological Considerations .......................... 43
Profile of Two-Year College Students' Characteristics 48Penestrabillity of the Market ........................... 60Utility of Recruits with Some College ................... 66Cost Considerations Associated with Two-Year College
IV. SUMMIARY AND RECOMMENDATIONS FOR FURTHER STUDIES ........... 73Analyses of Existing Data Sets .......................... 74Recruiters in the Postsecondary Marletplace ............. 80Survey of the Harket .................................... 81Recruiting Experiment ................................... 83
1. larket Density in Noncollegiate Postsecondary and Two-yearCollngiate Institutions, 1979..............................7
2. Distribution of Enrollments in Private and Public Two-yearColleges, 1979 ........ .... ... .... .. . .. 10
3. States with Largest Numbers of Public Two-year Colleges and-Enrollments, 1979 .................. 12
-4. Characteristics of College Freshmen and Individuals in'Other POstsecondary Tracks,, Fall 1972 .................... 25
-5. " Characteristics of Freshmen in Two-year Colleges, 1981 ...... 27
6. Characteristics of a Sample of Two-Year College Male Stu-L dents, Spring 1975 ......................................... 30
7. Two-year College Students' Responses to a Question onEnlistment Propensity ...................................... 36
8a. Comparison of Attributes of NLS Participants Who Planned toUndertake Certain Postsecondary Activities With Those WhoDid Undertake Those Activities: Means and StandardizedDifferences in Means for Males ............................. 44
8b. Comparison'of Attributes of NLS Participants Who Planned toUndertake Certain Postsecondary Activities With Those WhoDid Undertake Those Activities: Means and StandardizedDifferences in Means for Females ............................ 45
9a. Attribute Profile of High School Seniors Planning to Under-take Certain Postsecondary Activities (1980): Means forMales ..................................................... 50
9b. Attribute Profile of High School Seniors Planning to Under-take Certain Postsecondary Activities (1980): Means forFema les ................................................... 51
10a. Attribute Profile of High School Seniors Planning to EnterTwo-year Colleges or Vocational/Technical Schools (1980):Means for Males ........................................... 52
10b. Attribute Profile of High School Seniors Planning to EnterTwo-year Colleges or Vocational/Technical Schools (1980):Means for Females ......................................... 53
it. Mean AFQT Scores for Male and Female Accessions by Educa-tional Attainment, 198] ................................... 55
PREVIOUS PAGEIS-LANK
.. 9 &~.W'~ k~ ~ "'6 * .. . ... 'J
-xiv-a
12. Percentages of Enlistments in Mental Categories I-liA byEducational Attainment and Sex, 1981 ........................ 56
13. NPS Accessions in the Armed Forces by Educational Attainment,Service, and Sex: FY81 .................................... 62
14a. Aspirations of High School Seniors Planning to UndertakeCertain Postsecondary Activities (1980W: Means forMales ..................................................... 63
* 14b. Aspirations of Nigh School Seniors Planning to Undertake.Certain Postsecondary Activities (1980): Means forFemales ................................ 63
S,15a. Aspirations of High School Seniors Planning to Enter Two-year Colleges or Vocational/Technical Schools (1980):*.Means for Males ........................................... 64.
* 15b. Aspirations of High School Seniors Planning to Enter Two-year Colleges or Vocational/Technical Schools (1980):Means for Females ......................................... 64
16. Attrition Rates Among Nonprior Service Enlistees Who EnteredService During FY78 by Educational Attainment, MentalCategory, and Sex ......................................... 67
17. Entry Level Pay Grades by Sex and Educational Attainment .... 70
18. Marital Status and Number of Dependents by Sex and Educa-tional Attainment ......................................... 71
A.la. Comparison of Attributes of NLS Participants Who Planned toUndertake Certaia Postsecondary Activities With Those WhoDid Undertake Those Activities: Standard Deviations forMales ..................................................... 86
A.lb. Comparison of Attributes of NLS Participanrs Who Planned toUndertake Certain Postsecondary Activities With Those WhoDid Undertake Those Activities: Standard Deviations forFema les ................................................... 8 7
A.2a. Attribute Profile of High School Seniors Planning to Under-take Certain Postsecondary Activities (1980): StandardDeviatir-is for Males ...................................... 88
A.2b. Attribute Profile of High School Seniors Planning to Under-take Certain Postsecondary Activities (1980): StandardDeviations for Females .................................... 89
• " 22-I
* - --. . - - - S .S- -.-.
J•,. _ . -
A.3a. Attribute Profile of High School Seniors Planning to EnterTwo-year Colleges or Vocational/Technical Schocls.(1980):Standard Deviations for Males ........................... , 90
A.3b. Attribute Profile of High School Seniors Planning to EnterTwo-year Colleges or Vocational/Technical Schools (1980):Standard Deviations for Females. ............ 91
A.4. Mean AFQT Scoras by Educational Attainment, Sex, and Branchesof Service, 1981 ........................................... 92
A.5. Percentages of.Enlistments in Mental Categories I-liA byEducational Attainment, Sex, and Branch of Service .......... 93
A.6a. Aspirations of High School Seniors Planning to UndertakeCertain Postsecondary Activities (1980): StandardDeviations for Males ...................................... 94
A.6b. Aspirations of High School Seniors Planning to UndertakeCertain Postsecondary Activities (1980): StandardDeviations for Females .................................... 94
A.7a. Aspirations of High School Seniors Planning to EnterTwo-year Colleges or Vocational/Technical Schools (1980):Standard Deviations for Males ............................. 95
A.7b. Aspirations of High School Seniors Planning to EnterTwo-year Colleges or Vocational/Technical Schools (1980):Standard'Deviations for Females ............................ 95
.,. , , , . ,.. ... .
,. .. -.. -- - .- q .
I. INTRODUCTION
A major goal of military accession policy is to recruit high
quality manpower into the All Volunteer Force. Although accession goals
are currently being surpassed, there are good reasons to believe that
K this will not continue far into the 1980s unless recruiting and
compensation strategies are changed. With economic recovery and
decreasing unemployment, postsecondary education and the civilian labor
force compete with the military for high-quality manpower. This
competition is expected to increase over the next 10 years as job
complexity increases with advancing weapon sophistication, enlistment
standards are raised, and the pool of high-quality youth decreases (see
Fig. 1).
As an indication of the military's need to expand its recruiting
efforts to mneet accession goals, consider the following. ln FY81) there
were. approximately 320,000 nonprior service (NPS) enlisted accessions--
p 280,000 men and 40,000 women. Eighty percent of the male enlistees and
K 93 percent of the women had high school diplomas. The 225,000 male
enlistees in 1981 with high school diplomas amounted to 15.2 percent of
the total number of male high school graduates in the United States
during that year. According to projections by the National Center for
Education Statistics, the number of male high school graduates will
decline from 1.5 million in 1981 to 1.2 million in 1990. If the
military's recruiting requirements during the rest of the 1980s remain
stable (as the dotted lines in Fig. 1 indicate), the number of male
enlistees with high school diplomas as a percentage of the number of
r-
2-
2.OM
1.0M
Toootl D~oO cesw
Enlist..s with high school diplom.
1975 1960 196 1960
Fig. 1 - Male cohort sizes and accession needs (1973-1990)
male high school graduates would rise from 15.2 percent in 1981 to
18.8 percent in 1990, implying that the military will have to increase
its "take" of the postsecondary male youth cohort by about one-fourth.
If, in addition, efforts to increase the percentage of high school
graduates among new recruits are to be realized, the military will have
to recruit approximately 20 percent of all male high school graduates in
the late 1980s.
i-J
3-
r One way to increase high-quality accessions is to recruit from as
yet untapped markets that contain large numbers of potential
high-quality recruits. One such market for accessions into either the
active or reserve force is postsecondary educational institutions such
as two-year colleges (e.g., junior and coummunity colleges and vocational
training colleges) and noncollegiate institutions (adult education
centers, area vocational schools, private nonprofit occupational
institutes, and specialized proprietary schools).
A cursory analysis of this marketplace suggests considerable
K potential. There are over 4 million students enrolled in two-year
colleges. About half fall within the prime recruitinig ages (18 to 21
years) and virtually all of them have high school diplomas. Moreover,
most students in postsecondary institutions have strong vocational
interests and are preparing for specific -iccupations, many of which
overlap to some degree with military accession needs.
The purpose of this report is to examine this postsecondary market- -
the institutions and their students--to ascertain whether (a) these
institutions might provide fruitful recruiting environments, (b) most of
the students in them meet enlistment standards, (c) the market can be
penetrated, (d) previous recruits have proven their value to the
military, and (e) additional research is needed to develop successful
recruiting policies.
To meet these goals, we examined the literature on higher education
and on military recruiting from this market. Only two studies of the
latter type were found. In addition, we examined Defense Manpower Data
CentEr (DMDC) accessions data for 1981, as well as. data from three
L4
4.
large-scale surveys of youth: The National Longitudinal Survey of the
High School Class of 1972 (Levinsohn at al., 1978), High School and beyond
(Peang at al., 1981), and the 1979 DoD Survey of Personnel Entering
Military Service (Duering at al.., 1980). The next section of this Note
reviews the literature as it bears on the institutions and students, the
penetrability of the marketplace, the utility of recruits from it, and
the recruiting environment. Section III gives the results of our
analyses of existing data sets as they bear on-accession policy issues.
The final section presents our recommendations f$or the next steps in
developing accession policies for this market.
II. ANALYSIS OF THE MARKITPLACE: LITERATURE REVIEW
In considering the possibility of recruiting !n two-year colleges
and postsecondary vocational institutions, the first question is whether
there are sufficient numbers of potential enlistees to make a concerted
recruiting effort worthwhile. If the answer is affirmative, the next
question is whether these potential recruits would meet current and
projected accession requirements and whether most of them have the
char-cteristics that would make them prime targets for recruiting: high
school graduates, above average in ability, between the ages of 18 and
21 years, single or married without dependents, and physically and
morally acceptable. An affirmative answer leads to a series of
questions: Is the markez penetrable? Are recruits from this market
useful to the military? For example, do they fill critical occupational
specialties? Are they readily trainable? Are they productive? And
finally, can recruitin& ;)e conducted successfully within these
postsecondary institutions?
THE NATURE OF TARGET POSTSECONDARY INSTITUTIONS
This study focuses on postsecondary institutions that offer degrees
and certificates below the bachelor's degree. These institutions can be
classified as either collegiate or noncollegiste. The latter include
publicly supported institutions such as adult education centers and area
Different missions and objectives in two-year colleges have led to
a broad spectrum of curricular functions. The original purpose of the
"junior college" was to provide academic instruction in preparation for
transfer to a four-year college or university. For those two-year
colleges known as "technical institutes," the primary orientation was
frequently vocational training in preparation for a career. The term
"community college" was coined to encompass two-year colleges with
academic or vocational (or both) functions as well as to cover
" 17 -
additional, newer programs including continuing education, remedial
coursework, and community service. Community colleges with diverse
programs reflected an effort to expand the constituency of two-year
colleges to include part-time and older students and those who could not
afford a traditional college education.
Academic preparation and occupational training are still the most
heavily emphasized curricular functions of two-year colleges, but the
emphasis on these curricula has shifted from acodemic to vocational.
This shift is reflected in the number of associate degrees awarded by
two-year colleges (Dearman and Plisko, 1981; Cohen and Brawer, 1982, and
shown in Fig. 7). Of all associate degrees awarded in the past decade,
degrees in arts and sciences or general academic programs, which
typically represent transfer degrees, have declined by 20 percent while
degrees in occupational fields have increased by this amount. Most of
the vocational degrees are awarded to students in health science (e.g.,
nursing, dental hygiene), data processing, and industrial arts programs.
Many two-year college students do not complete associate degrees in
either academic or vocational fields. For example, the attrition from
two-year colleges over a two-year period (1972-1974) was 39.8 percent in
public institituons and 32.2 in private institutions; the attrition in
four-year schools was 28.5 percent and 22.3 percent for public and
private institutions, respectively (Kolstad, 1977). Kolstad also
reported that attrition systematically decreased in both two- and four-
year institutions over the 22-year period from 1953 to 1972. Of the two-
year college students who withdrew in 1973, 46 percent said th:y planned
to reenter college within a year.
-1.8-
4001
* 400
:i0,j.00
100
0 I I I I , I I I I1971 1972 1973 1974 1976 1976 1977 1978 1979 Iwo
SOURCE: Cohen mnd rMmor (1t12I
Fig. 7 - Numbers of amociate dpeso. awdrd 1970-1960
Kolstad reported numerous reasons for attrition. Although many
people believe this attri.ion is due to the inability of two-year
college students to do college-level work, less than 16 percent of them
(<25 percent of the four-year college students) cited difficulty of
studies as a reason for leaving. Rather, the most frequently cited
reason was working full-time (49.5 percent in two-year colleges and 39.4
percent in four-year schools), and then working part-time jobs (26.1 and
17.2, respectively). Attrition is also related to socioeconomic status.
Kolstad reported that, in the two-year colleges, attrition was 46.6
percent in the lowest socioeconomic status quartile, 40.4 percent in the
-19-
Eliddle two quartiles combined, and 33 percent in the highest quartile.
The analogous figures for the four-year institutions were 33.1, 27.0,
F, and 17.9.
An extremely important activity conducted within two-year colleges,
one not typically considered a curricular function, is counseling and
career guidance. The importance of this service is related to the fact
that many students in two-year colleges fail to complete their programs
of study and/or do not transfer to four-year colleges or universities.
This has led some to say that two-year colleges serve a "cooling-out"
function in which unrealistic students' aspirations are brought in line
with reality (Clark, 1960, 1980). Some students may find themselves
shifting from an academic to an occupational orientation; others may
find themselves leaving the college for newly attractive employment
options.
FINANCIAL STABILITY
Public two-year colleges receive support from a variety of sources,
I including local, state, and federal funds, tuition and private donations
(Breneman and Nelson, 1981; Cohen and Brawer, 1982). The relative
proportion of funds received from these souirces has been changing.
4 Today, state aid is the main source of income, and the percentage of
income derived from state aid has been increasing in recent years. In
1980, state aid provided approximately 60 percent of the income for two-
year colleges (see Fig. 8). Tuition and fees have accounted for a
fairly constant source of income over the last 20 years; in 1980, they
accounted for an estimated 15 percent of total income. Federal aid,
6 which has been a minor source of income for two-year colleges, accounted
for 5 percent of total income in 1980. Local aid has decreased 75
r4e
°20-
r
7
Tuitklo
SOURCE: Cu aW Eqrwgr (1962).
Fig. 8 - Sources of income for public two-year colleges
percent over the past 10 years and accounted for about 11 percent
of the total income in 1980. The remaining 6 percent of total income in
1980 came from private gifts, auxiliary services, and the like (Cohen
and Brawer, 1982).
In this era of retrenchment, with state revenues especially
vulnerable, what is the outlook for public two-year colleges? Given
their well-established position in the nation's educational system and
their ability to undertake new roles, we believe that they will continue
to serve a major portion of the postsecondary education clientele, even
though the rapid growth of these institutions and their enrollments has
ended. Two-year colleges will be hard-pressed financially but they have
-21
proved themselves to be extraordinarily adaptive in the past, and there
are a number of ways that they --an adapt to threats to their primary
funding bases, possibly including developing new, mutually beneficial
relationships with the military. For some scenarios of possible
developments, see Dreneman and Nelson (1981).
CHARACTERISTICS OF STUDENTS IN INO-YEAR COLLEGES
From thoir institutional characteristics and overall enrollments,
the two-year colleges appear to provide a very favorable environment for
recruiting, However, a closer look at the students themselves may
reveal obstacles to recruiting. Maony students might not meet enlistment
standards, or they may be unwilling to consider the military as an
occupational alternative. In developing accession policies for the two-
year college market, the first question is how many, of the over 4
million enrollees, meet enlistment criteria. If there are adequate
niumbers a! potential recruits, the next step is to profile the
characteristics of the students. The question of whether these students
can be attracted into the military is discussed later in this section.
K1 NUMBERS OF MALE STUDENTS BET"WEEN 18 AND 21 YEARS
Unfortunately, estimates of the number of males (and females)
fdlling in the 18 to 21 age range vary from one data base to another.
NCES, using data on fall enrollments supplied by two-year colleges,
estimates that about 4.5 million students were enrolied in the fall of
1980. The Bureau of the Census, using a survey of students in October
1980, estimates this number to be about 3.1 million. The 4.5 million
figure is probably an overestimate since many students enrolled at the
beginning of the fall term do not complete the term. However, 3.1
-22-
million is probably an underestimate because of the difficulty of
adequately counting students, particularly the transient, older, and
part-time students who constitute a sizable segment of the two-year
college population.
The DoD considers males falling bet-een the ages of 18 and 21 years
as the prime population for nonprior service (NPS) accessions. In spite
of the caveat about the variability of estimates from one data base to
another, we bring the best data available (U.S. Bureau of the Census,
1980) to bear on the question of whether there are sufficient numbers of
students in the 18 and 21 age group to warrant a recruiting effort in
two-year colleges. The reader should keep in mind that the following
numbers are probably underestimates of the tine values. Of the
esiatd3.1 mlinstudents enrolled in the fall of 1980,
approximately 1.3 million (42 percent) were males and, of these males,
approximately 721,000 (55 percent) fall within the targeted age range
(Fig. 9). Finally, 79 percent of the men in the targeted age range were
full-time students. Recruiting policies for the two-year colleges need
not, of course, be targeted to individuals within the 18 to 21 age
group. Older students falling within acceptable age ranges for the
various branches of the armed forces should also be considered for both
the active forces and for the reserves. Including a rough estimate of
the number of military eligible males of age 22 and above gives a figure
* of about one million male students in two-year colleges in 1980 who fell
within the .ý.argeted age range for NPS accessions, somewhat less than 80
percent of whom were enrolled full time.
* Students with prior military service should also be considered in
accession policy, perhaps as important sources of manpower for the
- 23
WNMm
Mem
570
21 en4
Full-Utwe Pst-ms" Fu*N-.tim Pt4t-timw$OMCGE. ekmma of fth Ovan
Fig. 9 - Breakdown of two-year coflep enrollments in Fall 190 (thousands)
reserves. Indeed, in FY81, 370,000 veterans attended two-year
colleges under the Post-Korean Educational A,.sistance Program, and
another 120,000 attended vocational and technical schools (Veterans
Administration, 1982). These numbers suggest that two-year colleges and
vocational schools might serve as locales for recruiting prior
servicemen.
PROFILE OF TWO-YEAR COLLEGE STUDENTS
Thi.! literatuie on the characteristics of students in two-year
colleges is, unfortunately, not sufficiently detailed for our purposes.
What we would like to have, for examaple, are recent data on male and
female students within targeted age ranges enrolled for degrees in each
F---
- - - - - - - - - -
- - -- ***'*-
-24-
of the academic and occupational curricula. These data would include
large numbers of students and their aptitude test scoxes, high school
grade-point averages, college grade point averages, aspirations,
socioeconomic status, and so on. At best, the available statistics
provide information on total enrollments by enrollment status (e.g,
part-time/full-time, degree/nondegree students) ind by demographic
characteristics (e.g., age, gender, and ethnic/racial groups). One
purpose of the analyses described in the next section is to fill some of
this information gap.
There are few relevant data available on the population of two-
year college students beyond the overall enrollments by sex and part-
time/full-time status.,lJ The aoaan age of the two-year college students
is estimated at 28 years and the modal age at 19 years. The age
distribution is positively skewed because community colleges, with their
broad curricula, serve older people who have enrolled in one or another
course out of personal interest, certification requirements, and so on.
Considerably more is known about the characteristics of first-
time freshmen in the two-year colleges (Astin at al., 1981; Kanouse et
al., 1980). Kanouse et al. (1980) provide data on two-year college
freshmen in the fall of 1972. Of particular importance are the aptitude
scores, since these are the only objective nationally representative
data available on two-year college students in the past 10 years. The
mean aptitude scores of male and female students fall between those of
four-year college freshmen and the mean scores of individuals in the
work force and other occupational tracks, including the military (see
Table 4). Similarly, the high school class rank of the two-year college
[1] We focus on nationally representative data because of the greatvariability in the representativeness and quality of data from state andcollege level reports.
.25-
Table 4
CHARACTERISTICS OF .COLLEGE.FRESHMEN AND INDIVIDUALSIN OTHER POSTSECONDARY TRACKS, FALL 19-72'
College Students Labor Force"Variable Four-year Two-year Voc/Tech' Civilian, Military
CHARACTERISTICS OF FRESHMEka IN TWO-YEAR COLLEGES, 1981
Percent of Tvo-YearSManpower Needs College Students,Males Females
High schoolGraduates 98.0 97.9GED 1.3 1.3
Above average ability> B average in high school 47.5 65.1In top 40% of class 44.8 52.6
Single 99.1 98.3
Prime age (18-21 years) 94.8 92.8
No disability 93.5 93.7
SOURCE: Astin et al. (1981).aFull-time freshmen with no prior college experience
academic programs (e.g., humanities, sciences) and occupational
programs (e.g., health, computer science). Moreover, the most detailed
data, those on freshmen (Astin et al., 1981), are based on self-reports
rather than on objective records. Additional analyses of current data
on student characteristics are needed to provide an accurate profile of
this recruiting market.
PENETRABILITY OF THE MARKET
In examining accession policies for the two-year college
marketplace, ascertaining that the market contains large numbers of
persons who meet accession needs is insufficient. Three further
questions must be answered: (1) Can the market be penetrated? (2) Are
233
recruits from this market useful to the military (trainable, able to
fill critical occupational specialties, and perform..well)? And (3) do
these institutions provide an environment conducive to recruiting? We
first consider penetrability arid then discuss the other two topics in
the remainder of this section.
By penetrability we mean the market's potential for yielding higher
enlistment rates unider alternative recruitment strategies.. We assume
that most students consider their occupational choices rationally and
ask whether tCoe military is among their alternatives. We also recognize
that occupational choice de pends on positive (e.g., monetary) and
negative (e.g., unemployment in the civilian labor market) incentives
which are, themselves, uncertain events in the future. And finally, we
believe that, in choosing a particular occupation, the choice depends on
whether the occupation is consistent with students' attitudes and goals
and whether the oct_.tion is sufficiently valued to override costs
asscite wih hosin i. o enet rate tetwo-year cleemarket,
DoD can prov ide (a) information leading more students to consider
miliaryservce s apossible career path; (b) incentives (e.g., pay,
travl, ccuatinaltraining) that make military service attractive to
som ofthee sudets;and (c) educational benefits to assist students
in meeting other career and educational goals.
I. Unfortunately, data on the penetrability of the two-year college
I 1A market are sparse. There are no pliblished studies that report attempts
by the military to directly recruit from this marketplace (see Sec. III
for a recent, as yet unpublished study). And only two studies (Fisher
et al., 1975; Korman et al., 1973) have indirectly examined the
military's ability to penetrate the market by asking students on
':7
-29-
two-year college campuses whether they might join the military and which,
of a small set of alternative recruiting incentives, might induce them to
do so. Since the Fisher study is more recent and encompasses the
findings of the Korman study, we review it in some detail.
A Market Survey
The goals of the Fisher et al., 1975, study were to (a) estimate
the Navy's potential for enlisting male, two-year college students, (b)
determine whether enlistment potential varied systematically with
demographic characteristics, and (c) determine students' preferences for
alternative incentives. The major part of the study was a 1975 survey
of 807 male students 25 years of age or younger. To select respondents
who were representative of this population, a sample of 20 colleges was
drawn from all two-year colleges with probabilities proportional to
envollnient. At highly trafficked locations within each college, "every
nIt male student" was selec.ted for screening (not more than 25 years of
age, not obviously physically impaired, and willing to participate in
the study) and given an interview appointment. In this way,
approximately 40 students at each college were interviewed.
The survey included questions on (a) intention to enlist, (b)
I'- potential effectiveness of various recruiting incentives, (c) media
exposure, (d) recruiter contact strategies, (d) verbal ability, and (e)
demographic characteristics. Table 6 provides data on verbal ability
and demographic characteristics of the sample.
4 - -30-
Table 6
CHARACTERISTICS OF A SAMPLE OF TWdO-YEAR COLLEGEMALE STUDENTS, SPRING 1975
Variable Percentage of Sample
Age 18-21 years 84
Mental ability quartile:
First (highest) 40Second 34Third 18Fourth 8
High school graduates 98
12-14 years of education 90
Single 84
Family income:
Below $10,000 18
$10,000 - $19,999 39
$20,000 and above 26
Refused to respond 17
Employment Status:
Full-time 8
I -Part-time 50
Area resident 80
College program:
Trans fer 57
Occupational 20
SOURCE: Fisher et al. (1975).
-31-
Intention to Enlist
When interpreting data on enlistment intentions, it is important to
understand the relation between plans and behavior. As a proxy,
consider the relation between sample respondents' educational
aspirations and their behavior. When asked about their educational
aspirations, 14 percent of the sample reported that they planned to
complete the associate degree, whereas 75 percent reported that they
expected to attend a four-year college or university and/or graduate
school.
In spite of the fact that 75% of the sample aspires to a four-year education (or more), only one-third have applied to afour-year college and only 261' have been accepted. . . .Evenfewer students (16%) have applied for financial aid although
...many . . . students reported that they could not afford afour-year college education (Fisher et al., 1975, p. 69).
These findings are consistent with others in the literature (Cohen and
Brawer, 1982) and with data reported by Astin et al. (1981) where
roughly 77 percent of the entering, two-year college freshmen class of
1981 said they intended to earn at least a bachelor's degree, 30 percent
said they expected to do so at two-year college (!) and only 14 percent
said that "chances are very good that they will transfer to another
4 college." In sum, two-year college students tend to be somewhat
unrealistic planners and this should be taken into account in
interpreting enlistment intentions.
When asked about their overall attitude toward the military, 26
percent were favorable, 43 percent were "half and half," and 29 percent
were unfavorable (22 percent had no opinion). Their immediate plans,
however, tended not to focus on military service: 68 percent intended
-32
to continue their education, 33 percent planned to go to work, and 1
percent planned to eq~r the armed forces. Asked how likely they were
to enlist in the armed forces, 1 percent indicated that they would
"don't know." Of those 80 students planning to enlist, 30 percent said
they would choose the Air Force, 28 percent the Navy, and 23 percent the
Army. Among the most probable accessions, then, the distribution of
preferences was fairly flat. Each student was also asked to indicate
th- elihood that he would join the Reserve or National Guard. Eleven
percent said they definitely or probably would join, 74 percent said
they definitely or probably would noat join, and 15 percent "didn't
know-
When asked whether they planned to enter the military services as
an officer or an enliisted man, 55 ;peiceiit selected officer while. 33
percent selected enlisted. Academic transfer students -selected officer
at a greater rate (65 percent) than did students in occupational
-33
* programs (36 percent). Moreover, when provided a descri.ption of Navy
enlistment programs artd asked what pro-grams interested them,',the three
* that generated the most interest were the three officer programs (e.g.*
NROTC).
Among the reasons given for enlisting, those that were important to
two-thirds or more of the students were choice of branch, opportunity to
learn a skill or technical trade, travel, advanced education and
retirement benefits. Reasons not to enlist were: other plans, 12
percent; suppression of individual freedom, 9 percent; and conscientious
objectors, 8 percent.
Recruiting Incentives
Students said that they would be more favorably disposed to enlist
if (a) they had an option to leave the military after six months if they
were not satisfied (84 percent); (b) they received educational benefits
of $270 per month for four years (80 percent); (c) promotions and pay
were based on ability regardless of race, creed, or religion (70
percent); (d) the Navy helped them find a job when they completed their
Lours of active duty (67 percent); and (e) they received a bonus of
$22,000 for joining the Navy if they had some skill that is in short
supply (60 percent).
Use of the Mledia for Recruitment
Respondents reported being exposed most to a direct mailing (74
percent.); then to television, magazines, and billboards (55 percent);
then to "other recruiting literature"' and radio (44 percent); and lastly
to newspapers and recruiters either irt person or by phone (25-30
percent). When asked about their preferred recruiting source, 54
-34
percent preferred to talk to a Navy recruiter and 25 percent preferred
to read Navy literature. Forty-one percent of the students preferred
talking to the recruiter in the recruiting office, 21 percent preferred
talking at school, 16 percent had no preference, and 14 percent
preferred talking at home. Thirty-five percent preferred talking to an
enlisted man, 31 percent to an officer, and 25 percent had no
preference.
In summary, the Fisher at al. study indicates that while, on
average, two-year students in the sample probably meet accession
standards, few consider the military as an occunation after completing
school. Nevertheless, if asked directly whether they planned to enlist,
about 10 percent said "possibly" but at some later date. The most
important enlistment incentives for this samplo were an early
opportunity to leave the service and a financial bonus. With respect to
recruiting strategies, most had been exposed to direct mailings and
preferred meeting recruiters in recruiting offices.
In evaluating these results, a number of factors should be kept in
* mind. The study was conducted seven years ago in an environment
considerably different from that of today. The data reported in this
study refer to enlistmnent intentioý,;s, not actual enlistment behavior.
Indeed, few students in two-year colleges in 1975 actually enlisted in
1976. M1oreover, data presented by Fisher et al. attest to the fact that
these students are unrealistic planners. Finally, the subjects
participating in this study were volunteers. We do not know how many
refused to participate in the study, what their responses would have
been, and how those responses might have changed the findings.
Nevertheless, the data provide some information for developing
C ------------------------------------------
incentives and recruiting methods that might be used to penetrate this
market.
In the absence of definitive studies directly testin~g the
military's ability to penetrate the two-year college market, anid with
the paucity of studies such as Fisher et al., we look for other
indicators of penetrability. We consider the key indicators to be (a)
the past enlistment behavior of two-year college students and (b)
evidence of flux in the plans and behavior of these students. The
latter would presumably indicate how committed the students were to the
educational and occupational plans that led them not to enlist in the
military right after high school.
The data on past enlistment behavior are not encouraging. First,
students in two-year colleges have already opted for education rather
than the military after high school graduation. Second, only 6 percent
of the 1981 NPS accessions had a year or more of college (see Sec. III).
Third, out of about 11,000 students between the ages of 17 and 22 in the
National Longitudinal Study of L~abor Force Behavior (Borus, 1982), 196
males and 257 females were enrolled in two-year colleges in 1979, and
L 282 males and 397 females were enrolled in 1980. Those in two-year
colleges were asked, "Do you think, in the future, that you will
definitely try to enlist, probably try to enlist, probably not try to
enlist, or definitely not try to enli'st in the military?" Only %three
males and one female said that they would definitely enlist, and 19
males and 30 females said they would probably try to enlist. For
additional data, see Table 7. Finally, only 0.6 percent of the two-
year college freshman class of 1981 reported that they planned on a
military career (Astin et al., 1981).
- 36 -
Table 7
NIO-YEAR COLLEGE STUDENTS' RESPONSES TO A QUESTIONON ENLISTMENT PROPENSITY
Enrolled in Two-Year College&
Do you think, in Number (%) Number (M)the future, athat of Males of Females
you will 1979 1980 1979 1980
Definitely tryto enlist 3(2) 3(2) 1(0) 1(0)
Probably try toenlist 13(7) 19(7) 19(7) 30(8)
Probably not tryto enlist 61(31) 78(28) 90(35) 116(29)
Definitely nottry to enlist 86(44) 120(43) 129(50) 210(53)
SOURCE: Borus (1982).
aOther qlternatives included physical or mental require-ments not met, presently .nlistad, and so on. These additionalalternatives account ior all two-year college respondents.
Before overinterpreting these findingj.• to mean that the two-year
college market is impenetrable, several important factors should be
considered. First, the military has not made a concerted effort to
recruit from this market. In contrast, high schools have been the
target for enlistees, and four-year colleges and universities have been
the target for commissioned officers. Second, recruiters are unlikely
to tap the two-year college market because it is a new, unknown
territory for them. Third, as male youth (18 to 21 years of age) sort
themselves into alternative occupational tracks, the largest numbers
enter the labor market and the fewest enter two-year colleges (Fig. 10).
- 37 -
UM
I
Total 42 M
71W= O5NOS
Full-tiio
Fig. 10 - Main activities, men of ap 18 to 21 (Fa&l 1hG)
There are, however, some indicators that lead us to search for
evidence of penetrability, especially when plans and occupational-choice
- 38 -
behavior are considered. While approximately 75 percent of the two-
year college freshmen intend to earn bachelor's degrees, transfer ratev0
from two- to four-year colleges are very low (about 6 percent of
entering students complete two years and then transfer) (Cohen and
Brawer, 1982). Educational and occupational aspirations of many two-
year college students are in a state of flux (Baird, 1971; Clark, 1960,
1980; Pincus, 1980), which suggests that occupational career choices
made after high school might change and include the military.
Instability in the career paths selected by these students leads to the
observed curricular mobility in two-year colleges (see, e.g., Cohen and
Brawer, 1982). Approximately 60 percert of the 1981 freshmen indicate
"some" or "major" concern about financing college education. And
current high unemployment rates may increase the attractiveness of the
military as an alternative occupational path, especially to those
finishing vocational training that corresponds with critical military
occupational specialties, Heretofore, the military has not
systematically attempted to recruit from this market. Appropriately
designed recruiting strategies and enliistment incentives might increase
accessions of students with differing occupational specialities and
reasons for enlisting.
On the basis of the literature review, the following tentative
conclusions can be drawn about market penetrability: (a) students in
two-year colleges have not been a major source of accessions in the
past, (b) few freshmen in two-year colleges appear to consider military
service as an occupational option, (c) students in two-year colleges
often change their educational and occupational plans, and (d) present
research has not adequately addressed the penetrabilty of the two-year
college market.
'39 -
UTILITY OF ENLISTEES FROM TWO-YEAR COLLEGES
Utility refers to the service performance of recruits from-two-
year colleges. Some common measures of utility are (a) trainability
(ability to complete occupational training satisfactorily and on
schedule), (b) willingness and capacity ;to serve in critical
occupational specialties, (c) productivity, (d) leadership, and (e)
freedom from disciplinary actions.
Typically, recruiting policy focuses on whether a particular market
meets major recruiting goals, especially that of recruiting sufficient
numbers of high-school graduates of above average ability. This goal is
based on the premise that, on average, high-quality enlistees perform
better in the military than individuals with lesser :qualifications.
While this premise seems plausible and a high proportion of the students
in two-year colleges would qualify as high-quality recruits, those who
actually enlist constitute only a small minority (and may be atypical)
of the two-year college population. Thus, questions about the potential
utility of recruits from the two-year colleges require investigation.
Unfortunately, no research has been reported on the utility of two-
year college recruits. In Sec. III, we bring some recent data from
DMDC's 1981 accessions file to bear on the question of utility of two-
year college recruits.
RECRUITING ENVIRONMENT IN TWO-YEAR COLLEGES
Counseling and guidance is a major function of over 90 percent of
the two-year colleges (Cohen and Brawer, 1982). The growth of this
function is based on
-40- ..
the contention... that community college students are differentfrom the traditional college groups, the affective is asimportant as the cognitive, students need help in moving intothe college and out again .into jobs and other schools, andindividualized instruction through counseling and othernonclassroom-based activities is essential (Cohen and Brawer,1982, p. 171).
Thus, an institutional mechanism currently ex ists through which
recruiting might be conducted.
A second characteristic of two-year colleges leads us L.o believe.
that these institutions would provide an environment conducive to
recruiting: they are quite responsive to changes in the economic
environment. In 1963, for example, the Vocational Education Act
broadened the criteria for federal aid to schools, and Congress
appropriated $43 million in 1968, $707 million in 1972, and $981 million
in 1974. "On this surge of monies occupational education swept into the
[two-year] colleges in a fashion dreamed of and pleaded for but never
before realized by its advocates" (Cohen and Brawer, 1982, p. 292). The
impact of this funding is reflected in the increasing share of associate
degrees awarded to graduates from occupational tracks in these colleges
(see Fig. 7).
In the current economic environment--one of recession, decreasing
federal involvement in education, and fiscal retrenchment in states'
educational funding (McDonnell and McLaughlin, 1982)--we would expect to
see two-year colleges seeking ilternative funding source.; such as the
military.
Two-year co~leges are also attractive recruiting environments
because they form a concentiated market; 50 percent of tho institutions
and 65 perc.ent of the enrollmt~nts are concentrated in 10 states. Most
of the students satisfy the military's enlistment standards.
-41-
There are, however, several factors that indicate recruIting
problems. One is the fact that 60 percent of the students attend two-
year colleges only part-time. Furthermore, even full-time students are
not on campus all of the time, so that recruiters may have difficulty
locating students on campuses. However, if recruitment is coordinated
with the counseling and guidance office on the campus, this problem
might be overcome.
A second potential problem is that, to most recruiters, the
population of two-year college students is unfamiliar. Recruiters Who
have not attended college may be reluctant to recruit in this "unknown''
market. Coordination of recruiting with the institution should
alleviate this problem. Further, providing recruiters with specific
information on these students or permitting recruiters to collect this
information from students should prove helpful. Finally, using
educational specialists--past teachers, principals, and counselors--
as intermediaries to establish a link between the schools and the
recruiters may further alleviate the entry problem.
In sum, the facts that two-year colleges are adaptive tc the
economic environment and stress career counseling and guidance lead us
to believe that these institutions will be receptive to recruiting on
their campuses as long as recruiting serves their goals as well as the
military's. By this caveat we mean that two-year colleges are likely to
support recruiting as long as the military does not compete with them
for students.
!4
-11 -1 -, -ofr - ....- .
-42-
III. ANALYSIS OF THE MARKET PLACE: NEW DATA
The literature suggests that the two-year colleges might provide.
fruitful locales for recruitment in that approximately a million male
students meet enlistment requirements, this market has not been
penetrated in the past, and the educational and occupational plans and
behavior of many students are in a state of flux. But the literature
lacks adequate data on important characteristics of these students such
a,,. objecltive indicators of their aptitude (e.g., cognitive test scores),
the penetrability of the market, and the utility of two-year college
recruits to the military.
To bring additional data to bear on issues of quality,
penetrability, and utility, analyses of two very recent data sets--
High School and Beyond and the DMDC accessions file for FY8l--were
undertaken. Unfortunately, neither data set is ideally suited to the
two-year college market. The DMDC file does not provide information
specifically on enlistees from two-year colleges. Rather, it provides
information on enlistees with one or more years of college. The
enlistees with one or two years of college certainly include large
numbers of two-year college students, and we shall assume that the
characteristics of this group will serve as approximations for the
characteristics of the two-year college students who join the military.
High School and Beyond (HS&B) is limited in a different way. It
provides data on 1980 high school seniors,[l] including their post-
secondary plans, but as yet follow-up data are not available to
[11 It also provides data on sophomores.
',,,..,.
. 43 -
ascertain which students actually attended two-year colleges.
Nevertheless, we provide, an empirical justification for using data on
high school seniors planning to enter two-year colleges as proxies for
data on students in two-year colleges. By doing so, we avail ourselves
of a very rich data set, one well suited to providing a detailed profile
of prime-age students in the two-year college marketplace.
PROFILE OF STUDENTS IN TWO-YEAR COLLEGES: METHODOLOGICAL CONSIDERATIONS
To provide a current, detailed profile of the entering two-year
college student, we have to justify using seniors who plan to enter
these institutions in the spring of 1980 as proxies for those who
actually entered in the fall of 1980. In short, we need to demonstrate
that those high school students who plan to attend two-year colleges
"look like" those who actually do attend. To this end, we used the
National Longitudinal Survey of the High School Class of 1972
(NLS72)--the data set most closely comparable to HS&B in terms of the
student population (high school seniors), the attributes measured, and
the wording of questions. (In fact, HS&B was designed to overlap
closely with NLS72.) We compared the characteristics of high school
seniors in the spring of 1972 who planned to go to two-year colleges
(the "planners") with the "doers," those who actually were enrolled in
two-year colleges in the fall of 1972.
The means of the planners (X,) and doers (xe) on demographic,
academic, socioeconomic and attitude/aspiration variables are givei, in
Tables 8a and 8b. These data are for male and female seniors planring
to enter one of three postsecondary education tracks (four- oz two-
year colleges or vocational/technical schools), military service, or the
civilian work force. We show data not only on two-year college planners
-44-
C0co G- oco;: CSI '2%NC;O 00 0000 coo C; C
cm QNI- 0Ce r-~'*r-e- -' 0%t0 0
9%rUO COO"lO-, 001O4>-.0
'4 Y C! ~ N -9O NOD 0 mOom l 0 C% 0
*1-0 -rfMm- tn aee~-- 00C0I-- on
2 0 000 0000000 0 0 000o
N inm' fn m fl-f. fn % 0 P- 4T0 * o*
en
N r'0 C7% CO - %0~ OeI-N. 00 0O00 G 0\N 0 Go Go -a ~ 1-oe 0 \0 N I-ao.-Jae
0 ~-00 000 00M 0-00000 00 00
UN r'- 0' 1-0 0 rl tNu0N 1 r-o4ý C - CM n.I- W\- CN r~0- 0 0 0\e
0zz~~~~i U .. ' . . . . . en0 .- en -?. enN --
0un Nr- o 0 -1 0 t n C\ o mCO r U' .(en --ro* -to- L.j -o (h - r~- N C M. \0o 0UNr- -0 O'\. r
0 : - UJ 0Wl -L6. 0o0 0 Q000 00 000000 00 00.-
LiLNZN m CO0 "r- ýo C \0 NOMNCOJN 0r- O' l% Ir~n11- 4- > 4 4' 0r- r--t\O ~ r-r- \0 0\ 00 C\ of)V) 0 t--
i0mm1 h 0 %'D 0c mm i a mru0 N n 0C~ o0 >& 19 Ca-- tn g o t- %0 0-:r_ 4i UAP, mNc 0 f e 0. v -0 enu' 0 *
0.- 0\ UN Lr% C~ %- :T - '\ - T m
%0>U r-?0 4r -T N L ON -NN06N 00 40* N- CI.- IA uU. UN \0 - I.""0- 00
Tuz z 0.n4
-0 0 c I- Q- IA4U. 'IA? 4ic 0 C.- (ja) 00 000 0 t41 0 00000n a -0 00 000001 0 000.ME( 0 04 1 L 000000. 00 000,
mmm a)-4 L m m mm- mm j- 1 04) tn4 -4 r ... L LU , ML U
L or- o AC%4* a-h eCNOmc 00- w06. . n
=(A 0 X 0L ýXU LL L>CL E.4~O% 0%IA 4?-A?- e~ '-- E
-46-
but also on students planning to enter other tracks because some
analyses will compare students planning to enter two-year colleges in
1980 with students planning to enter other tracks in order to evaluate
their "quality." The delta statistic, denoted by A, is a measure in
standard deviation units of the magnitude of the mean difference between
planners and doers. It provides a summary of the degree to which
planners look like doers. Specifically) delta is the difference between
the means of the planners and doers divided by the standard deviation of
"the plannersi[2] The standard deviations of the measures may be found
in Table A.la and Al.b.
Among the two-year college students, the planners look very much
like the doers. The deltas range from -0.10 to +0.03 for men and from
-0.10 to +0.07 for women. The deltas for the four-year college planners
and doers are also uniformly small, all less than 0.10 in absolute
value. In contrast, there are some sizable differences in means between
the planners and doers in the vocational/technical track, where the
deltas in absolute value run as high as 0.61 for males and 0.27 for
females. Using means of male planners to estimate the actual rieans for
students in vocational/technical schools leads to an underestimate of
the mean number of semesters of foreign language, mathematics, and
science, and an underestimate of their mean educational aspirations.[3]
[2] A delta of 0.20 is considered a small effect, 0.50 isconsidered a medium effect, and 0.80 is considered a large effect.
[3] If one wishes, the HS&B data can be adjusted for under- oroverestimation using the mean difference between planners and doers.For example, the mean difference between the educational expectations ofmale planners and doers was 13.14 - 13.69 = -0.55. This value, -0.55,could be added to the mean educational aspirations of malevocational/technical school planners in the HS&B data to correct fordifferences in overlap.
*47-
For seniors planning to enter military service or the civilian work
force, male planners look like male doers. (Professional aspirations
are slightly underestimated by the mean of men planning to enter the
military, and educational aspirations are slightly underestimated by
using the mean for men planning to enter the civilian work force.) The
* charactertistics of women planning to enter the civilian labor force are
similar to those for the doers, except that planners have slightly lower
educational expectations, on average. In coný;rast, women planning to
* enter the military are different from ',hose who do; however, our sample
* sizes are small in this case, with only 62 planners and 14 doers.
In summary, the analysis of NLS72 indicates that the mean
characteristics describing high school seniors planning to enter
:lfferent educational and occupational career tracks provide remarkably
good proxies for the actual means of seniors who do enter these tracks.
Tere are two exceptions to this rule: men planning to enter
k vocational/technical schools and women planning to enter the military
tend to differ from those who enter the tracks in both high schoolI coursework and educational expectations.
K One last methodological consideration remains: Is there any reason
to believe that the relation between the characteristics of planners and
doers in 1972 holds for planners and doers in 1980? Although we cannot
answer this question definitively (if we could, we would not have had to
use data from 1972), a comparison of the attributes of the 1972 planners
with the 1980 planners shows that, on average, they are quite similar
(compare the data in Tables 8 and 9). The attributes of two-year
college planners in 1972 and 1980, for example, were quite similar:
L.
-48-
general ability (51.59 vs. 50.50); age (17.73 vs. 17.54); single (1.00
vs. 1.00), semesters of math (4.35 vs. 4.33) and science (3.96 vs.
3.60); and number of siblings (2.61 vs. 2.92). The planners of 1972 and
1950 do differ, however, on several variables where they might be
expected to because of inflation (e.g., family income) or changes in
college requirements (semesters of foreign language). We conclude,
then, that data on the characteristics of planners in the spring of 1980
provide good proxies for data on the characteristics of doers in the
fall of 1980.
PROFILE OF WO-YEAR COLLEGE STUDENTS' CHARACTERISTICS
In using data on planners from HS&B, we are able to provide a
current, detailed profile of two-year college students falling within
the prime age range for NPS accessions. We first provide a profile of
the attributes of those students with respect to enlistment standards,
high school curricular background, ability, and demographic
characteristics.
Accession Goals
The military seeks to recruit male high school graduates aged 18 to
Li 21 years who are above average in aptitude, single, and in good physical
condition.14] On average, males planning to enter two-year colleges in
1980 met these standards. They scored higher on aptitude than did
students planning to enter military service or the civilian work force,
they averaged 17.3 years of age in the spring of their senior year of
high school (or would be roughly 19.5 years after two years of college),
[41 In reporting data on the quality of two-year college students,we emphasize the data for males because of the military's greater need,in numbers, for males than for females, and for the sake of brevity.
and they are prcdominantly single and in sound physical condition (Table
9a, see also Table 9b; standard deviations way be found in Table A.2a
and A2.b).
A comparison of students planning to enter two-year colleges with
those planning to enter vocational/technical postsecondary schools shows
that those planning collegiate academic programs in the two-year
colleges were above average in aptitude and slightly higher in aptitude
than those planning vocational programs, who were, in turn, slightly
higher than those planning to enter vocational/technical schools (see
Table l0a and l0b; standard deviations may be found in Table A.3a and
A3.b).
HihShool Education
Academically, male two-year college planners fall in between four-
year college planners and those planning to enter the military service
or the civilian labor force. They have a B- grade point average (women
have a B average), and about the same number of semesters of English,
foreign language, mathematics, and science as do the military planners
and more than those planning to enter the civilian labor force (see
Table 9a). The proportion of two-year college planners enrolled in
physics, chemistry, and computer courses is about the. same as that of
* - military planners and somewhat greater than that of the civilian labor
force planners. (A smaller proportion of two-year college women
planners was enrolled in physics and computer courses.) Finally, men
planning to enter two-year colleges tended to spend slightly more time
on homework in high school than did military planners and considerably
more time than did civilian labor force planners.
-50 ITable 9.
ATTRtDUTI PRmFIL o0 vtG ggoO 3 1 Pii@l• TO UIDIRT/fl CUlTAINPFOSBICO0DAI 01TM1 AClII? (1960) 1 MRAU FOR VAL38
Co11km Military CivilianFomr-year Te-iar Strvic Labor Fob e A11
(e) De0o0raphicsFamily Income (thousands) 24.53 22.20 19.82Importance of Aid 2.15 2.22 2.23
Family Odns Home 0.02 0.82 0.81Number of Siblings 2.88 2.97 3,19
Father is Professional 0.17 0.01 0.01Mother is Professional 0.20 0,18 50.1Father's Education 13,04 12.68 12.43Mother's Education 13.76 13.18 12.51Proport ion-
(d) Indicators of ResponsibilityROTC 0.02 0.02 0.02Varsity Athletics 0.24 0.23 0.18Other Athletic Teams 0.31 0.30 0.30Honorary Clubs 0.17 0.14 0.10Student Government 0.22 0.19 0.16Have Job 0.62 0.55 0.58Days Absent' 2.91 2.67 3.07Suspexded 0.06 0.09 0.09Trouble with Law 0.01 0.02 0.01
(e) DemographicsFamily Income (thousands) 21.65 19.89 18.67.Itportance of Aid 2'.18 2.21 2.36Family Owns Home 0.81 0.80 0.77Number of Siblings 2.91 3.10 3.20Father is Professional 0.14 0.11 0.05Mother is Professional 0.16 0.12 0.40Father's Education 12.81 12.43 12.23Mother's Edcoation 13.31 12.68 12.35Proportion:
White 0.71 0.68 3.67Black 0.10 0.14 0.17Hispanic 0.13 0.13 0.11
Male two-year college planners in academic programshave more
semesters of academic work ,in 'high school than did those in vocational
programs who, in turn, have more semesters than did students planning to
enter vocational/technical schools (except for English; see Table 10a).
Further, the proportion of p)anners who studied physics and chemistry
decreases as we move from the academic track to the vocational/technical
schools. The proportion of planners enrolled in computer coursework. .
however, remains constant across these postsecondary educational tracks.,
Aptitude.
Two-year college planners fall in between four-year college
planners and military. and civilian labor force planners on several .
aptitude dimensions.[5] More specifically, two-year college planners
tend to snore slightly higher on verbal, quantitative, and spatial
ability tests than did military planners and between a third and a. 'half
a standard deviation higher than did civilian labor forc'e planners. A
consistent trend in mean aptitude test scores also emerges in a
comparison of students planning to enter two-year academic with those
planning to enter vocational college programs or vocational/technical
schoDls: aptitude scores decrease systematically moving from the
academic track to the vocational-technical track, (The one exception is
for scores on the in1osiac test.)
We infer from these data that enlistees from the two-year collegemarket would, on average, meet and even surpass ability standards. Mean
AFQT scores for male and fer.,ale accessions during FY81 enable us to
[5) For a discussion of the psychometric properties of these tests,see Heyns end Hilton (1982).
4
partially test this conclusion (;ee Table 11). These scores are
available ,for accessions by educational level:,- high SChool
(nongraduates end graduates) and college (I yeaz, 2, years, 3-4 years,
"and graduate) and not, unfortunately, by type of educational
Institution, for example, two-, and 'four-year colleges'. -If we assume
that enlistees with one and two years of collge are representative of
enlistees from two-year colleges, a tenuous but perhaps not totally
unreasonable assumption, we reach the sam'econclusion as we did with
* data from.HS&B:* mean AFQT iscores are considerably higher for accessions
with one or two years of college. (for males,).the means are 67.7 and
69.1, respectively) than for accessions with a high school education
(51.6) or less (53.9).. (For more detailed data on AFQT scores by
military service, sex, and educational attainment, see Table A.4.)
As the differences in mean AFQT scores suggest, high proportions of
the enlistees with some college fall in Mental Categories I-IliA (Table
12). For example, while 52 percent of the male high school graduates have
AFQT scores falling within Categories I-lilA, over 77 percent of the men
with one or two years of college fall within these categories. (For more
details, see Table A.5.)
Table 11
MEAN AFQT SCORES FOR MALE AND FEMALE ACCESSIONS BYEDUCATIONAL ATTAINMENT, 1981
High School College
Nongraduate Graduate 1 Year 2 Years 3-4 Years Graduate
Males 53.9 51.6 67.7 69.1. 70.5 73.0
Females 54.8 51.8 63.7 64.4 66.1 71.9
Both 54.1 51.7 66.9 68.0 69.5 72.7
j - 56 1Table 12
PERUENTAGES OF ENLISTMENTS IN,.MENTAL 'CATEGORIES. I-IIIA ..
BY EDUCATIONAL 4TTAINMENT AND SEX, 1901________ •___________.___________• __ .
High School .ollge,Nongraduate. Graduate,. 1 Year .2 Yaars 34,. Years Graduate
Males 56.5 52.2 77.4 7V.2 79.1 83.1.
Females 66.1 53.0 72.5 74.1 .730 82.9
Both .56.9 511.3 76.4 77.2 77.7 83.1
Responsibility: A Nontraditional Indlcator of Quality
LAs' a non traditicnal indicaltor of quality, we looked for evidence of
an individual's participation in extra.urricuiar activities during high
school that required a commitnmnt of time and energy and a commitment i.o
others who depended on the. individual for successful completion of the
activity. Fu• more simply, we looked for indicators of
"responsibility." High School and Beyond p-cvided a number of positive
i.ndicators as to whether th .individuals participated in: (a) high
school ROTC, (b) sports, (c) leadership activities, or (d) part-time
work. The survey also provided negative indicators including days
absent from school for reasons other than health anti reports of being
suspended from school, put on probation, or having serious trouble with
the law.
As for participdtion iii sports, leadership, and worb-related
activities, t.ien planniitg c.n entering a two-year college were quite
-- 57-
-57-
similar to men planni-ig on the military and fell in between men planning
on a fovr-ye&r college and the civilian labor force.[6] A greater
"proportion of seniors planning to enter the civilian labor force held
jobs than did men planning to enter the military or a two-year college.
Similarly, the proportion of .men participating in these activities
syatematically decreases from the academic track to the
vocational/technical track. The one exception was the proportion of men
working, which showed, not unexpectedly, the opposite relation between
participati-n and educational track (see Table lOa). Finally, the
proportinn of men planning on the military who participated in high
school ROTC was about three times greater than the proportion of men
planning to enter any of the other career tracks, including the academic
and vocational programs in two-year colleges and vocational-technical
schools (Table 9a and 10a).
Negative indicators of responsibility--indicators of
"irresponsibility"--are absences for reasons other than health,
suspension from school, and teouble with the law. Absences increased
over the four career tracks shown in Table 9a, ranging from slightly
more than two days for four-year college students to almost four days
for men in the civilian labor force.[7] Similarly, the proportion of
men who were suspended or who have had trouble with the law increases
from the academic to the nonacademic tracks. For all three variables,
[61 This pattern of findings holds for women except with respect towork--considerably fewer women in the military held jobs when in highschool than did women planning to enter the other tracks.
[7] Subjects were asked, "Between the beginning of school last falland Christmas vacation, about how many days were you absent from schoolfor any reason, not counting illness?" They responded: none (our code0), 1 or 2 days (our code 1), 3 or 4 days (our code 3), 5 to 10 days(our code 7), and so on.
there is a clear distinction between men planning to enter college (two-
and four-year) and men planning on military service and the civilian
labor force: men entering college tend to be less irresponsible. This
trend of increasing irresponsibility moving from the academic to the
nonacademic tracks is mirrored in Table 10a, where irresponsibility
* tends to increase as the educational track becomes increasingly
vocational in orientation.
Demographic information on students planning to enter a two-year
college is provided in Tables 9a, 9b, 10a and l0b along with data on
persons planning other careers. In general, these students reported a
mean parental income of $23,550 in 1980, somewhat below the family
income of men planning on a four-year college and considerably above
that of men planning on military service (Table 9a). Moreover, mean
family income decreased from $24,530 for men planning on a two-year
college in the academic track to $19,820 for men planning to enter
To determine whether the two-year college market is penetrable,
ideally we w uld like a randomized recruiting experiment in which a
systematic effort is made to recruit students from this market. Falling
short of an experiment, we would like some behavioral indication, not
just a verbal report of intent, that students in these institutions can
be attracted into the military.
On August 6, 1981, the Commandant of the Marine Corps authorized
the nationwide implementation of the Community Collage Enlistment
Program (CCEP), effective October 1981. The program was open to men and
women who met the usual enlistment standards and were second-year
students, associate degree graduates, or students who had completed a
special college course in areas such as welding, drafting, or electrical
construction. CCEP's goal was to obtain, using regular Marine Corps
recruiters, 600 high-quality accessions annually who would fill any one
of over 150 technicai or administrative occupational specialties.h Enlistment incentives included guaranteed occupational specialties,guaranteed four-year assignment in that specialty, appointment to
private first class 1;pon enlistment, promotion to corporal upon
completion of13 months active duty, promotion to sergeant after 25
months, and bonuses for certain occupations.
As of May 1982, the end of the first six months of the program,
r approximately 219 students had enlisz~ed in the program, and 143 had
actually gone to recruit training. Another 50 of the 219 cancelled
their contracts, and 11 others were about to enter training. Apparently
recruiters were experiencing limited success in enlisting students fro
-61-
the community college market. One major barrier to recruiting was the
reluctance of the recruiters to enter this new market, one virtually
unknown to them.
Another source of information on the penetrability of the two-
year college market is data on actual accessions dnring FY81. These
data are presented in Table 1! by education attainment, sex, and branch
of service. Unfortunately,, DMtDC's data do not indicate how many
enlistees with one or two years of college attended two-year colleges.
Nevertheless, we can interpret the Lounts of accessions with one and two
years of college as overestimates of the number of accessions from 'two-
year colleges. Put succinctly, the military att,'acted few students from
two-year colleges in 1981. Less than 4 percent of all male and 8
percent of the female accessions had one or two years of college.
To put an upper bound on the military's current penetration of the
two-year college market, let us suppose for the moment that all of .the
14,000 enlistees with one or two years of college came from the two-
year colleges. With a total enrollment of around 4.5 million in 1980,
there were over 300 two-year college students for every enlistee. The
10,800 males in this group constituted only about 1.5 percent of the
estimated 720,000 male two-year collega enrollment in the prime age
group (21 or below).
With neither direct nor indirect information on the penetrability
of this market, the last resort is to make informed inferences on the
bases of students' aspirations (Tables 14 and 15; standard deviations
art, reported in Tables A.7a and A.7b) and financial conditions (Tables 9
I and 10). In particular, the question arises as to why high school
seniors planning to enter either two-year colleges or the military are
-7
"- b2 -
Table 13
NPS ACCESSIONS IN THE APMED FORCES BY EDUCATIONAL ATTAINMENT,SERVICE, AND SEX: FY81
Category Army Navy USAF USHC DoD
males
Nongraduate 21,668 21,744 6,986 8,177 58,575H.S. graduate 71,721 56,133 53,192 28,366 209,4121 yr college 1,784 1,886 1,710 609 5,9892 yrs college 1,551 1,471 1,500 319 4,8413-4 yrs college 572 587 480 140 1,779College graduate 1,427 518 2,430 111 4,486
Total 98,723 82.339 66,298 37,722 285,082
Females
, Nongraduate 1,043 746 1,130 10 2,929H.S. graduate 15,219 1,714 8,174 1,928 33,0351 yr college 609 494 410 127 1,6402 yrs college 556 469 398 94 1,5173-4 yrs college 201 150 117 18 486College graduate 549 188 376 39 1,152
MARITAL STATUS AND NUMBER OF DEPENDENTS BY SEX AND EDUCATIONAL ATTAINMENT(Percent)
High School CollegeNongraduate Graduate 1 Year 2 Years 3-4 Years Graduate
Males
Single 90.2 92.5 86.2 81.4 78.4 72.7
Married with
0 dependents 3.4 2.5 4.4 5.8 6.7 7.9
1 dependent 2.0 1.3 2.6 3.1 3.7 5.3
2 dependents 2.5 2.0 3.5 5.7 6.0 7.8
Other 1.9 1.7 3.3 4.0 5.2 6.3
Females
Single 82.3 91.2 86.7 86.8 86.0 84.3
Married with
0 dependents 9.2 4.4 6.9 6.7 7.6 8.5
1 dependent 3.7 1.6 2.8 2.4 d•..7 2.7
2 dependents 2.7 1 .5 2.1i 2.2 1.6 3.2
Other 2.1 1.3 1.5 1.9 2.1 1.3
Few 1981 enlistees received bonuses. Only 2.7 percent of the men
and 2.9 percent of the women rece.-ved bonuses, and the percentages
appear to be unrelated to educational attainment.
r
'a -72-
In sum, then, enlistees with one or more years of college may cost
more than those with a high school education because on average, they
enter at higher pay grades and are more likely to be married and have
dependents. On the other hand, these increased costs apppear to be
offset, at least in part, by lower first-term attrition. A more
detailed analysis of the costs associated with recruiting two-year
college students is beyond the scope of this study.
-73-
IV. SUMMHARY AND RECOMMENDATIONS FOR FURTHER STUDIES
In this section, we summarize the major findings of the study and
*provide the context for recommending further research into the
postsecondary education market.
The literature review and data analyses suggest that the
postsecondary education market is sufficiently large to warrant further
analysis. For example, we estimate that over one million men in this
market fall within recruitment age ranges. The market contains a large
* number of potential recruits who meet or exceed enlistment standards.
By recruiting from this market, the military may increase recruit
* quality in terms of the proportion of recruits who are high school
* graduates with above average aptitude. This market has not been
substantially penetrated to date. For example, less then 4 percent of
all NPS enlistees in 1981 had one or two years of college (and we do not
know how many directly enlisted out of two-year colleges).I Nevertheless, the market contains many students whose educational and
occupational plans are in a state of flux. These students might
consider enlistment if an attractive incentive package designed for them
were offered. Moreover, our analyses suggest that two-year colleges
would provide a cooperative recruiting environment, one that already has
in place an administrative mechanism for coordinating recruiting with
its counseling arnd guidance functions. Finally, preliminary analyses
suggest that, once in the military, these students would perform well.
Although our research has provided a reasonably accurate profile of
the marketplace, we do not know if the market can be penetrated. Should
-74-
the military increase its recruiting efforts to attract students leaving
two-year colleges and vocational schools? The answer depends, in large
part, on whether enlistment rates from these markets can be cost
effectively increased. Further studies attempting to determine what
recruitment strategies would be most fruitful are requi: d. To this
end, we identify four different types of studies: (1) analyses of
existing data sets, (2) an examination of effective use of recruiters in
the postsecondary market, (3) a market survey of alternative recruiting
packages and communication channels, and (4) a targeted recruiting
experiment in the postsecondary education market. We consider each
alternative in turn.
ANALYSES OF EXISTING DATA SETS
This study raises more questions about the penetrability and
utility of postsecondary education markets than it answers.
Fortunately, a variety of data sets can be exploited to answer the
following questions:
Recruiting Strategies
o To what extent does the military currently attract talented
students from the nation's colleges and from its vocational
schools?
o Are there particular locations (states, recruiting districts)
that significantly outperform or underperform others in
recruiting enlistees with some postsecondary education? If so,
where are they?
-75
o What recruiting practices (e.g., use of educational
specialists, links between recruiter command and colleges) at
these locations are especially successful?
- Utility of Recruits
0 How are individuals from two-year colleges and vocational
schools utilized by the services?
0 How well do they perform (as measured, for example, by average
years of service, promotion rates, aria percentage filling
critical occupational specialties).
0 Are enlistees from certain postsecondary education markets more
likely to perform satisfactorily than enlistees from other
markets?
o Are enlistees from two-year colleges and vocational schools
more likely to serve longer tours of duty than, for example,
enlistees right out of high school?
"1ostservice Activities
o What happens to high-quality enlistees with some postsecondaryI education after they leave the military?
o To what extent do they continue to serve the military as
r reservists, and workers in defense-related industries?
0 Do they fill key positions in the civilian sector after
* completing their educations?
More research is needed to provide better assessments of the sizes
and compositions of the various subpopulations of youth that constitute
the postsecondary recruiting markets. In the past, manpower analysts
- 76 -
have viewed the eligible population as being grouped by sex, age, mental
category, and educational attainment, with the last ordinarily
characterized by the dichotomy distinguishing the high school graduates
from the others. Now that the military is considering broadening its
recruiting efforts to concentrate on particular postsecondary markets,
finer partitions of the youth population become of interest, including
those defined in terms of postsecondary track, occupation (or
instruction program), part-time or full-time status, and educational
attainment, in addition to the usual demographic factors (sex, race,
age, and marital/parenthood status).
The need for more comprehensive information on the youth labor and
student populations becomes clear when we try to estimate the military's
current penetration rates in various postsecondary education markets.
As the disparate enroll int figures reported in this study show, there
are large differencas between the two-year college enrollments reported
by the Bureau of Census and those by NCES. But even if they agreed,
disaggregated figures by sex, high school graduating class,
full-time/part-time status, marital/parenthood status, and type of
institution are not available.
The problem of assessing penetration rates for the two-year
colleges is particularly vexing. Although DMDC accessions files can be
exploited to determine how many recruits have a year of college or more,
they provide no information as to how many had less than a year of
college, •nd the type of institution attended is not given. Even twith
this information, we would probably not know if individuals enlisted
directly out of college.
1
-77-
Another problem in estimating penetration rates for the two-year
colleges is that, unlike high school graditating classes which are fairly
well defined and enumerated, two-year college populations are composed
of numerous cohorts of high school graduates, many of which are not
targets for or even eligible for enlistment. The students in the two-
year colleges exhibit considerable variability in age, family status,
physical condition, and commitments that make military service
inconceivable for some of them except in a national emergency. Although
a married man of age 27 with two children, a salary of $25,000, and a
large mortgage may be eligible to enlist, his likelihood of doing so is
infinitesimal. But should he be included in the student population in
defining penetration rates? Where should the lines be drawn in defining
the relevant subpopulations for recruiting purposes? The point here is
that no matter where they are drawn, the distribution of young people in
the subpopulations of interest is not known.
Although crude overall penetration rates can be computed, say, by
dividing the total number of enlistees with one or two years of college
by the total enrollment in all two-year colleges, these estimates may be
misleading, and more refined estimates are not available in any form.
For example, we found no information indicating what proportion of the
entering two-year college freshmen in some year entured the military
within a year or two (or any other time period). That information,
* along with similar information for the other postsecondary tracks, would
provide indicators of the military's current penetration of those tracks
that might later serve as baseline measures for assessing the effects of
4 changes in recruiting strategies directed at those markets.
-78
A better understanding of the youth labor market and the interface
between military service and postsecondary education will become more
pressing as the military copes with a shrinking college-age population
and increasing competition from the civilian sector for high-quality
recruits. If the military is to maintain its current manning levels,
the services must either attract a high percentage of each cohort or
adopt policies that lead to longer terms of service. Shifting to higher-
quality enlistees may be desirable provided that the shift does not
entail offering enlistment options that lead enlistees to leave the
service, such as shorter terms of service or sizable postservice
educational benefits that amount to negative reenlistment bonuses.
With the military's current emphasis on recruiting high school
graduates, the cohorts of primary interest, are the nation's high school
graduating classes, and recruiting performance and penetration rates
should be gauged in terms of the "takes" of the individual cohorts.
What information we have on the composition of the military's recruits
in terms of these cohorts leads us to conjecture that the military's
recruiting during the past two years has succeeded in part through
disproportionate recruiting of earlier cohorts of high school graduates.
Although this tactic has worked well during the current recession, it
may be impossible to repeat in a healthier economy.
To understand the two-year college and postsecondary vocation
school recruiting market and to prepare for a less favorable recruiting
climate, what is needed is a far more disaggregated analysis of the flow
of the nation's high school graduates in and out of military service as
V well as in and out of other postsecondary activities. We believe that
o 79 -
such an analysis will shad more light on the penetrability and utility
issues as well as on other matters at the interface of military service
and postsecondary education, including the feasibility of using
postservice educational benefits as recruitment incentives.IlI
The specific research tasks that we recommend are- (1) exploit
existing military personnel files and survey data to determine where the
high-quality recruits (especially those with some college) are coming
from, their attributes, how they are being utilized, and how well and
long they serve; (2) use current national data on labor force
participation, school enrollment, marital/parenthood status, educational
attainment, and military service to provide data on the distribution and
flow of recent cohorts of high school graduates across postsecondary
activities; (3) use longitudinal data files to get better information
on patterns of military service, schooling, and civilian labor force
participation of the nation's youth. Once follow-up surveys for High
School and Beyond become available, those data will serve this purpose
for the Class of 1980. The National Longitudinal Survey of the Class of
1972 is the best available data set for looking at the experience of a
particular cohort of high school graduates in postsecondary education,
military service, and postservice activities up to seven years after
graduation. This rich longitudinal file, although dated, can shed
considerable light on some of the unanswered questions in this study.
The resultan. information can be updated by other Rand research on
enlistment decisionmaking (using the National Longitudinal Survey of
[1] Analyses of this sort are being conducted in a related Randproject on enlistment decisionmaking that utilizes the 1978 NationalLongitudinal Survey of Labor Force Behavior as its database inconjunction with the 1979 DoD Survey of Personnel Entering MilitaryService.
-80-
Youth 14-22) and annual survey* of The American Freshman (see, for
example, Astint et al., 1981).
RECRUITERS IN THE POSTSECONDARY IIARKETPLACE
Recruiting in the postsecondary market has not been systematically
studied, and there are a number of reasons why it should be. First,
unlike the high school market, most recruiters are unfamiliar with the
postsecondary market; most have neither attended these schools nor
systematically attempted to recruit in this market. Second, two-year
college students, unlike high school students, move on and off campus
unpredictably; over 60 percernt of them are part-time students. Third)
these students have opted for additional education and not military
service after high school; tieir values and perceptions of military
service are bound to differ markedly from those of recruiters, most of
whom probably did not attend college before they joined the military.
There are, however, several characteristics of the postsecondary
education market that lead us to believe that a systematic recruiting
h effort can meet both the military's accession goals and the schools'
L goals of enabling students to successfully complete their studies and
finding employment afterwards for them. Thesr schools are remarkably
responsive to the economic and social environment compared with fo~ur-
year colleges and universities. In this era of high unemployment, they
appear to be quite willing to cooperate with the military, for example,
by adapting their vocational education programs to bettcr meet military
needs and by coordinating their career placement with military
recruiting. Moreover, two-year colleges have institutionalized a
counseling and guidance function that appears to be a natural link
between the colleges and recruiters.
-81-
We recommend, then, research on the interface between recruiters
and two-year colleges and vocational schools. Analyses of DMDC
2 accession files, for example, might identify recruiting districts that
are unusually successful in recruiting from the target market.
Interviews with recruiters and with local college administrators and
counselors will provide data on successful recruiting strategies. An
examination of successful recruiting strategies used in current pilot
studies by several branches of the armed forces in the target market
would provide another source of data. The goals of a study of the
recruiter-college interface would be to determine who, if anyone
special, should be selected to recruit in this market, what kinds of
preparation, if any, these recruiters need to work successfully in the
market, and what kinds of adjunct personnel (e.g., educational
specialists) and institutional arrangements might facilitate recruiting.
SURVEY OF THE MARKET
There are a number of reasons to believe that the postsecondary
education market can be penetrated. Many students' educational and
occupational aspirations are changing, a fact mirrored by their
behavior. Over 60 percent of the students are enrolled part-time;
transfers into and out of colleges are common. Instability in and
mobility among academic and vocational tracks and the labor force
* . characterize the behavior of many of these students. Furthermore, many
two-year college students have unrealistic educational and, occupational.
plans that tend not to be realized. Transfer rates, for example, from
two- to four-year colleges are, on average, quite low--around 6 percent
complete a two-year college and then transfer to four-year institutions.
-82-
Because the career plans and behavior of many students in postsecondary
educational institutions are in a state of flux, we believe that, with
the right recruitment incentives and strategies, this market might be
penetrated.
A survey of the two-year college and vocational school students and
institutions has much to commend it. Perhaps its greatest merit is
timeliness. Within a six-month period, a market survey should provide
information about the demographic characteristics, attitudes, and
aptitudes of the students, the attractiveness of enlistment incentives,
and the feasibility of recruiter strategies and media campaigns.
There are, however, several drawbacks to a market survey. We might
!% learn a lot about the students' intentions or plans and not about their
actual enlistment behavior. This is especially problematic for the
markets with which we are dealing. Students in two-year colleges tend
to be unrealistic planners. Also, there will probably be a considerable
K: number of students in the sample who respond frivolously or refuse to
respond at all.N On balance, we believe the potential benefits of a market survey
outweigh the drawbacks. Information on variables affecting verbal
reports of enlistment attractiveness provide a starting point from which
details of alternative enlistment packages can be developed. And
nonresponse, if the desire not to be surveyed is distinguished from
¾ negative attitudes toward the military, provides important information
about penetrability.
In designing a market survey, a number of factors should be taken
into account. First, a recruiter or college counselor should be able to
readily identify the demographic and other characteristics of the
-83
students measured in the survey. Information on student recruiting
based on characteristics that are not easily distinguishable is not of
much value. Second, the enlistment incentives examined in the survey
should be realistic, i.e., they should be options currently available to
the services or those that may be available in the near future. Finding
that a six-month term of enlistment would be quite attractive to these
students (see Fisher et al., 1975) is of small practical value. For
this and other reasons, the survey should be developed with input from
each branch of the service and, perhaps, the survey should identify the
particular branch with which the enlistment package is associated.
Third, the survey should provide information relevant to the selection
of recruiters and the development of recruiter contact and media
exposure strategies.
RECRUITING EXPERIMENT
The studies proposed above would provide information about the
penetrability of the postsecondary education market. However, each has
its shortcomings. The recruiter study does not directly bear on market
K penetrability. The analyses of existing data sets provide a baseline
for assessing penetrability by showing what enlistment rates from
different markets have'been and what studebit attributes- -such as
socioeconomic status, attitudes toward the military, and career plans--
are related to enlistments. But even very thorough studies of existing
data may shed little light on how changes in recruitment strategies
might affect recruiting in certain subpopulations. Sample surveys can,
at best, provide indirjict assessments of the attractiveness of
alternative recruiting practices; they cannot assess actual enlistment
behavior. The proposed studies provide a rational basis for framing
-84-
recruitment strategies in the postsecondary educeztion market, but before
considerable amounts of money, time, and human resourc~es are committed
to recruiting from this market, more direct evidence of recruitment
potential seems desirable.
To this end, we recommend examining the feasibility of conducting a
small-scale, controlled experiment to assess the penetrability of the
market. This experiment would examine the impact of alternative
recruiting incentives, recruiter strategies, and media campaigns on the
enlistment rates of students in two-year colleges and postsecondary
vocational schools. It would be implemented in a few two-year colleges
and vocational schools in several geographically diverse states. It
would be sequential--alternative recruiting incentives and strategies
would be continued until their feasibility for national implementation
was established. If ineffective strategies could be eliminated early in
the test the time and cost of conducting the study would be minimized.
In sum, there are a number of different studies that might be
conducted to ascertain the penetrability of the target market and the
associated costs. Taken together, the studies would provide a
reasonably comprehensive analysis of the target market and the
information needed for developing accession policies.
L
S- 85 - *2APPENDIX
-86-
10C Mr
moo0 ei-i-i- Ch0% UN a N qJ- 00 %a -
- co NO (UO MM% OTN N cc 40
oMN e y n-Ye C r or-- ( -taos~o NO% i-1m0CL4 .i .j > go . ..
M 6-%O *-OCM s NO WFl.-M6MM I 00 t800U)- N T - 1- u N t n%
e*'a -" v'retr ~CY~ in %mr-NM r
L6 M ul 0 o r-00 40 0 ,- 000 ýj WN
'0 - 4 a N c - cw-C14 C
0-C *AO..-G %r-N M - N OT0r- 46NI Ný 1 ý 8
(U ,-o N-wO I'-
00< CL VZMa(aL
CI , a (0W to C 443 n
-A CIJ- 0 O0(a 4J CI 0 0W C w ALC xC
a. L to C a W- -. 0 & .. 44 0 0 w-a(UU (U .: 9L CO a -C4(A-- 004. 4 W
41 4 0 C Ma0 MU Q- 00 QM i 0 r. =C - -4
(U 0)U- 4)o U ) Ma M O CIAML )
0 Ct o 0 Z > 0U U .MC L>
-87-
4; ; c; %noP
moo~,'
fft ff 0 aNV-hL - ý ( f GI- i
0~ty Il-
wic
. . . . . . .* . .0c; c NY~ @0@ ~'CNV 0 0 00-O
a
zd If
I-W w-tw Ntj' @%MW OC W%IO%O 0ýw t-o0-) 0 C %t0 V- M %a0in(4 I-I f"ff CN w-.*
0 f 00 Nw- 00 C;N, CC;0OX N
0 cc
0 IN- j ;7~- (a I. ) .-t(0 0
w ~0 COM C~0OOU- "'~r00*,N 00 m 000'a(Z 0 ' P4 0UDw %0 k %0* at *Nff6tiO NN I,-UN *0 0 00 wiC 00 'wf)8w 0 t-w
CLwE N LM -. N0OY sol m nl- -Nu~goo M'O t('o,^i
U)- 0A N~ M0P r 0 z
"I>>
a 0 4 UN ino O '-000 1,-i Oiin000N mw mmm)0cc) 00 wiC 0 %'f)CW 0 0
8 6 6 6Nor
* 03
tn 0V Z 0 -;Cf- 00 00 C 1.1
* ~ ~~~ 06U0 C tc
C4 10 cm > >b >A 0( -c'-Q (0
40 U 1 ! 0 ui~ i l ca0 ~tn-o o Ui L. 4) = I
I.. ~ ~ OJ. #AL - tA))- *0L -I0 0 06j t U0) 4Aco~.U C4I aE!4)4a.LAoz 0 IA-oQ'C qi* -0 W aW- 4--A auutO cf W a .0
V. - 2 =LL IA'Im .)0 M' 0a =0 M=MC=a-- . )-&
Q4 4) cp 4) to w z-ot A L
S-88-
Table A.2&
ATTRTIUTE PROFILE Of RIN ICOL IUNIONI PLANNING 10 h3?UU CETAINPOSTSECOMDAY ACTIVITIES (1980) STITAR D06TZATIOKS M KALE
,•lls Military Civilianlwur-na-r Twy-eai Service Labor Force All ,
(d) Indicators of Responsibili.tyROT(C 0.11 0.19 0.21Varsity Athletics 0.SO 0.50 0.49Other Athletic Team 0.50 0.50 0.50Honorary Clubs 0.33 0.23 0.26Student Government 0.37 0.34 0.31Have Job 0.49 0.47 0.46Days Absent 4,33 4.27 4,38Suspended 0.35 0.37 0.38Trouble with Law 0.23 0.23 0.28
(a) DemographicsFamily Income (thousands) 12.66 12.69 11.28Importance of Aid 0.78 0.75 0.76Family Owns HMO 0.36 0.36 0.40Number of Siblings 2.09 2.14 2.22Father is Professional 0.37 0.33 0.27Mother is Professional 0.00 0.00 0.00Father's Education 1.91 1.72 1.S0Mother's Education 2.46 2.34 1.79Proportion:
ASPIRATIONS OF HIGH SCHOOL SENIORS PLANNING TO UNDERTAKE CERTAIN
a; POSTSECONDARY ACTIVITIES (1980)
a. Standard-Deviations for Hales
College Military CivilianFour-year Two-year Service Labor Force All
Career Aspirations 16.71 18.70 16.21 18.08 20.64Professional Aspirations 0.47 0.49 0.39 0.38 0.49Age Hold First Regular Job 2.32 2.32 2.56 1.91 2.71Years Education Expected 1.87 1.98 2.38 1.75 2.54Years Ed. Expected by Mlother 1.98 2.20 2.69 2.41 2.50Ability to Complete Co~lltge 0.53 0.74 1.04 1.14 0.98Age Expect to Marry 2.42 2.57 2.86 2.85 2.72Age Expect First Child 2.39 2.56 2.84 2.85 2.71
b. Standard Deviations for Females
College Military CivilianFour-yer- Two-year Service Labor Force All
h Career Aspirations 15.39 16.64 13.69 15.38 17.56Professional Aspirations 0.45 0.50 0.43 0.44 0.50Age Hold First Regular Job 2.25 2.19 2.10 1.62 2.46Yars Education Expected 1.88 l.SBO 2.30 1.65 2.42
Years Ed. Expected by Mother 1.94 2.10 2.68 2.23 2.41Ability to Complete College 0.58 0.68 0.96 1.07 0.94
S Age Expect to Marry 2.28 2.31 2.70 2.55 2.61S Age Expect First Child 2.19 2.29 2.62 2.53 2.56
-95-
Table A.7
ASPIRATIONS OF HIGH SCHOOL SENIORS PLANNING TO ENTER TWO-YEARCOLLEGES OR VOCATIONAL/TECHNICAL SCHOOLS (1980)
a. Standard Deviations for Males
Two-year College Voc/TechAcademic Vocational School
Career Aspirations 18.41 17.32 15.36Professional Aspirations 0.50 0.44 0.34Age Hold First Regular Job 2.38 2.10 1.81Years Education Expected 2.00 1.76 0.94Years Ed. Expected by Mother 2.15 2.19 1.71Ability to Complete College 0.67 0.82 0.98Age Expect to Marry 2.52 2.60 2.61Age Expect First Child 2.51 2.60 2.73
b. Standard Deviations for Females
Two-year College Voc/TechAcademic Vocational School
Career Aspirations 16.29 16.42 15.00Professional Aspirations 0.49 0.49 0.43Age Hold First Regular Job 2.28 1.99 1.60Years Education Expected 1.91 1.42 0.98Years Ed. Expected by Mother 2.13 1.93 1.84Ability to Complete College 0.66 0.72 0.92Age Expect to Marry 2.26 2.37 2.50Age Expect First Child 2.26 2.30 2.35
-~ - -97-
REFERENCES
Astin, A. W., M. King, and G. T. Richardson, The American Freshman:National Norms for Fall 1981, American Council on Education,University of California at Los Angeles, 1981.
Baird, L. L., "Cooling Out and Warming Up in the Junior College,"Measurement and Evaluation in Guidance, Vol. 4, 1971, pp. 160-171.
Borus, M. E., "The Potential for Recruiting Military Personnel in TwoYear Colleges and Vocational Training Institutions," Ohio StateUniversity, mimeograph, 1982.
Breneman, D. W., and S. C. Nelson, Financing Community College: AnEconomic Perspective, Brookings Institution, Washington, D.C., 1981.
Broyles, S. G., and G. C. Davis, Education Directory: Colleges andUniversities 1981-82, National Center for Education Statistics,Washington, D.C., 1982.
Clark, B. R., "The 'Cooling-Out' Function in Higher Education," TheAmerican Journal of Sociology, Vol. 65, 1960, pp. 569-576.
Clark, B. R., "The 'Cooling-Out' Function Revisited," in G. B. Vaughn(ed.), Questioning the Community College Role: New Directions forCommunity Colleges, Jossey-Bass, San Francisco, Vcl. 32, 1980, pp.15-31.
Cohen, A. M., and F. B. Brawer, The American Community College,Jossey-Bass, San Francisco, 1982.
Dearman, N. B., and V. W. Plisko, The Condition of Education 1981Edition, National Center for Education Statistics, Government PrintingOffice, Washington, D.C., 1981.
Doering, Z. D., D. W. Grissmer, and J. S. Morse, 1979 DoD Survey of
Personnel Entering Military Servie: Wave 1 User s Manual andCodebook, The Rand Corporation, N-160O-MRAL, November 1980.
Fisher, A. H., L. D. Pappas, and S. Shepherdson, Navy RecruitmentPotential in Junior College, Hay Associates Technical Report 76-1,July 1975.
Grant, W. V., and L. J. Eiden, Digest of Education Statistics 1981,National Center for Education Statistics, Government Printing Office,Washington, D.C., 1981.
Haggstrom, G. W., The Pitfalls of Manpower Experimentation, The RandCorporation, P-5449, April 1975.
PREVIOUS PAGEIS BLANK
-98-
Heynes, B., and T. L. Hilton, "The Cognitive Tests for High School andBeyond: An Assessment," Sociology of Education, Vol. 55, 1982, pp.89-102.
Kanouse, D. E., G. W. Haggstrom, T. J. Blaschke, J. P. Kahan, W. J,Lisowski, and P. A. Morrison, Effects of Postsecondary Experiences onAspirations, Attitudes, and Self-Conceptions, The Rand Corporation,R-2616-HEW, April 1980.
Kay, E. R., Enrollments and Programs in Noncollegiate PostsecondarySchools 1978, National Center for Education Stiu.itics, Superintendentof Documents, U.S. Government Printing Office, Washii4:3n, D.C.,September 1979.
Kolstad, A., Attrition from College: The Class of 1972 Two and One-HalfYears After Hih Schcol Graduation, National Center for £ducationStatistics, ERIC #ED-168-396-1, WaniTngton, D.C., 1977.
Kormen, A. K., B. E. Goodstat, A. S. Glickman, and A. P. Romanczick, AnExploration Study of Enlistment Incentives Among Junior CollegeStudents, American Institutes for Research, AIR-32201-6/73-TN-1, June1973.
Levinsohn, J. R., L. B. Henderson, J. A. Roccoboro, and R. P. Moore,National Longitudinal Study: Base Year, First, Second, and ThirdFollo -up Data Fi1v Users Manual, 2 volumes, Research TriangleInstitute, Research Triangle Park, North Carolina, 1978.
Peng, S. S., W. B. Fetters, and A. J. Kolstad, Hi-J. School and Beyond:A Capsule Description of High School Students, National Center forEducation Statistics, Washington, D.C., April 1981.
McDonnell, L. M., and M. W. McLaughlin, Education Policy and the Role ofthe States, The Rand Corporation, R-2755-NIE, May 1982.
Pepin, A. J., and A. Q. Wells, Associate Degrees and Other Formal AwardsBelow the Baccalaureate 1978-1979, National Center for EducationStatistics, Washington, D.C., February 1981.
Pincus, F. L., "The False Promises of Community Colleges: ClassConflict and Vocational Education," Harvard Educational Review, Vol.50, 1980, pp. 332-361.
Testerman, D. E., "Imaginative Programs--A Military/CivilianPartnership," in K. F. Arns (ed.), Occupational Educational Tojay:New Directions for Community Colleges, Vol. 33, 1981, pp. 85-92.
Veterans Administration, Veterans' Benefits under Current EducationalPrograms: Fiscal Year 1981, RSN 70-82-1, Office of Reports andStatistics, Veterans Administration, February 1982.
-99
U.S. Bureau of the Census, Current Population Reports, Series P-25, No.870, "Estimates of the Population of the United States, by Age, Race,and Sex: 1976 to 1979," Government Printing Office, Washington, D.C.,1980.


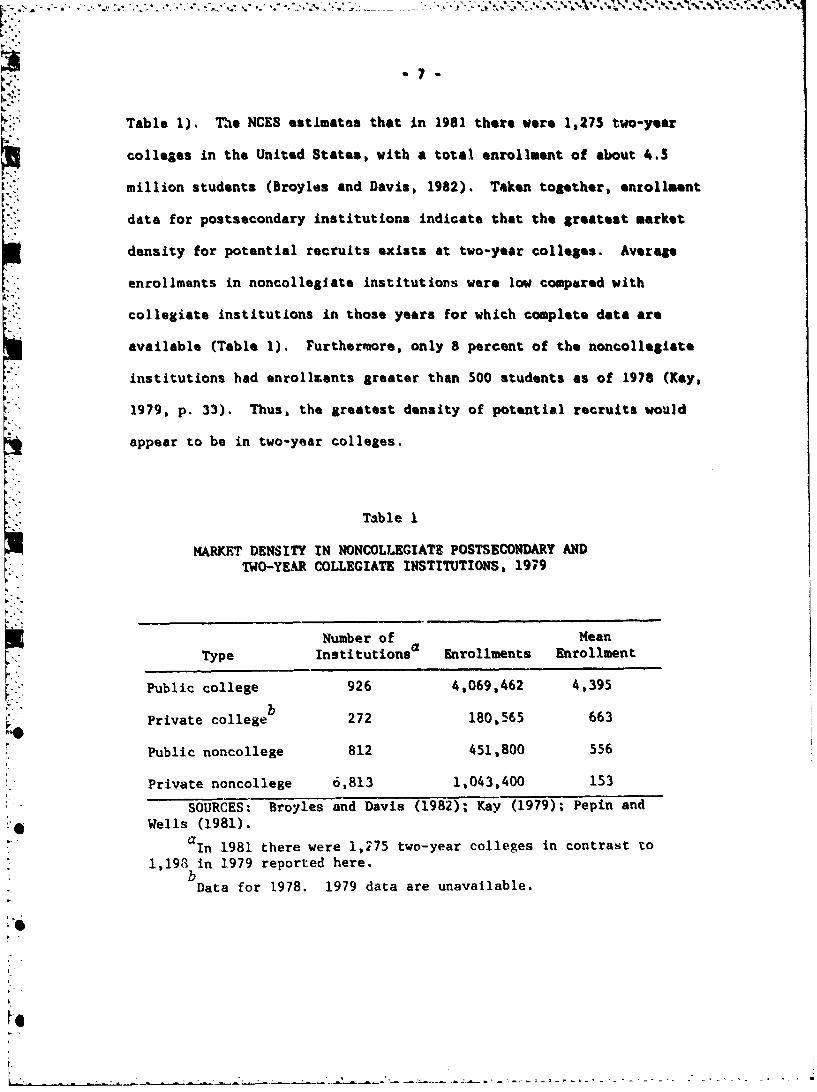


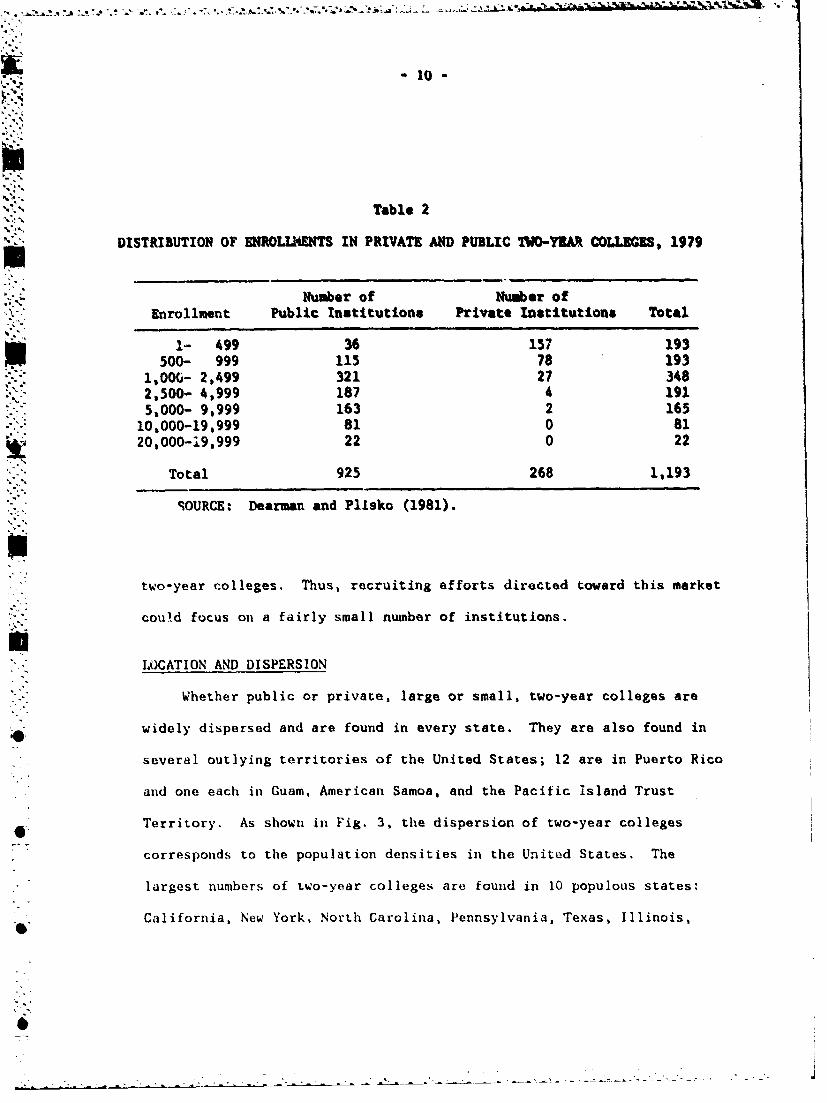


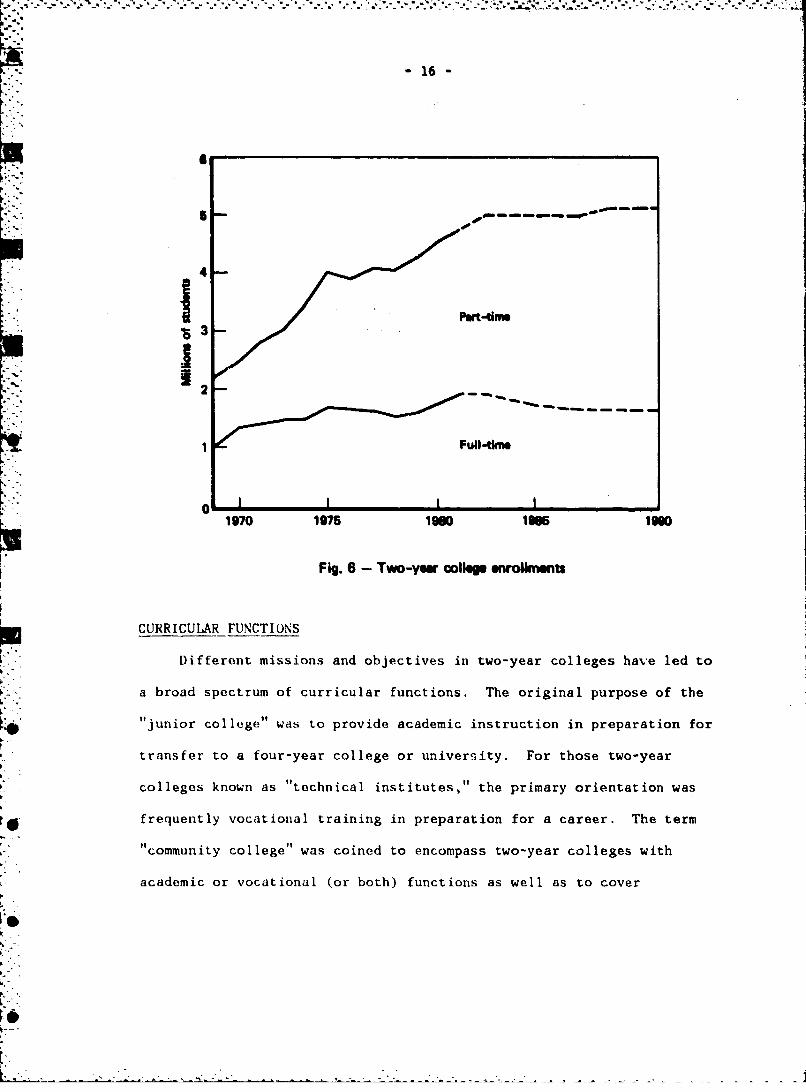


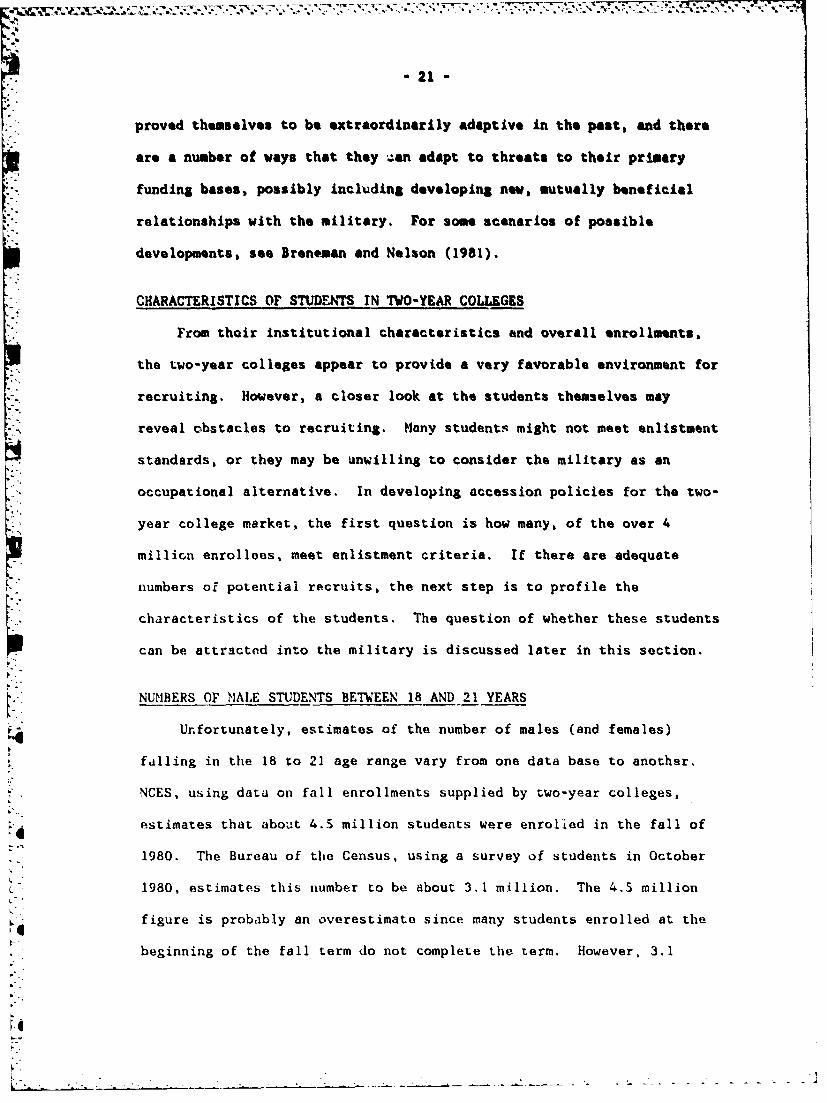


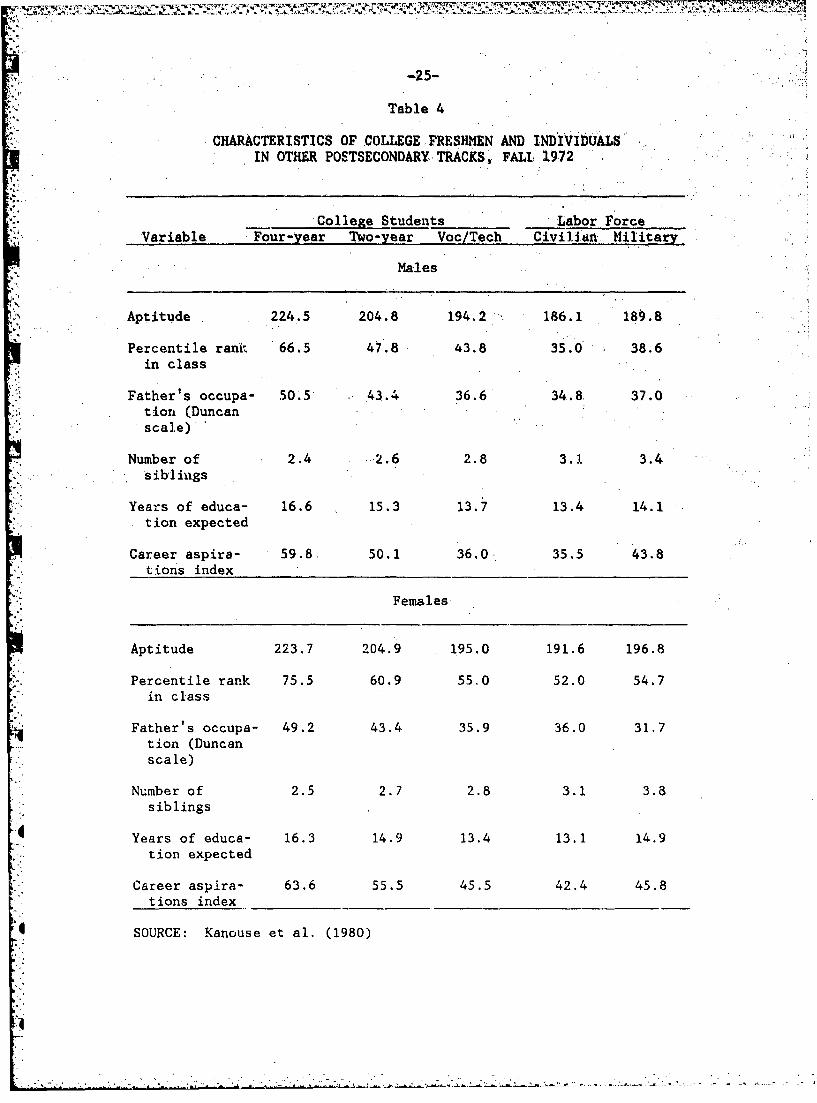


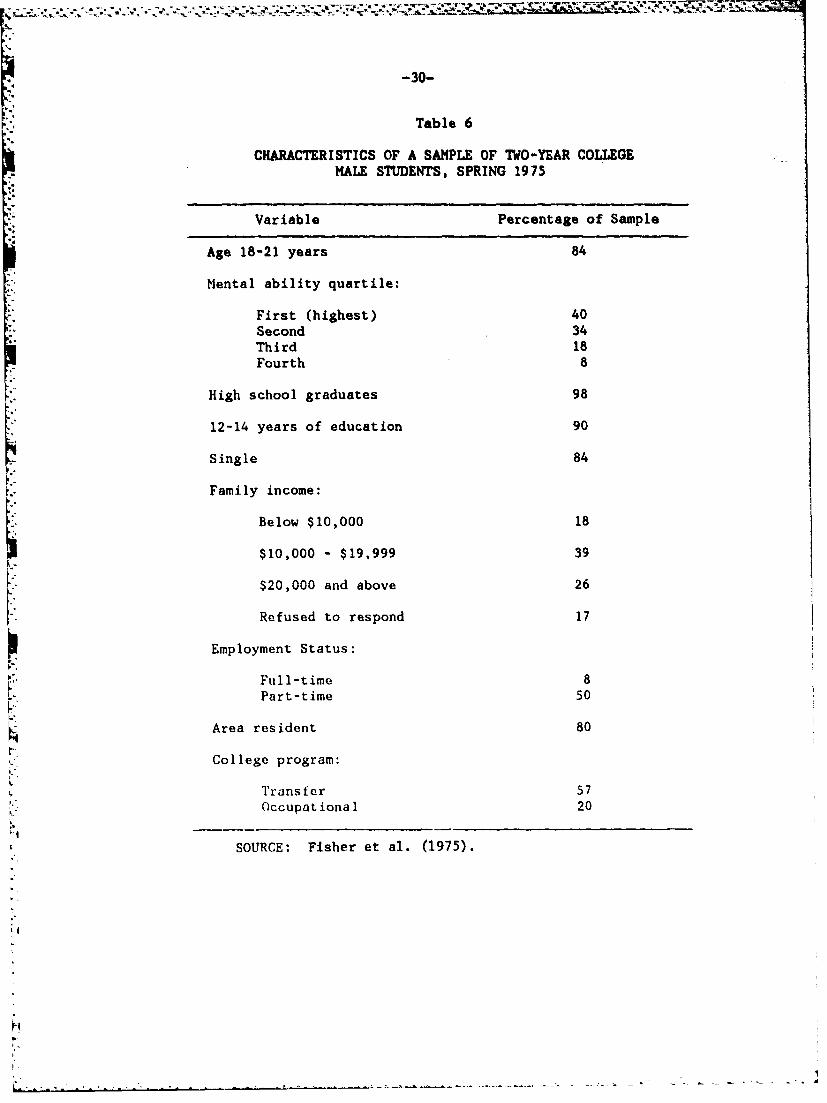
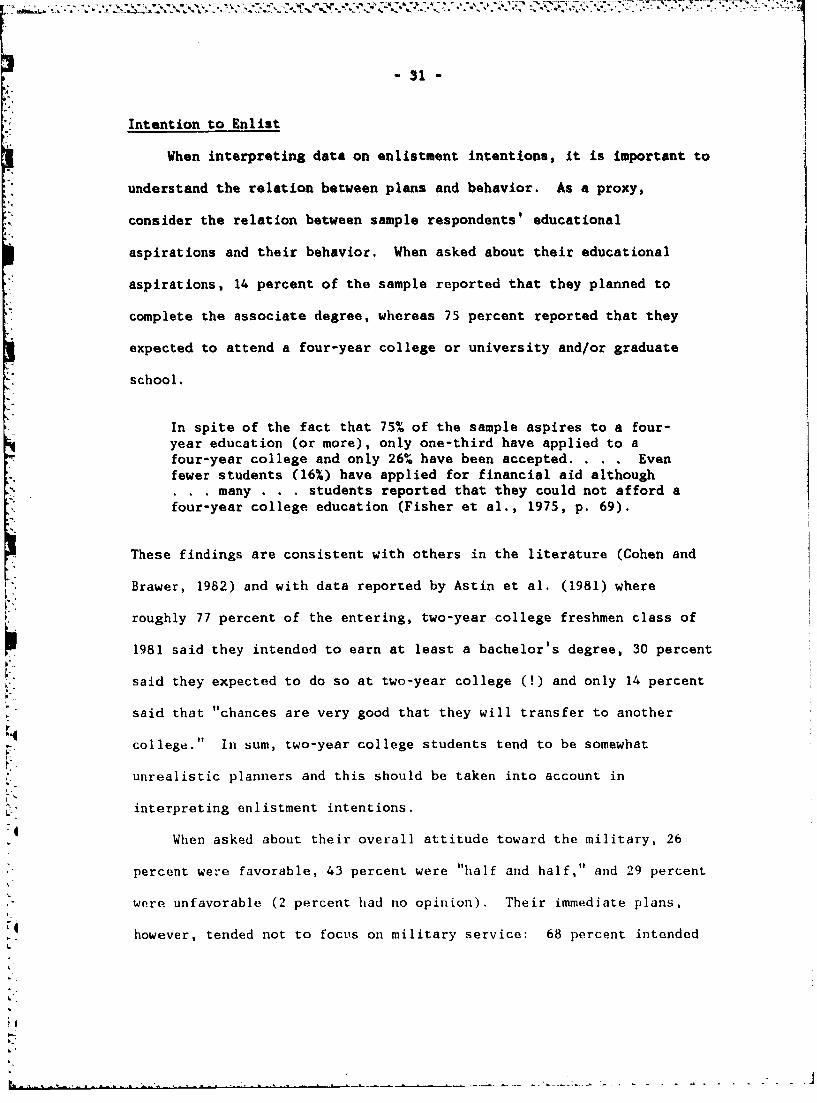


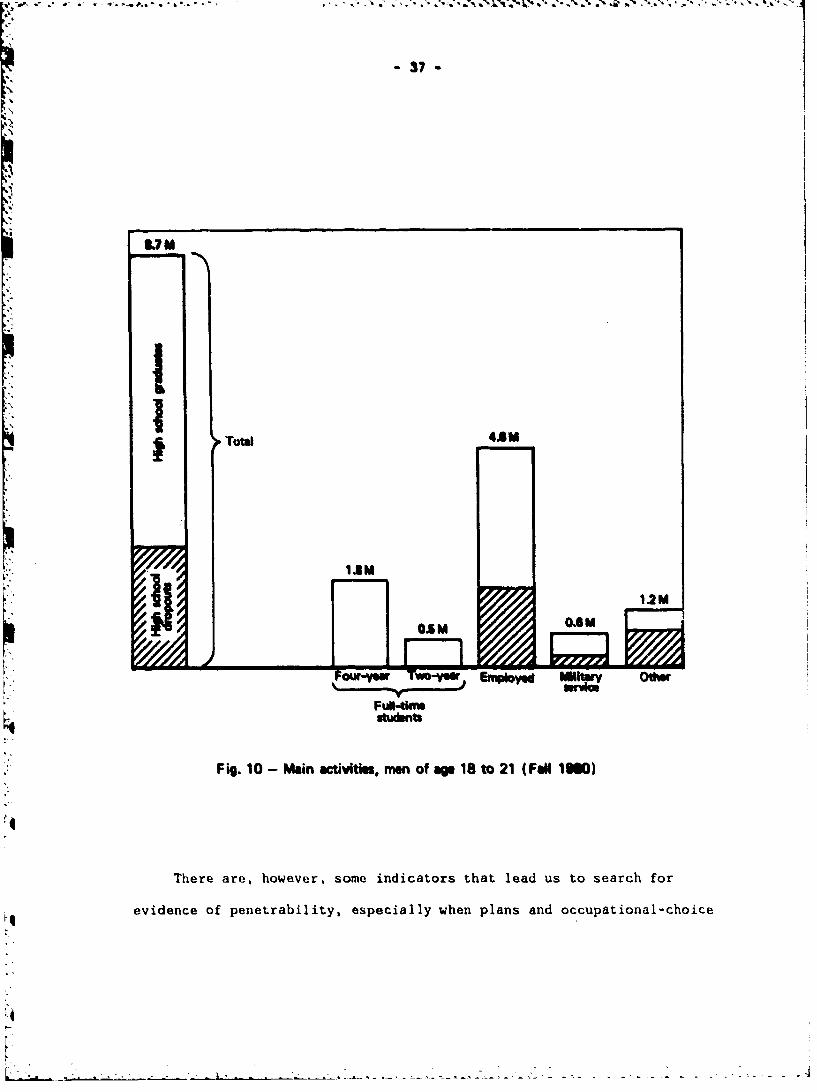


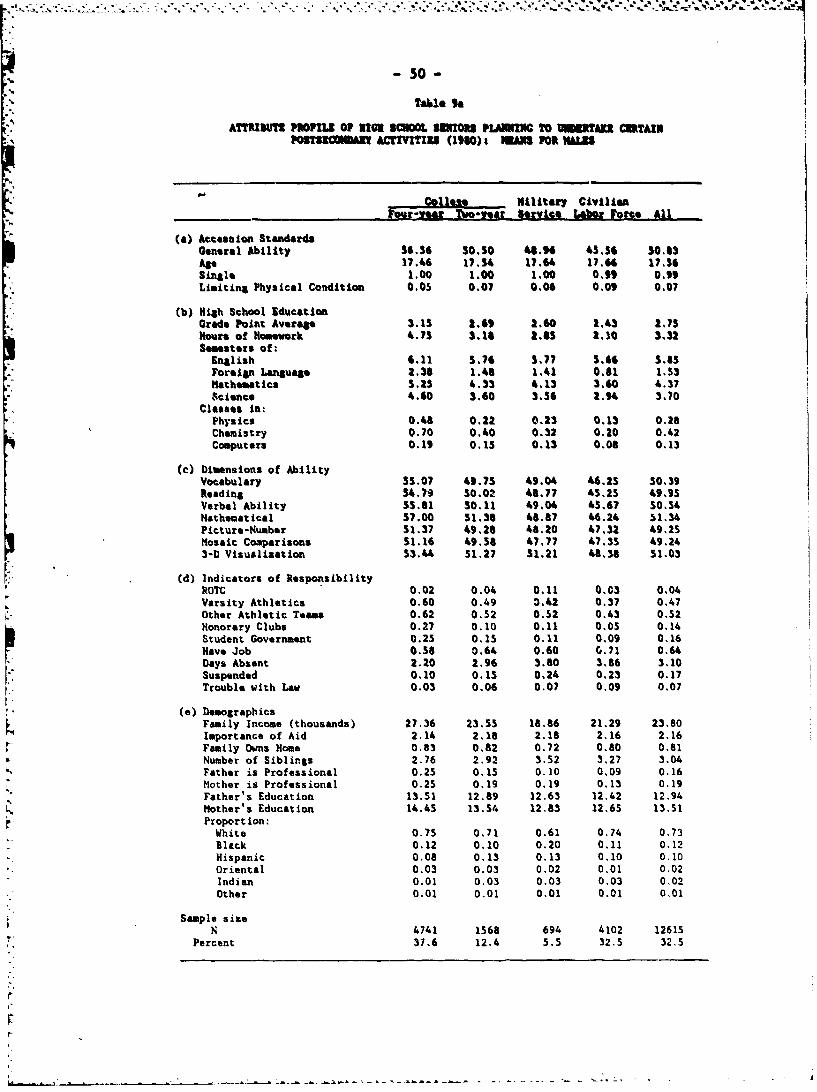


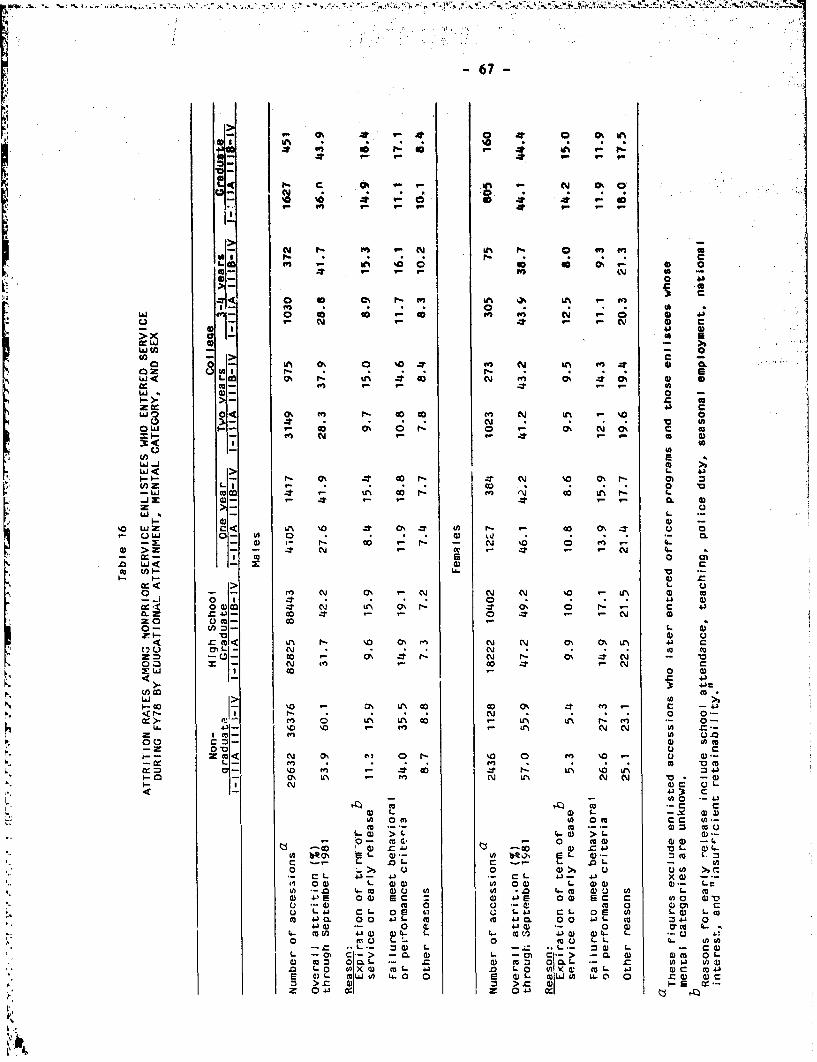


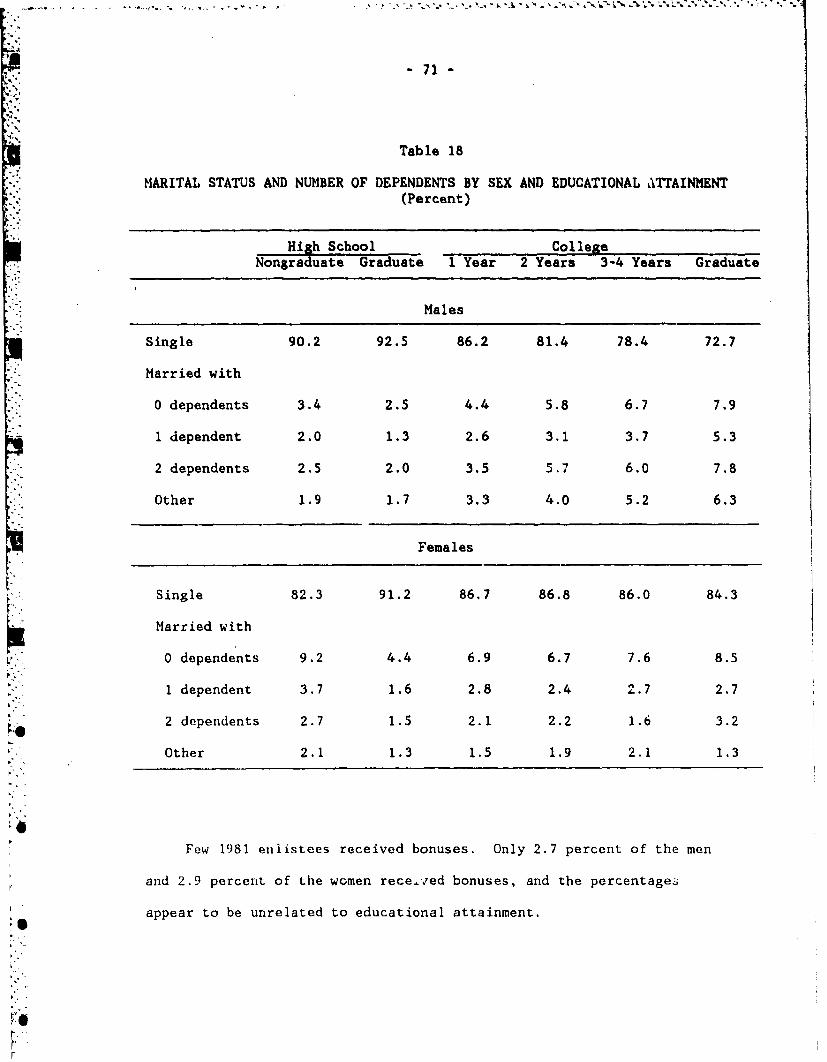


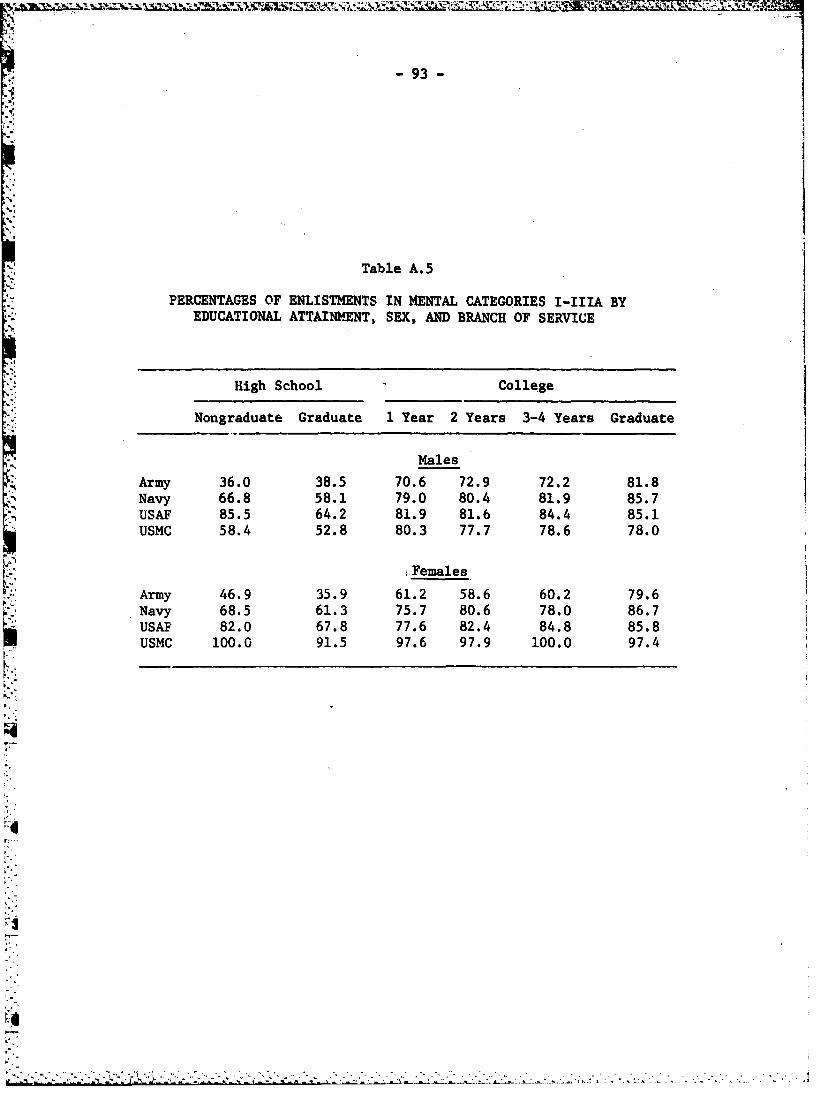


![Law and Morals -- Jurisprudence and Ethics...1945] LAW AND MORALS-JURISPRUDENCE AND ETHICS RoscoE POUND* I PRELIMINA Y :1 MORALS AND MORALITYThe relation of law to morals was one of](https://static.documents.pub/doc/80x56/5f4e54e42df7d5289a739b14/law-and-morals-jurisprudence-and-ethics-1945-law-and-morals-jurisprudence.jpg)


