46
RAND WATER PRESENTATION INTEGRATED ANNUAL REPORT For the FINANCIAL YEAR ENDING 30 TH JUNE 2018
RAND WATER PRESENTATION
INTEGRATED ANNUAL REPORT
For the
FINANCIAL YEAR ENDING 30TH JUNE 2018

• Rand Water provides bulk water
supply services to the municipalities
• Rand Water is the largest water utility
in Africa existing now for 115 years
• Distribution network of over 3 056km
of large diameter pipeline
• Feeding 58 strategically located
service reservoirs
• Main customers are:
Municipalities (18)
Mines(49)
Industries and direct consumers
(959)
• Rand Water supplies about 4508 Mℓ/d
on average (with peak day demand
close to 5008Mℓ/d)
Alignment to National Government
Strategic Overview & Performance
National
Development Plan
About Rand Water
2
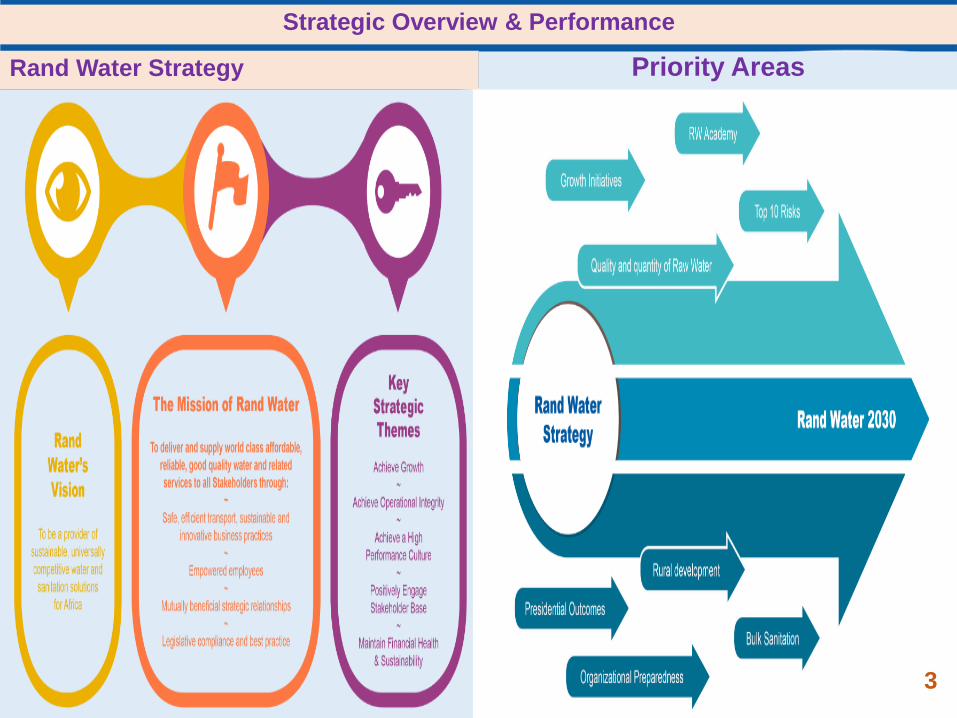
Rand Water Strategy
Strategic Overview & Performance
Priority Areas
3

Rand Water Area of Service
Water Sources & Area of Supply
Strategic Overview & Performance
Rand Water Governance Model
4

Rand Water Governance Mind Map
Strategic Overview & Performance
Governance Outcomes
5

Fraud Prevention Strategy
Strategic Overview & Performance
Top Ten Risk
6

Financial performance overview
*Excluding
borrowing costs
Revenue
R13.5 billion12% increase
(2017: R12 billion)
Total Asset
R27 billion12% increase
(2017: R24 billion)
Strategic Overview & Performance
7

Performance Snapshot
11,981
13,453 +1221
+251
8,000
9,000
10,000
11,000
12,000
13,000
14,000
2017Revenue
Price Volume 2018Revenue
Revenue analysisR”m
Strategic Overview & Performance
8

Operational Performance
9

1.30 1.27 1.28 1.27 1.301.23
2013 2014 2015 2016 2017 2018
Energy Usage
Mwh/ml
Energy Management
Security of
supply
Tariff
minimization
Energy
Efficiency
improvement
Energy
Cost
optimizatio
n Cogeneration Other
65.31 71.19
77.12
87.90
93.92 98.52
11%
9% 8%
14%
7%
5%
0%
5%
10%
15%
20%
25%
30%
-
10
20
30
40
50
60
70
80
90
100
110
2013 2014 2015 2016 2017 2018
c/k
Wh
Cost of Energy
c/kWh % growth yoy
Our Status
10

Environmental Bottom Line
SHEQ
Management
System
Work environment
• Work place standards
• Compliance to
applicable legislation
• Safety equipment fit for
purpose
• Cradle to grave practice
– hazardous
waste management
• Contract Management
• Equipment fit for
purpose
SHE Systems
OHSAS 18001 upgraded
to latest standards:
• ISO 14001
• ISO 9001
• Occupational Health
Management
Reporting
People Factor
• SHEQ Leadership commitment
at all levels
• Occupational Health
management
• Appropriate SHEQ training
• Effective communication across
the board
Our Compliance
11
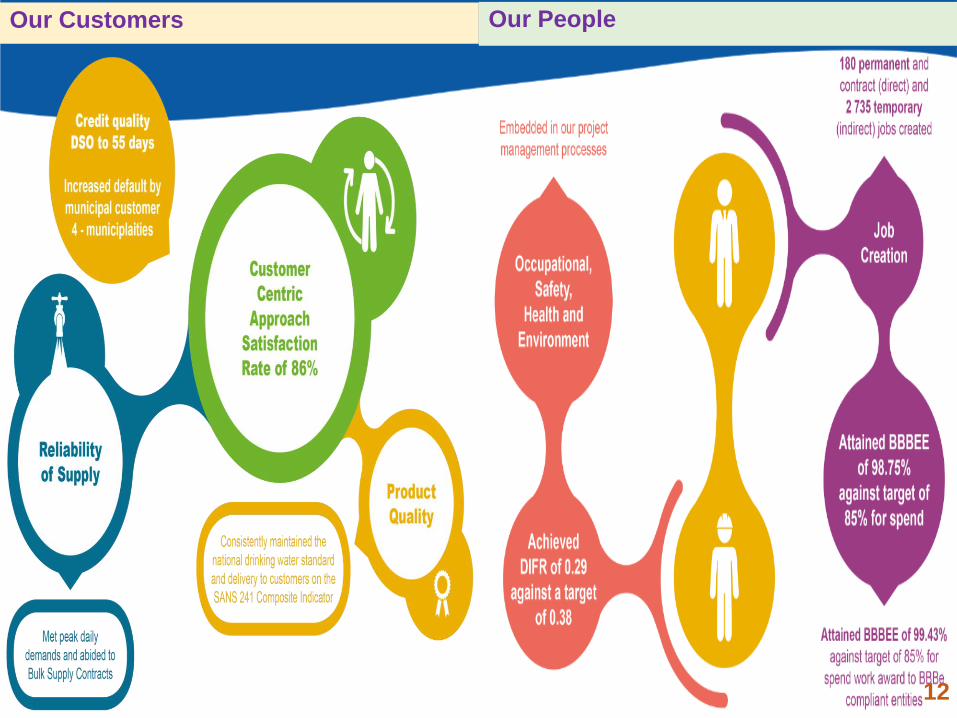
Our PeopleOur Customers
12

B-BBEE Report
80%
15% 15%
40%
98.75%
29.10%39.70%
53.73%
0%
20%
40%
60%
80%
100%
120%
B-BBEECompliant
entities
QualifyingSmall
Enterprises(QSE)
ExemptedMicro
Enterprises(EME)
Empoweringleast 51%
black owned
PREFERENTIAL PROCUREMENT
Target 2018 Actual
Maintained a B-BBEE status level 3
*Target according to the B-BBEE codes
of good practice of 2013
% of TMPS
Spent on
skills
development
for black
employees
R12.4m
Spent on
unemployed
black people
through
training
initiatives
R11.9m
Skills
developme
nt
2025
50
5
19.84 17.4
48.9
5
0102030405060
Managementand control
SkillsDevelopment
EnterpriseSupplier
Development
SocioEconomic
Development
Broad-Based Black Economic Empowerment
Target Achievement
Compliance to B-BBEE Requirements
13
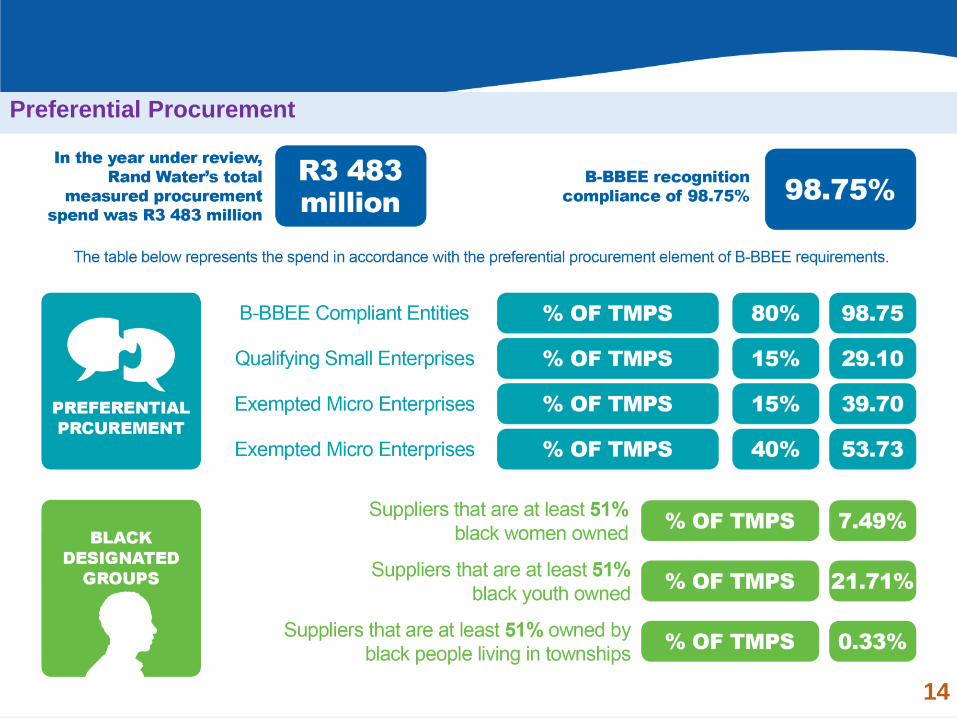
Preferential Procurement
14

Leadership Development & Learnership and Training
Leadership Development
Total Male
104
Total Female
29
Employment
Equity
• Female appointments at
M-Q bands as per the KPI
represented 68% against
a target of 54%. 26
females got appointed
against 38 appointments.
• The total percentage of
females in the
organization stood at
35.96%, represented by
1,131 females against a
total permanent staff of
3,145.
• The total number of
people with disabilities
stood at 3.91%, against a
target of 4.5%. However,
this is way above the
national minimum target
of 2 percent across the
public sector.15

Community & Employment Equity
BURSARIES Female Male
Internal Bursaries 18.1
(Employed)98 72
External Bursaries
18.2 (Unemployed)17 15
Total 115 87
Giving Back to
Community
Legislative Training
Male
Female
2,110
1,027
Learnership Programmes
Graduate in Training/
Experiential Students
Water Purification
Learnership
54
61
16
35
16

Human Capital Bottom Line
17

Contribution to Government
and Minister’s Performance
Agreement
18
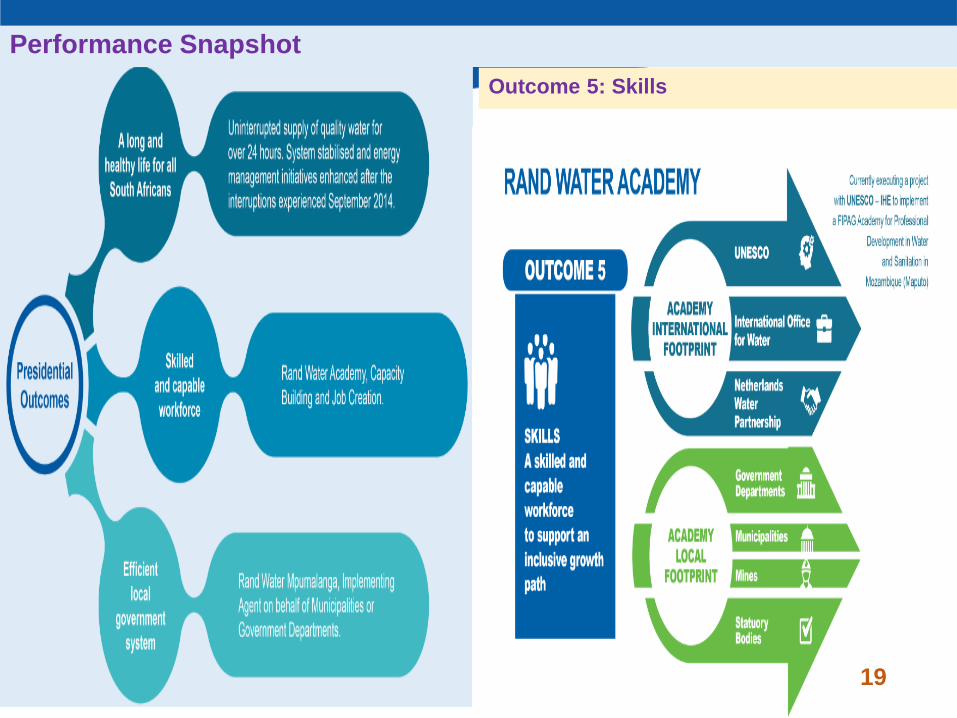
Performance Snapshot
Outcome 5: Skills
19

19
9 117 7
15
68
0
10
20
30
40
50
60
70
80
Engineers ConstructionProject
Management
GeographicInformation
Systems
NaturalSciences
QuantitySurvey
TownPlanning
Total
Graduate Intake (NT 2, NT 3 & NT 80)
Number of Graduates
Rand Water Academy Pillars:
Research Platforms | Centre of Excellence | Centre of Competence | International Water Professionals Exchange Hub | WAT/SAN Solutions
Rand Water Academy
A skilled and capable workforce to
support an inclusive growth path
NATIONAL TREASURY GRADUATE INTERNSHIP PROGRAMME RURAL DEVELOPMENT GRADUATE INTERNSHIP PROGRAMME
Total
Legal
Engineering
Information Technology
Process Controller
Human Resources
Finance
23
2
9
5
3
2
2
Intake: NT 2
Intake: NT 3
Intake: NT 80
Started May 2013-due to complete in December 2018 (period
was extended from 3 to 5 years). Two learners resigned for
permanent employment opportunities.
28 Apprentices who have completed the programme have
been employed on War on Leaks programme on a fixed term
contract.
Started June 2017- May 2020
All the other disciplines - Started June 2017- May 2020
10 more to be recruited to top up compliment to 80
Intake: RD 1
Intake: RD 2
Take: RD 3
Current progress
Started in 2014 to complete in 2018
Total of 10 graduates
Started in 2015 to complete in 2018
Total of 5 graduates
Started in 2015 to complete in 2018
Total of 8 graduates
42.5% Graduates are permanently employed.
9 Graduates are permanently employed by Rand Water and
8 are externally employed
Outcome 5: Skills
20

0
1000
2000
3000
4000
5000
6000
7000
Phase 1 Phase 2
1624
2913
921
3929
2545
6842
WAR ON LEAKS TRAINEE HEADCOUNT
(as at 30 June 2018)
Artisans Water Agents TOTAL PER PAHSE
Rand Water Academy
WAR ON LEAKS PROGRAMME
TRIPARTITE AGREEMENT PARTNERS
Current Headcount:
Phase 1 =
Phase 2 =
9 387 Trainees
2545
6842
A skilled and capable workforce to
support an inclusive growth path
Outcome 5: Skills
21
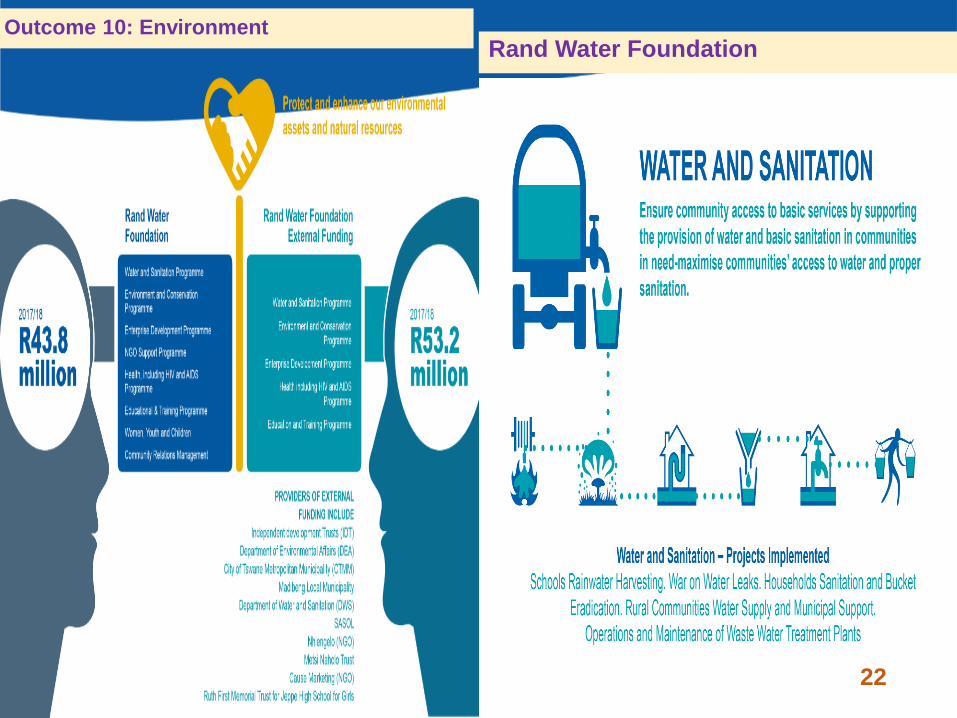
Outcome 10: EnvironmentRand Water Foundation
22

Financial Performance
Financial Strategy
23

Financial Performance Overview
Revenue
R13.5 bnGross Income
R4.7 bn
Net Income
R3.1 bn
Net cash from
operations
R2.5 bn
Capital expenditure
R2.1 bn Including Borrowing costs
12%
19%
33%
106%
-17%
2,392
2,806
3,561
3,982
4,737
20.0%
22.0%
24.0%
26.0%
28.0%
30.0%
32.0%
34.0%
36.0%
-
500
1,000
1,500
2,000
2,500
3,000
3,500
4,000
4,500
5,000
2014 2015 2016 2017 2018
Gross Income
Gross Income GP margin
1,1821,438
2,1312,375
3,148
0.0%
4.0%
8.0%
12.0%
16.0%
20.0%
24.0%
28.0%
-
400
800
1,200
1,600
2,000
2,400
2,800
3,200
3,600
2014 2015 2016 2017 2018
Net Income
Net Income Net Income margin
1,4291,694
2,478
1,237
2,547
-
400
800
1,200
1,600
2,000
2,400
2,800
2014 2015 2016 2017 2018
Net Cash from Operations
Financial Performance
24
8.0
%
8.0
%
10
.2%
10
.3% 12
.1%
7.7
%
7.8
%
10
.1%
10
.2% 1
2.2
%
0.0%
2.0%
4.0%
6.0%
8.0%
10.0%
12.0%
14.0%
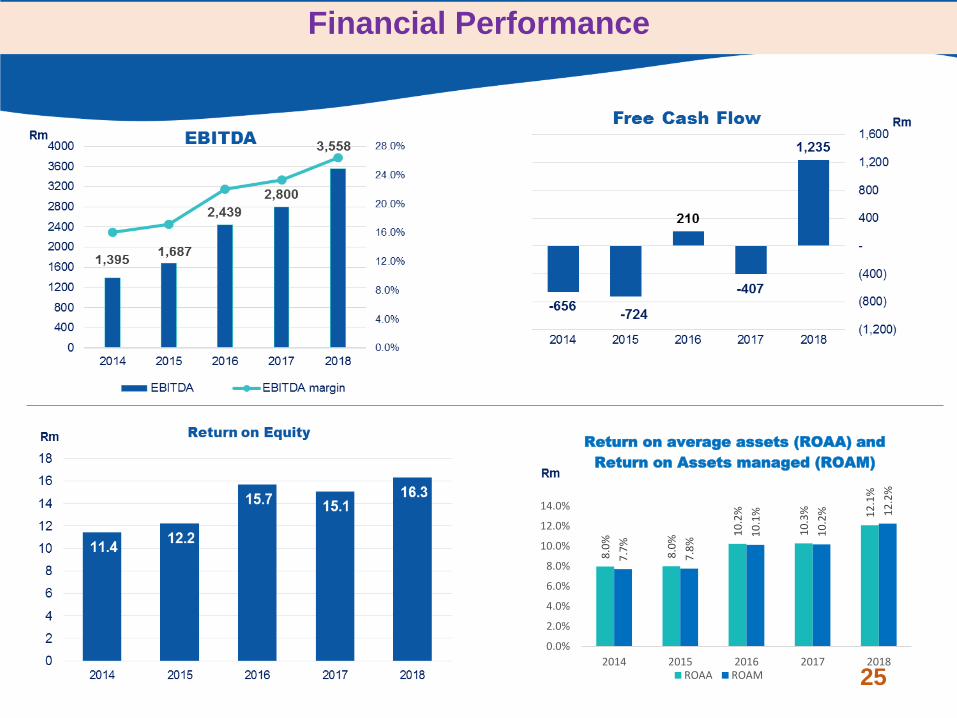
2014 2015 2016 2017 2018
Return on average assets (ROAA) and
Return on Assets managed (ROAM)
ROAA ROAM
Financial Performance
25

Ploughing Back Our Net Income
Delays on Capex
programme due
unforeseen delays in
rolling out the new
sourcing strategy.
Increased cash
generated from
operations resulted in
no debt requirement
Remain focused on
process efficiencies.
Cost Containment
initiatives continued
25252685 2991
2583
3148
22052580
2914
2222
1,787
87% 96%
97% 86%
57%
0%
20%
40%
60%
80%
100%
120%
0
500
1000
1500
2000
2500
3000
3500
2014 2015 2016 2017 2018
Budget Capex % Achievement
R’m
Capital Expenditure Performance
29.4%
35.8% 34.0%
27.9%23.4%
0%
10%
20%
30%
40%
2014 2015 2016 2017 2018
Actual
Debt to Equity
3.5
3.43.3 3.4 3.4
310425 638 693
923
2.5
3.0
3.5
4.0
2014 2015 2016 2017 2018
0
500
1,000
Th
ousands
Number of employees Profitability per employee
R'k
l
Profitability & Productivity
Financial Performance
26

Consolidated Financial Results 2018
Cost Breakdown
For the year ended 30 June
2018
R million
2017
R million
Revenue 13 453 11 981
Operating expenses 9 895 9 182
Depreciation and Amortisation 482 438
Total operating expenses 10 377 9 620
49%
20%
3%
8%
20%
Cost of rawwater
Energy
Chemicals
Other costs
Labour
47%
21%
3%
9%
20%
Cost of rawwater
Energy
Chemicals
Other costs
Labour
4,842 4,308
1,994 1,931
322 289
728 816
2,008 1,837
482 438
2 0 1 8 2 0 1 7
R M
Cost of raw water Energy Chemicals
Other costs Labour Depreciation
Figures include the split of non-potable & recoverable COS
Cost breakdown – Operating Expenses Net Operating Expenses
20172018
Financial Performance
27

Statement of Financial Performance
For the year ended
30 June
2018
R million
2017
R million
Revenue 13 453 11 981
Net operating expenses (9 895) (9 182)
EBITDA 3 558 2 799
Depreciation and amortisation (482) (438)
Income from operations before net
finance costs3 076 2 362
Net investment income 72 13
Taxation - -
Net income for the year 3 148 2 375
Net finance income 2018 2017
Total finance costs 463 489
Borrowing costs capitalised (316) (308)
Finance costs expensed 146 181
Total finance income (218) (194)
Net Investment Income (72) (13)
3155
298
0
-305
3148
(500)
-
500
1,000
1,500
2,000
2,500
3,000
3,500
RandWater
RWS RWF InterCompany
Adj/El
RW Group
Net income contribution
• Other operating expenses reduced from
R550m in 2017 to R446m in 2018 mainly
attributable to:
• Reduction in impairment of debtors
by R105m;
• Included in the net investment income
(finance income) is interest charges on trade
receivables of R67m (2017:R41m), which
have grown by 63.6%.
Financial Performance
28

Statement of Financial Position
For the year ended 30 June2018
R million
2017
R million
ASSETS
Non-current assets 22 168 20 547
- Retirement benefit asset 15.6 10.4
Current assets 4 756 3 462
- Cash and cash equivalents 1 787 805
Assets of disposal groups 2.4 0.5
TOTAL ASSETS 26 927 24 010
Working capital movementsJune 2018
R’m
June 2017
R’m
Movement
R’m
Inventories 485 410 75
Trade and other receivables 2 481 2 244 237
Trade payables (3 228) (3 467) 239
Income received in advance (409) (409) -
Working capital movements (671) (1 222) 551
Provision for bad
debts for the 2018
year increased by
9% to R512m (2017:
R469m).
Financial Performance
29
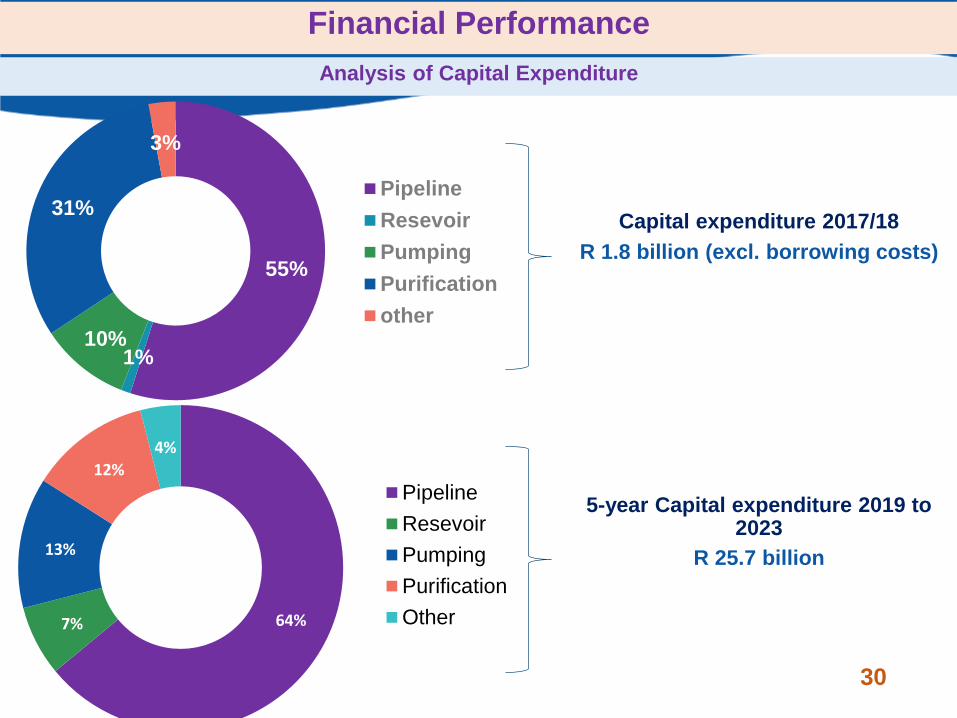
Analysis of Capital Expenditure
55%
1%10%
31%
3%
Pipeline
Resevoir
Pumping
Purification
other
64%7%
13%
12%
4%
Pipeline
Resevoir
Pumping
Purification
Other
R 1.8 billion (excl. borrowing costs)
R 25.7 billion
Capital expenditure 2017/18
5-year Capital expenditure 2019 to 2023
Financial Performance
30

Debt Profile
Financial Performance
Balance Sheet Flexibility
Rand Water Improved Cost of Debt
31
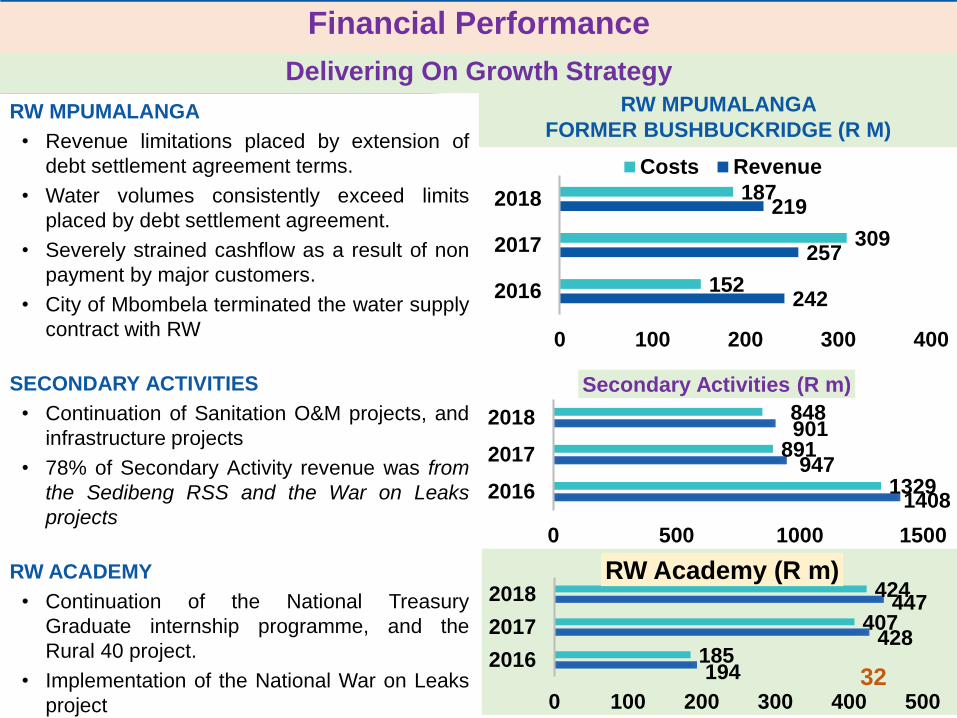
Delivering On Growth Strategy
RW MPUMALANGA
• Revenue limitations placed by extension of
debt settlement agreement terms.
• Water volumes consistently exceed limits
placed by debt settlement agreement.
• Severely strained cashflow as a result of non
payment by major customers.
• City of Mbombela terminated the water supply
contract with RW
SECONDARY ACTIVITIES
• Continuation of Sanitation O&M projects, and
infrastructure projects
• 78% of Secondary Activity revenue was from
the Sedibeng RSS and the War on Leaks
projects
RW ACADEMY
• Continuation of the National Treasury
Graduate internship programme, and the
Rural 40 project.
• Implementation of the National War on Leaks
project
194
428
447
185
407
424
0 100 200 300 400 500
2016
2017
2018RW Academy (R m)
242
257
219
152
309
187
0 100 200 300 400
2016
2017
2018
Costs Revenue
1408
947
901
1329
891
848
0 500 1000 1500
2016
2017
2018
Secondary Activities (R m)
RW MPUMALANGA
FORMER BUSHBUCKRIDGE (R M)
Financial Performance
32

Irregular, Wasteful & Fruitless Expenditure as at 30th June 2018
33

• For the year under review the Group recorded R117 million worth of expenditure incurred as a result of
irregular expenditure and R11.8 million worth of fruitless and wasteful expenditure.
• No material cases of criminal conduct has been recorded for the year.
• R1.2 million of the irregular expenditure incurred in prior years has been condoned in the current
financial year.
• R37.6 thousand has been recovered in the current year.
• The Group is still in process of obtaining approvals for the condonation of the remaining balance of
R20.9 million for irregular expenditure incurred in prior years.
Irregular, Wasteful & Fruitless Expenditure
Irregular expenditure: R117m
Details of the current financial year movements are as follows:
• Employees attending training without following SCM processes
R48 thousand:
• Five instances of variations for goods and services in
contravention of SCM Instruction note 3 of 2016/17 (R3 million);
• Contractual Agreements reached expiration and were up for
renewal or re-negotiated in contravention of supply chain
management policy (R2.5 million);
• The Contravention of the Car Allowance and reimbursement
policy by employees submitting improper travel claims and
other services rendered to RW non-compliance to SCM policy
(R200 thousand)
• Tender closing date extended without re-advertising (R11.5
million);
• Bid Splitting (R1.3 million) and
• Payments exceeded approved contract amount without variation
approval (R99 million).
• Security Contracts (R950 thousand)
• Other contracts (R98 million)
Potential Irregular Expenditure
Potential irregular expenditure
disclosed that requires further
investigation, confirmation and
quantification:
• Minor Works Contract
(RW01155/14)
• Quotations not being
advertised on the e-Tender
Publication Portal as per
National Treasury Instruction
number 1 of 2015/2016.
• Potential Bid Splitting
(Potential R2 million)
• ISS System (Potential R6
million )
• SCM Practice Note 3 of 2003
: Panel of Manufacturers -
rate based (Potential R188m)34

Fruitless and Wasteful and Irregular expenditure and criminal conduct
As per National Treasury – Updated Guideline on Irregular Expenditure, the following 2
paragraphs highlight the need for this note to be updated upon the financial statements
being published.
RECORDING OF IRREGULAR EXPENDITURE IN THE ANNUAL FINANCIAL STATEMENTS
If such enquiries or investigations are not concluded by the date on which the annual
financial statements are published, a narrative to this effect must be included in the irregular
expenditure register.
If irregular expenditure occurred during the year under review and is only discovered during
the audit, the validity thereof must be confirmed before the audit is finalised. If an
investigation is still in progress after the audit is completed, then a narrative to this effect
should be included in the irregular expenditure register.
Fruitless and wasteful expenditure: R11.8m
Details of the current financial year movements are as follows:
The appointed contractor instituted legal proceedings against Rand Water for damages and
loss of profit suffered, resulting from inaccessibility to work on a site that was denied by
the municipality (The municipality was the beneficiary). This was in order to proceed with
the commissioned scope of work as per the concluded contract. Rand Water is in the
process of claiming the monies from the Municipality, as it is the action of the Municipality
that has led to the claim against Rand Water.
Irregular, Wasteful & Fruitless Expenditure
35

Progress to date on potential Irregular
Expenditure identified during 2018 Financial
year
Potential Irregular Expenditure pertaining to
the prior period
The details below indicates potential irregular
expenditure identified in the prior year including
details on the status to the current reporting
period. The following matters were reported in the
prior year as potential irregular expenditure:
Potential Minor Works
• Contract (RW01155/14) relates to awarding
projects over the approved and budgeted limit
of the BAC and stipulated thresholds. Awaiting
the outcome of the ongoing investigation.
Potential quotations not being advertised on
the e-Tender Publication Portal
• Quotations not being advertised on the e-
Tender Publication Portal as per National
Treasury Instruction number 1 of 2015/2016.
The investigation on this matter is still in
progress.
Irregular, Wasteful & Fruitless Expenditure
Potential Bid Splitting (Potential R2.0 million)
• The matter is being investigated in order to
determine the validity of possible bid splitting
by approximately four suppliers. The outcome
of the investigation is still pending.
ISS System (Potential R6.0 million)
• Quotations awarded through the ISS system
could not be verified, due to first time system
application. The system was subsequently
shut-down, however investigation is required
to validate the quotations awarded. The
investigation has not yet been concluded.
SCM Practice Note 3 of 2003 - rate based
(Potential R188.0 million)
• The Panel/Term Contract awarded to
manufacturers to supply and deliver steel
pipes are under investigation and have been
queried with National Treasury in terms of its
validity and possible application of the said
Practice Note. The contract was awarded
through a normal tender process. Rand Water
differs with the auditors on the applicability of
the National Treasury Practice Note 3 of 2003
to this transaction. The matter is being
investigated and National Treasury
interpretation of this transaction is being
sought. 36

Tariff Consultation Process
37

Tariff Consultation Process And Important Timelines
DWS / TCTA raw water pricing 30th September
2018
Board Approval of Proposed Tariff 15th October 2018
Customer consultation and information sharing with DWS and National Treasury
National Treasury 22nd October 2018
DWS 22nd October 2018
SALGA 23rd October 2018
Water Services Forum 24th October 2018
Consulting with Mines and Industries 25th October 2018
Submission to Treasury and SALGA for input 26th October 2018
SALGA National Office 7th November 2018
SALGA Gauteng Regional Office 27th November 2018
DWS 26th November 2018
National Treasury 6th December 2018
National Treasury Response to Proposed Tariff 20th December 2018
SALGA Response to Proposed Tariff 10th January 2019
Board Approval of Submission to DWS 24th January 2019
Submission to DWS for Parliamentary approval 25th January 2019
Parliamentary approval 20th March 2019
Implementation 1st July 2019
38

• The concern with the overall inflation is that most cost elements are way outside the 3% -
6% inflation targeting range.
• Over the past four years, CPI has continued to remain very close to the upper limit.
• It therefore becomes difficult to expect the bulk potable water tariff to be within this
range.
• Rand Water’s tariff is determined by the cost of doing business in the year that the tariff
will be applicable
2019 2020 2021 2022 2023 2024
CPI (headline) 5.70% 5.40% 5.10% 5.10% 5.10% 5.38%
PPI 5.63% 5.23% 4.90% 4.90% 4.50% 5.88%
Exchange Rate (R/US$) 14.24 14.32 14.44 14.52 14.74 15.73
Labour 8.03% 7.75% 7.85% 7.75% 7.85% 8.13%
Eskom applies to NERSA for its energy tariff increments. The concern with these applications
is the significant difference between Eskom’s application and NERSA’s eventual approved
energy tariff increment.
The other difficulty for Rand Water is that the Eskom tariff application is not aligned to the
water sector tariff consultation cycle. In some years Eskom has applied for its tariff increment
in November or December. As demonstrated above, Rand Water has had to adjust its tariff
accordingly.
The additional concern is that even though Eskom’s tariff is significantly changed by NERSA,
the regulator still gives Eskom an opportunity to resubmit during the financial year.
On 2nd October 2018, NERSA approved an additional 4.41 per cent energy tariff increment.
Rand Water also sources its energy from Emfuleni, Johannesburg and Ekurhuleni.
Energy Impact on Tariff
Strategic Issues
39

PROPOSED TARIFF
Rand Water’s
current
gazetted tariff
is 958 cents
per kilolitre.
Therefore
Rand Water’s
new
proposed
gazetted
price is 1009
cents per kl -
a 7.9 per cent
tariff
increment.
Municipalities Current Tariff(1 July 2018 – 30 June 2019)
New Tariff(1 July 2019 – 30 June 2020)
Tariff Increment 7.9%
C/kl C/kl
Tariff 935.183669Excluding VAT at 15 per cent
1009.063179Excluding VAT at 15 per cent
Rand Water Tariff = Rand Water Internal Inflation 2020
% Forecast Percent Weighted
Year-End ~ 30 June Increase 2020 of total
% R m % %
DWS 3.8% 1262 10.2% 0.4%
TCTA 8.7% 4583 37.0% 3.2%
Raw Water 7.6% 5845 47.2% 3.6%
Energy - Eskom 6.2% 1010 8.2% 0.5%
Energy - Municipalities 7.2% 1247 10.1% 0.7%
Chemicals 11.5% 539 4.4% 0.5%
Multi-Partnered Uncontrollable Costs 8641 69.8% 5.3%
Labour 7.25% 2089 16.9% 1.2%
Depreciation 18.6% 643 5.2% 1.0%
Other 4.8% 998 8.1% 0.4%
Total 12371 100.0% 7.9%
Target tariff increase 7.9%
for Financial Year Ending 30th June
40

Rand Water submits a 7.9 per cent tariff increment.
This tariff may be significantly affected by the energy tariff increment that is not yet
finalised by NERSA. This is a pass-through cost that will affect Rand Water’s proposed
tariff if it is different from current energy tariff increment projections. The new energy
tariff increments, when announced by NERSA, may also affect assumptions in the
following 2 years.
This tariff may be affected by a significant increase on the raw water for the remaining 3
months of the financial year ending 30th June 2020. Rand Water and National Treasury
note the significantly low projected tariff of 3.87% which may change from such a low
base thus affecting Rand Water’s tariff and financial position.
Rand Water is given an opportunity to implement a stepped tariff (or a package to
manage exceeding set limits) in the event of a drought announced by the Honourable
Minister.
Rand Water starts engaging with local municipalities with regards to factors that may
lead to the introduction of a stepped tariff, for example, limitations on the amount of raw
water that Rand Water is able to abstract.
With regard to Bushbuckridge Local Municipality (BLM), Rand Water had proposed a 5.4
per cent tariff increment (projected CPI) for the 2019 / 20 financial year for the
Bushbuckridge Area of Operations. However, informed DWS that BLM intends to
terminate its contract with Rand Water. Therefore, tariff consultations were not
honoured by BLM. If the termination occurs before 1st July 2019, then BLM can apply
their own tariff. On 1st July 2019, this tariff increment will be applicable until termination.
Recommendations
41

Funding Strategy (2019 – 2022)
42

Funding Strategy (2019 – 2022)
43

Funding Strategy (2019 – 2022)
Credit Ratings
44

Rand Water is committed to:
• Rolling out the capital expenditure
programme, which remains critical to
Rand Water’s success;
• Prudent application of the credit
management policy to maintain financial
health and sustainability;
• Building a resilient organisation for the
future;
• Promote a strong culture of leadership
continuity and sustainability within the
organisation and the water sector
• A strong spirit of partnership with the
water sector and South Africa
Looking Forward
45

46


