Page 1
RANDOM DELAY TECHNIQUES FORLOCATION PRIVACY IN VANETS
a thesis
submitted to the department of computer engineering
and the graduate school of engineering and science
of bilkent university
in partial fulfillment of the requirements
for the degree of
master of science
By
Satiye ALBAKIR CATAL
May, 2013
Page 2
I certify that I have read this thesis and that in my opinion it is fully adequate,
in scope and in quality, as a thesis for the degree of Master of Science.
Asst. Prof. Dr. Ali Aydın SELCUK(Advisor)
I certify that I have read this thesis and that in my opinion it is fully adequate,
in scope and in quality, as a thesis for the degree of Master of Science.
Asst. Prof. Dr. Bugra GEDIK
I certify that I have read this thesis and that in my opinion it is fully adequate,
in scope and in quality, as a thesis for the degree of Master of Science.
Asst. Prof. Dr. Alper SEN
Approved for the Graduate School of Engineering and Science:
Prof. Dr. Levent OnuralDirector of the Graduate School
ii
Page 3
ABSTRACT
RANDOM DELAY TECHNIQUES FOR LOCATIONPRIVACY IN VANETS
Satiye ALBAKIR CATAL
M.S. in Computer Engineering
Supervisor: Asst. Prof. Dr. Ali Aydın SELCUK
May, 2013
Vehicular ad hoc network (VANET) is an emerging new communication technol-
ogy which has attracted a lot of research attention from academic community
and industry. It is promising technology to provide safer and efficient traffic con-
ditions. This is realized by letting vehicles to exchange safety messages. This
messaging increases the awareness of vehicles about their neighboring vehicles
positions and warns drivers about dangerous situations. However, availability of
such information facilitates the tracking of vehicles. So, this information must be
protected against the potential misuse.
In this thesis, we address the problem of achieving location privacy in VANETs
with randomly changing identifiers (i.e. pseudonyms) in the presence of a global
passive adversary. We suggest adding a random delay to message broadcast
period after the vehicle update its pseudonym in mix zones. By this way, we
want to mitigate the linkability between pseudonyms. This could help to make
tracking more difficult and increase safety and confidence of drivers using VANET.
Instead of adding delay to safety messages completely random, one step taken
further and delay is added according to the silent vehicle number in mix zone.
We also investigated the effects of different number of mix-zone placements in the
network to the location privacy of users. Several simulations have been performed
to evaluate the performance of the systems. The results of experiments show that
adding delay to message broadcast period improves location privacy of drivers in
VANET and also provide information about the relationship between the strength
of the adversary and the level of privacy achieved by changing pseudonyms.
Keywords: pseudonym, mix zone, location privacy, vehicular ad hoc network.
iii
Page 4
OZET
ARAC TASARSIZ AGLARINDA KONUM GUVENLIGIICIN RASTGELE GECIKTIRME TEKNIKLERI
Satiye ALBAKIR CATAL
Bilgisayar Muhendisligi, Yuksek Lisans
Tez Yoneticisi: Asst. Prof. Dr. Ali Aydın SELCUK
May, 2013
Arac tasarsız agları (VANET) akademik ve ticari alandan bircok arastırmanın
ilgisini ceken yeni bir iletisim teknolojisidir. Daha guvenli ve etkin bir trafik
kosulları saglamak icin umut veren bir teknolojidir. Bu, araclar arası guvenlik
mesajı alısverisi saglayarak gerceklestirilir. Bu mesajlasma komsu aracların
pozisyonları ile ilgili aracların farkındalıgını artırırken tehlikeli durumlar hakkında
da suruculeri uyarır. Fakat bu tur bilgilerin varlıgı aracların takip edilmesine
imkan verir. Dolayısı ile bu bilgiler potansiyel kotuye kullanmalara karsı korun-
malıdır.
Bu tezde, kuresel bir pasif saldırgan varlıgında rastgele degisen takma adlar ile
VANET’deki konum gizliligini saglama problemini ele aldık. Karma bolgelerde,
aracların mesaj yayın surelerine, takma adlarını guncelledikten sonra rastgele bir
gecikme ekleyemeyi ongorduk. Bu yontemle, takma adlar arası baglantı ihtima-
lini azaltmayı amacladık. Bu yontem, aracların takip edilmesini zorlastırırken,
VANET’e katılan suruculerin guvenini artırmaya yardımcı oldu. Bir adım oteye
giderek gecikmeleri tamamen rastgele degil de sessiz arac sayısına gore eklemeyi
ongorduk. Bunlara ek olarak, agdaki karma nokta sayısının kullanıcıların konum
gizliligine etkisini de arastırdık.
Sistemlerinin performansını degerlendirmek icin cesitli simulasyonlar yaptık.
Deney sonucları, mesaj yayın donemine gecikme ekleyerek VANET suruculerinin
gizliliginin arttıgını gostermekte ve aynı zamanda takma ad degistirerek elde
edilen gizlilik duzeyi ile saldırgan gucu arasındaki iliski hakkında bilgi vermekte-
dir.
Anahtar sozcukler : takma ad, karma bolge, konum gizligi, arac tasarsız agı .
iv
Page 5
Acknowledgement
I would like to express my gratitude to Ali Aydın SELCUK for offering his
valuable time and support as my supervisor. I have learned a lot, due to his
supervision, suggestions, and support during this research.
I warmly thank to Bugra GEDIK and Alper SEN for accepting to read and
review this thesis and taking place in my thesis committee.
I am also indebted to Julien Freudiger from EPFL (Ecole Polytechnique
Federale de Lausanne) who replied my endless question e-mails with patience.
I admire his papers that helped me a lot with the technical aspects of this re-
search and gave inspirations.
I acknowledge that TUBITAK (The Scientific and Technical Research Council
of Turkey) supported this study under MSc. Scholarship program.
Last but not least, the most special thanks go to my husband, Murat CATAL,
for his infinite love, support, guidance and countless other things. This thesis
would have been impossible without his encouragement.
I hereby dedicate this thesis to all women who were deprived of educational
opportunities for any reason.
v
Page 6
Contents
1 Introduction 1
2 Background 6
2.1 System Model . . . . . . . . . . . . . . . . . . . . . . . . . . . . . 6
2.2 Threat Models . . . . . . . . . . . . . . . . . . . . . . . . . . . . 8
2.3 Privacy Metrics . . . . . . . . . . . . . . . . . . . . . . . . . . . . 9
2.3.1 Event-based Metric . . . . . . . . . . . . . . . . . . . . . . 10
2.3.2 User-centric Metric . . . . . . . . . . . . . . . . . . . . . . 10
2.4 SUMO . . . . . . . . . . . . . . . . . . . . . . . . . . . . . . . . . 10
2.4.1 Simulation Processes . . . . . . . . . . . . . . . . . . . . . 12
3 Related Work 15
4 Basic Random Delay Technique 18
4.1 Proposed Method . . . . . . . . . . . . . . . . . . . . . . . . . . . 18
4.1.1 Attack Models . . . . . . . . . . . . . . . . . . . . . . . . . 20
vi
Page 7
CONTENTS vii
4.1.2 Choosing Delay Distribution . . . . . . . . . . . . . . . . . 23
4.2 Experiments . . . . . . . . . . . . . . . . . . . . . . . . . . . . . . 24
4.2.1 Experimental Setup . . . . . . . . . . . . . . . . . . . . . . 24
4.2.2 Simulation Results . . . . . . . . . . . . . . . . . . . . . . 26
5 Vehicle Density Based Randomization 30
5.1 The Problem Statement . . . . . . . . . . . . . . . . . . . . . . . 30
5.2 Proposed Solution . . . . . . . . . . . . . . . . . . . . . . . . . . . 31
5.3 Experiments and Results . . . . . . . . . . . . . . . . . . . . . . . 32
5.4 Comparison to Basic Random Delay Technique . . . . . . . . . . 35
6 Partial Mix Zone Placement 38
6.1 Motivation and Method . . . . . . . . . . . . . . . . . . . . . . . 38
6.2 Evaluation . . . . . . . . . . . . . . . . . . . . . . . . . . . . . . . 41
6.3 Experimental Results . . . . . . . . . . . . . . . . . . . . . . . . . 42
7 Conclusion 47
Page 8
List of Figures
1.1 Attacker prediction for next position of a vehicle . . . . . . . . . . 4
2.1 System model under consideration . . . . . . . . . . . . . . . . . . 7
2.2 Mix zone obfuscates the relation . . . . . . . . . . . . . . . . . . . 8
2.3 Simulation scenario on SUMO . . . . . . . . . . . . . . . . . . . . 13
4.1 Mix zone entering event . . . . . . . . . . . . . . . . . . . . . . . 19
4.2 Mix zone existing event . . . . . . . . . . . . . . . . . . . . . . . . 20
4.3 Snapshot of used network topology . . . . . . . . . . . . . . . . . 25
4.4 Running simulation snapshot . . . . . . . . . . . . . . . . . . . . 26
4.5 Attacker success with simple attack . . . . . . . . . . . . . . . . . 27
4.6 Attacker success with correlation based attack . . . . . . . . . . . 28
5.1 Average delay for c = 0.5 . . . . . . . . . . . . . . . . . . . . . . . 33
5.2 Average delay for c = 1.0 . . . . . . . . . . . . . . . . . . . . . . . 34
5.3 Attacker success with simple attack for c = 0.5 . . . . . . . . . . . 34
5.4 Attacker success with simple attack for c = 1.0 . . . . . . . . . . . 35
viii
Page 9
LIST OF FIGURES ix
5.5 Attacker success with correlation based attack for c = 0.5 . . . . . 36
5.6 Attacker success with correlation based attack for c = 1.0 . . . . . 37
6.1 Vehicle unconnectivity from network (γ = 0.1) . . . . . . . . . . . 43
6.2 Vehicle unconnectivity from network (γ = 0.2) . . . . . . . . . . . 44
6.3 Attacker success with simple attack (γ = 0.1) . . . . . . . . . . . 44
6.4 Attacker success with simple attack (γ = 0.2) . . . . . . . . . . . 45
6.5 Attacker success with correlation based attack (γ = 0.1) . . . . . . 45
6.6 Attacker success with correlation based attack (γ = 0.2) . . . . . . 46
Page 10
List of Tables
4.1 Simulations parameters . . . . . . . . . . . . . . . . . . . . . . . . 25
4.2 Delay Times . . . . . . . . . . . . . . . . . . . . . . . . . . . . . . 26
x
Page 11
Chapter 1
Introduction
New technological developments in manufacturing technologies altered the manu-
facturing process for vehicles. They require state-of-the-art technological methods
and processes. Modern automobiles are increasingly relying upon more advanced
electronics, computer and wireless communication systems to assist drivers and
enhance safety. When Karl Benz built the first vehicle in 1885, it was just pure
mechanical device. Todays cars are almost fully controlled with software devices.
Future smart cars will be fully controlled by software. For example, the concept
model of Audi A9 is formed with nanotech material that repairs itself automati-
cally if damaged [1].
According to the Organization Internationale des Constructeurs d’Automobies
(OICA) [2], nearly 85 million vehicles had been manufactured in 2012, and now
3 vehicles are manufactured each second. If this trend continues, the number of
vehicles in the world will double in the next 30 years. One may criticize vehicles
for causing traffic congestion and pollution and many other issues. Those are not
downgraded issues, but big benefits of vehicles cannot be forgotten. They are
essential for the operation of global economy and welfare of citizens.
On the other hand, according to the World Health Organization [3], approx-
imately 1.24 million people die each year on the world’s roads, and between 20
and 50 million sustain non-fatal injuries. Nearly all data sources show that road
1
Page 12
traffic injures are leading cause of death among young people whose ages are
between 15 and 29.
Now, it is time to act and more actions are needed to make world’s road
safer. Researches imply that most traffic accidents and jam can be avoided if
the drivers are alarmed in advance about changing driving environment. One
of the most promising efforts is enabling communication between vehicles and
broaden the views of drivers. Vehicles disseminate messages to other vehicles in
their vicinity. For example a vehicle can inform nearby vehicles about its position,
speed, direction etc. This mechanism is expected to improve driving safety, traffic
efficiency, driving assistance and transportation regulation.
VANET is a network devoted to provide communications among vehicles and
between vehicles and fixed road side equipments. Vehicles equipped with On
Board Units (OBUs) and wireless communication equipment, Road Side Units
(RSUs) and backend infrastructure form a VANET. To better understand the
relationship one could look at the relationship between computers and the In-
ternet and connect it to the relationship between vehicles and VANET [4]. The
main vulnerabilities in VANETs come from the wireless communication nature
of the communication which is accessible to anybody. Collecting vehicle specific
information becomes easy if a VANET is deployed without privacy-preserving
countermeasures. An attacker can eavesdrop on all broadcast messages and col-
lect the location visited by vehicles over a period of time. Consequently, vehicles
could easily be tracked and identified anywhere anytime. This location informa-
tion can be used to learn about places of interest of drivers and used to exploit
advertisement and surveillance. Furthermore, it can be misused such as crimes,
automobile thefts. These consequences prevent drivers to participate in VANETs
that decrease the VANET potential to improve traffic safety and wide acceptance.
One approach to solve this problem is to think VANET as completely anony-
mous. Every vehicle will be anonymous all the time. However, complete
anonymity will compromise the entire idea of secure network. First, anonymous
vehicles may generate bogus report for their selfish purposes. For example, one
may cause an area to be deserted for him at no cost. Moreover, anonymity makes
2
Page 13
it difficult to identify the attackers and would not allow law enforcement to track
vehicles. The law enforcement may need to track vehicles using VANET as aid
in an investigation of a stolen car or hit-and-run accidents [5].
Considerable efforts have been made to guarantee vehicle privacy and a quite
number of solutions have been proposed. Among them, pseudonym-based ap-
proaches are well-understood and frequently changing pseudonyms are accepted
as a solution to protecting the privacy of VANET [6]. Pseudonym is a randomly
chosen and changing identifier which can be either a set of public keys, network
layer addresses or link layer addresses. With these pseudonyms, vehicles can
anonymously authenticate their own vehicular reports. They have a short valid-
ity period and cannot be reused. A major shortcoming of pseudonyms is that
each vehicle needs to pre-load a huge pool of anonymous certificates to achieve
privacy, and trusted authority needs to keep the relation of the pseudonyms to
driver’s real identity secret which implied heavy burden of pseudonym manage-
ment. It is not possible to load small amount of pseudonym to vehicles, since
too often re-used pseudonyms might lead to vehicles re-identification. Indeed all
messages authenticated with the same pseudonym can be linked and the more
messages are linked, the easier is re-identification. Thus, pseudonyms should be
generated in way that adversaries cannot link a new pseudonym to the previous
ones of the same vehicle. This approach allows vehicles to be untraceable between
two successive locations. Since pseudonyms cannot be linked to each other, they
can provide a certain degree of privacy.
Unfortunately, an only changing pseudonym is not effective against a global
eavesdropper that can get all communications in the network. Such an attacker
can predict the movement of the vehicles based on the position and speed informa-
tion in the beacon messages, and use this prediction to link different pseudonyms
of the same vehicle together with high probability. For instance, as shown in Fig-
ure 1.1 if at time t0, a given vehicle is at position p0 and moves with speed s, then
after some time tε , this vehicle will be most probably at position p0 + tε·s. As a
result, the adversary will know that the vehicle that reports itself at or near to
position p0 + tε·s at time t0 + tε is the same vehicle as the one that reported itself
at position p0 at time t0 even if the vehicle changed pseudonym in the meantime.
3
Page 14
Figure 1.1: Attacker prediction for next position of a vehicle
On the other hand, the assumption that the adversary can eavesdrop all com-
munications in the network is a very strong one. In many situations, it is more
reasonable to assume that the adversary can monitor the communications only at
a limited number of places and only in a limited range. In this case, if a vehicle
changes its pseudonym within the non-monitored area, then there is a chance
that the adversary loses its trace. However, it is advisable in the field of security,
worst case is considered.
The basic idea used in this thesis is that vehicles should change pseudonyms
in an area called mix zone where obfuscation of vehicles are most probable. That
is where vehicle speed and positions changes most. The concept of mix zone
was first introduced in [7], but it has not been used so much in the context of
vehicular networks. Vehicles should change pseudonym in that area and add some
random delay to beaconing message period. Adding random delay to message
broadcast period at mix zone will ensure that large number of vehicles will change
its pseudonym nearly at the same time at the same location. Thus, the proposed
scheme will ensure the change of pseudonyms in an unlinkable fashion and prevent
tracking of vehicles.
In the next chapter, background information related with thesis is given.
Chapter 3 informs about related work done in the literature. Random delay tech-
nique effectiveness is examined in Chapter 4 with different delay periods with two
different attacker models. The first attacker model uses only time information
while second one also considers speed and position information as well. In Chap-
ter 5, a step further is taken and random delay is not added as completely random
way but density of silent vehicles in the pseudonym change area is considered as a
factor to decide the random delay duration. High number of vehicles that change
4
Page 15
pseudonym and not to start beaconing message yet causes the duration of added
random delay to be low. On the other hand, random delay should be should
be high if number of silent vehicles is low. By optimizing random delay dura-
tion according to silent vehicle number, attacker tracking capability is reduced.
Also, unnecessarily being silent is prevented for the vehicles that may change its
pseudonym in an unlinkable way. In Chapter 6 of the thesis, number of places
where vehicles change their pseudonyms is changed. Since changing pseudonym
is a costly job, attacker success in low number of mix-zone area is compared with
large number of pseudonym change areas. Report on results and gained level of
privacy is given with extensive simulation. Simulation results provide detailed
information about the relationship between the strength of the adversary and
the level of privacy achieved by changing pseudonyms and confirm that the level
of privacy decreases as the strength of the adversary increases. Also, detailed
information is obtained about relationship between random delay duration and
adversary success ratio. As expected, increase in random delay duration causes
decrease in adversary success.
5
Page 16
Chapter 2
Background
This chapter gives an overview of the system model and thread model used in
this thesis. Then two types of privacy metrics are discussed. It also introduces
the features of the simulation tool that is used to perform simulations.
2.1 System Model
The system model (Figure 2.1) under consideration consists of the followings:
• Certification Authority (CA), which is independent trusted third party
and manages security and privacy of the network. Each vehicle must
register to CA before entering the network and preload a large set of n
pseudonyms denoted {Pi,j}j=nj=1 , a public/private key pair (KPi,j, K−1Pi,j
) and
corresponding public key certificate Certi,j(KPi,j) for each pseudonym Pi,j.
Only CA knows the link between the real identity of vehicle and its asso-
ciated pseudonyms. In the case of liability issues, this association can be
made public by law enforcement.
• Roadside Units (RSUs), which are fixed units placed over whole network.
RSUs are connected to CA by a wired network and communicate securely
with CA.
6
Page 17
• On Board Units (OBUs), which provide communication either between
OBUs through vehicle to vehicle (V2V) communication or between OBUs
and RSUs through vehicle to infrastructure communication (V2I).
Figure 2.1: System model under consideration
It should be noted that system under consideration has suitable public key
infrastructure model and certificate is attached to each message to provide secure
communication between entities. Also, vehicles are equipped with Tamper Proof
Devices (TPDs) that guarantee correct execution of cryptographic operations and
non-closure of private keys.
As described in introduction part, location privacy is achieved by changing
pseudonym in regions called mixed zones. The effectiveness of mix zone to provide
location privacy highly depends on density of vehicles. Thus, mix zones should
be placed in regions where mixing capability is high and vehicles should be forced
to change pseudonyms at those regions. The highest mixing of vehicles occurs at
road intersections since speed and direction of vehicles change the most. Thus,
as in Freudiger [8] et al., mix zones are placed at road intersections. Figure 2.2
shows an example of mix zone. 5 cars with pseudonyms A to E enter the mix zone
from different ports and exit with different pseudonyms with F to J at nearly same
time. Mix zone tries to obfuscate the relation between incoming and outgoing
vehicles. The links between old and new pseudonyms are not observable by any
outsider and this mechanism is expected to achieve location privacy protection.
7
Page 18
Figure 2.2: Mix zone obfuscates the relation
2.2 Threat Models
The nature of wireless communications makes eavesdropping particularly easy.
Consequently, vehicles’ positions can be monitored at all times. All an adversary
needs to do is deploy its radio devices across the area of the network that it wishes
to monitor. One may think that tracking vehicles can be done with cameras
instead of radios. However, the granularity is higher in radio since eavesdropper
obtains identifiers, locations and other information from beaconing messages.
Also, cost of radios is low compared to cameras. In this application scenario,
achieving location privacy against such an adversary is concerned. It is assumed
adversary cannot inject or modify messages. She collects pseudonyms sniffied at
every intersection where it has an eavesdropping station. Based on the collected
information, it attempts to track the location of mobile nodes. The concerned
adversary is called as global passive adversary who obtains complete coverage and
tracks nodes throughout the entire network. It should be noted that, it is unlikely
for an attacker to achieve such a comprehensive coverage of network, but there
is no real measurements to approximate for this function, so as it is advisable in
the field of security, worst case is considered.
In addition to eavesdropping abilities, the knowledge of the adversary depends
on other information it has, e.g., background information about users’ mobility
and points of interest. While an adversary cannot observe the vehicles within the
8
Page 19
mix zone, she can still have knowledge about model of mixed zones and observes
events. Event in mix zone can be described as a pair consisting of a port and
time step. There are entering events and existing events corresponding to vehicles
entering and existing mix zone respectively. Entering event consists of the port
where vehicle enter the mix zone and time step when it has happened. Similarly
existing event consists of the port where vehicle left the mix zone and the time
this happened. The objective of the adversary is to relate the entering event of
the vehicle with the exiting event. Specifically, the adversary picks a vehicle v as a
target vehicle and tracks it until entering the mix zone. Then adversary catches
the exiting events during time t such that the target vehicle may exit. Then,
for each exiting vehicle vx adversary determines the probability that vx being v.
At the end, she decides the most probable vx that corresponds v. Adversary is
successful if decided vx is real v. The above algorithm used by adversary is called
as an Bayesian decision and it is ideal decision algorithm for the adversary since
it minimizes the error probability [9].
Mix zones are effective in anonymizing the trajectory of mobile nodes if the
adversary is unable to predict target vehicle. In particular, a mix zone becomes
a confusion point for the adversary if the mixing attempt achieves high location
privacy.
2.3 Privacy Metrics
There are various metrics to quantify the level of privacy provided by the mix
zone. A natural metric is the success probability of the adversary when making
her decision to decide target vehicle. If the success probability is large, then the
mix zone and changing pseudonyms are ineffective. On the other hand, if the
success probability of the adversary is small, then tracking is difficult and the
system ensures location privacy.
Two types of privacy metrics are used in this thesis.
9
Page 20
2.3.1 Event-based Metric
The goal of the event-based metric is to measure untraceability of all users in a
mix zone. It measures the probability that the adversary finds the assignment
of all entering events to all exiting events in a mix zone. Consider a sequence
of entering and existing vehicles to a mix zone over a period of time steps. The
adversary success is ratio of correct assignment of entering vehicles to existing
vehicles in a mix zone. It should be noted that average correct assignment in
mix zones mostly depends on factors beyond the vehicles (for example number of
neighbouring vehicles). Thus, average location privacy should be computed.
2.3.2 User-centric Metric
The goal of the user-centric metric is to measure the untraceability of a particular
user traversing mix zones, instead of the mix zone in general. Adversary picks a
target vehicle and tries to find all its paths. This types of metric requires more
coverage area for an adversary. In this type of privacy metric, to decide the
adversary success again average number of tracked vehicles should be computed.
2.4 SUMO
Like other types of networks, VANET needs to be simulated to validate protocols
and applications. There are many open sources, commercial tools, and software
available in market for generating traffic simulation model which features motion
of multiple vehicles under provided conditions. A microscopic traffic simulator
computes the position of all the vehicles on road at the same time. These positions
could be organized into a graphical user interface (GUI) or saved in a file. SUMO
(Simulation of Urban Mobility) is this type of simulator and it is appropriate
as an simulator [10].
10
Page 21
SUMO [11] is selected for our research mainly considering the following fea-
tures:
1. It is a microscopic model which records the movement every second, and
these values are updated depending of the vehicle ahead and the street
network that the vehicle is on ;
2. It is open source, highly portable, and can be further extended;
3. It is capable of making real-time simulations with a large amount of simu-
lated vehicles in large area;
4. It supports several useful output formats like route generation
5. It has many extensions, which can enhance the traffic modeling and data
processing.
In addition, the credibility of the SUMO tool has been demonstrated in various
other projects, e.g., [12, 13].
The development of SUMO started from 2000 by the German Aerospace Cen-
ter, in order to support the traffic research community with a tool into which
own algorithms can be implemented and evaluated without the need to regard
all the artefacts needed to obtain a complete traffic simulation. Such artefacts
are related to the implementation and/or setting up methods for dealing with
road networks, demand, and traffic controls. By supplying such an open source
microscopic road traffic simulation tool, the German Aerospace Center wanted to
make the implemented algorithms more comparable, as a common architecture
and model base is used, and gain additional help from other contributors. Since
2002, SUMO is used popularly in the evaluation of vehicle-to-vehicle and vehicle-
to-infrastructure communication and It is widely used in research community.
SUMO simulator is perhaps the most scrutinized microscopic traffic simulator in
the research community, with hundreds of scientific papers referring to it.
SUMO is a combination of more than a single application. There are other
11
Page 22
modules that help build assigned data that are needed for simulations and re-
search. In order to simulate in a proper format, SUMO requires the representation
of road networks and traffic demand, both have to be imported or generated using
different sources. SUMO allows to generate various outputs for each simulations
run. The outputs are ranging from simulated induction loops to single vehicle
positions. As a result of the SUMO simulation, useful datasets can be generated
for further analysis. One is the location information of every vehicle called ”net-
state dumps”. It records, at every timestamp, the location of every vehicle in
the simulated road network. Each record consists of a vehicle ID, a timestamp,
and the vehicle’s coordinates. This data file is used as the basis for the simula-
tion of the mobile traffic information system. The simulation of street vehicles is
time-discrete and space-continuous.
2.4.1 Simulation Processes
To set up a simulation for SUMO three steps have to be followed. First the road
network on which the vehicle traffic is moving on is needed. Second, each vehicle
should recognize its route, which is a list of edges that have to be passed and can
be known. The final step is to perform the simulation.
SUMO-NETGEN : Due to high level of complexity, the SUMO’s network
cannot be generated by a human. Instead, NETGEN generates abstract road net-
works, then calculates the necessary input for SUMO and writes the results into
a XML-file. First, the topology of the road used for the simulation experiments
is defined. Since no realistic road topology together with network’s coverage area
information is available, a rectangular road network topology is preferred to be
implemented for investigation. The chosen rectangular road network allows the
vehicle to loop in this road network. The output of NETGEN is a generated
SUMO-road network optionally also other outputs connections, edges, nodes etc.
DEMAND MODELLING : Generate turn definition python script allows
generation of the turn definitions based on the number of lanes allowing particular
turns. The basic functionality distributes the traffic uniformly, that is:
12
Page 23
• distribute the incoming traffic uniformly across the lanes forming the road
• distribute the amount of traffic assigned to each lane uniformly among the
destinations that the lane allows turns to.
• sum up the values for each of the destinations that the road being processed
allows turning to.
SUMO-JTRROUTER : The simulation not only consists of the stationary
part, i.e. the network, but also the mobile part, i.e. moving vehicles. The
JTRROUTER is a routing application which uses flows and turning percentages
at junctions as input. The following parameter must be supplied:
• the network to route the vehicles through,
• the description of the turning ratios for the junctions and
• the descriptions of the flows.
Figure 2.3: Simulation scenario on SUMO
GENERATE SIMULATION : execution step of simulation is performed.
Two choices are available to perform simulation. The first one is using SUMO-
GUI application, the other one is SUMO command line application.
13
Page 24
The Figure 2.3 depicts the process of generating vehicular mobility with
SUMO that is used in this dissertation.
14
Page 25
Chapter 3
Related Work
The privacy of VANETs is a recent topic. Many author addressed VANETs
and its security and privacy in some papers. A good online bibliography for the
security of VANETs can be found in [14].
Although pseudonyms were introduced to VANET to help drivers feel comfort-
able about safety of their identity, pseudonyms do not completely prevent track-
ing. A skillful attacker can link pre-existing pseudonyms to present pseudonyms,
which will then aid to future pseudonyms [15]. In order to achieve location pri-
vacy in a pervasive computing environment, Beresford and Stajano [7] propose
the concept of mix-zones where a natural mixing of mobile nodes occurs. Mix-
zones are anonymized regions of the network wherein mobile nodes change their
identifiers to obfuscate the relation between entering and exiting events. Because
the locations of nodes in a mixzone cannot be estimated, the updating nodes can
potentially mix their identifiers and constitute an anonymity set. However, the
spatial and temporal relation between the locations of a mobile node can enable
its entry and exit locations and times from a mix zone to be correlated [16],
hence lowering privacy.
In [8], the authors suggest to construct mix zones for vehicles by cryptographic
means. They propose to install such cryptographic mix-zones by deploying a spe-
cial RSU at places with high traffic density such as crossroads. Once a vehicle
15
Page 26
enters a cryptographic mix-zone, they obtain a symmetric key from the RSU.
While the vehicle is inside of the cryptographic mix-zone, all communication is
encrypted and therefore an adversary cannot read-out useful information (includ-
ing meta-information) from its messages. Vehicles in the mix-zone forward the
symmetric key to vehicles that are in direct transmission range outside of the
mix-zone such that these vehicles are also able to decrypt messages. Vehicles
then change pseudonyms while being inside of the mix-zone. In addition, all the
vehicles in the mix zone are forced to change their anonymous certificates. As a
result of the forced certificate change and the random direction change of each
vehicle at road intersections, an attacker on the roadside cannot link a certifi-
cate to a particular vehicle, hence, providing location privacy. The accumulation
of CMIXes throughout the vehicular network forms what is called mix-network,
which maximizes the degree of the location privacy
In the vehicular density based location privacy scheme provided in [17] to
address attacks that correlate pseudonyms of vehicles entering and exiting a mix-
zone, a node must change its pseudonym only when it finds a threshold number
of nodes within such a region. A vehicle permanently assesses its neighborhood,
and changes its pseudonyms only if the vehicle detects k vehicles with a similar
direction in a confusion radius. The approach is an intuitive for achieving location
privacy in VANETs. However, how to detect k vehicles in neighborhood and how
to guarantee neighboring vehicles to react similarly should be further exploited.
In two of the most relevant papers to our approach, in [16, 18], Huang et
al. propose the random silent period technique to allow the nodes to update at
random locations and times. Nothing that such updates are not able to mitigate
correlation tracking, they suggest utilizing the AP as a coordinator to synchronize
the updates as well as enforce the neighboring nodes to update with the target,
thereby increasing the resulting entropy of the anonymity set distribution. How-
ever, this work assume that the wireless nodes have unrestricted and independent
mobility, hence, not considering the unique constraints of VANET.
The other relevant paper is SLOW method proposed in [19]. The main idea
of the scheme is that vehicles should not transmit safety messages when their
16
Page 27
speed drops below a given threshold, and they should change pseudonym during
each such silent period. SLOW is not a full solution to untraceability, as it does
not cover the safe use of silent periods at high speeds.
In the research line of the placement of mix zones, Freudiger et al. [20] analyze
the optimal placement of mix zones with combinational optimization techniques,
and show that the optimal mix zone placement performs comparatively well to the
fully deployment scenarios. This work is instructive, which guides the placement
of mix zones in VANETs. This work inspre us to work on mix zone number effect
on location privacy.
17
Page 28
Chapter 4
Basic Random Delay Technique
In this chapter, privacy level a driver can achieve by adding random delay to
beaconing message period in VANETs is investigated. First, the used method
is explained, and then experiments details are given. Lastly, the experiments
results are discussed. Prior to give details as mentioned in background part,
attacks consist of listening transmission messages is dialed, and intersections are
chosen as pseudonym change points, that is mix-zones.
4.1 Proposed Method
It is obvious that untraceability of vehicles is an important requirement in fu-
ture vehicle communication systems. Transmitting beaconing messages under
pseudonyms and changing pseudonyms regularly provide some degree of privacy.
Unfortunately beaconing messages provide a constant stream of spatial and tem-
poral data and without any protection mechanism, tracking a vehicle will be easy
even for very simple passive eavesdropper. Changing pseudonyms will be effective
if some delaying occurs in message transmitting period. That is, vehicles should
be silent for some period so that several vehicles change their pseudonym nearly
at the same time at the same location so that obfuscation of vehicles occurs.
18
Page 29
The basic idea used in this chapter is, vehicles should not start to transmit
messages immediately after changing pseudonym. Some random delay should
be added to broadcast period so that more vehicles change their pseudonym
nearly at the same time at the same location. After random delay time, vehicles
automatically continue sending beaconing messages. Since not all vehicles start
and end their silent period at the same time, safety message transmissions occur
in pseudonym change area but with less number. Thus, this makes it possible
to provide communication with less expensive equipments since large amount of
digital signature verification is refrained.
Figure 4.1: Mix zone entering event
Efficiency of provided solution is considered in intersection based and aver-
aged over all intersections. Each vehicle that comes close to intersection stops
transmitting safety messages and changes its pseudonym. After that, it adds
some random delay to message broadcast period before restarting transmission.
The scenario is shown in Figure 4.1. Target vehicle with pseudonym 1 enters the
intersection, changes its identifier and stops transmitting safety messages. When
vehicle 1 entered the mix-zone, there are 3 more vehicles that are in silent mode.
After a while, one of the silent vehicles finishes its delay period and restarts
the transmission with new pseudonym 50 (Figure 4.2). Attacker goal is to find
which one of silent vehicles start retransmission. As a side note, this retrans-
mission provides information about mix-zone safety condition although not all
19
Page 30
Figure 4.2: Mix zone existing event
vehicles provide transmission.
For the attacker that uses no information from beaconing messages, all four
vehicles have equal chance and the probability of successfully guess the target
vehicle is 1/4. However, the considered attacker in this dissertation is not as
weak as this one.
4.1.1 Attack Models
Two types of attack model are considered:
4.1.1.1 Simple attack model
In the first attack model, attacker uses the following information to guess the
target vehicle:
1. the last transmission time of target vehicle tlast
2. speed limits [smin, smax],
20
Page 31
3. random delay limits [tdmin, tdmax]
Attacker applies the following algorithm to guess the target vehicle. First, she
calculates the minimum (tlast+ tdmin) and maximum (tlast+ tdmax) retransmission
times to have temporal information. Then, spatial information is calculated by
finding minimum (smin·tdmin) and maximum (smax·tdmax) place that target vehicle
may reappear, that is she calculates reachable area. Attacker wants to select
vehicles that start to retransmit safety messages with new pseudonym between
reasonable minimum and maximum time for target vehicle start transmission and
between minimum and maximum location that target vehicle may reach. After
that, attacker considers all vehicles have equal changes and selects one of them
randomly. If the guessed vehicle is really the target vehicle attacker is successful,
if not attacker lost the target vehicle. The algorithm is applied for each vehicle
for each intersection, and averaged over all intersection.
4.1.1.2 Correlation based attack model
In the second type of attack model, attacker uses all information that simple
attacker has and also the following additional information:
1. Last transmission speed (slast) and position (plast)
2. New transmission speed (snew) and position (pnew)
3. Delay characteristics of intersections(average time required to turn left,
right or to go straight)
Attacker uses the algorithm to correlate candidate vehicles with the target ve-
hicles. First, to be a candidate vehicle, vehicle starting retransmission with new
pseudonym should start transmission between reasonable minimum and maxi-
mum time in reachable area as discussed in simple attack model. In addition to
this, attacker correlates the last transmission position and speed of target vehicle
with candidate vehicle speed and position.
21
Page 32
The decision algorithm used by the adversary is intuitive and straightforward:
the adversary knows that the selected vehicle v entered the mix zone at position
p , with speed s and at time t. For each exiting event at position p′, with speed
s′ and time t′ that the adversary observes afterwards, she computes the P that
exiting event corresponds to the selected vehicle as computing absolute difference
between distances.
P = |Preal − Pestimate| (4.1)
where Preal is the real distance between p and p′ and Pestimate is the estimate
distance taken using average speed. It is computed as (t′ − t)·((s+ s′)/2).
The adversary decides for the vehicle for which P is minimal. The adversary is
successful if the decided vehicle is indeed v, if not attacker lost the target vehicle.
The algorithm is applied for each vehicle in for each intersection, and averaged
over all intersection.
It can be better explained with the following example.
Example: In VANETs, vehicles periodically change their pseudonyms when
they are broadcasting safety messages and each safety message is a 4-tuple includ-
ing speed, position, time and content. Assume last safety message broadcasted
by target vehicle V is (speed, position, time) = (10.4, 78, 25) where units are
meter/second, meter and second respectively. After reasonable time attacker
observes two new broadcasts with pseudonyms T and U . The obtained new
broadcasts in reachable area have the following beaconing information:
T: (speed, position, time) = (3.6, 83, 26), and
U: (speed, position, time) = (5.4, 89, 27).
Find which one of new pseudonyms (T or U) is more probable to be a target
vehicle V ?
Solution: The attacker observed the times, speed and position and
pseudonyms of ingress event of target vehicle and two different egress events.
Her goal is to reconstruct the correct mapping between the egress events with
22
Page 33
the target vehicle ingress event. This is equivalent to discovering the mapping
between T to V or T to U . She first calculates the real and estimate differences
between ingress event and egress events. Then, according to formula (4.1), she
tries to find minimum absolute difference between real and estimate differences.
Finally, she selects vehicle which has minimum absolute difference.
Real Distance between V and T = 83− 78 = 5
Guess Distance between V and T = ((10.4 + 3.6)/2)·(26− 25) = 7
Real Distance between V and U = 89− 78 = 11
Guess Distance between V and U = ((10.4 + 2.4)/2)·(27− 25) = 12.8
Since |12.8− 11| < |7− 5| , U is more probable to be a target vehicle.
4.1.2 Choosing Delay Distribution
The proposed technique requires to add random delay to safety message broadcast
period. Short time delays may prevent obfuscation of vehicles. On the other
hand, long time delays may cause vehicles to lose connection from network long
times. Hence, delay times should be decided carefully. It is a good idea to find
maximum delay times by using the some multiplies of edge passing time with
average of allowed speed.
The following procedure is applied to decide the delay times:
1. Average speed of vehicles (µs) is computed. Speed of vehicles are uniformly
distributed between 0 and smax. Thus,
µs = smax/2 (4.2)
2. Passing time (τ) from an edge with length d is calculated using average of
speed .
τ =d
µ s(4.3)
23
Page 34
3. For different c coefficients, tmax is decided using the following formula.
tmax = c·τ (4.4)
4. Lastly delay times are generated uniformly random from interval [tmin,tmax].
delay∼U(tmin, tmax) (4.5)
4.2 Experiments
The purpose of experiments is to calculate attacker success on real mobility data.
In the following, first simulation setup parameters is explained, and then simula-
tion results are presented.
4.2.1 Experimental Setup
The simulations are performed in three steps. In the first step mobility patterns
of vehicles is simulated using SUMO and simulation states are dumped in a file for
every time step. This dump files contains time, position and speed information for
each vehicles. Then, attacker observations about changing pseudonyms related
with new and old pseudonyms are obtained. Lastly, attack algorithms are applied
on observed data and compared with the real data.
It is assumed that all vehicles participate in the anonymization process at
every road intersection and attacker is global. For the purpose of simulations,
10x10 Manhattan network with 4 road segments that meet intersections is used
as shown in Figure 4.3. The simulation parameters can be seen in Table 4.1.
Each edge consists of two lanes to simulate lane change for vehicles and over-
taking a vehicle. Default speed for the vehicles is set as 25m/s. Most of the
examples in SUMO use the standard vehicle values in Stefan Krauß’s thesis [21].
So, some of simulation parameters such as vehicle length, edge length, driver im-
perfection are chosen from those values. Speed distribution of vehicles as chosen
24
Page 35
Figure 4.3: Snapshot of used network topology
from normal distribution with mean 1 and standard deviation 0.1 so that 95% of
vehicles drive between 80% and 120% of the legal speed limit [22].
The Table 4.1 shows the vehicles parameters that are used by SUMO to rep-
resent vehicles and driving behavior.
Simulations are performed with 100 to 600 vehicles, increasing by 100 vehicles.
6 different trace file is obtained with different density of vehicles per intersection.
Parameters ValuesNetwork Density(vehicle/intersection) 1,2,3,4,5,6Default Vehicle Speed 25 m/sVehicle Length 5 mEdge Length 100 mLane Number 2Driver Imperfection 0.5
Table 4.1: Simulations parameters
25
Page 36
c values tmax = c·τ (seconds)0.5 41.0 81.5 122.0 16
Table 4.2: Delay Times
If there are N vehicles in the network then average number of vehicle per inter-
section is set as N/10×10. Average number of vehicle per intersection changed
and the adversary success per intersection is obtained. In traces, vehicle routes
are computed as uniform turning percentage and simulation ended in 2500s. U
turns are forbidden. Running network simulation can be seen in Figure 4.4.
Figure 4.4: Running simulation snapshot
From the simulation parameters (as shown in Table 4.1) edge length is 100m
and default speed is 25m/s. An edge passing time with average speeds(τ) for the
chosen simulation parameters is 8 (τ = 100/(25/2)) . Delay times are generated
uniformly random from the interval [tmin, tmax]. Value of minimum delay that is
tmin is chosen as 0 second and tmax values are calculated for different c coefficients
such as 0.5, 1.0, 1.5, and 2.0 using the Formula (4.4). Thus, used delay times for
different c values are given in the Table 4.2.
4.2.2 Simulation Results
Simple attack model: For this type of attack model, attacker records the
last safety message transmission of each vehicles with old pseudonym and first
retransmission safety message information of vehicles with new pseudonym. At
the end of observations, there are two data set in attacker hands. The first one
26
Page 37
old pseudonym set with transmission details and the other set is new pseudoynm
sets. Attacker aim is to match the old pseudonym with the new pseudonyms so
that vehicles uncertainity in mix zone mitigated.
From the first data set (with old pseudonyms), she computes the minimum and
maximum place that vehicle may reappear in reasonable minimum and maximum
time. Then vehicles in the second data set reappeared with those times and places
are decided. Since this attack model is simple, no more information is used and
all candidate vehicles selected in second data set is given equal chance to be a
target vehicle and one of them is selected as target vehicle. Simple attacker model
essentially assumes that traffic at an intersection follows the First In First Out
(FIFO) principle. While this is clearly not the case in practice, the attacker still
achieves a reasonable success rate in a single intersection. Attacker success ratio
is obtained by ratio of the total number of successfully mapped vehicles to the
total number of vehicles in an intersection and averaged over all intersections.
Figure 4.5: Attacker success with simple attack
Figure 4.5 presents the average location privacy obtained in an intersection for
various vehicle densities for various delay times. It can be shown that achieved
location privacy varies with respect to vehicle density. It is observed that the
less number of vehicles in intersection is, the easier it is for adversary to track
vehicles based on their delay characteristics. One can see, for instance, that for
c = 1.5, when vehicle per intersection is 1, the attacker can track a target vehicle
27
Page 38
through a single intersection with probability around 50 percent. However, when
vehicle per intersection is 5, the attacker tracking success dramatically decreases
to nearly 30 percent.
On the other hand, the more delay time added to vehicle beaconing period,
the more candidate vehicles reappear, thus attacker success decreases. As it is
expected, success ratio decreases as the delay amount increases (c increases). The
quantitative results of the simulation experiments presents that when c = 2.0
attacker success is between 25 and 42 percent while for c = 0.5 her success is
between 75 and 90 percent.
Correlation based attack model: For correlation based attack model, at-
tacker again constructs two data sets which are old pseudonyms set and new
pseudoynms set. To link between two data sets, she correlates speed and posi-
tion information as well. From the old pseudonyms data set, she computes the
minimum and maximum place that vehicle may reappear in reasonable minimum
and maximum time. Then vehicles in the second data set reappeared with those
times and places are decided. For each candidate vehicle, guess vehicle is decided
as mention in section 4.1.1.2 using formula 4.1. Attacker success ratio is obtained
by ratio of the total number of successfully mapped vehicles to the total number
of vehicles in an intersection and averaged over all intersections.
Figure 4.6: Attacker success with correlation based attack
28
Page 39
Figure 4.6 show the same metrics for correlation based attacker model. In
correlation based attacker model attacker uses more information such as speed
and position to guess the target vehicle. Since attacker knowledge about vehicle
increases, success on attack also increases. Thus, location privacy decreases. For
example, for c = 1.0 simple attacker success is 42 percent but when attacker
corralates the speed and position information, her success rate increases to 72
percent for 2 vehicles per intersection.
On the other hand, when delay time increases, attacker success is again rea-
sonable high. For instance, for c = 1.5 attacker success is between 55 and 70
percent while for c = 0.5 her success is between 90 and 98 percent.
Even with more knowledge of attacker, high location privacy can be achieved
with high delay times.
Generally, attacker tracking success is expected to decrease when the number
of vehicles increases in the network. However, this is not the case for all situations.
The reason is while making attack; attacker considers all vehicles as a candidate
vehicle that start retransmission in a meaningful time in the reachable area.
In other words, any vehicle that appears in the reachable region with a new
pseudonym between minimum and maximum delay times is a possible candidate
for the target to the adversary. The high number of vehicles causes more vehicles
to satisfy this condition. However, movement is an important requirement for
vehicles. In congested traffic scenarios, vehicles that changed pseudonym may
not move enough in road, and it prevents more vehicles to be candidate vehicle.
Congestion prevents more vehicles to reappear with a new pseudonym. Thus,
attacker success may be high in congested traffic scenarios. This situation can be
seen from the attacker success graph for vehicle per intersection values 4, 5 and
6. In addition, a small increase in attacker success in simulation for 5 vehicles per
intersection is due to accidents happened in network. It eliminates some vehicles
from network and prevents some other vehicles from movement.
29
Page 40
Chapter 5
Vehicle Density Based
Randomization
In the previous chapter (Chapter 4 ), completely random delay is added in bea-
coning message period of vehicles. This method is problematic in some conditions
and it can be improved. The vehicle density based random delay is proposed as a
solution and effectiveness of this solution together with provided location privacy
is given and discussed in this chapter. This chapter starts with problem definition
and continues with detailed proposed solution. Then, evaluation of proposed so-
lution is presented. Finally, privacy provided with basic random delay and vehicle
density based random delay is compared.
5.1 The Problem Statement
The main problem that is tried to be solved is the alleviating unauthorized
tracking of target vehicles by adversaries in VANETs. Frequently changing
pseudonyms are proposed as a solution, but these pseudonyms can also be linked
by determined attackers using temporal and spatial relations. As a first solu-
tion, random delay periods added to beaconing message period is proposed in
the previous chapter (Chapter 4). This method provides some degree of privacy.
30
Page 41
However, the disadvantage of this method is vehicles safety could be affected
badly if silent period is large. Since not all vehicles in mix-zone start silent pe-
riod at the same time and not restart at the same time, it may be possible to get
beaconing message about safety of mix-zone from vehicles. But, the duration of
this silent period is important and some optimization can be made.
Added random delay duration to provide location privacy is closely related
with vehicle density. If vehicle density is very low then adding very long delay
period may not provide high location privacy. On the other hand, if vehicle
density is high and added random delay period is high, then vehicles will be silent
unnecessarily long time. Instead of adding long delay, they may be unlinkable
with short random delay periods. Thus, vehicle density should be considered as
a parameter to decide random delay period.
5.2 Proposed Solution
As a solution to the above problem, vehicle density based random delay is pro-
posed. Vehicles that enter the mix-zone should get silent vehicle number from
the RSUs which are placed in each mix-zone and should decide the random delay
period according to this number. If the number of silent vehicles is high then no
need to add so much random delay to its message beaconing broadcast and vice
versa.
The random delay period is generated uniformly random from interval tmin
and tmax. The parameter tmin is set as 0 and the parameter tmax is calculated
using the Equation (5.2). Since high vehicle density causes more obfuscation of
vehicles, delay should be inversely proportional to the silent vehicle numbers.
The following algorithm is used to add vehicle density based random delay to
vehicles.
1. Delay is generated between 0 and tmax.
delay∼U(0, tmax) (5.1)
31
Page 42
2. The parameter tmax is calculated using the following formula:
tmax = c′·(1 +a
nsilent)·τ (5.2)
The parameter nsilent represents the number of silent vehicle number in mix
zone. Upper limit for delay, that is tmax value is calculated for different
a coefficients. The values 0.5, 1, 2, 3, 4 and 5 are selected a values for
evaluation.
To compare the density based randomization with basic random delay
method c′ value is chosen related with c values in Chapter 4. Two methods
will be comparable if they cause the same unconnectivity from network. In
other words, if average vehicle unconnectivity from network are similar in
two methods, then privacy level they expose can be compared. Thus, c′
values are chosen so that same unconnectivity can be provided.
The coefficient c′ is computed by using expected values of 1/nsilent repre-
sented by µ = E(1/nsilent).
c′ =c
µβ(5.3)
where µβ = 1 + a·µ.
By using this solution, when vehicle density is high, unnecessarily being silent
is prevented. The effectiveness of proposed solution is evaluated with different a
values (0.5, 1, 2, 3, 4 and 5) for different c values (0.5 and 1).
5.3 Experiments and Results
In this chapter, simulation parameters given in Table 4.1 is used to get mobility
pattern of vehicles. vehicle enter the mix zone gets the silent vehicle number from
RSU, then delay period is added according to the this number using the Formula
(5.2). Evaluation is done for different c and a coefficients to test the scenario for
different values. After end of delay time, vehicles restart transmission.
Attacker knows that vehicles add random delay according to the silent vehicle
number in the mix zone and she uses the vehicle densities in mix-zones to predict
32
Page 43
the target vehicle next position. Thus, she computes the maximum and minimum
delay time vehicles can add to message broadcast period and then tries to find
target vehicles. Again two types of attacker model is implemented as simple
attacker model (4.1.1.1) and correlation based attacker model (4.1.1.2). In simple
attack model attacker computer vehicles as candidates vehicles if there are in the
reachable area in reasonable minimum and maximum time. In correlation based
attack model, vehicles in reachable area are evaluated using their speed and
positions to be guessed vehicle for target vehicle. Adversary success is computed
as ratio of number of successful mapped vehicles to the total number of vehicles in
mix zone. Achievable location privacy is computed mix zone based and averaged
over all mix zones.
Figures 5.1 and 5.2 show the network unconnectivity from the network. It
is obtained that average unconnectivity for different a values are nearly same.
Thus, normalization with expected values of silent vehicle number is successful
to get same average delay.
Figure 5.1: Average delay for c = 0.5
Figures 5.3 and 5.4 present the average location privacy obtained in an inter-
section for various vehicle densities ranging from 1 to 6 vehicles per intersection
using simple attack model. Plots are obtained for different c values 0.5 and 1
respectively. As you can see, giving the same average random delay to vehicles
density based randomization outperforms the basic random delay methods. The
33
Page 44
Figure 5.2: Average delay for c = 1.0
evaluation of solution with respect to the different a values shows that the best
a values are around 3. Higher values are also evaluated but it does not affect
privacy so much. For example, attacker success for a = 5 is nearly same for
a = 3.
Figure 5.3: Attacker success with simple attack for c = 0.5
Figures 5.5, 5.6 show the same metrics for the attacker that makes position
and speed correlations. It can be shown that the proposed solution provides
achieved location privacy varies with respect to vehicle densities.
34
Page 45
Figure 5.4: Attacker success with simple attack for c = 1.0
It can be seen from basic attack model and correlation based attack model fig-
ures, if attacker uses more information about vehicle, tracking success on vehicles
increases. Thus, location privacy decreases. For example, for c = 1.0 and a = 1.0,
simple attacker success is between 35 and 60 percent but when attacker corralates
the speed and position information, her success rate increases to between 65 and
85 percent.
5.4 Comparison to Basic Random Delay Tech-
nique
When the privacy level obtained from different delay adding method compared, it
can be seen that density based randomization performs better than random delay
method. For example, simple attack model with c = 0.5, tracking success of an
adversary between 78 and 90 percents for basic random adding technique. This
is very good values from adversary percpective. However, when vehicle density
based randomization technique applied, her success drops below 88 to 70 percent
for suggested a values.
The other obvious advantages of the density based randomization method
35
Page 46
Figure 5.5: Attacker success with correlation based attack for c = 0.5
appears in the following situations.
Situation1: There are low numbers of vehicles which are in silent mode
and the newly entering vehicle in mix-zone enters the mix-zone and adds short
delay time to its beaconing message period. In short delay time period, vehicle
reachable area will be very low, and candidate vehicle numbers will be also low.
Thus, without using position and speed correlation information attacker may
easily identify the target vehicle.
Situtation2: There are high numbers of vehicle which are in silent mode and
newly entering vehicle in mix-zone enters the mix-zone and adds long delay time
to its beaconing message period. In long delay time period, vehicle reachable are
will be high and also other vehicles in mix-zone may start retransmission and
eliminated from being target vehicle. If target vehicle delay period would be low,
obfuscated vehicle number will be high, which decreases linkability of vehicles.
Also, redundantly being silent is prevented and obfuscation is provided.
Both of methods come with short-coming in issues with that if delay period
is too long and accident happens in mix-zone. In this situation, there will be
vehicles in intersection that start retransmission at the same time or not in silent
period yet that may alert its surroundings, save the data to its on-board unit
and execute message to authority, or other vehicles once out of region. In that
36
Page 47
Figure 5.6: Attacker success with correlation based attack for c = 1.0
situation safety becomes more important than privacy and vehicles which are in
silent mode cause accident are alarmed constantly by other vehicles or nearby
road side unit and disable silent mode.
37
Page 48
Chapter 6
Partial Mix Zone Placement
In this chapter, effects of partial mix zone placement in the network on location
privacy are investigated. Chapter starts with motivation and used method, and
then evaluation of proposed solution through simulations is given. At the end
simulation results are discussed.
6.1 Motivation and Method
In VANET, vehicles broadcast safety messages disclosing their trajectory infor-
mation in order to warn drivers of impending accidents. Precise location infor-
mation needed for these safety applications, combined with the need to exclude
attackers through the use of authentication, creates a significant privacy risk.
One method proposed to improve privacy is the use of many pseudonyms, and
changing pseudonyms while in a mix zone where all other vehicles also change
pseudonyms.
Previous mix zone solutions mainly focus on single mix zone construction to
achieve k-anonymity (a privacy metric denoting a state that the information of
each individual cannot be distinguished from at least k − 1 others) for location
privacy protection. However, using a single mix zone is insufficient to handle
38
Page 49
the aforementioned attacks using side information, since side information may
correspond to any part of a users trajectory. In order to achieve a desired level
of protection, multiple mix zones are needed for a certain region to minimize the
identity correlation over all point-of-interests recorded in a users trajectory. If
multiple mix zones are deployed alongside a users routes, the users continuous
trajectory is broken into a set of discrete segments, where each segment is asso-
ciated with a unique pseudonym. This causes an adversary to lose the tracking
target. Each single mix zone lowers the privacy risk in the users next trajectory
segment.
Unlike wired mix networks such as Tor [23] where packets can be freely routed,
the sequence of mix zones traversed by mobile nodes depends on the mobility of
each node. In other words, the flow of mobile nodes cannot be controlled to
maximize location privacy. Instead, the placement of mix zones to impede the
adversary from tracking the nodes location can be controlled. However, similarly
to the delay introduced by mix nodes on packets, mix zones induce a cost for
mobile nodes: with random delay technique in mix zones, mobile nodes cannot
communicate while they are in the mix zone. On the other hand, when one passes
by a mix zone area, she might lose services temporarily due to pseudonym changes
and synchronization. Similarly, the cost also depends on the number of used
pseudonyms. Pseudonyms are costly to use because they are a limited resource
that requires contacting the CA for refill. The traffic density at each location
also affects the effectiveness of mix zone deployment, e.g., mix zone works better
at busy road intersections. Hence, mix zones must be carefully deployed in the
network to reduce the cost induced on mobile users and to provide high location
privacy.
In principle, mix zones can be placed anywhere in the considered area. Their
placement determines the accumulated location privacy provided by each mix
zone. Thus, the optimal solution consists in placing mix zones on the entire
surface of the considered area. For aforementioned reasons, deploying mix zones
at all intersections is both expensive and inefficient. Hence, the total number of
mix zones deployed in the network should be limited to minimize the disruptions
caused to mobile nodes.
39
Page 50
As mentioned in background part of thesis, a central authority, responsible
for the establishment of security and privacy in the system, is confronted with
the problem of organizing mix zones in the network. Thus, users must trust that
the central authority will protect their privacy. This trusted central authority
authority deploys a limited number of mix zones in a given area to protect the
location privacy of mobiles nodes. Multiple mix zone placement is challenging for
two reasons. First, in the physical dimension, as the effectiveness of a mix zone
highly relies on the population and traffic characteristics of the deployed area,
the traffic heterogeneity should be carefully considered. Second, in the logical
dimension, distinct levels of protections may be required at different locations,
e.g., a users appearance at a special hospital may demand higher level of pro-
tection. As a result, multiple mix zone deployment should also incorporate fine
grained protection priorities. There is a need to strategically plan mix zone place-
ment locations in the system to achieve the maximum location privacy protection
subject to cost and service constraint. However, for this thesis, all intersections
have equal chances to be a mix zone. Thus random placements of mix zones is
prefered.
In random delay technique (Chapter 4) and density based random delay tech-
nique (Chapter 5) attacker success on a mix zone is investigated. Attacker aim
was to correctly link the pseudoymn of a vehicle before entering the mix zone
with the pseudonym after exiting the mix zone. Thus, all intersections are con-
sidered as a mix-zone and all vehicles attend pseudonym change process in all
intersections. This logic is meaningful if intersection based location privacy is
investigated. Event based privacy metric (discussed in Section 2.3.1) is appro-
priate for intersection based locaction privacy. But, if the investigated topic is
the mix-zone number effect then the used method should be changed. In this
type of investigation, the threat model as well as privacy metric is different. At-
tacker aims to track the single vehicle through its journey. Thus, user centric
based privacy metric should be used (discussed in Section 2.3.2). The goal of the
user-centric metric is to measure the untraceability of a particular user traversing
mix zones, instead of the mix zone in general. Adversary picks a target vehicle
and tries to find all its paths. Again assumption about adversary is worst case
40
Page 51
assumption. Adversary is global which means she obtains complete coverage.
Adversary selects target vehicle v and can track throughout the entire area. If
vehicle v passes through large number of mix zone then adversary success for
traceability will reduce.
6.2 Evaluation
In this chapter, simulation parameters given in Table 4.1 is used to get mobility
pattern of vehicles. Attacker aim is to find all the journey path of the target
vehicle. Thus, for an attacker to track a vehicle from start to end of journey is of
course affected by journey times. Thus, different journey times of vehicles should
be another parameter that must be considered. For the investigation maximum
travel times are set as 40, 20, 10 and 5 minutes. Maximum 40 minutes journey
time means at the end of 2400 seconds no more vehicle will be in the network
while some of vehicle may already finish its journey before reaching that time.
Traffic density in intersections is set as 3 vehicles per intersection. More vehicles
on intersection make attacker job more difficult. But, the effects of number of
vehicle per intersection on attacker success are examined in detail in Chapter
4 and 5. Hence, concentrating on tracking a vehicle during its journey is more
important for this chapter purpose and vehicle density on intersection is not
examined as a changing parameter.
The focus of this chapter is how the changing number of mix zone in network
affects the adversary success. Certainly, more mix zone causes more confusion
points and decreases attacker success. However, as mentioned in motivation part
of this chapter more mix zone deployment comes with many costs. The evalua-
tion of proposed method is done as follows. First, full deployment of mix zone
is constructed and attacker success is computed. Then, mix zone is decreases
with the different percents. 100%, 50%, 25%, 12.5% and 6.25% of intersections
are deployed as a mix zone and attacker success is compared for different num-
ber of delays. Delay durations are generated uniformly random from interval 0
and tmax, tmax is computed using the Formula 6.1 to provide the same network
41
Page 52
unconnectivity.
tmax = γ·τ · 1ψ
(6.1)
where ψ is density of mix zone (ratio of deployed mix zone to the total number of
mix zone in full deployment). ψ values are computed for 100%, 50%, 25%, 12.5%
and 6.25% of intersections deployed as mix zone; 0.1 and 0.2 are chosen γ values.
Two types of attacker model are implemented to track a vehicle. One is
uses the time and reachable area information to decide candidates vehicles (see
Section 4.1.1.1) and the second type of adversary uses the position and speed
information of vehicles to correlate target and candidates vehicles(see Section
4.1.1.2). Adversary success is computed as ratio of number of tracked vehicle
during whole network to the total number of vehicles in network. Achievable
location privacy is computed vehicle based and averaged over all vehicles.
6.3 Experimental Results
The purpose of experiments is that while keeping network unconnectivty is sim-
ilar, same privacy can be obtined with full deployment with the partial deploy-
ment. In other words, we can compansate the mix zone partial deployment with
adding extra delay to delay periods of vehicles.
Vehicles unconnectivity graphs can be seen from Figure 6.1 and 6.2.
Basic random delay method is chosen for giving random delay at intersections
and obtained results are shown in the following figures. Tracking success of
adversary is computed for two different attack models.
Tracking success of adversary for simple attack model can be seen from Figures
6.3 and 6.4 for γ values 0.1 and 0.2 respectively.
Attacker success that uses more information has high tracking success and it
can be seen from Figures 6.5 and 6.6.
42
Page 53
Figure 6.1: Vehicle unconnectivity from network (γ = 0.1)
It can be easily seen that if the journey time increases attacker success de-
creases considerably. For example, in Figure 6.3, in 25% of mix zone deployment,
attacker success decreases from 65 percent to 8 percent if attacker journey time
increases 35 minutes.
For simple attack model, an adversary monitoring 50% of the intersections
can successfully track 23% of the vehicles while another adversary monitoring
12.5% of the intersections can successfully track 21% of vehicles with very high
probability. While dropping monitoring region to 1/4 and increasing the delay
duration to 4 multiplies, similar privacy level can be achieved.
43
Page 54
Figure 6.2: Vehicle unconnectivity from network (γ = 0.2)
Figure 6.3: Attacker success with simple attack (γ = 0.1)
44
Page 55
Figure 6.4: Attacker success with simple attack (γ = 0.2)
Figure 6.5: Attacker success with correlation based attack (γ = 0.1)
45
Page 56
Figure 6.6: Attacker success with correlation based attack (γ = 0.2)
46
Page 57
Chapter 7
Conclusion
In this thesis, I proposed three different location privacy enhancing techniques for
vehicular ad hoc networks. I considered the effectiveness of changing pseudonyms
to provide location privacy for vehicles in vehicular networks. The approach of
changing pseudonyms to make location tracking more difficult was proposed in
prior works, but its effectiveness has not been investigated so much on vehicular
network. In order to address this problem, I studied the pseudonym change in the
area called mix zone. I assumed adversary has some knowledge about mix zone
and tries to associate the exit event with the enter event. I performed extensive
simulations to study the behavior of proposed techniques by varying the strength
of the adversary and by varying the number of her monitoring points.
Traffic accidents are one of the biggest problems of the world roads and
VANET is the most promising technology for solution to this problem. In the
introduction part of the thesis, general motivation about the issue is given. In
background part of the thesis; system overview, threat models, privacy metrics
and simulation details are given. Then, thesis continues with top most related
works that dealt with similar problem and provide inspiration for our work.
In Chapter 4, adding random delay in a completely random way is analyzed
through simulations. Analysis of tracking success of adversary for different delay
periods is given. Based on my results presented in this chapter, I can conclude
47
Page 58
that increasing random delay increases privacy of drivers at intersections. Also,
stronger attacker (means uses much more information about system to track
vehicles) has higher success compared to the basic one.
In Chapter 5 of thesis, random delay addition method is changed according
to the silent vehicle density based. If density of silent vehicle in the intersection
is high then no need to add high random delay unnecessarily. Density based
randomization method seems to be more efficient to deal with unconnectivity
problem of the vehicles. Using the same unconnectivity, density based random-
ization performs better than basic random delay technique.
Evaluation of mix zone placement is studied in Chapter 6 of thesis. Different
number of mix zone placement is evaluated in two different attacker models. If
number of confusion point in a network (mix zone number) is high, then tracking
will be more difficult. However, keeping mix zone number in a network is costly
job for reasons mentioned in the chapter. Thus, we proposed that decrease in
mix zone number can be compensated with increasing delay durations. Many
simulations are performed to test different number of mix zone deployment while
keeping unconnectivity similar. Results shows that privacy obtained in full de-
ployment of mix zones can be gained with low number of mix zones with high
delayed messages.
The more people use VANET, the more useful information can be obtained
for roads. Along with our proposed solutions retaining privacy of drivers can be
improved. This may help VANET to be accepted by more vehicle owners.
48
Page 59
Bibliography
[1] “Concept Cars: Audi A9.” http://www.diseno-art.com/encyclopedia/
concept_cars/audi_a9.html.
[2] “World Motor Vehicle 2012 Production Statistics,” 2012.
Availablefromhttp://oica.net.
[3] “Global status report on road safety 2013: supporting a decade of action,”
2013. www.who.int/iris/bitstream/10665/78256/1/9789241564564_
eng.pdf.
[4] H. Dok, H. Fu, R. Echevarria, and H. Weerasinghe, “Privacy issues of vehic-
ular ad hoc networks,” International Journal of Future Generation Commu-
nication and Networking, vol. 3, March 2010.
[5] J.-P. Hubaux, S. Capkun, and J. Luo, “The security and privacy of smart
vehicles,” IEEE Security and Privacy, vol. 4, no. 3, pp. 49–55, 2004.
[6] M. Lei, X. Hong, and S. V. Vrbsky, “Protecting location privacy with dy-
namic mac address exchanging in wireless networks,” In Proc. of IEEE
Globecom, Nov 2007.
[7] A. R. Beresford and F. Stajano, “Mix-zones: User privacy in location-aware
services,” In Proceedings of PerSec, 2004.
[8] J. Freudiger, M. Raya, M. Feleghhazi, P. Papadimitratos, and J.-P. Hubaux,
“Mix-zones for location privacy in vehicular networks,” WiN-ITS, 2007.
[9] L. Buttyan, T. Holczer, and I. Vajda, “On the effectiveness of chang-
ing pseudonyms to provide location privacy in vanets,” in In Proceedings
49
Page 60
of ESAS, vol. 4572 of Lecture Notes in Computer Science, pp. 129–141,
Springer, 2007.
[10] M. Behrisch, L. Bieker, J. Erdmann, and D. Krajzewicz, “Sumo - simulation
of urban mobility: An overview,” in SIMUL 2011, The Third International
Conference on Advances in System Simulation, (Barcelona, Spain), pp. 63–
68, October 2011.
[11] “Sumo.” http://sumo.sourceforge.net.
[12] “Citymobil.” http://www.citymobil-project.eu.
[13] “Trans.” http://lca.epfl.ch/projects/trans.
[14] X. Lin, R. Lu, and C. Lai, “Bibliography on secure vehicular communica-
tions,” 2012. http://bbcr.uwaterloo.ca/ rxlu/sevecombib.htm.
[15] M. Gerlach, “Assessing and improving privacy in vanets,” Proceedings of
Fourth Workshop on Embedded Security in Cars (ESCAR), 2006.
[16] L. Huang, K. Matsuura, H. Yamane, and K. Sezaki, “Enhancing wireless
location privacy using silent period,” IEEE Wireless Communications and
Networking Conference (WCNC), pp. 1187 – 1192, 2005.
[17] J.-H. Song, V. W. S. Wong, and V. C. M. Leung, “Wireless location privacy
protection in vehicular ad-hoc networks,” Proceedings of ICC, pp. 2699–2704,
2009.
[18] L. Huang, K. Matsuura, H. Yamane, and K. Sezaki, “Towards modeling wire-
less location privacy,” Proc. of the Workshop on Privacy Enhancing Tech-
nologies (PET), 2005.
[19] L. Buttyan, T. Holczer, A. Weimerskirch, and W. Whyte, “Slow: A practical
pseudonym changing scheme for location privacy in vanets,” IEEE Vehicular
Networking Conference (VNC), 2009.
[20] J. Freudiger, R. Shokri, and J.-P. Hubaux, “On the optimal placement of
mix zones,” Privacy Enhancing Technologies Symposium (PETS), 2009.
50
Page 61
[21] S. Krauß, Microscopic Modeling of Traffic Flow: Investigation of Collision
Free Vehicle Dynamics. PhD thesis, Koeln Univ. (Germany). Mathematisch-
Naturwissenschaftliche Fakultaet, 1998.
[22] “Definition of Vehicles, Vehicle Types and Routes.” http:
//sourceforge.net/apps/mediawiki/sumo/index.php?title=
Definition_of_Vehicles,_Vehicle_Types,_and_Routes.
[23] R. Dingledine, N. Mathewson, and P. F. Syverson, “Tor: The Second-
Generation Onion Router,” USENIX Security Symposium, pp. 303–320,
2004.
51


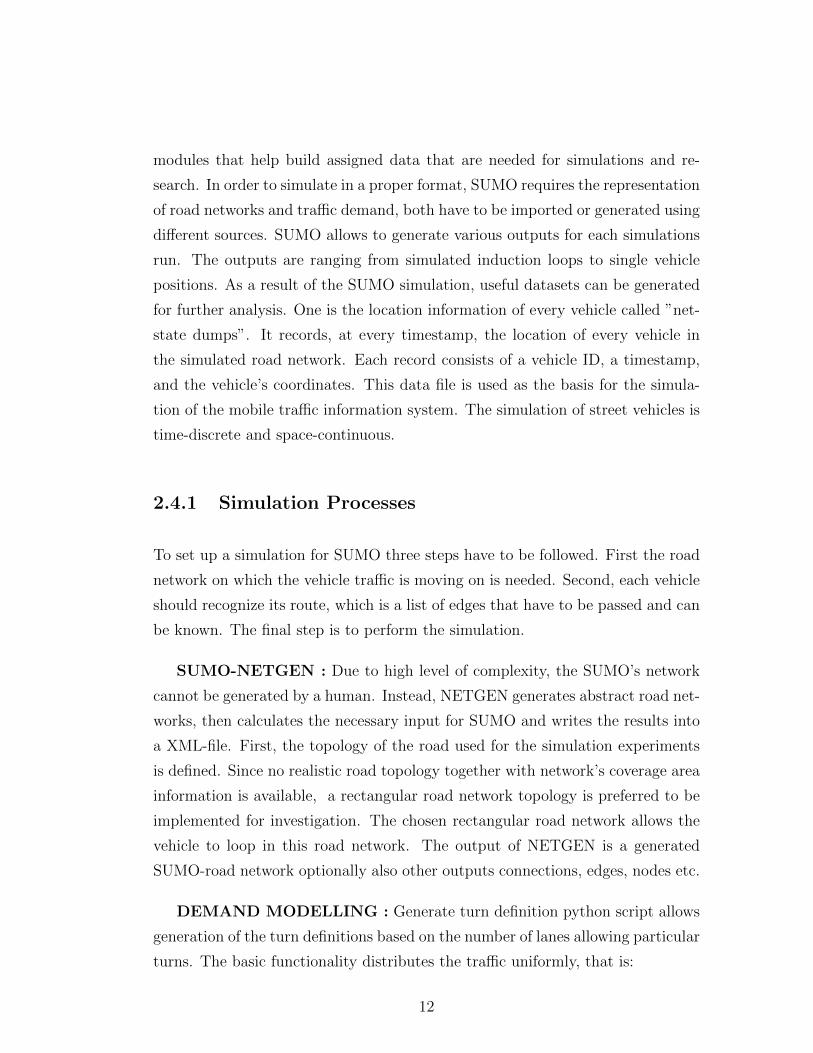
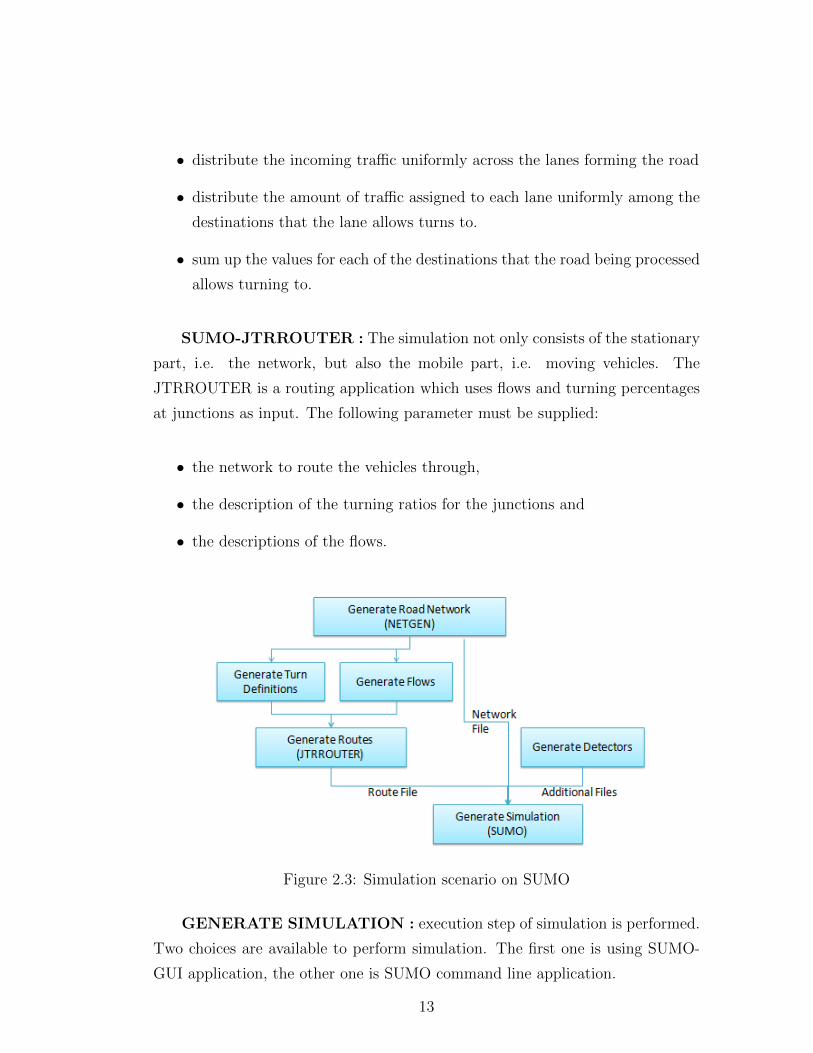


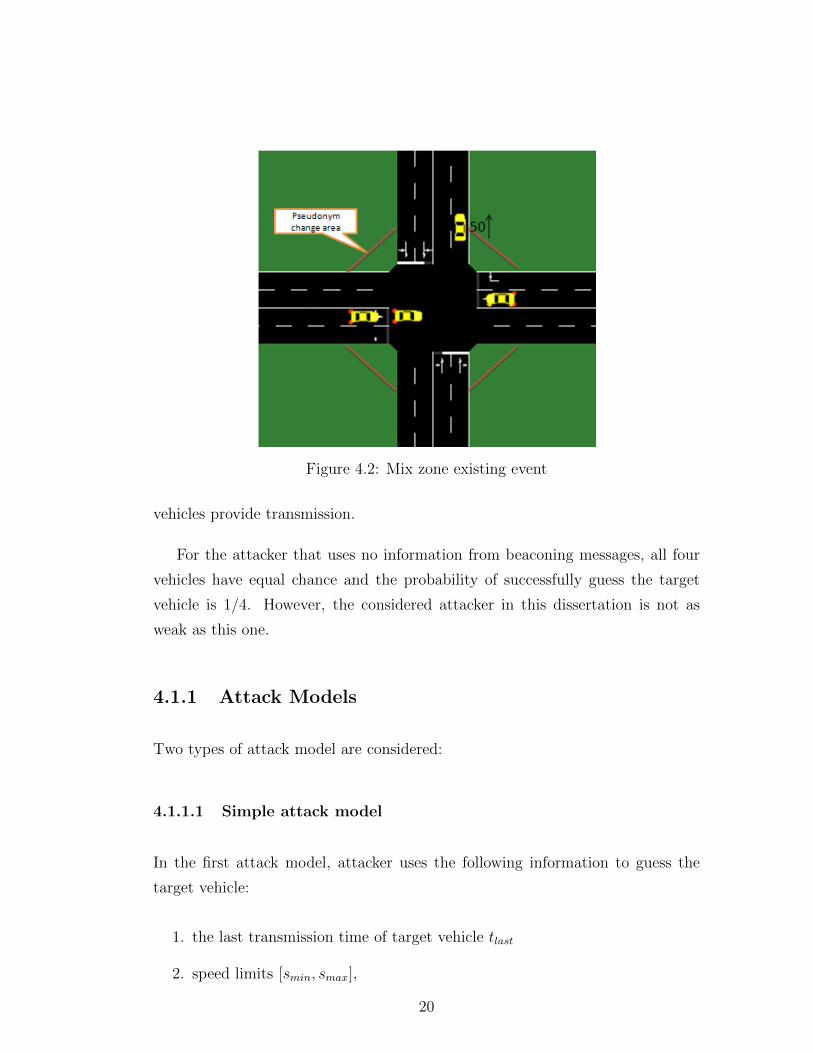


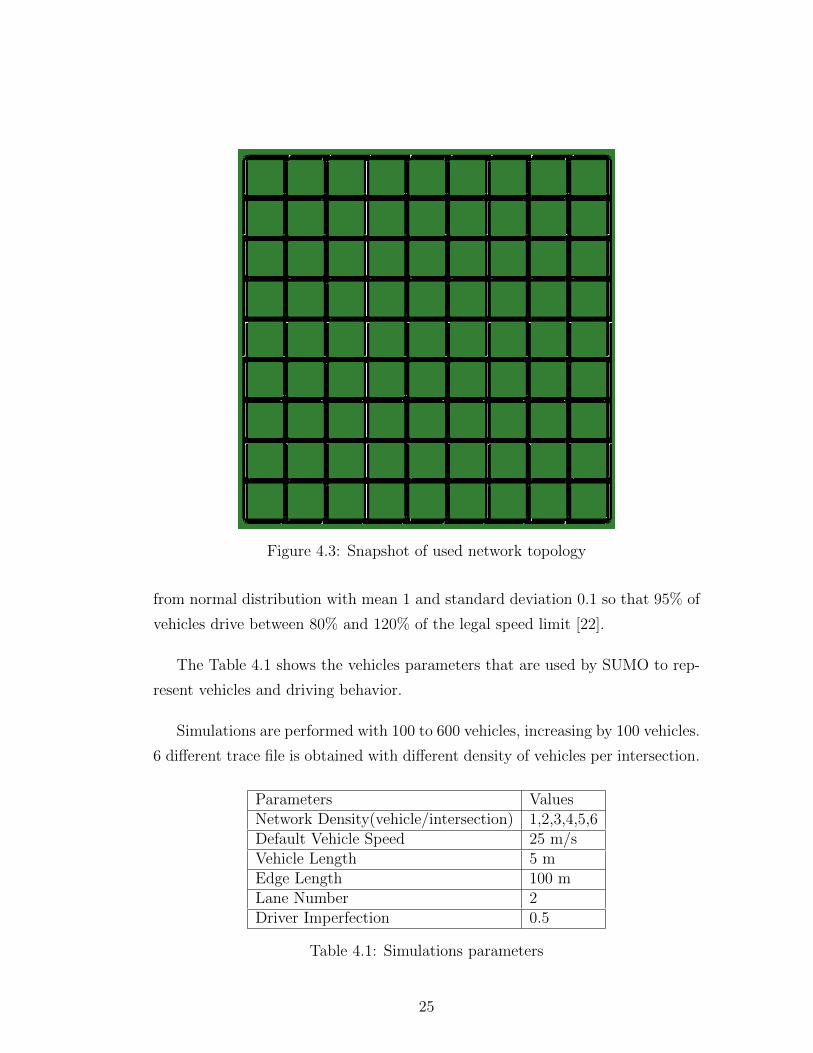

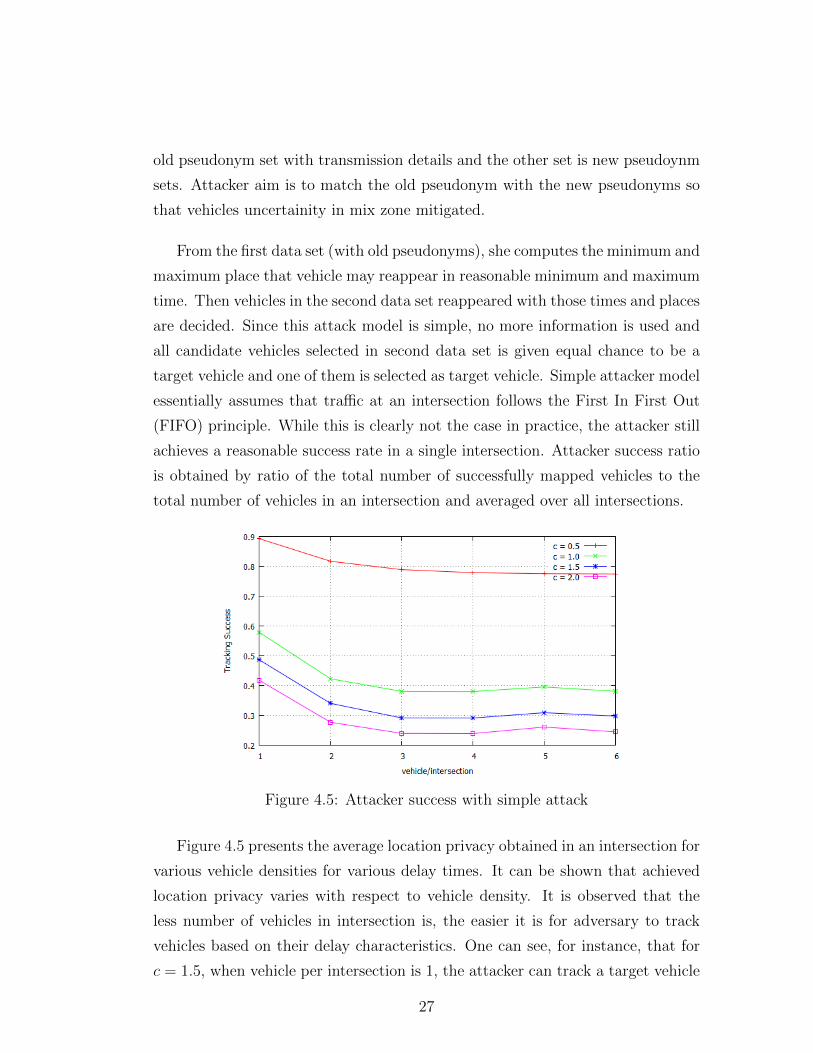
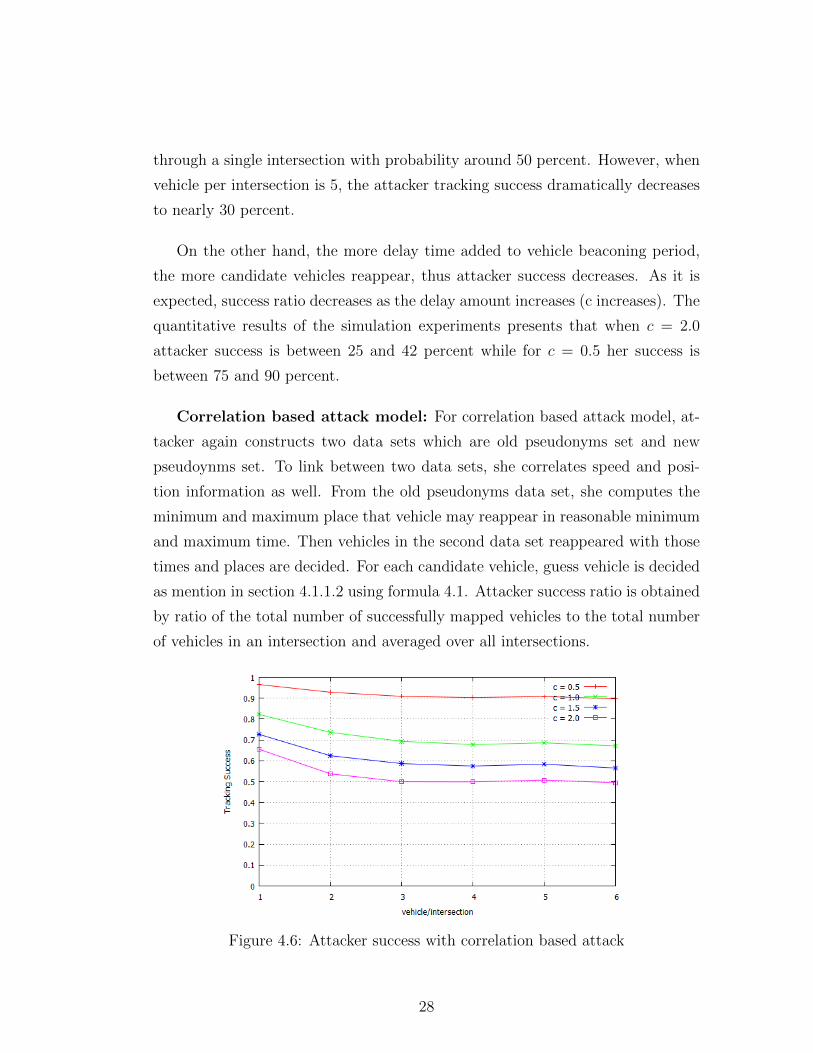
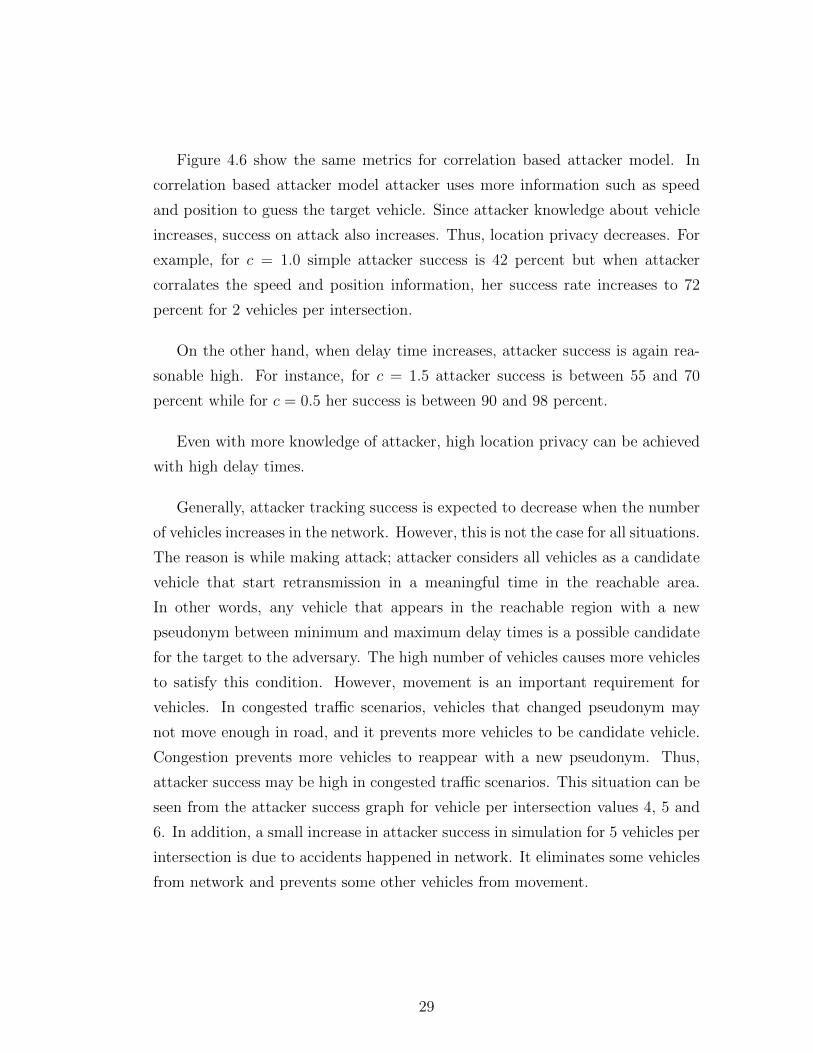


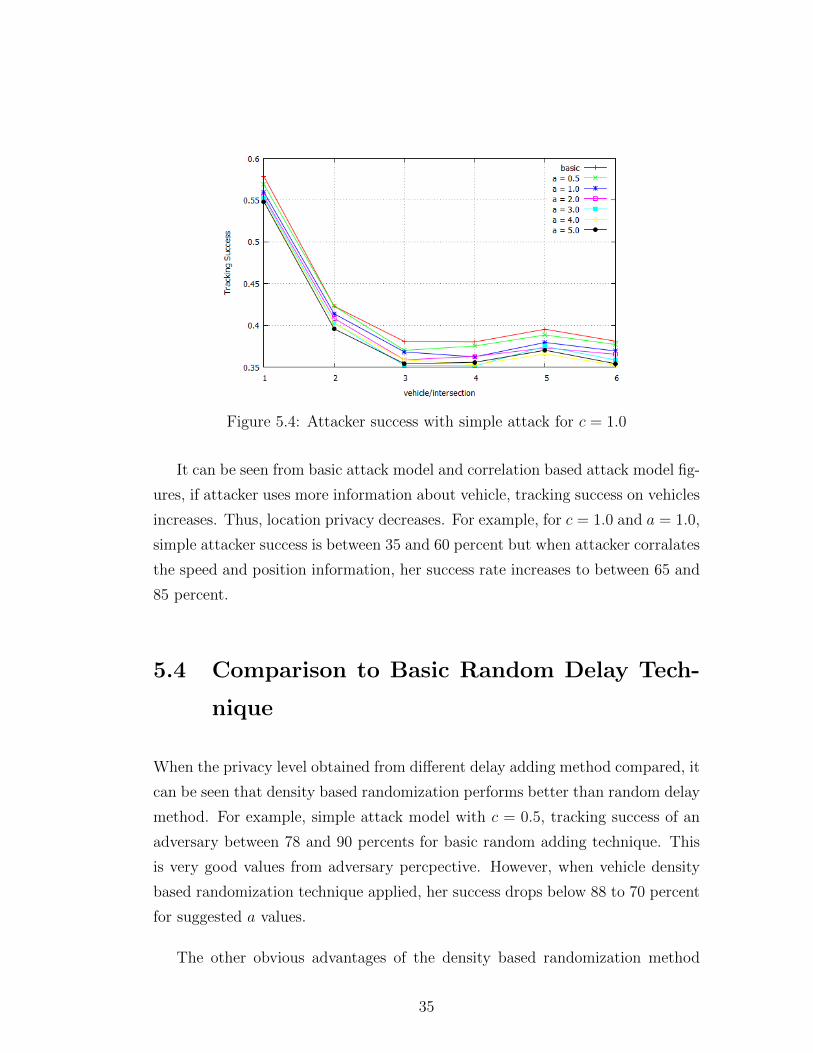


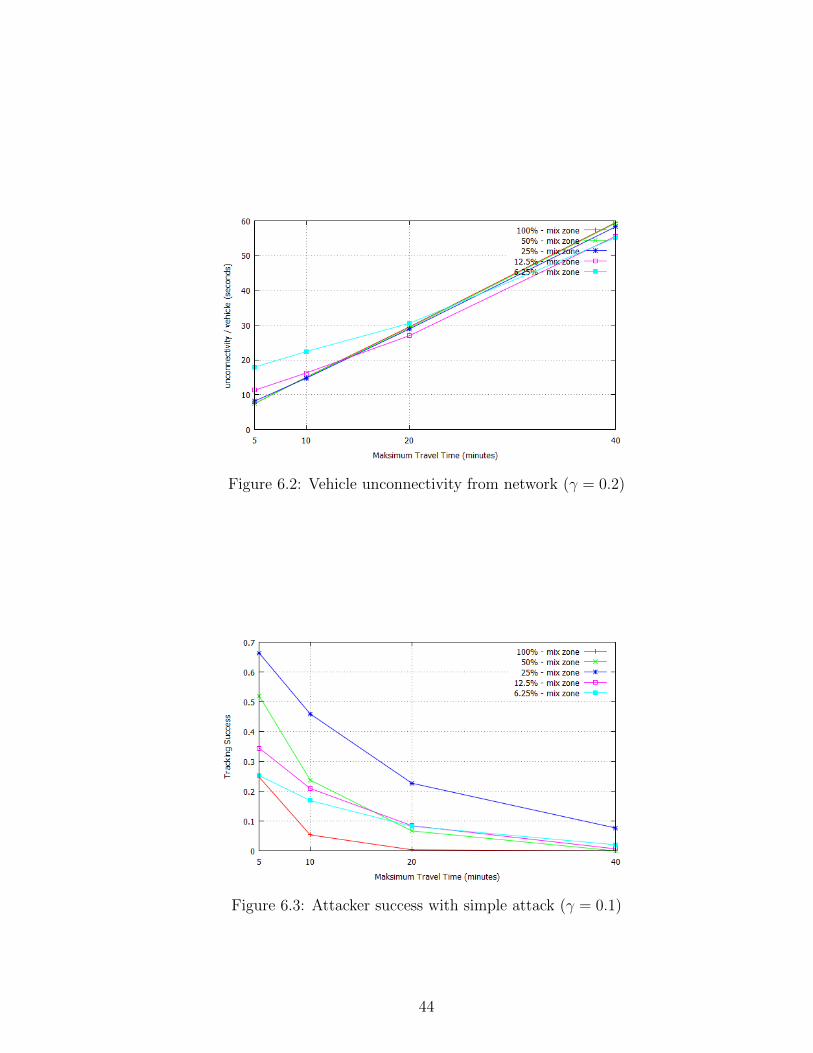


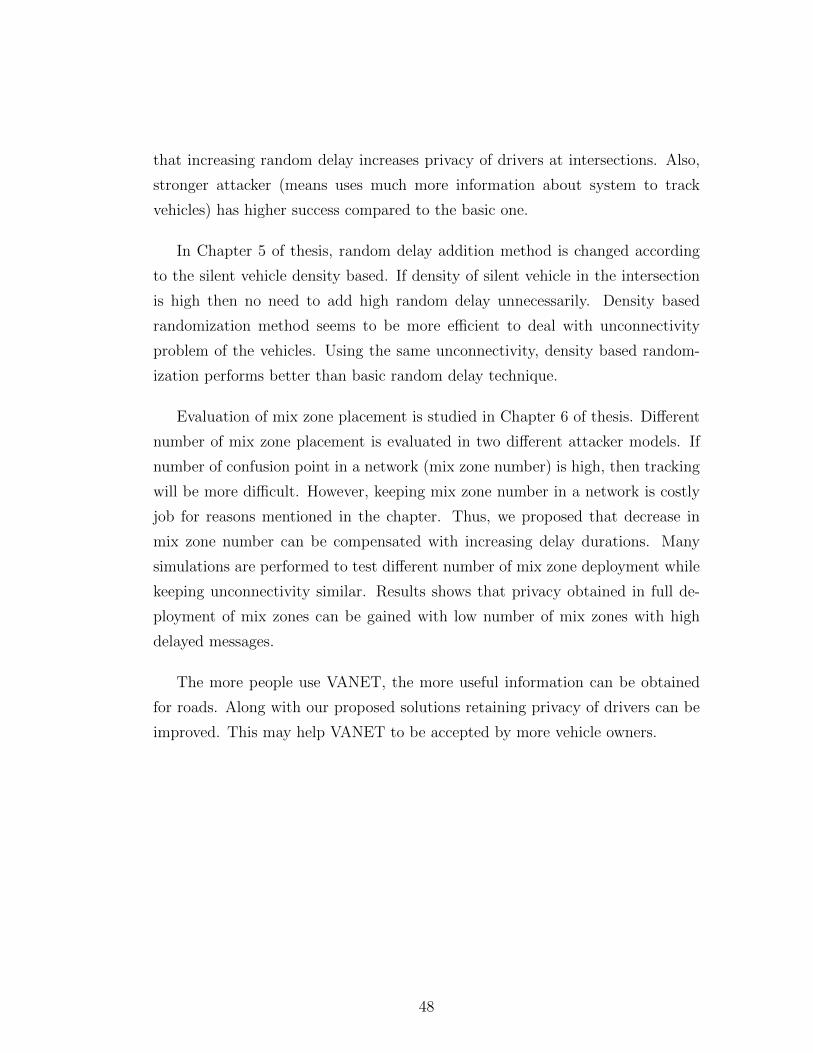


![Optimal trip planning in transport systems with random delayskeithbriggs.info/documents/Imperial_2010_11_23.pdf · Modelling train delay In order to calculate Prob[T a>˝], we will](https://static.documents.pub/doc/80x56/5f18d358423a347673195e71/optimal-trip-planning-in-transport-systems-with-random-modelling-train-delay-in.jpg)