28
150713 Random sampling project 2015 Report on random sampling of assessment in Authority subjects September 2015

1507
13
Random sampling project 2015 Report on random sampling of assessment in Authority subjects September 2015
© The State of Queensland (Queensland Curriculum and Assessment Authority) 2015
Queensland Curriculum and Assessment Authority PO Box 307 Spring Hill QLD 4004 Australia Level 7, 154 Melbourne Street, South Brisbane
Phone: +61 7 3864 0299 Fax: +61 7 3221 2553 Email: [email protected] Website: www.qcaa.qld.edu.au

Contents
Summary ____________________________________________ 1 Method ............................................................................................................... 1 Findings .............................................................................................................. 1 Conclusion .......................................................................................................... 2 Recommendations .............................................................................................. 2
Background __________________________________________ 3 Purpose .............................................................................................................. 3 Senior moderation process ................................................................................. 3
Work program approval ............................................................................................... 3 Monitoring .................................................................................................................... 3 Verification ................................................................................................................... 4 Comparability ............................................................................................................... 4 Confirmation ................................................................................................................ 4 Random sampling ........................................................................................................ 4
Project design ________________________________________ 5 Sampling procedure ........................................................................................... 5 Random sampling review panel procedures ....................................................... 7 Analysis of results ............................................................................................... 7 Folios requiring further review ............................................................................ 7
Findings _____________________________________________ 9 Overall differences .............................................................................................. 9 Subject analysis ................................................................................................ 13 District analysis ................................................................................................. 14 Serious disagreement ....................................................................................... 16 Submissions selected for additional review ...................................................... 17
Appendixes _________________________________________ 19 Appendix A: Random Sampling Form RS ........................................................ 19 Appendix B: Random Sampling Form RS1....................................................... 20 Appendix C: Random Sampling Form RS2 ...................................................... 21 Appendix D: Random Sampling Form RS3 ...................................................... 22 Appendix E: All subjects reviewed over the past 9 years ................................. 23

List of tables Table 1: Requested and received submissions and folios for the selected subjects ...................... 6 Table 2: Number of submissions requested from schools ............................................................... 6 Table 3: Absolute mean rung differences by subject ..................................................................... 13 Table 4: Comparison of random sampling and home district mean differences ........................... 16 Table 5: Cases of rung differences affecting level of achievement ............................................... 16 Table 6: Subject submissions selected for additional review (number of folios) ........................... 17 Table 7: Summary of additional review .......................................................................................... 18
List of figures Figure 1: Number of folios sampled for review by random sampling review panels by year .......... 7 Figure 2: Distribution of rung differences for folios .......................................................................... 9 Figure 3: Distribution of LoA differences for folios ......................................................................... 10 Figure 4: Comparison of percentage placed in same LoA ............................................................ 11 Figure 5: Comparison of rung differences across years ................................................................ 12 Figure 6: Absolute mean rung differences by district of the random sampling review panel ........ 14 Figure 7: Absolute mean rung differences for schools in each district .......................................... 15
Random sampling project 2015 Report on random sampling of assessment in Authority subjects
Queensland Curriculum & Assessment Authority September 2015
Page 1 of 24
Summary Random sampling of school judgments of student achievement in Authority subjects (the random sampling project) is one of the Queensland Curriculum and Assessment Authority’s (QCAA) quality-assurance procedures for senior certification. It has been conducted annually since 1994.
The principal purpose of the random sampling project is to evaluate the quality of school-based assessment programs and the comparability of teacher judgments of student achievement in Authority subjects across the state after completion of senior certification processes.
The key question considered for the random sampling project is:
How consistently do teachers around Queensland apply syllabus standards in determining students’ levels of achievement in Authority subjects?
Method For selected Authority subjects, a random sample of schools submit the Year 12 exit folio of a stratified random sample of seven students. The exit folios are sent to review panels from a different district to that of the submitting school. Since 2010, small and intermediate subject groups (with fewer than 14 students) have been included in the sample.
Requests for student folios are made to schools in November, after the final achievement decisions are reported to the QCAA. Schools submit folios to QCAA district offices.
Each year’s report focuses on results of students who completed Year 12 in the previous year.
Findings • A total of 1381 folios were reviewed from 140 schools across 9 subjects.
• Random sampling review panels generally found that, overall, there was substantial agreement between panels and schools:
− 93.8% of folios were placed in the same level of achievement (LoA) by both the random sampling panel and the school
− 94.3% were either agreed, or differed by no more than one-third of an LoA (three rungs or fewer)
− 94% of folios were agreed to within an LoA (consistent with previous years)
− there were no districts or schools within districts where large differences between school and panel judgments were evident. Small differences were found across most of the subjects sampled.
• Serious disagreement (defined as eight or more rung differences, with an LoA difference) was recorded for 1% of folios.
• The greatest variances were recorded for Information Technology Systems, Geography and Modern History.
• The subjects with the highest number of folios with rung differences of three or more were Modern History, Information Technology Systems, Business Communication and Technologies and Geography.

Random sampling project 2015 Report on random sampling of assessment in Authority subjects
Queensland Curriculum & Assessment Authority September 2015
Page 2 of 24
• Based on the level of disagreement recorded by random sampling panels, 21 submissions were requested for review. Subjects for which a further review was requested are in Table 6. Following further reviews, the number of folios with rung differences of three or more decreased for most subjects. For further information, see page 18.
Conclusion The random sampling project supports the view that the school-based assessment and moderation process for Authority subjects continues to be an effective quality-assurance process, valued by schools and panels.
Recommendations • Support continued professional development in 2016 by reviewing the current random
sampling project process for further improvement.
• Conduct training for Modern History, Information Technology Systems and Business Communication and Technologies review panels.

Random sampling project 2015 Report on random sampling of assessment in Authority subjects
Queensland Curriculum & Assessment Authority September 2015
Page 3 of 24
Background
Purpose The random sampling project contributes to the processes of moderation for the LoAs awarded on the Senior Statement. The project has been conducted each year since 1994.
Its purposes are to:
• evaluate the quality of school-based assessment and the comparability of teacher judgments of student achievement in Authority subjects across the state, i.e. to assess the strength of school decision-making in the system of school-based assessment for senior certification
• provide information on the quality of assessment procedures and assessment judgments in sampled subjects
• identify, at a systemic level, any issues concerning assessment and moderation that need further investigation.
The process of reviewing student folios for the random sampling project occurs in the year after the students have left school and after they have been issued with their Senior Education Profile (SEP). Therefore, the outcome does not influence the LoAs awarded to that cohort of students. Instead, the random sampling project checks the quality of school-based judgments after they have been made. However, the findings can contribute to further improvements in moderation processes.
Senior moderation process Moderation is the set of processes designed to:
• support the integrity of school-based assessment in Authority subjects
• strengthen the quality of teacher judgments of student achievement in Authority subjects
• ensure a high degree of comparability in certified LoAs in Authority subjects
• maintain the credibility and acceptability of the SEP.
Moderation begins with the approval of work programs for Authority syllabuses. The other moderation processes are monitoring, verification, comparability, confirmation and random sampling.
Work program approval Using the syllabus and the relevant work program requirements, schools write work programs that show how they intend to implement the syllabus. Review panels provide recommendations to the QCAA about the suitability of a work program for approval.
Monitoring The monitoring process is carried out at the end of February each year. It is a review of student folios sampled at the end of Year 11 — after half the course has been delivered. Review panels consider evidence of the school’s delivery of their courses of study and of their programs of assessment. They also consider school judgments of student achievement in Authority subjects, based on a sample of student folios from each school. Advice is given to schools early in Year 12 so that they can apply the advice to the assessment and judgments of the exiting cohort.
Random sampling project 2015 Report on random sampling of assessment in Authority subjects
Queensland Curriculum & Assessment Authority September 2015
Page 4 of 24
Verification The verification process occurs towards the end of Year 12. Schools submit sample student folios for the verification meeting in October. School submissions are sent to the relevant (usually district) review panel. These submissions consist of a sample of folios of work for students about to complete the course of study, together with the school’s judgments of interim LoAs for those students. Panellists review the folios for evidence to confirm the school’s judgments, and to confer with other panellists and the chair to formulate advice to the school. If the panel cannot confirm a school’s proposal, consultation between the school and the district review panel chair (DRPC) takes place. If the school and the DRPC cannot agree on all sample folios in a submission, the complete submission is sent to the relevant state review panel for further consideration.
Comparability Comparability is the process by which state review panels look for evidence that judgments about student achievement using standards are comparable across districts. Two agreed-to submissions from each district are sent to state review panels in November. State review panels review the threshold samples and give the QCAA advice about the comparability of LoAs across the state.
Confirmation Confirmation occurs following completion of Year 12. Schools forward their exit proposals to the QCAA in November, immediately after the final day for Year 12 students. QCAA officers review any changes to the LoAs that had been agreed to at verification. Legitimate changes can occur as a result of assessment in the final term of Year 12. The confirmation phase concludes when the QCAA reaches agreement with the school on its proposed results for recording on students’ Senior Statements.
Random sampling The sampling focuses on student exit folios, and occurs after the issue of SEPs. No changes in the recorded results in SEPs occur as a consequence of random sampling.
Random sampling refers to the process of sampling schools and students. However, subjects are not randomly selected, and some (smaller) subjects were not previously randomly sampled at all. Subjects are usually selected on the basis of their size (total number of students), stage of implementation or implementation issues.
Schools are chosen randomly within each subject. Before 2010, to be included, the school needed to have a large group (14 or more students) in that subject. Small (9 students or fewer) and intermediate (10–13 students) groups were generally not included because most of these students’ folios of work were assumed to have already been reviewed by their district or state panel. However, being reviewed by other districts is a valuable process and a key aspect of the random sampling project. Therefore, they are no longer excluded from selection.
For each chosen group, a random sample of students is selected, stratified by LoAs awarded to the students. The school is asked to provide the exit folios for these students, including each student’s LoA and rung placement (recorded on the Form RS, see Appendix A). These folios are called the random sampling submission.
Random sampling submissions are allocated randomly to other districts. The other district panel is referred to as the random sampling review panel when it is reviewing random sampling submissions.

Random sampling project 2015 Report on random sampling of assessment in Authority subjects
Queensland Curriculum & Assessment Authority September 2015
Page 5 of 24
District review panels (DRPs), acting as random sampling review panels, review random sampling submissions in February.
Project design
Sampling procedure This random sampling project focused on the Year 12 cohort of 2014.
Subjects were selected deliberately to include those with large statewide enrolments as well as other subjects of interest, such as those that had not previously been sampled or had not been sampled in recent years.
The selection criteria included:
• subjects not selected for two or more years
• subjects with a revised syllabus, with a Year 12 cohort completing the course for the first time
• subjects with a new or revised syllabus, with a Year 12 cohort completing the course for the second time
• subjects nominated from the outcomes of previous random sampling processes.
Schools were selected randomly within each of the districts under the following constraints (where possible):
• no more than three subject groups from one school
• a maximum of 26 school subject groups for any one subject.
A stratified random sample of student folios was selected within each school subject group (submission) with the following specifications:
• folios are selected by the QCAA, not the school
• if there are fewer than the required number of folios at any given LoA, folios are selected from the next LoA (moving towards the centre)
• if there are fewer than two Sound Achievement folios, folios are selected, in turn, from High Achievement, Very High Achievement, Low Achievement or Very Low Achievement.
The outcome of this selection process is shown in Table 1.
Random sampling project 2015 Report on random sampling of assessment in Authority subjects
Queensland Curriculum & Assessment Authority September 2015
Page 6 of 24
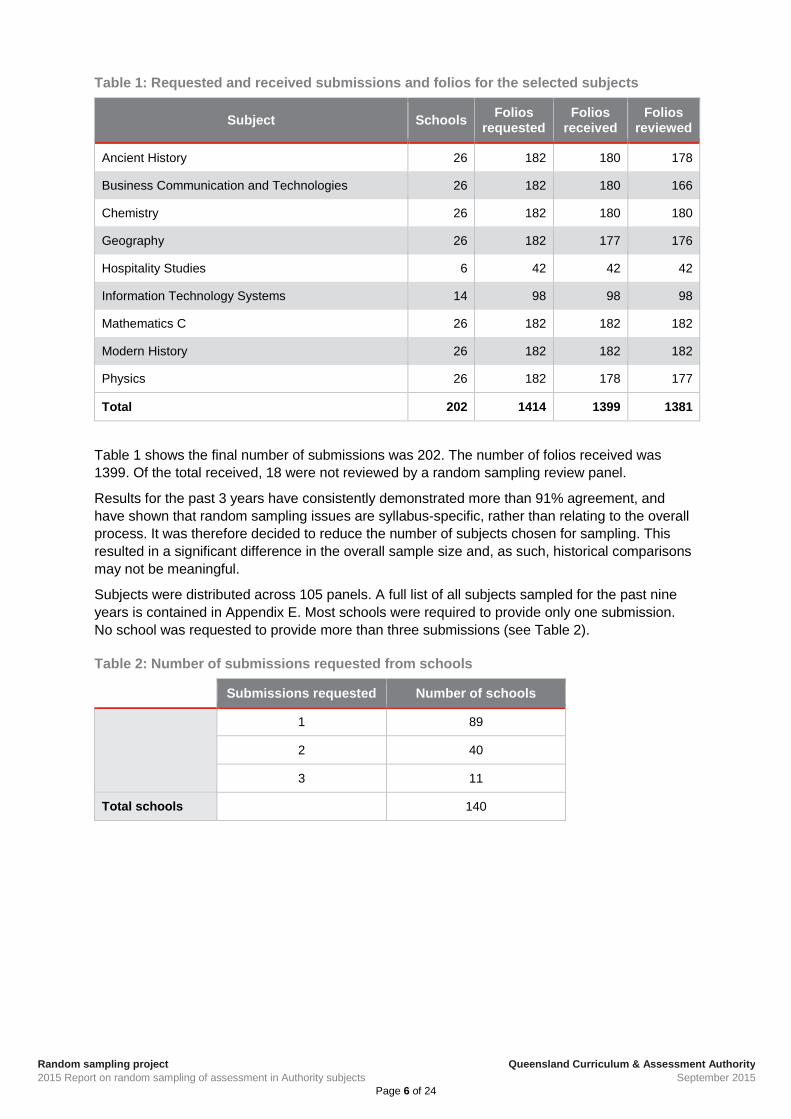
Table 1: Requested and received submissions and folios for the selected subjects
Subject Schools Folios requested
Folios received
Folios reviewed
Ancient History 26 182 180 178
Business Communication and Technologies 26 182 180 166
Chemistry 26 182 180 180
Geography 26 182 177 176
Hospitality Studies 6 42 42 42
Information Technology Systems 14 98 98 98
Mathematics C 26 182 182 182
Modern History 26 182 182 182
Physics 26 182 178 177
Total 202 1414 1399 1381
Table 1 shows the final number of submissions was 202. The number of folios received was 1399. Of the total received, 18 were not reviewed by a random sampling review panel.
Results for the past 3 years have consistently demonstrated more than 91% agreement, and have shown that random sampling issues are syllabus-specific, rather than relating to the overall process. It was therefore decided to reduce the number of subjects chosen for sampling. This resulted in a significant difference in the overall sample size and, as such, historical comparisons may not be meaningful.
Subjects were distributed across 105 panels. A full list of all subjects sampled for the past nine years is contained in Appendix E. Most schools were required to provide only one submission. No school was requested to provide more than three submissions (see Table 2).
Table 2: Number of submissions requested from schools
Submissions requested Number of schools
1 89
2 40
3 11
Total schools
140

Random sampling project 2015 Report on random sampling of assessment in Authority subjects
Queensland Curriculum & Assessment Authority September 2015
Page 7 of 24
Figure 1: Number of folios sampled for review by random sampling review panels by year
Random sampling review panel procedures Members of the DRPs (acting as random sampling review panels) examined each of the folios in the school submissions allocated to their panel and decided a specific rung placement (from 10 rungs within each LoA). The DRPC and one other panellist reviewed each submission independently, then met to reach consensus on each submission.
The reviewers were given advice on how to ensure that two independent reviews of the two submissions allocated to their district took place.
Analysis of results Rung/achievement placements allocated by schools and random sampling review panels were converted to a numerical scale of 1–50. The rung or level difference was calculated by subtracting the school’s exit rung (or level) placement from that of the panel. Negative differences therefore meant that the panel judged the school’s placement to be lower.
Folios requiring further review Folios with a significant difference (defined as eight or more rungs’ difference) between school judgment and panel judgment were identified and the following criteria were used to select submissions for further review by state review panellists (SRPs) and QCAA officers:
• highest proportion of subjects with eight or more rungs’ difference

Random sampling project 2015 Report on random sampling of assessment in Authority subjects
Queensland Curriculum & Assessment Authority September 2015
Page 8 of 24
• three or more students identified as having a change to rung level and/or LoA.
SRPs and QCAA officers independently reviewed these submissions and, after comparing the school judgment with the panel judgment, determined the appropriate action to be taken.
The information gained from this review will guide future professional development and training in specific subject areas.
Random sampling project 2015 Report on random sampling of assessment in Authority subjects
Queensland Curriculum & Assessment Authority September 2015
Page 9 of 24
Findings
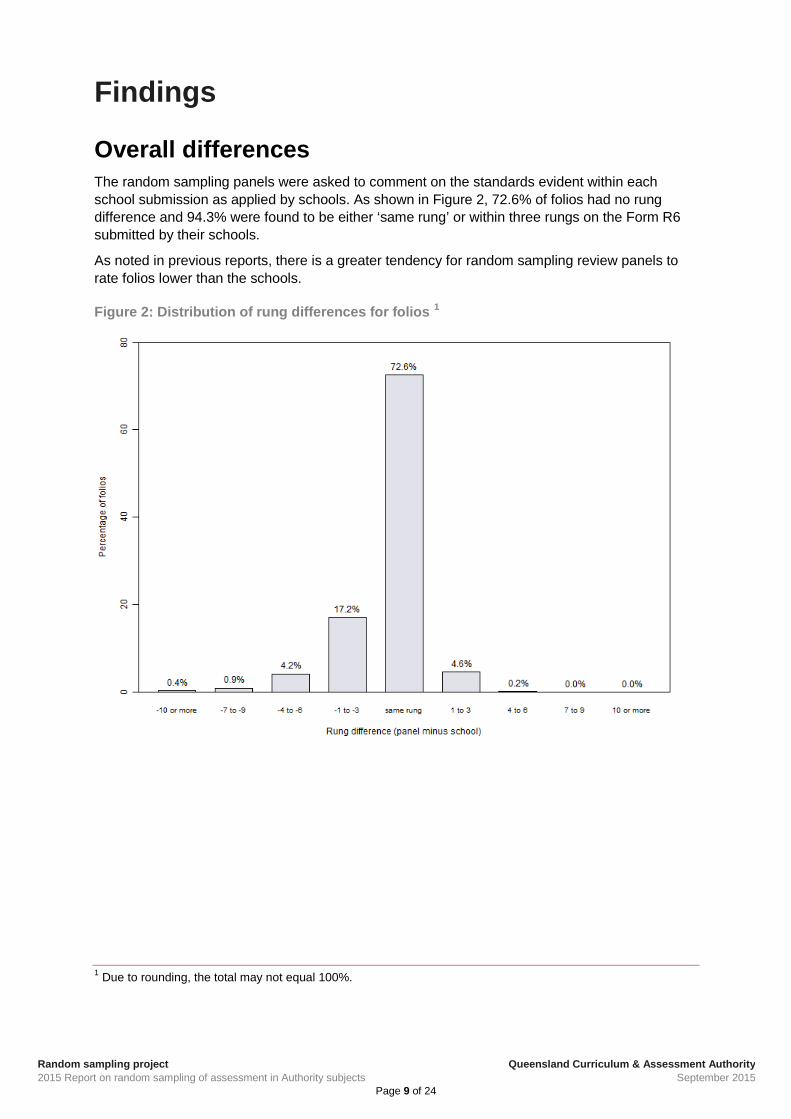
Overall differences The random sampling panels were asked to comment on the standards evident within each school submission as applied by schools. As shown in Figure 2, 72.6% of folios had no rung difference and 94.3% were found to be either ‘same rung’ or within three rungs on the Form R6 submitted by their schools.
As noted in previous reports, there is a greater tendency for random sampling review panels to rate folios lower than the schools.
Figure 2: Distribution of rung differences for folios 1
1 Due to rounding, the total may not equal 100%.

Random sampling project 2015 Report on random sampling of assessment in Authority subjects
Queensland Curriculum & Assessment Authority September 2015
Page 10 of 24
There was a high level of agreement between the random sampling review panels and the schools about LoAs awarded to folios. Figure 3 indicates that reviewers found that 93.8% of LoAs awarded by the school were supported. While 5.7% of folios were judged to have been placed one LoA too high at exit, 0.5% of folios were found to have been awarded one level too low.
Figure 3: Distribution of LoA differences for folios 2
2 Due to rounding, the total may not equal 100%.

Random sampling project 2015 Report on random sampling of assessment in Authority subjects
Queensland Curriculum & Assessment Authority September 2015
Page 11 of 24
Figure 4 shows that there has been some variation over time in the percentage of folios considered by random sampling review panels to have been placed appropriately in terms of LoA overall. At 94%, the 2015 result is consistent with the past few years.3
Figure 4: Comparison of percentage placed in same LoA
3 Readers should note smaller sample size of current report.

Random sampling project 2015 Report on random sampling of assessment in Authority subjects
Queensland Curriculum & Assessment Authority September 2015
Page 12 of 24
Figure 5 shows the historical comparisons for rung differences from 2007 to 2015. The 2015 results are generally consistent with past results.4
Figure 5: Comparison of rung differences across years
4 Readers should note smaller sample size of current report.

Random sampling project 2015 Report on random sampling of assessment in Authority subjects
Queensland Curriculum & Assessment Authority September 2015
Page 13 of 24
Subject analysis Table 3 summarises the absolute mean rung differences by subject over time.5 The absolute mean does not take into consideration the direction of difference and therefore provides an overall indication of the degree of consistency in judgment based on rungs. The overall mean and standard deviation are for all subjects sampled in that year (not just those appearing in the table).
The table reinforces the trend noted in Figure 5 that 2015 has one of the highest levels of agreement of standards for any year, as reflected by the lowest absolute mean value. It also highlights that there was only one common subject in the 2014 and 2015 samples (Business Communication and Technologies).
Information Technology Systems, Geography and Modern History have the largest average mean differences.
The absolute mean for most subjects is lower than for any previous year.
Chemistry, Mathematics C and Ancient History have the smallest absolute mean rung differences.
Table 3: Absolute mean rung differences by subject
Subject 2007 2008 2009 2010 2011 2012 2013 2014 2015
Ancient History 2.16 1.45 1.76 1.19 0.7 0.56
Business Communication & Technologies
1.89 1.76 0.3 0.53 0.73
Chemistry 1.2 1.83 2.15 0.95 0.38
Geography 1.52 2.04 1.94 0.71 0.97
Hospitality Studies 0.98 1.84 0.45 0.5 0.67
Information Technology Systems 1.37 2.3 2.71 1.66 1.16 1.47
Mathematics C 1.62 2.42 1.88 1.9 0.91 0.55
Modern History 1.75 2.17 2.71 2.34 0.83 0.86 0.92
Physics 2.16 1.97 2.3 0.9 0.64
Standard deviation 1.89 1.79 2.72 2.71 2.35 1.69 1.78 1.58 1.54
Overall mean(absolute) 1.7 1.55 2.11 2.09 2.12 0.9 0.84 0.81 0.73
5 Readers should note smaller sample size of current report.

Random sampling project 2015 Report on random sampling of assessment in Authority subjects
Queensland Curriculum & Assessment Authority September 2015
Page 14 of 24
District analysis Figure 6 compares absolute mean rung differences for random sampling panels in each district. Panels in the Townsville and Brisbane Central districts had the highest level of disagreement with the decisions made by schools about student placement across all subjects reviewed by the district.
Figure 6: Absolute mean rung differences by district of the random sampling review panel
Random sampling project 2015 Report on random sampling of assessment in Authority subjects
Queensland Curriculum & Assessment Authority September 2015
Page 15 of 24
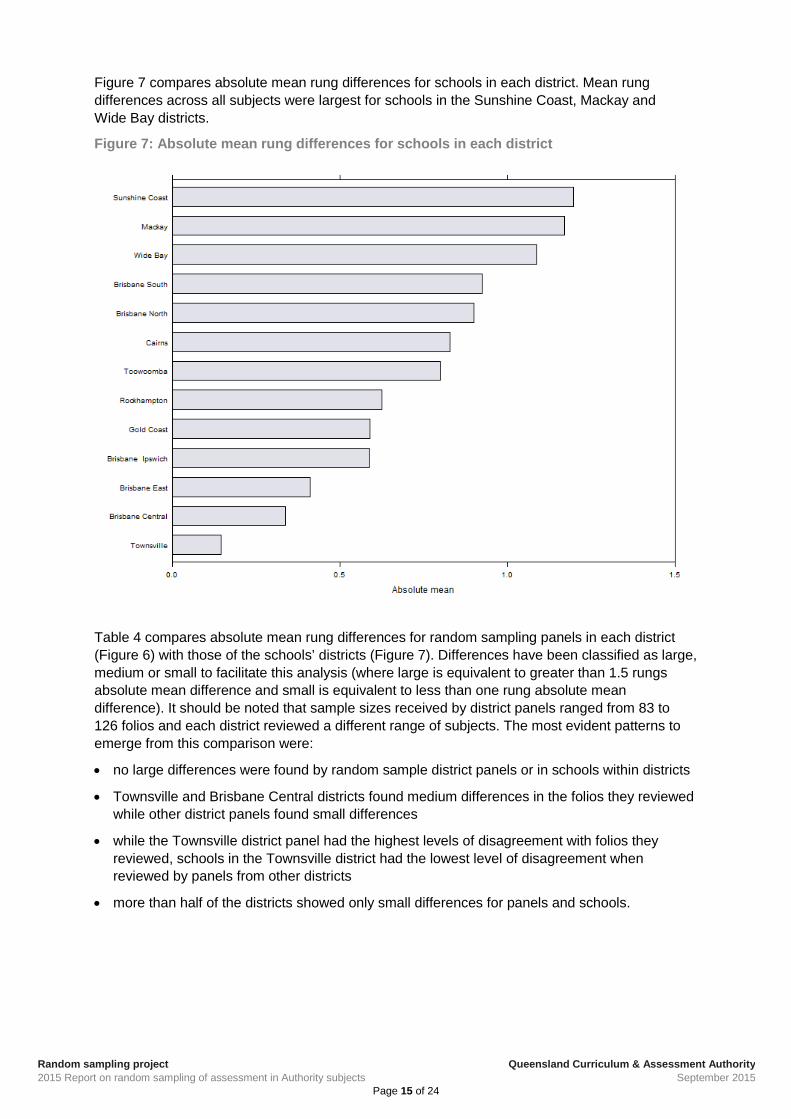
Figure 7 compares absolute mean rung differences for schools in each district. Mean rung differences across all subjects were largest for schools in the Sunshine Coast, Mackay and Wide Bay districts.
Figure 7: Absolute mean rung differences for schools in each district
Table 4 compares absolute mean rung differences for random sampling panels in each district (Figure 6) with those of the schools’ districts (Figure 7). Differences have been classified as large, medium or small to facilitate this analysis (where large is equivalent to greater than 1.5 rungs absolute mean difference and small is equivalent to less than one rung absolute mean difference). It should be noted that sample sizes received by district panels ranged from 83 to 126 folios and each district reviewed a different range of subjects. The most evident patterns to emerge from this comparison were:
• no large differences were found by random sample district panels or in schools within districts
• Townsville and Brisbane Central districts found medium differences in the folios they reviewed while other district panels found small differences
• while the Townsville district panel had the highest levels of disagreement with folios they reviewed, schools in the Townsville district had the lowest level of disagreement when reviewed by panels from other districts
• more than half of the districts showed only small differences for panels and schools.

Random sampling project 2015 Report on random sampling of assessment in Authority subjects
Queensland Curriculum & Assessment Authority September 2015
Page 16 of 24
Table 4: Comparison of random sampling and home district mean differences
Random sampling district panels Sc
hool
’s d
istr
ict
Difference Large Medium Small
Large (>1.5)
Medium (1-1.5)
Mackay Sunshine Coast Wide Bay
Small (<1)
Brisbane Central Townsville
Brisbane East Brisbane Ipswich Brisbane North Brisbane South Cairns Gold Coast Rockhampton Toowoomba
Serious disagreement Each year, the random sampling project report quotes figures for the level of serious disagreement over the exit LoAs awarded to folios. Table 5 summarises the rung differences where there has been an LoA difference. Over the years, the percentage of folios considered to have serious disagreement has ranged from 1% to 3%. At 1%, this remains consistent in 2015.6
Table 5: Cases of rung differences affecting level of achievement
2007 2008 2009 2010 2011 2012 2013 2014 2015
Sample size 1800 2248 2662 2774 3224 2649 3136 3192 1414
Different LoA with 1–2 rung differences
80 (4%)
114 (5%)
150 (6%)
146 (5%)
130 (4%)
79 (3%)
113 (4%)
113 (4%)
39 (3%)
Different LoA with 3–7 rung differences
105 (6%)
160 (7%)
191 (7%)
209 (8%)
198 (6%)
116 (4%)
126 (4%)
140 (4%)
35 (2%)
Different LoA with 8+ rung differences
32 (2%)
23 (1%)
71 (3%)
68 (2%)
93 (3%)
26 (1%)
27 (1%)
19 (1%)
12 (1%)
Total with different LoA 217 297 412 423 421 221 267 272 86
6 Readers should note smaller sample size of current report.

Random sampling project 2015 Report on random sampling of assessment in Authority subjects
Queensland Curriculum & Assessment Authority September 2015
Page 17 of 24
Submissions selected for additional review After the initial review, 21 submissions (containing 49 folios) were recalled for additional review. Table 6 summarises the selected submissions. SRPs or senior education officers (SEOs) from the QCAA completed the additional reviews.
Modern History had the largest number of folios requiring additional review, followed by Information Technology Systems, Business Communication and Technologies and Geography.
After the additional review there were fewer folios with disagreements, indicating that the state panellists were more likely to agree with the schools’ placement of students.
Table 6: Subject submissions selected for additional review (number of folios)
Subject Submissions Total folios Number of folios with differences
Before SRP
review After SRP
review
Ancient History 1 2 2 1
Business Communication & Technologies 3 8 8 2
Chemistry 1 2 2 0
Geography 3 7 6 5
Hospitality Studies 1 2 2 2
Information Technology Systems 4 10 9 6
Modern History 5 12 8 5
Physics 3 6 5 5
Total 21 49 37 20
SRPs and SEOs were asked to provide an independent assessment of the selected folios. The results of this review are summarised in Table 7.
The mean rung difference declined after the additional review. Despite an increase in the number of folios with small differences to rung placement, there is a smaller number with an LoA difference. Further review of additional folios is more likely to reduce the amount of disparity between school and random sampling review panel judgments.
The greatest number of discrepancies remained for Information Technology Systems, Business Communication & Technologies, Modern History and Geography.

Random sampling project 2015 Report on random sampling of assessment in Authority subjects
Queensland Curriculum & Assessment Authority September 2015
Page 18 of 24
Table 7: Summary of additional review
Number of folios with differences
After random sampling After second review
1–2 rung differences 4 17
3–7 rung differences 33 24
8+ rung differences 12 8
Different LoA 49 23
Mean rung difference 0.43 0.16
Absolute mean rung difference 5.29 4.45

Random sampling project 2015 Report on random sampling of assessment in Authority subjects
Queensland Curriculum & Assessment Authority September 2015
Page 19 of 24
Appendixes
Appendix A: Random Sampling Form RS1
Random sampling project 2015 Report on random sampling of assessment in Authority subjects
Queensland Curriculum & Assessment Authority September 2015
Page 20 of 24
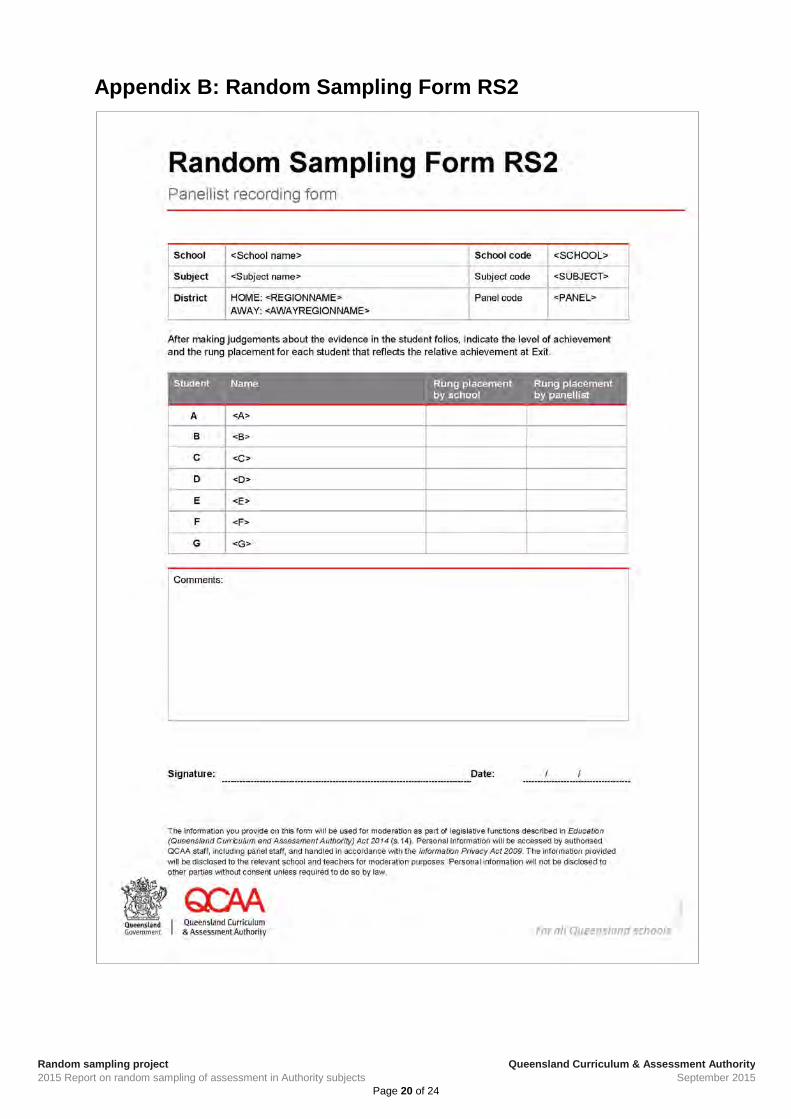
Appendix B: Random Sampling Form RS2

Random sampling project 2015 Report on random sampling of assessment in Authority subjects
Queensland Curriculum & Assessment Authority September 2015
Page 21 of 24
Appendix C: Random Sampling Form RS3

Random sampling project 2015 Report on random sampling of assessment in Authority subjects
Queensland Curriculum & Assessment Authority September 2015
Page 22 of 24
Appendix D: Random Sampling Form RS4

Random sampling project 2015 Report on random sampling of assessment in Authority subjects
Queensland Curriculum & Assessment Authority September 2015
Page 23 of 24
Appendix E: All subjects reviewed over the past 9 years
Subject 2007 2008 2009 2010 2011 2012 2013 2014 2015
English
* *
*
* *
French
*
* *
*
German
* *
*
Italian
Japanese
*
* *
*
Chinese
* *
*
Ancient History * *
*
* *
*
Modern History * * * *
* *
*
Aboriginal & Torres Strait Islander Studies
Geography
* * *
*
*
Economics *
*
* * * *
Study of Society
Legal Studies *
* * *
*
Mathematics A *
*
* *
*
Mathematics B *
*
* *
*
Mathematics C *
* * *
*
*
Chemistry
*
* *
*
*
Physics
*
* *
*
*
Biology
* *
* *
*
Earth Science
Marine Studies
*
*
*
*
Science21
*
* *
Agricultural Science
*
* *
*
Accounting
*
* * * *
Business Communication & Technologies
*
* *
* *
Information Technology Systems *
* *
* *
*
Health Education
*
* *
Physical Education * *
*
* * *

Random sampling project 2015 Report on random sampling of assessment in Authority subjects
Queensland Curriculum & Assessment Authority September 2015
Page 24 of 24
Subject 2007 2008 2009 2010 2011 2012 2013 2014 2015
Home Economics
* * *
* *
Hospitality Studies
*
*
* *
*
Engineering Technology
*
Graphics *
* *
*
Technology Studies
* *
*
Visual Art
* *
* *
*
Dance
*
*
* *
Study of Religion
* * * *
*
Information Processing & Technology *
* * *
* *
Drama
*
* *
*
Music
* *
* *
*
Film Television & New Media
* *
*
*


