26
Range Clearance Production Function Estimation for Explosive Ordnance Disposal Dr. Brice Stone, Mr. Jonathan Fast and Mr. Gary Grimes Metrica, Inc. November 1999
| Date post: | 31-Dec-2015 |
| Category: |
Documents |
| Upload: | jack-pitts |
| View: | 221 times |
| Download: | 1 times |

Range Clearance Production Function Estimation for
Explosive Ordnance Disposal
Dr. Brice Stone, Mr. Jonathan Fast
and Mr. Gary Grimes
Metrica, Inc.
November 1999

2
Overview
• Objective
• Methodological Approach– Objective Data– Survey Data
• Survey Results
• Model Development
• Interpretation of Modeling and Analysis

3
Research Objective
Determine manpower requirementsfor EOD personnel to perform
explosives decontaminationand thermal treatment
on Air Force Weapons and Training Ranges

4
Methodological Approach
• Survey based approach
• Objective data - Form 3578
• Combined use of survey and objective data– Developing supplemental data for analysis– Verification/Validation of objective data

5
Modeling Range Cleaning
• Range cleaning as a production function
• Single equation model– Man hours– Density function
• Simultaneous system– Acres cleaned– Tonnage– Quantity of nomenclature

6
Key Data Elements
• Man hours
• Acres cleared
• Type of terrain and/or weather or seasons– Desert– Mountains– Marshy, swamps– Brush

7
Key Data Elements (Cont’d.)
• Type of clearance– 50 use day– annual– 5 year
• Year of occurrence and season
• Density of ordnance (tonnage)
8
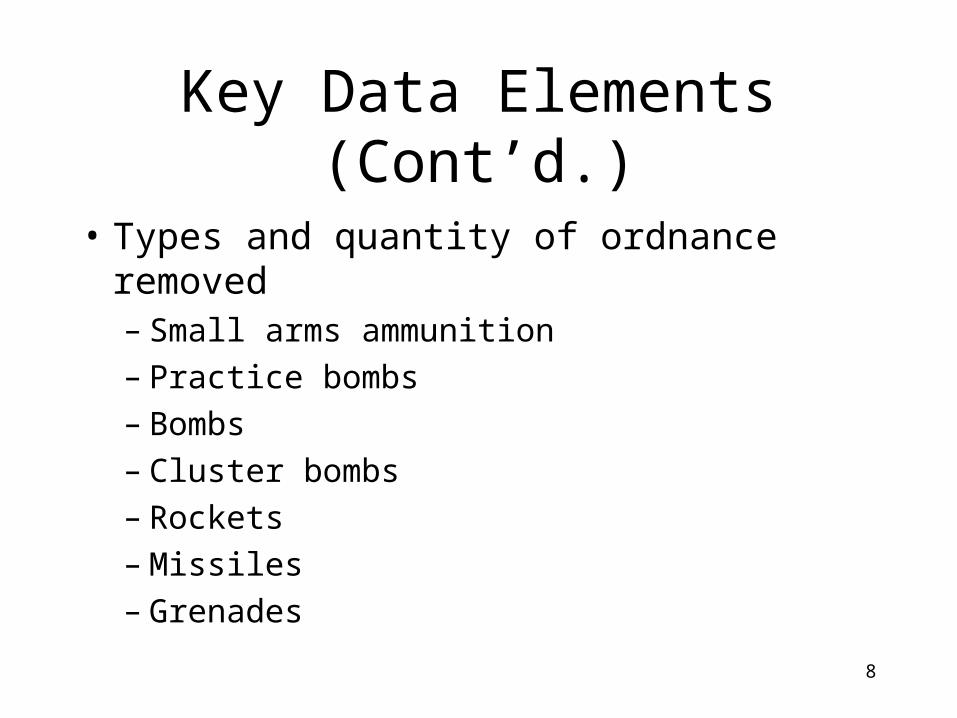
Key Data Elements (Cont’d.)
• Types and quantity of ordnance removed– Small arms ammunition– Practice bombs– Bombs– Cluster bombs– Rockets– Missiles– Grenades

9
Survey Structure
• Paper and pencil
• Questions concerning range cleaning tasks and manpower used
• Bases surveyed
• Responses rates

10
Ranges/Bases Surveyed
BaseNumber ofResponses
Barksdale 1Cannon 1Dover 1Edwards 1Eglin 15Eielson 3Hill 7Holloman 3Kadena 2Luke 7McConnell 1Mount Home 2Nellis 63Osan 2Seymour Johnson 2Shaw 1Spangdahlem,Germany 1
Total Surveys 113

11
Size of Ranges by Base
Base Smallest Largest Average AcresBarksdale - - 672Cannon - - Not ProvidedDover - - 9,416Edwards - - 92,160Eglin 320 16,000 3,439Eielson 22,880 160,600 77,160Hill 126 14,080 5,932Holloman 5,000 17,000 59,000Kadena 10 40 25Luke 30,535 116,444 66,506McConnell - - 34,000Mount Home - - 110,000Nellis 31 1,506,622 244,400Osan - - 45Seymour Johnson 46,421 46,621 46,521Shaw - - 13,600Spangdahlem,Germany
- - 676
Across Surveys 10 1,506,622 155,688

12
Types of Clearance by Base
Base/Range50 Use
Day
Annual orPartial
Five Year Five YearBarksdale 1 1 N/ACannon 1 N/A 1Dover 1 1 1Edwards 1 N/A 1Eglin N/A 7 N/AEielson N/A 3 N/AHill 1 7 5Holloman 1 3 N/AKadena N/A 2 N/ALuke 4 7 4McConnell N/A 1 1Mount Home 1 1 N/ANellis 8 9 N/AOsan 1 1 N/ASeymourJohnson 1 1 1Shaw 1 1 1Spangdahlem, Germany 1 1 1Across Bases 23 46 16
13
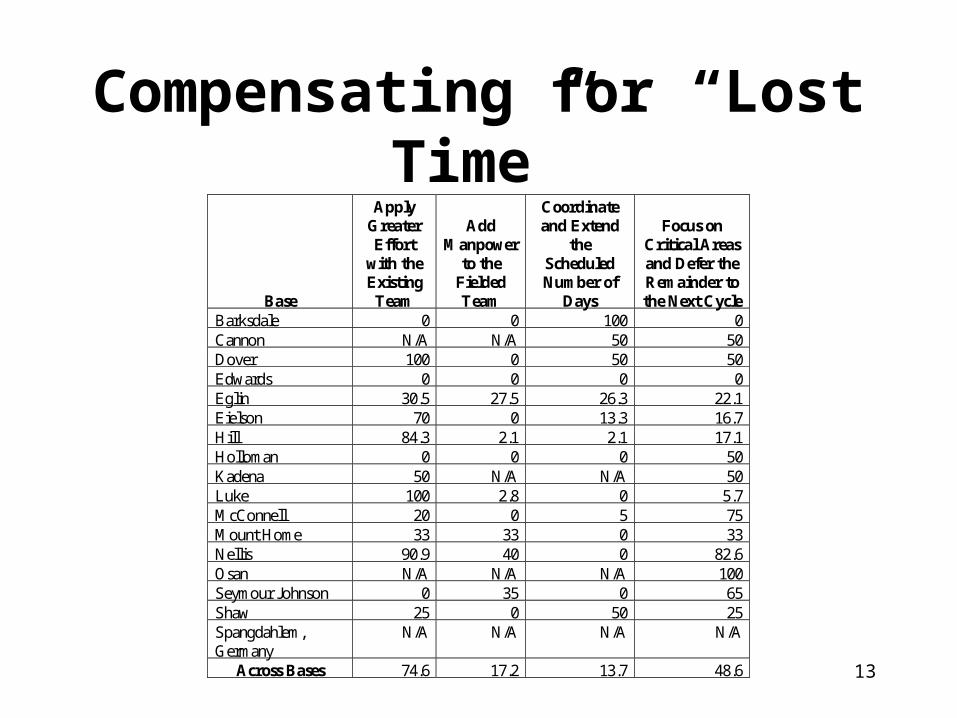
Compensating for “Lost Time”
Base
ApplyGreaterEffort
with theExisting
Team
AddManpower
to theFieldedTeam
Coordinateand Extend
theScheduledNumber of
Days
Focus onCritical Areasand Defer theRemainder tothe Next Cycle
Barksdale 0 0 100 0Cannon N/A N/A 50 50Dover 100 0 50 50Edwards 0 0 0 0Eglin 30.5 27.5 26.3 22.1Eielson 70 0 13.3 16.7Hill 84.3 2.1 2.1 17.1Holloman 0 0 0 50Kadena 50 N/A N/A 50Luke 100 2.8 0 5.7McConnell 20 0 5 75Mount Home 33 33 0 33Nellis 90.9 40 0 82.6Osan N/A N/A N/A 100Seymour Johnson 0 35 0 65Shaw 25 0 50 25Spangdahlem,Germany
N/A N/A N/A N/A
Across Bases 74.6 17.2 13.7 48.6

14
Means for EOD Personnel Used, Duration of Clearance and Acres Cleared by Base
Base/Range
Number ofEOD
Personnel
Number ofAcres
Cleared
Duration(Hours) ofClearance
Barksdale 6 672 40Cannon 12 20,010 26.1Dover 5.3 3,230 280Edwards 10 35 5.3Eglin 8.6 190 76.9Eielson 14.3 2,767 1,866.7Hill 15.5 8,003 85.4Holloman 3.8 17,125 92.5Kadena 7 15 140Luke 12.9 8,101 548.5McConnell 17.5 23,440 120Mount Home 12 55,027 9Nellis 12.7 39,909 139.6Osan 6 40 8SeymourJohnson
4.5 279 29
Shaw 10.3 8,355 410Spangdahlem, Germany 5 261 118.7Across Bases 11.1 13,604 250.3

15
Acres Per Man Hour for Annual Clearances by Base
Survey(1998)
AF Form 3578(1992-1995)
BaseAcres Per ManHour – Mean
Number ofObservations
Acres Per ManHour - Mean
Number ofObservations*
Barksdale 2.80 1 1.17 1Cannon 0.04 1 0.58 2Dover N/A N/A N/A N/AEdwards N/A N/A N/A N/AEglin 0.22 5 2.20 6Eielson 1.02 3 N/A N/AHill 7.90 6 9.92 15Holloman 39.32 3 6.22 5Kadena 0.03 2 N/A N/ALuke 2.88 7 4.22 28McConnell 6.44 1 N/A N/AMount Home 55.00 1 6.36 3Nellis 22.31** 9 5.28** 7Osan 0.16 1 N/A N/ASeymourJohnson 39.13 1 N/A N/AShaw 1.67 1 2.79 2Spangdahlem,Germany 0.23 1 N/A N/AAcross Bases 11.53** 43 4.70** 85

16
Acres Per Man Hour for Five Year Clearances by Base
Survey AF Form 3578
BaseAcres Per ManHour – Mean
Number ofObservations
Acres Per ManHour - Mean
Number ofObservations*
Barksdale N/A N/A 1.01 2Cannon 53.33 1 125.00 1Dover 15.02 1 N/A N/AEdwards N/A N/A N/A N/AEglin N/A N/A N/A N/AEielson N/A N/A 0.65 1Hill 5.84 5 30.07 4Holloman N/A N/A N/A N/AKadena N/A N/A N/A N/ALuke 11.03 3 14.62 11McConnell 8.50 1 N/A N/AMount Home N/A N/A N/A N/ANellis N/A N/A 12.32 5Osan N/A N/A N/A N/ASeymourJohnson 1.67 1 2.79 2Shaw 13.91 1 7.73 1Spangdahlem,Germany 1.88 1Across Bases 11.19 14 16.04 31

17
Acres Per Man Hour for 50 Day Use Clearances by Base
Survey AF Form 3578
BaseAcres Per ManHour – Mean
Number ofObservations
Acres Per ManHour - Mean
Number ofObservations*
Barksdale 2.80 1 1.71 7Cannon 0.03 1 N/A N/ADover 0.60 1 N/A N/AEdwards 5.12 1 1.24 1Eglin N/A N/A N/A N/AEielson N/A N/A N/A N/AHill 0.12 1 0.25 4Holloman 14.83 1 N/A N/AKadena N/A N/A N/A N/ALuke 0.10** 4 0.60** 71McConnell N/A N/A N/A N/AMount Home 0.05 1 N/A N/ANellis 0.06** 6 11.72** 2Osan 3.09 1 N/A N/ASeymourJohnson 0.20 1 N/A N/AShaw 0.43 1 N/A N/ASpangdahlem,Germany 0.47 1 N/A N/AAcross Bases 1.36 21 0.93 87
18
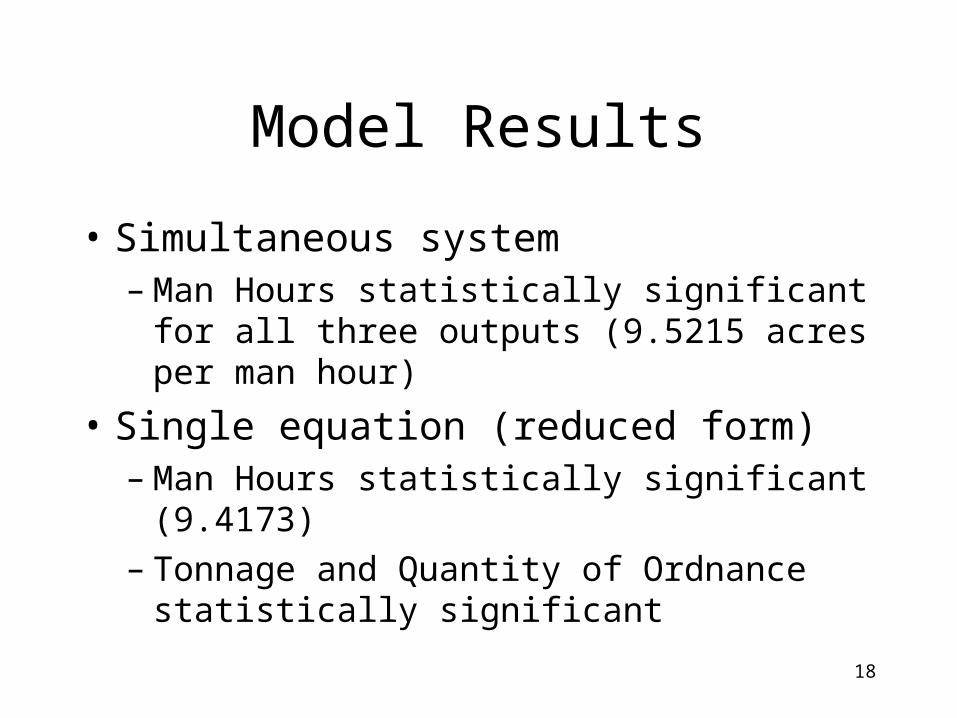
Model Results
• Simultaneous system– Man Hours statistically significant for all three
outputs (9.5215 acres per man hour)
• Single equation (reduced form)– Man Hours statistically significant (9.4173)– Tonnage and Quantity of Ordnance statistically
significant

19
Model Results (Cont’d.)
• Other factors– Type of clearance– Tonnage– Type and quantity of ordnance
• Consistent results for man hour production regardless of approach

20
Simultaneous Equation Results for Acres Cleared
Confidence IntervalVariable Coefficient T-Statistic Lower Bound Upper Bound
Tonnage per Mh 0.0577 5.3560 0.0365 0.0789Acres Cleared perMh 9.5215 8.1980 7.2378 11.8053Quantity ofSpecific Ordnanceper Mh 1.3231 3.9860 0.6705 1.9757

21
Single Equation Results for Acres Cleared
Variable Coefficient T-value Significance LevelTonnage 23.76637 1.655 0.103Quantity
ofOrdnance
-1.60256 -2.413 0.019
ManHours
9.417378 3.466 0.001

22
Acres per Man Hour, Historical Data, AF Form 3578
0
5
10
15
20
25
1992 1993 1994 1995 1996 1997
Year
Acres/ManHr
50 Day UseAnnual5 YearAverage

23
Acres per Man Hour, AF Form 3578 Compared to Survey Data
Year/Type ofClearance 1992 1993 1994 1995 1996 1997 Average Survey
50 Day Use 0.4578 0.6694 0.6639 1.7789 0.9862 1.3417 0.9830 1.3563Annual 6.1581 3.2856 5.6732 3.5551 8.8274 16.7152 7.3691 11.53445 Year 17.7168 10.1158 5.5310 22.068 7.0047 19.6743 13.6851 11.9184Total 7.1106 2.7881 2.2349 5.8141 7.8478 10.3041 6.0166 8.8234

24
Implication of Estimated Model
• Assume 10,000 acres - annual clean
• Implies – Crew of nearly 9 people
• 7 - low• 11 - high
– Working 40 hours per week– 3 week job

25
Implication of Estimated Model (Cont’d.)
• 5 year clearance – Adds at approximately one more person– Caveat: Usually includes doubling of acres
cleared

26
Interpretation of Modeling and Analysis
• Manpower requirements for range clearances vary significantly by type of clearance, acres cleared and type of explosive ordnance cleared
• Manpower requirements for range clearances vary by base
• Decreasing trend in manpower usage for range clearances


