27
U21 Ranking of National Higher Educational Systems 2018 1 U21 Ranking of National Higher Education Systems
U21 Ranking of National Higher Educational Systems 2018 1
U21 Ranking of National Higher Education Systems

U21 Ranking of National Higher Educational Systems 2018 32 U21 Ranking of National Higher Educational Systems 2018
Ross Williams,University of Melbourne
Anne Leahy,University of Melbourne
May 2018
The project is based at theMelbourne Institute of Applied Economic and Social ResearchUniversity of Melbourne
U21 Ranking of National Higher Education Systems
A project sponsored by

U21 Ranking of National Higher Educational Systems 2018 54 U21 Ranking of National Higher Educational Systems 2018
Acknowledgements
The following people have played an important role in the development of the project:
Associate Professor Ying Cheng, Graduate School of Education, Shanghai Jiao Tong University
Professor Gaétan de Rassenfosse, EPFL, Switzerland
Professor Sir David Greenaway,University of Nottingham
Professor Simon Marginson, Institute of Education, University College London
The Universitas 21 Secretariat at the University of Birmingham has again provided valuable assistance. We especially thank Jade Bressington, the Director of Operations.
We are most grateful to Mark Neijssel and Robert Tijssen of CWTS, Leiden University, for providing us with data measuring joint publications of universities with industry. We thank Isidro Aguillo for providing data from Webometrics.
Contents
Overall Table of Rankings
Executive Summary
1. Introduction
2. Changes in data and methodology from the 2017 rankings
3. Measures and Results
4. Methodology of adjusting for levels of economic development
5. Results after adjusting for levels of economic development
6. Using the findings to improve performance
7. Research training
8. Concluding remarks
Appendixes and references
Country Summaries
4
5
6
7
8
18
19
26
29
31
32
35
U21 Ranking of National Higher Educational Systems 2018 76 U21 Ranking of National Higher Educational Systems 2018
Below:
Overall U21 2018 Ranking
Rank (2018)
Rank (2017)
Country Score Score (2017)
1 1 United States 100.0 100.0
2 2 Switzerland 88.0 86.9
3 3 United Kingdom 82.6 85.5
4 5 Sweden 82.4 83.4
5 4 Denmark 81.7 83.5
6 9 Finland 79.7 79.9
6 8 Netherlands 79.7 80.0
8 7 Canada 79.6 80.2
9 6 Singapore 79.5 80.8
10 10 Australia 78.6 79.6
11 11 Austria 75.8 75.0
12 13 Norway 74.5 73.9
13 12 Belgium 73.3 74.2
14 15 New Zealand 71.1 72.1
15 16 Germany 69.2 68.8
16 18 France 68.5 67.5
17 14 Hong Kong SAR 67.8 73.7
18 16 Israel 66.3 68.8
19 19 Ireland 64.8 66.7
20 20 Japan 61.9 63.2
21 21 Taiwan-China 60.2 60.7
22 22 Korea 58.0 59.0
23 25 Saudi Arabia 57.0 56.7
24 27 Portugal 56.4 55.8
25 23 Spain 56.2 57.3
Rank (2018)
Rank (2017)
Country Score Score (2017)
26 25 Malaysia 55.7 56.7
27 24 Czech Republic 55.6 56.9
28 28 Italy 54.0 54.5
29 28 Slovenia 53.6 54.5
30 30 China 52.4 52.7
31 32 Poland 51.3 50.0
32 35 Greece 49.5 47.7
33 33 Russia 49.3 49.9
34 34 Chile 49.0 49.4
35 38 Slovakia 48.7 45.9
36 31 Hungary 48.3 50.8
37 37 South Africa 47.7 46.6
38 35 Ukraine 47.4 47.7
39 42 Brazil 45.0 43.1
40 41 Argentina 44.2 43.5
41 40 Turkey 44.0 44.0
42 39 Serbia 42.8 44.1
43 44 Romania 42.2 41.6
44 45 Bulgaria 42.0 40.2
45 43 Croatia 41.0 42.5
46 46 Mexico 40.3 40.0
47 47 Thailand 40.0 39.7
48 48 Iran 38.9 38.4
49 49 India 36.8 36.7
50 50 Indonesia 33.5 33.3
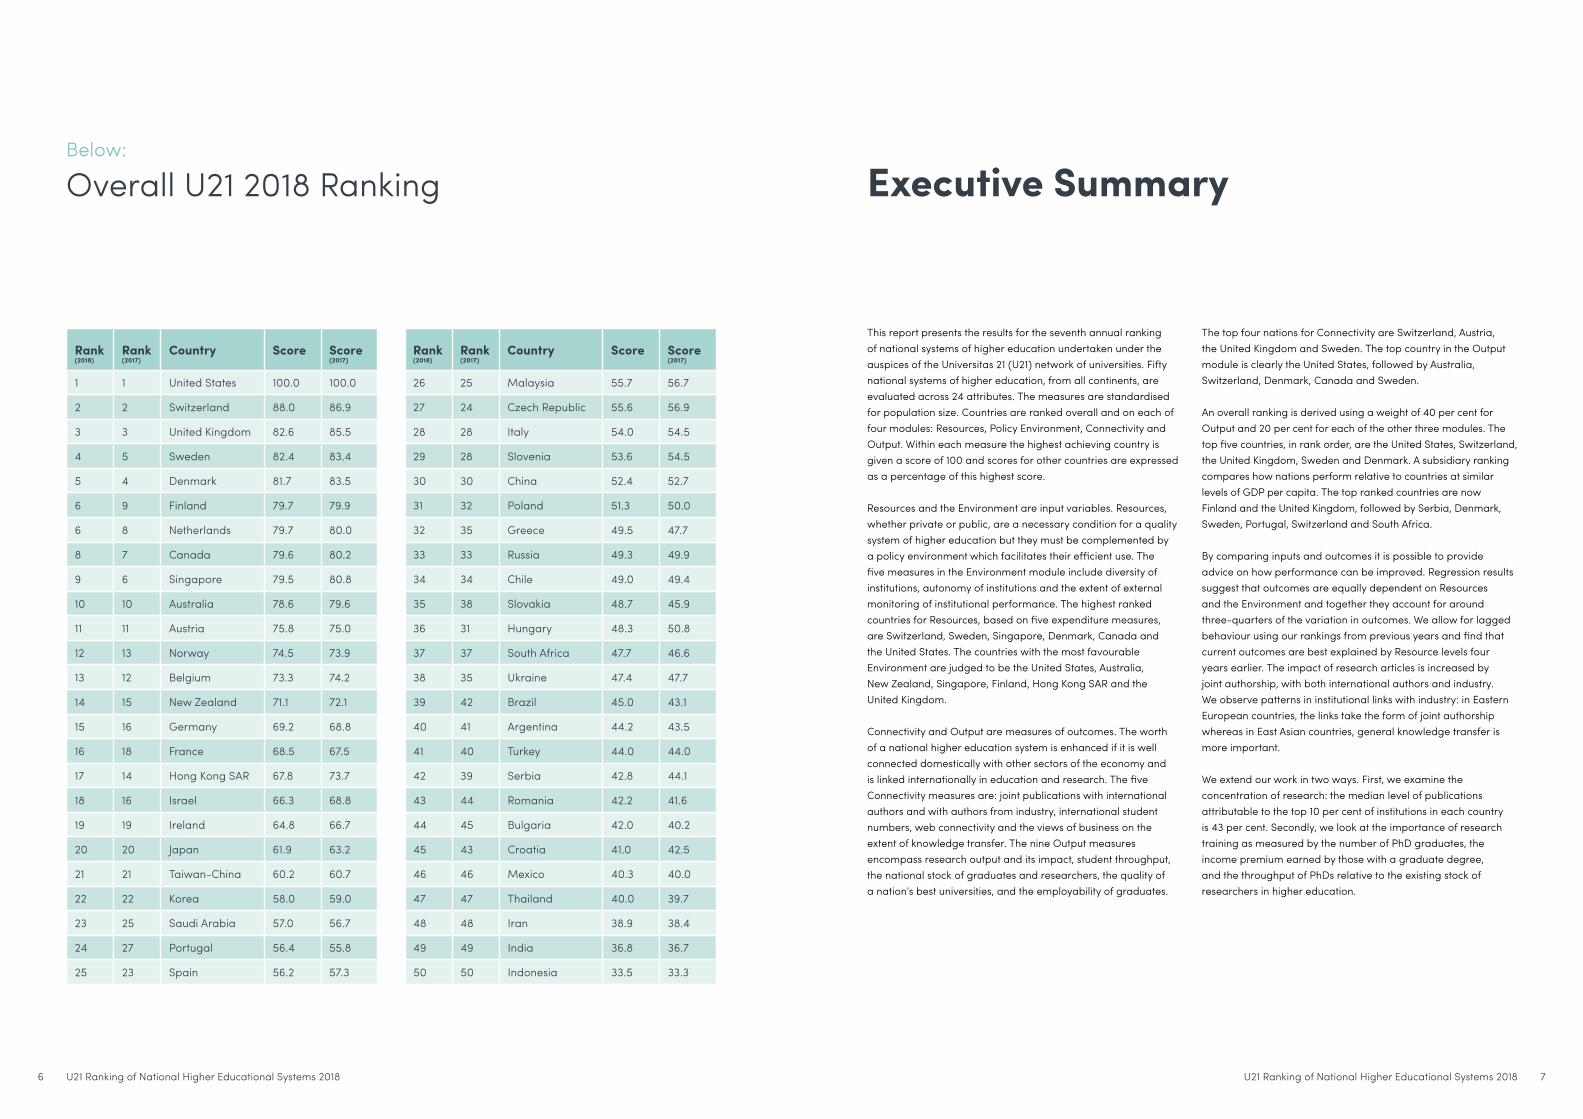
This report presents the results for the seventh annual ranking of national systems of higher education undertaken under the auspices of the Universitas 21 (U21) network of universities. Fifty national systems of higher education, from all continents, are evaluated across 24 attributes. The measures are standardised for population size. Countries are ranked overall and on each of four modules: Resources, Policy Environment, Connectivity and Output. Within each measure the highest achieving country is given a score of 100 and scores for other countries are expressed as a percentage of this highest score.
Resources and the Environment are input variables. Resources, whether private or public, are a necessary condition for a quality system of higher education but they must be complemented by a policy environment which facilitates their efficient use. The five measures in the Environment module include diversity of institutions, autonomy of institutions and the extent of external monitoring of institutional performance. The highest ranked countries for Resources, based on five expenditure measures, are Switzerland, Sweden, Singapore, Denmark, Canada and the United States. The countries with the most favourable Environment are judged to be the United States, Australia, New Zealand, Singapore, Finland, Hong Kong SAR and the United Kingdom.
Connectivity and Output are measures of outcomes. The worth of a national higher education system is enhanced if it is well connected domestically with other sectors of the economy and is linked internationally in education and research. The five Connectivity measures are: joint publications with international authors and with authors from industry, international student numbers, web connectivity and the views of business on the extent of knowledge transfer. The nine Output measures encompass research output and its impact, student throughput, the national stock of graduates and researchers, the quality of a nation’s best universities, and the employability of graduates.
The top four nations for Connectivity are Switzerland, Austria, the United Kingdom and Sweden. The top country in the Output module is clearly the United States, followed by Australia, Switzerland, Denmark, Canada and Sweden.
An overall ranking is derived using a weight of 40 per cent for Output and 20 per cent for each of the other three modules. The top five countries, in rank order, are the United States, Switzerland, the United Kingdom, Sweden and Denmark. A subsidiary ranking compares how nations perform relative to countries at similar levels of GDP per capita. The top ranked countries are now Finland and the United Kingdom, followed by Serbia, Denmark, Sweden, Portugal, Switzerland and South Africa.
By comparing inputs and outcomes it is possible to provide advice on how performance can be improved. Regression results suggest that outcomes are equally dependent on Resources and the Environment and together they account for around three-quarters of the variation in outcomes. We allow for lagged behaviour using our rankings from previous years and find that current outcomes are best explained by Resource levels four years earlier. The impact of research articles is increased by joint authorship, with both international authors and industry. We observe patterns in institutional links with industry: in Eastern European countries, the links take the form of joint authorship whereas in East Asian countries, general knowledge transfer is more important.
We extend our work in two ways. First, we examine the concentration of research: the median level of publications attributable to the top 10 per cent of institutions in each country is 43 per cent. Secondly, we look at the importance of research training as measured by the number of PhD graduates, the income premium earned by those with a graduate degree, and the throughput of PhDs relative to the existing stock of researchers in higher education.
Executive Summary

U21 Ranking of National Higher Educational Systems 2018 98 U21 Ranking of National Higher Educational Systems 2018
This report presents the results for the seventh annual ranking
of national systems of higher education undertaken under the
auspices of the Universitas 21 (U21) network of universities.
The national ranking of systems complements the many
international rankings of universities. The rankings of institutions
are essentially rankings of research-intensive universities and as
such encourage a bias in systems of higher education towards
that type of institution.
The measures used in the ranking of national systems must
reflect the aims of higher education. These include the
education and training of a nation’s people, contributing to
innovation through research, and facilitating interconnections
between tertiary institutions and external stakeholders, both
domestic and foreign. A good system of higher education will
encompass a range of institutions to meet personal desires and
perceived national needs (Salmi, 2017a, p.237; Williams, 2018).
Diversity can also be an effective way to improve enrolment
rates as noted by Jamil Salmi (2017b, p.121), former tertiary
education co-ordinator at the World Bank:
Spreading enrollment growth across a variety of tertiary institutions
and non-universities, public and private –, instead of simply
expanding the public university sub-sector, can be an effective
strategy for reaching the country’s enrollment targets in a more
financially manageable way from a public resources perspective.
We use 25 measures of performance grouped into four modules:
Resources, Environment, Connectivity and Output. The first two
are input measures and the second pair measure outcomes. For
each variable, the best performing country is given a score of 100
and scores for all other countries are expressed as a percentage
of this highest score. Separate rankings are provided for each
of the modules. A description of each variable is given in the
relevant section below and sources are given in Appendix 1.
Our methodology is set out in detail in Williams, de Rassenfosse,
Jensen and Marginson (2013).
Resources, whether public or private, are a necessary condition
for a well-functioning system of higher education, but they are
not sufficient. A well-designed policy environment is needed to
ensure that resources are used well. A consensus is emerging
that the preferred environment is one where institutions
are allowed considerable autonomy tempered by external
monitoring and competition. The Environment module contains
measures of these characteristics.
Turning to outcomes, our Output variables encompass attributes
such as participation rates, research performance, the existence
of some world class universities, and employability of graduates.
There is a world-wide trend for governments to encourage
institutions of higher education to strengthen relationships
with business and the rest of the community. The Connectivity
module includes variables which span this wider concept (see de
Rassenfosse and Williams (2015)). In a new initiative, we examine
performance in research training.
Our work extends well beyond ranking. Using our data, countries
can benchmark performance over a range of attributes,
noting strengths in some areas, weaknesses in others. To
permit countries to benchmark performance against other
countries at similar stages of development, we also present
estimates of a country’s performance relative to its level of
GDP per capita. However, it is one thing to know where a
nation ranks internationally; it is another to provide a template
for improvement. The use of modules permits us to compare
inputs with outcomes, through which we can suggest ways that
outcomes can be improved.
1. Introduction
The research output measures are now taken from InCites
whereas in previous years we used data provided by SciMago.
The underlying source of data has thus moved from the Scopus
data base produced by Elsevier to the Web of Science data
bank produced by Clarivate Analytics. The coverage of tertiary
institutions in each country is broadly the same except that
institutions which publish fewer than 100 papers in a year are
now included – this change is quantitatively unimportant. The
coverage of journals does differ, however. The new data base
is used to calculate four variables: total number of documents
produced (O1), documents per head (O2), average impact of
articles (O3) and joint publications with international authors (C2).
The research output data now relate to the year 2016, whereas
in our last year’s ranking data for 2014 was used; that is, the data
are moved two years on.
Comparing the InCites and SciMago data for the common year
of 2014, total publications for our 50 countries are four per cent
higher for InCites. However, for several countries the InCites
data are lower, significantly so for four countries: China, Iran,
Malaysia and Mexico. Given that the journal coverage of data
banks changes over time, there is no easy way to project the 2014
differences forward. In order not to unduly penalise countries for
the data bank change, the approach adopted for countries that,
on the raw data, would otherwise experience a fall in publications
between our 2017 and 2018 rankings (based on SciMago 2014
data and InCites 2016 data, respectively) is as follows: if there has
been an increase in publications recorded by InCites between
2014 and 2016 then the values from our 2017 rankings are used;
if there has been a fall in publications as recorded by InCites
between 2014 and 2016 then the values from our 2017 rankings
are scaled down proportionately. Another effect of the change
in data source is to reduce the importance of joint international
publications for Hong Kong SAR, presumably because of the
different treatment of publications with mainland authors.
In the Environment module, the main change occurs in the Rating
of Financial Autonomy (E4.3) arising from new ratings data
published by the European University Association. Also, data for
Croatia, Serbia and Slovenia have been collected for the first time.
In measuring web connectivity, the variable TRANSPARENCY
has been dropped and the weight transferred to the VISIBILTY
variable. The TRANSPARENCY measure is based on the top ten
authors in each institution (excluding the most cited) as measured
in Google Scholar citations. As such, it is not ideally suited to
measuring national performance as it is influenced by average
institutional size.
Data are now provided for Colombia, which on our original
criterion of research publications would now be included.
However, to trace the ranking of the original 50 countries over
time, Colombia is not formally included in the ranking but we do
indicate its place if it were to be included.
2. Changes in Data and Methodology from the 2017 Rankings
U21 Ranking of National Higher Educational Systems 2018 1110 U21 Ranking of National Higher Educational Systems 2018
A necessary condition for a well-performing higher education
system is that it is adequately resourced, whether by government
or the private sector. One measure is expenditure by tertiary
institutions as a share of GDP. But for low-income countries,
especially those with a large student-age population, a high
share of GDP may not translate into high expenditure per student,
so we also include the latter. In the absence of measures of
the quality of teaching that are comparable across all our 50
countries, the measure of resources per student in part serves
as a proxy. To measure the contribution of tertiary education to
a nation’s research effort we include measures of expenditure
on R&D in tertiary institutions. In summary, our five measures of
resources and their weights are:
R1: (5%) Government expenditure on tertiary education
institutions as a percentage of GDP, 2014.
R2: (5%) Total expenditure on tertiary education institutions as
a percentage of GDP, 2014.
R3: (5%) Annual expenditure per student (full-time equivalent)
by tertiary education institutions in USD purchasing power
parity, 2014.
R4: (2.5%) Expenditure in tertiary education institutions for
research and development as a percentage of GDP, 2015.
R5: (2.5%) Expenditure in tertiary education institutions for
research and development per head of population at USD
purchasing power parity, 2015.
The trend for private expenditure to replace public expenditure
continues. Compared with last year’s data, the median share of
GDP devoted to higher education has risen marginally from 1.47
to 1.49 per cent but public expenditure has fallen from 1.02 to 0.99
per cent of GDP. There has been a modest increase in research
expenditure, rising from 0.35 to 0.37 per cent of GDP.
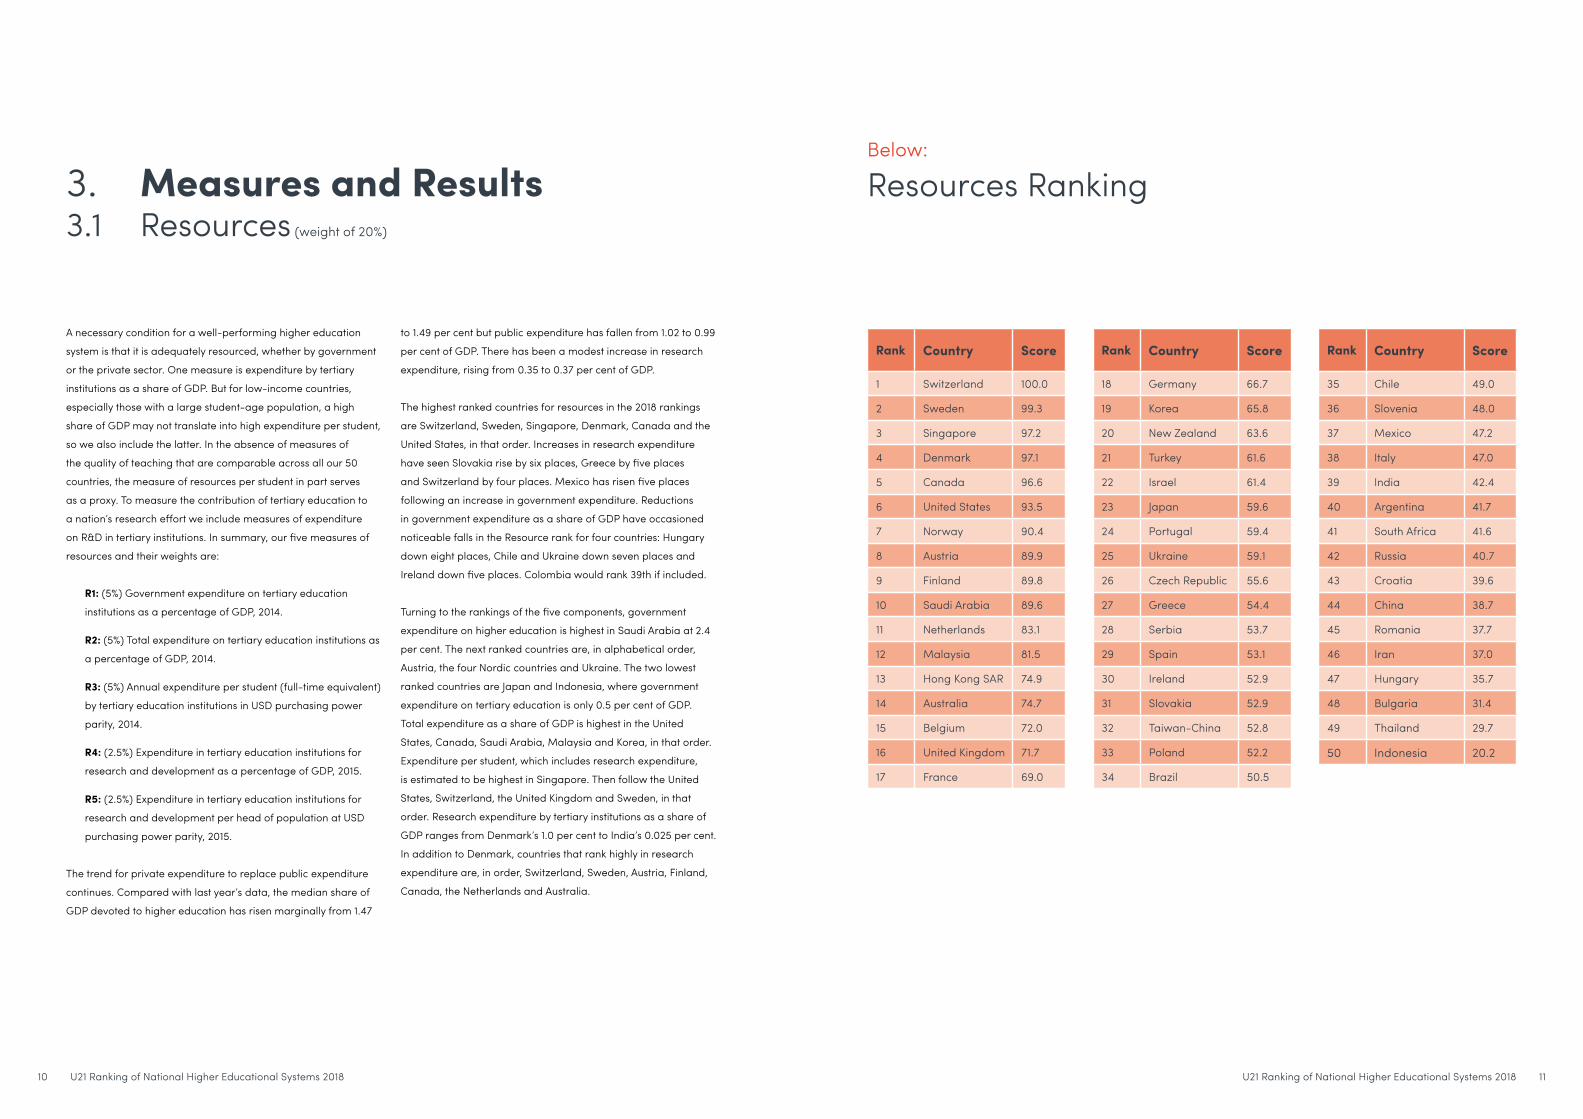
The highest ranked countries for resources in the 2018 rankings
are Switzerland, Sweden, Singapore, Denmark, Canada and the
United States, in that order. Increases in research expenditure
have seen Slovakia rise by six places, Greece by five places
and Switzerland by four places. Mexico has risen five places
following an increase in government expenditure. Reductions
in government expenditure as a share of GDP have occasioned
noticeable falls in the Resource rank for four countries: Hungary
down eight places, Chile and Ukraine down seven places and
Ireland down five places. Colombia would rank 39th if included.
Turning to the rankings of the five components, government
expenditure on higher education is highest in Saudi Arabia at 2.4
per cent. The next ranked countries are, in alphabetical order,
Austria, the four Nordic countries and Ukraine. The two lowest
ranked countries are Japan and Indonesia, where government
expenditure on tertiary education is only 0.5 per cent of GDP.
Total expenditure as a share of GDP is highest in the United
States, Canada, Saudi Arabia, Malaysia and Korea, in that order.
Expenditure per student, which includes research expenditure,
is estimated to be highest in Singapore. Then follow the United
States, Switzerland, the United Kingdom and Sweden, in that
order. Research expenditure by tertiary institutions as a share of
GDP ranges from Denmark’s 1.0 per cent to India’s 0.025 per cent.
In addition to Denmark, countries that rank highly in research
expenditure are, in order, Switzerland, Sweden, Austria, Finland,
Canada, the Netherlands and Australia.
3.3.1
Measures and ResultsResources (weight of 20%)
Rank Country Score
1 Switzerland 100.0
2 Sweden 99.3
3 Singapore 97.2
4 Denmark 97.1
5 Canada 96.6
6 United States 93.5
7 Norway 90.4
8 Austria 89.9
9 Finland 89.8
10 Saudi Arabia 89.6
11 Netherlands 83.1
12 Malaysia 81.5
13 Hong Kong SAR 74.9
14 Australia 74.7
15 Belgium 72.0
16 United Kingdom 71.7
17 France 69.0
Rank Country Score
18 Germany 66.7
19 Korea 65.8
20 New Zealand 63.6
21 Turkey 61.6
22 Israel 61.4
23 Japan 59.6
24 Portugal 59.4
25 Ukraine 59.1
26 Czech Republic 55.6
27 Greece 54.4
28 Serbia 53.7
29 Spain 53.1
30 Ireland 52.9
31 Slovakia 52.9
32 Taiwan-China 52.8
33 Poland 52.2
34 Brazil 50.5
Rank Country Score
35 Chile 49.0
36 Slovenia 48.0
37 Mexico 47.2
38 Italy 47.0
39 India 42.4
40 Argentina 41.7
41 South Africa 41.6
42 Russia 40.7
43 Croatia 39.6
44 China 38.7
45 Romania 37.7
46 Iran 37.0
47 Hungary 35.7
48 Bulgaria 31.4
49 Thailand 29.7
50 Indonesia 20.2
Below:
Resources Ranking
U21 Ranking of National Higher Educational Systems 2018 1312 U21 Ranking of National Higher Educational Systems 2018
A consensus is emerging that for a quality higher education
system, institutions need considerable financial autonomy,
but there also needs to be appropriate diversity, competition
between institutions and external monitoring of performance. The
degree to which national systems possess these characteristics is
measured by the results of three survey findings complemented
by four quantitative measures.
The measures we use and their weights are:
E1: (1%) Proportion of female students in tertiary education,
2015.
E2: (2%) Proportion of academic staff in tertiary institutions
who are female, 2015.
E3: (2%) A rating for data quality. For each quantitative series,
the value is 2 if the data are available for the exact definition
of the variable; 1 if some data are available which relate to
the variable but some informed adjustment is required; and
0 otherwise.
E4: (10%) Qualitative measure of the policy environment
comprising:
E4.1 (2%) Diversity of the system comprising two
components of equal weight: the percentage of tertiary
students enrolled in private institutions (capped at 50 per
cent) and the percentage of students enrolled in ISCED
level 5 courses, 2015.
E4.2 (4%) Survey results for the policy and regulatory
environment (see Appendix 2).
E4.3 (4%) Survey results for the financial autonomy of
public universities (see Appendix 2).
E5: (5%) Responses to WEF survey question (7-point scale):
“How well does the educational system in your country meet
the needs of a competitive economy?”.
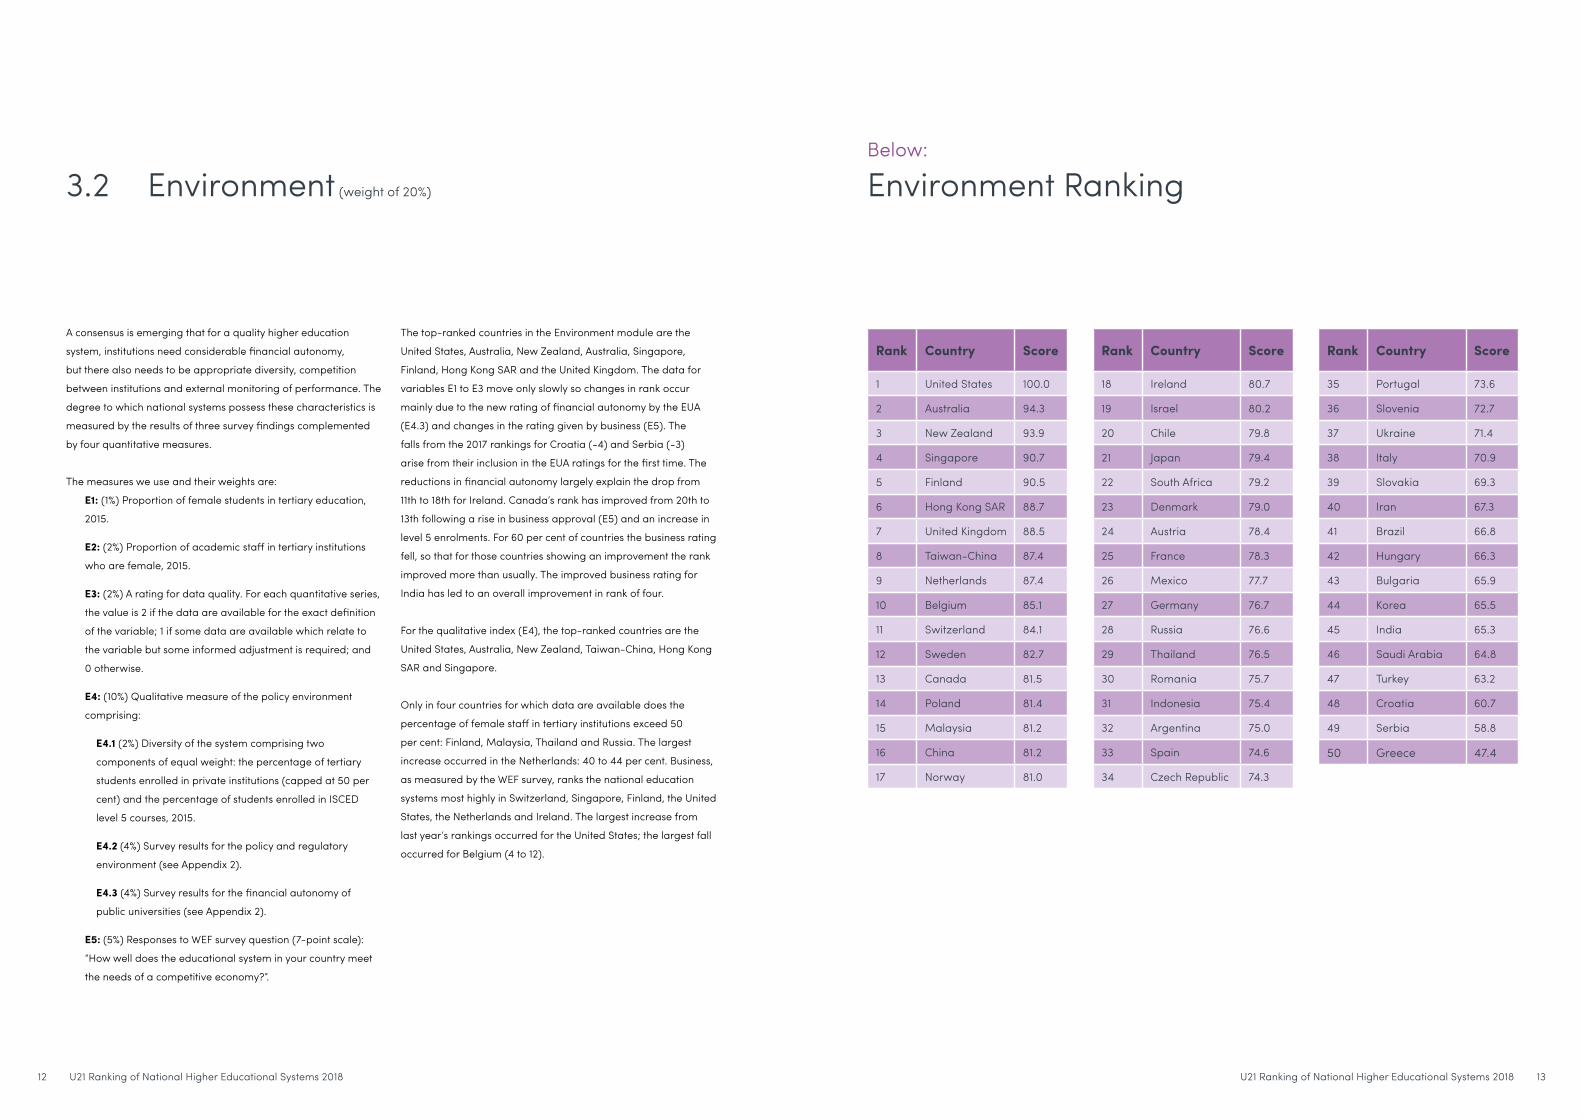
The top-ranked countries in the Environment module are the
United States, Australia, New Zealand, Australia, Singapore,
Finland, Hong Kong SAR and the United Kingdom. The data for
variables E1 to E3 move only slowly so changes in rank occur
mainly due to the new rating of financial autonomy by the EUA
(E4.3) and changes in the rating given by business (E5). The
falls from the 2017 rankings for Croatia (-4) and Serbia (-3)
arise from their inclusion in the EUA ratings for the first time. The
reductions in financial autonomy largely explain the drop from
11th to 18th for Ireland. Canada’s rank has improved from 20th to
13th following a rise in business approval (E5) and an increase in
level 5 enrolments. For 60 per cent of countries the business rating
fell, so that for those countries showing an improvement the rank
improved more than usually. The improved business rating for
India has led to an overall improvement in rank of four.
For the qualitative index (E4), the top-ranked countries are the
United States, Australia, New Zealand, Taiwan-China, Hong Kong
SAR and Singapore.
Only in four countries for which data are available does the
percentage of female staff in tertiary institutions exceed 50
per cent: Finland, Malaysia, Thailand and Russia. The largest
increase occurred in the Netherlands: 40 to 44 per cent. Business,
as measured by the WEF survey, ranks the national education
systems most highly in Switzerland, Singapore, Finland, the United
States, the Netherlands and Ireland. The largest increase from
last year’s rankings occurred for the United States; the largest fall
occurred for Belgium (4 to 12).
3.2 Environment (weight of 20%)
Rank Country Score
1 United States 100.0
2 Australia 94.3
3 New Zealand 93.9
4 Singapore 90.7
5 Finland 90.5
6 Hong Kong SAR 88.7
7 United Kingdom 88.5
8 Taiwan-China 87.4
9 Netherlands 87.4
10 Belgium 85.1
11 Switzerland 84.1
12 Sweden 82.7
13 Canada 81.5
14 Poland 81.4
15 Malaysia 81.2
16 China 81.2
17 Norway 81.0
Rank Country Score
18 Ireland 80.7
19 Israel 80.2
20 Chile 79.8
21 Japan 79.4
22 South Africa 79.2
23 Denmark 79.0
24 Austria 78.4
25 France 78.3
26 Mexico 77.7
27 Germany 76.7
28 Russia 76.6
29 Thailand 76.5
30 Romania 75.7
31 Indonesia 75.4
32 Argentina 75.0
33 Spain 74.6
34 Czech Republic 74.3
Rank Country Score
35 Portugal 73.6
36 Slovenia 72.7
37 Ukraine 71.4
38 Italy 70.9
39 Slovakia 69.3
40 Iran 67.3
41 Brazil 66.8
42 Hungary 66.3
43 Bulgaria 65.9
44 Korea 65.5
45 India 65.3
46 Saudi Arabia 64.8
47 Turkey 63.2
48 Croatia 60.7
49 Serbia 58.8
50 Greece 47.4
Below:
Environment Ranking

U21 Ranking of National Higher Educational Systems 2018 1514 U21 Ranking of National Higher Educational Systems 2018
The worth of a national higher education system is enhanced
if it is well connected with the rest of the nation’s society and is
linked internationally in education and research. Connectivity
promotes technical change and economic growth. In this ranking
we use only one measure of web connectivity instead of the two
measures used in previous years but the single measure carries
the weight of the two previous measures. There are now five
measures each with equal weight:
C1: (4%) Proportion of international students in tertiary
education, 2015.
C2: (4%) Proportion of articles co-authored with international
collaborators, 2016.
C3: Webometrics TRANSPARENCY not used.
C4: (4%) Webometrics VISIBILITY index (external links that
university web domains receive from third parties via
MAJESTIC). Sum of data for 10,000 tertiary institutions divided
by country’s population, July 2017 edition.
C5: (4%) Responses to question ‘Knowledge transfer is highly
developed between companies and universities’, asked
of business executives in the annual survey by IMD World
Development Centre, Switzerland, 2017.
C6: (4%) Percentage of university scientific research
publications that are co-authored with industry researchers,
2013–15.
The top four nations for Connectivity are, in rank order,
Switzerland, Austria, the United Kingdom and the Netherlands.
Then come four countries with similar scores: Denmark,
Finland, New Zealand and Sweden. Brazil exhibits the largest
improvement rising nine places due to an increase in the
recorded number of foreign students. Poland has risen six places
owing to a much more favourable rating by business. Conversely,
Romania has fallen nine places and Mexico five places mainly
due to more negative views held by business. The new data series
for joint publications with international authors has occasioned a
fall in overall rank of eight places for Hong Kong SAR, presumably
due to a difference in the treatment of publications with mainland
authors. Colombia would rank 38th if included.
The median percentage for joint international publications (C2)
has risen to 48.8 percent. The top two countries are Saudi Arabia
(76 per cent) and Switzerland (67 per cent). Next in rank order,
all above 60 per cent, are Belgium, Austria, Chile, Singapore and
the four Nordic countries. Countries with the largest increases
in international authorship (above eight percentage points) are
Slovenia, Hungary and Malaysia. For Malaysia, a contributing
factor was the increase in scientific publications with foreign
companies (C6), albeit from a low base. The six most highly
ranked countries for the percentage of scientific articles written
with industry are, in rank order, Austria, the Netherlands, Sweden,
Denmark, Japan and Hungary. The shares for these countries are
in the range 6 to 8 per cent. The median share of joint industry
publications in science has increased to 4.7 per cent from 3.8 per
cent in last year’s ranking.
The top seven countries for knowledge transfer in the IMD survey
of business executives (C5) are, in rank order, Switzerland, the
United States, the Netherlands, Denmark, Israel, Ireland and
the United Kingdom. In rank order, the highest percentage of
international students in tertiary education are in New Zealand,
Singapore, the United Kingdom, Switzerland, Austria and
Australia. Malaysia has improved its rank by eleven to 17th;
Australia has fallen three places owing to a fall-off in the share
of international students in short-cycle tertiary programs While
there has been some compression of values for Web Impact
(C4), the United States is still ranked a clear first followed by
Switzerland, Canada, Finland and the United Kingdom.
3.3 Connectivity (weight of 20%)
Rank Country Score
1 Switzerland 100.0
2 Austria 91.6
3 United Kingdom 87.5
4 Netherlands 84.2
5 Denmark 81.5
6 New Zealand 80.9
7 Sweden 80.4
8 Finland 80.1
9 Belgium 77.6
10 Singapore 76.8
11 United States 75.9
12 Canada 71.6
13 Germany 71.4
14 Australia 70.7
15 Ireland 70.4
16 Norway 69.2
17 France 65.4
Rank Country Score
18 Hungary 61.7
19 Hong Kong SAR 61.5
20 Israel 58.8
21 Czech Republic 57.9
22 Slovenia 54.9
23 Taiwan-China 54.5
24 Japan 52.4
25 Portugal 51.6
26 Saudi Arabia 51.3
27 Italy 50.9
28 Greece 49.2
29 Spain 48.3
30 Slovakia 47.3
31 Korea 44.8
32 South Africa 44.8
33 Malaysia 44.7
34 Bulgaria 43.5
Rank Country Score
35 Chile 42.5
36 Thailand 41.1
37 Ukraine 38.7
38 Serbia 37.1
39 Brazil 36.8
40 Poland 36.7
41 Romania 36.5
42 Croatia 36.0
43 Argentina 33.7
44 China 33.5
45 Indonesia 32.4
46 Russia 32.0
47 Mexico 30.4
48 Turkey 25.4
49 India 24.3
50 Iran 24.3
Below:
Connectivity Ranking
U21 Ranking of National Higher Educational Systems 2018 1716 U21 Ranking of National Higher Educational Systems 2018
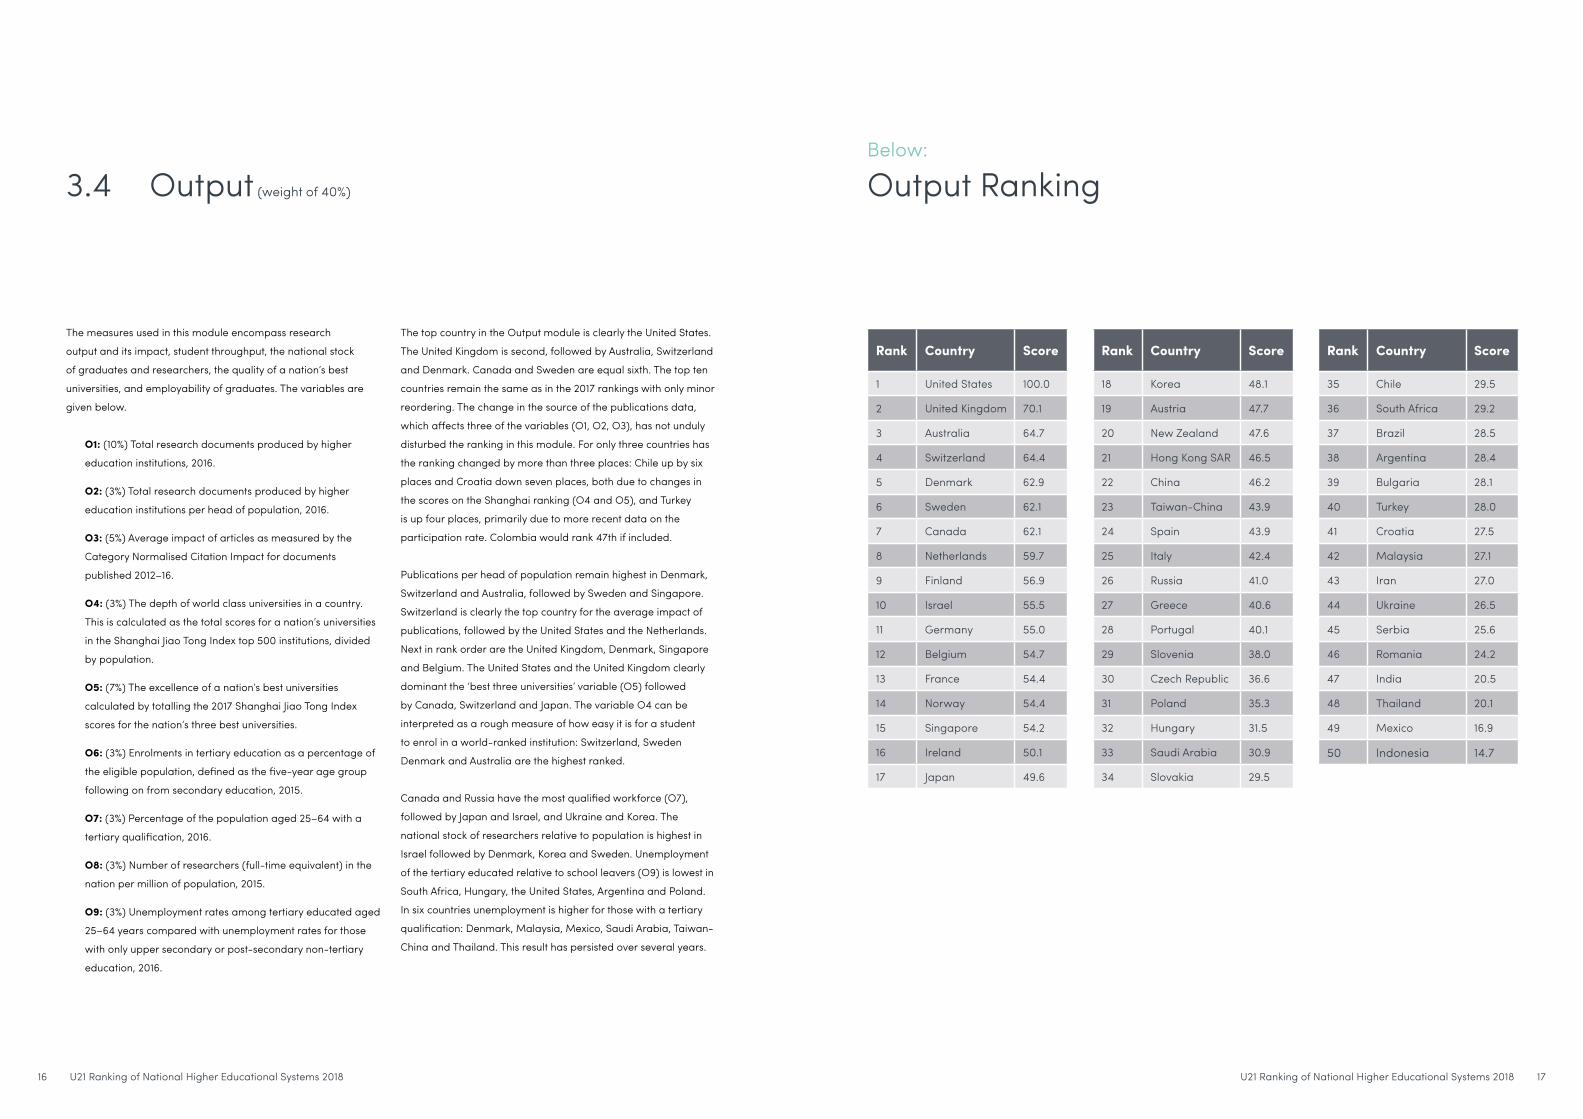
The measures used in this module encompass research
output and its impact, student throughput, the national stock
of graduates and researchers, the quality of a nation’s best
universities, and employability of graduates. The variables are
given below.
O1: (10%) Total research documents produced by higher
education institutions, 2016.
O2: (3%) Total research documents produced by higher
education institutions per head of population, 2016.
O3: (5%) Average impact of articles as measured by the
Category Normalised Citation Impact for documents
published 2012–16.
O4: (3%) The depth of world class universities in a country.
This is calculated as the total scores for a nation’s universities
in the Shanghai Jiao Tong Index top 500 institutions, divided
by population.
O5: (7%) The excellence of a nation’s best universities
calculated by totalling the 2017 Shanghai Jiao Tong Index
scores for the nation’s three best universities.
O6: (3%) Enrolments in tertiary education as a percentage of
the eligible population, defined as the five-year age group
following on from secondary education, 2015.
O7: (3%) Percentage of the population aged 25–64 with a
tertiary qualification, 2016.
O8: (3%) Number of researchers (full-time equivalent) in the
nation per million of population, 2015.
O9: (3%) Unemployment rates among tertiary educated aged
25–64 years compared with unemployment rates for those
with only upper secondary or post-secondary non-tertiary
education, 2016.
The top country in the Output module is clearly the United States.
The United Kingdom is second, followed by Australia, Switzerland
and Denmark. Canada and Sweden are equal sixth. The top ten
countries remain the same as in the 2017 rankings with only minor
reordering. The change in the source of the publications data,
which affects three of the variables (O1, O2, O3), has not unduly
disturbed the ranking in this module. For only three countries has
the ranking changed by more than three places: Chile up by six
places and Croatia down seven places, both due to changes in
the scores on the Shanghai ranking (O4 and O5), and Turkey
is up four places, primarily due to more recent data on the
participation rate. Colombia would rank 47th if included.
Publications per head of population remain highest in Denmark,
Switzerland and Australia, followed by Sweden and Singapore.
Switzerland is clearly the top country for the average impact of
publications, followed by the United States and the Netherlands.
Next in rank order are the United Kingdom, Denmark, Singapore
and Belgium. The United States and the United Kingdom clearly
dominant the ‘best three universities’ variable (O5) followed
by Canada, Switzerland and Japan. The variable O4 can be
interpreted as a rough measure of how easy it is for a student
to enrol in a world-ranked institution: Switzerland, Sweden
Denmark and Australia are the highest ranked.
Canada and Russia have the most qualified workforce (O7),
followed by Japan and Israel, and Ukraine and Korea. The
national stock of researchers relative to population is highest in
Israel followed by Denmark, Korea and Sweden. Unemployment
of the tertiary educated relative to school leavers (O9) is lowest in
South Africa, Hungary, the United States, Argentina and Poland.
In six countries unemployment is higher for those with a tertiary
qualification: Denmark, Malaysia, Mexico, Saudi Arabia, Taiwan-
China and Thailand. This result has persisted over several years.
3.4 Output (weight of 40%)
Rank Country Score
1 United States 100.0
2 United Kingdom 70.1
3 Australia 64.7
4 Switzerland 64.4
5 Denmark 62.9
6 Sweden 62.1
7 Canada 62.1
8 Netherlands 59.7
9 Finland 56.9
10 Israel 55.5
11 Germany 55.0
12 Belgium 54.7
13 France 54.4
14 Norway 54.4
15 Singapore 54.2
16 Ireland 50.1
17 Japan 49.6
Rank Country Score
18 Korea 48.1
19 Austria 47.7
20 New Zealand 47.6
21 Hong Kong SAR 46.5
22 China 46.2
23 Taiwan-China 43.9
24 Spain 43.9
25 Italy 42.4
26 Russia 41.0
27 Greece 40.6
28 Portugal 40.1
29 Slovenia 38.0
30 Czech Republic 36.6
31 Poland 35.3
32 Hungary 31.5
33 Saudi Arabia 30.9
34 Slovakia 29.5
Rank Country Score
35 Chile 29.5
36 South Africa 29.2
37 Brazil 28.5
38 Argentina 28.4
39 Bulgaria 28.1
40 Turkey 28.0
41 Croatia 27.5
42 Malaysia 27.1
43 Iran 27.0
44 Ukraine 26.5
45 Serbia 25.6
46 Romania 24.2
47 India 20.5
48 Thailand 20.1
49 Mexico 16.9
50 Indonesia 14.7
Below:
Output Ranking
U21 Ranking of National Higher Educational Systems 2018 1918 U21 Ranking of National Higher Educational Systems 2018
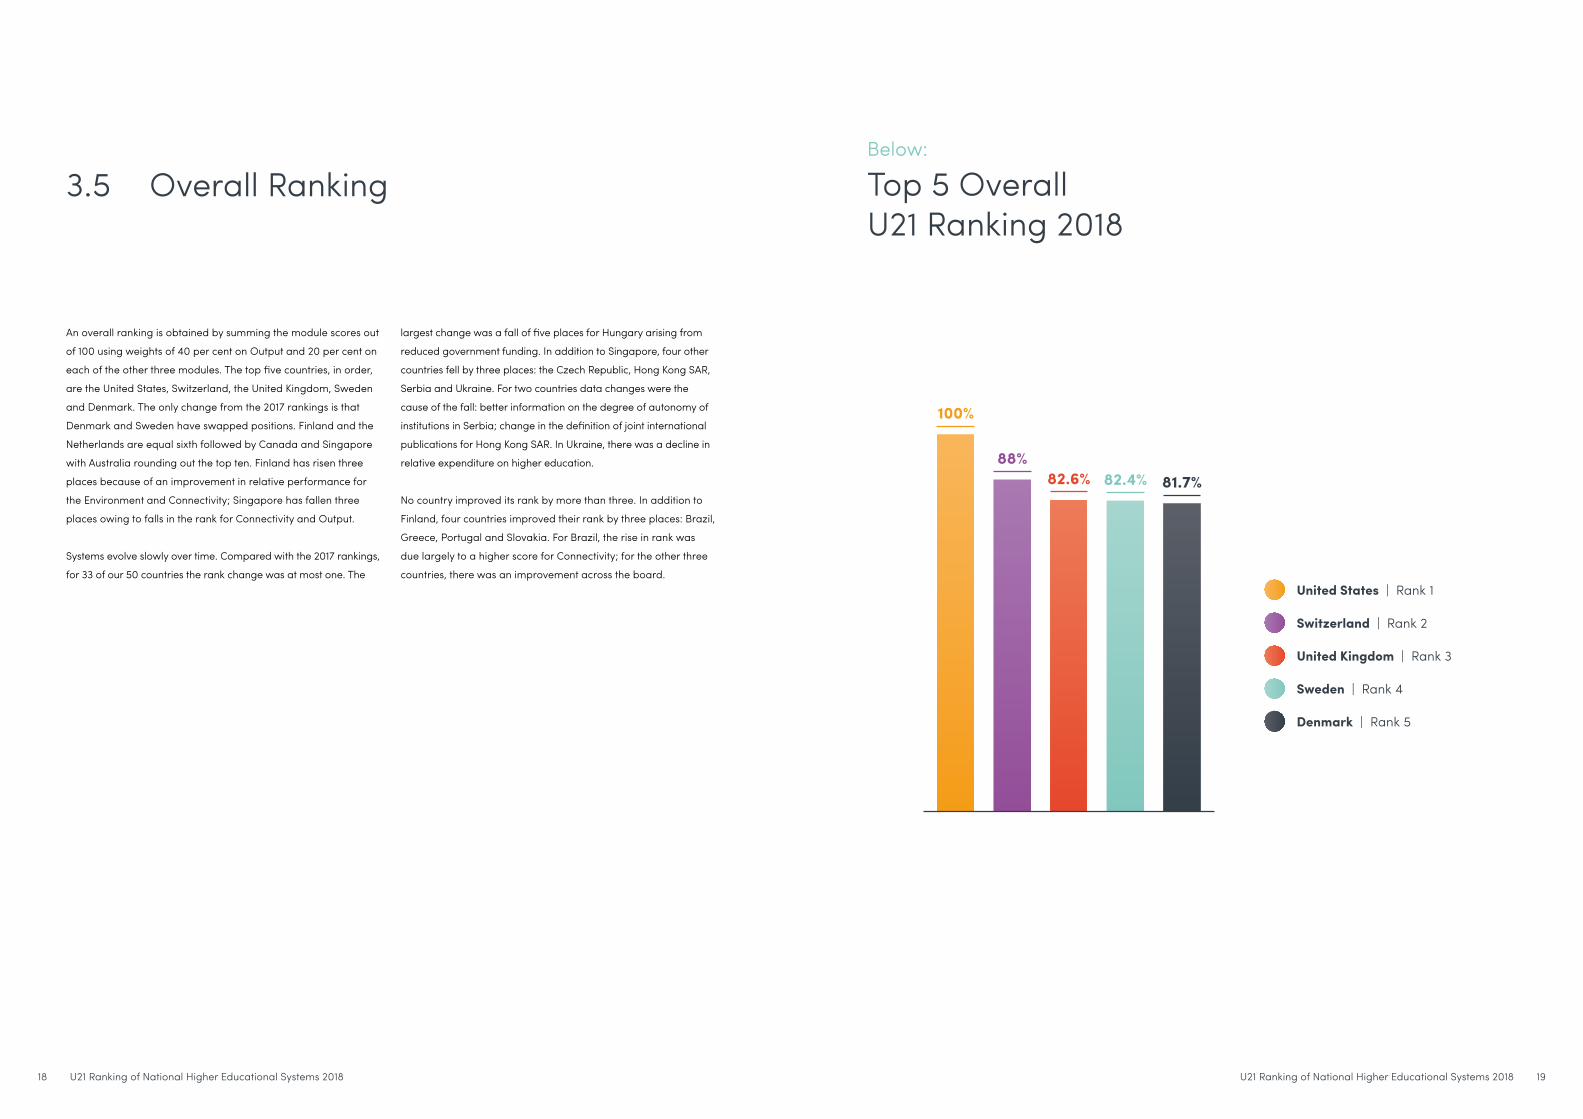
An overall ranking is obtained by summing the module scores out
of 100 using weights of 40 per cent on Output and 20 per cent on
each of the other three modules. The top five countries, in order,
are the United States, Switzerland, the United Kingdom, Sweden
and Denmark. The only change from the 2017 rankings is that
Denmark and Sweden have swapped positions. Finland and the
Netherlands are equal sixth followed by Canada and Singapore
with Australia rounding out the top ten. Finland has risen three
places because of an improvement in relative performance for
the Environment and Connectivity; Singapore has fallen three
places owing to falls in the rank for Connectivity and Output.
Systems evolve slowly over time. Compared with the 2017 rankings,
for 33 of our 50 countries the rank change was at most one. The
largest change was a fall of five places for Hungary arising from
reduced government funding. In addition to Singapore, four other
countries fell by three places: the Czech Republic, Hong Kong SAR,
Serbia and Ukraine. For two countries data changes were the
cause of the fall: better information on the degree of autonomy of
institutions in Serbia; change in the definition of joint international
publications for Hong Kong SAR. In Ukraine, there was a decline in
relative expenditure on higher education.
No country improved its rank by more than three. In addition to
Finland, four countries improved their rank by three places: Brazil,
Greece, Portugal and Slovakia. For Brazil, the rise in rank was
due largely to a higher score for Connectivity; for the other three
countries, there was an improvement across the board.
3.5 Overall RankingBelow:
Top 5 Overall U21 Ranking 2018
United States | Rank 1
Switzerland | Rank 2
Sweden | Rank 4
United Kingdom | Rank 3
Denmark | Rank 5
100%
88%82.6% 82.4% 81.7%

U21 Ranking of National Higher Educational Systems 2018 2120 U21 Ranking of National Higher Educational Systems 2018
In our main rankings, the performance of a country is measured
against world-best practice. But comparisons of performance
should also be made with that of countries at similar levels of
economic development. More precisely, how well does a country
perform on each of our criteria relative to its level of per capita
income? To adjust for national levels of income we regress the
values for each variable, in original units, on GDP per capita
using data for all 50 countries. The GDP we use is for 2015 in
US dollars measured in Purchasing Power Parity (PPP) terms.
Both linear and quadratic relationships are tried. Logarithmic
models performed less well. Given the tenfold range in GDP
per capita across our 50 countries, values for countries at the
very top and bottom ends of the income range show some
sensitivity to functional form. The values of all but one of our 19
variables in the Resources, Connectivity and Output modules
increase significantly with GDP per head (the only exception is
the unemployment variable, O9). The coefficient on the quadratic
term was always negative, implying some tapering of increases
at high levels of GDP per capita.
The fitted equation gives the expected value of a variable for
a nation’s level of income. The difference between the actual
and expected value will be positive or negative depending on
whether a country performs above or below the expected value.
In the few cases where data are missing, we assume that the
variable takes the expected value for that country’s level of GDP
per capita; that is, we assume a deviation value of zero. For the
two Output variables based on the Shanghai rankings (O4 and
O5) the presence of zero values limits the use of regression, so
instead, we rank the countries by GDP per capita and take a
moving average of actual scores to derive more robust estimates
of predicted values.
In aggregating over variables, we first express deviations from
the regression line as a percentage of the average of the actual
and predicted values. To use the percentage deviations from the
line would ignore the fact that the predicted values below the
line are capped at 100 per cent, whereas there is no limit above
the line. Our method ensures symmetry in that values that are
half what is expected at a given level of GDP per capita have
the same influence as values that are double those expected. By
construction, our calculated deviations lie in the range –200 per
cent to +200 per cent. The average deviation for each module is
a weighted sum of the deviations for each of the measures within
the module. The method of measuring deviations needs to be
borne in mind when interpreting the weighted average numerical
scores for each module and for the overall ranking.
We use the same dependent variables and weights as described
in section 3 with two exceptions. The exceptions are research
expenditure (R4 and R5) and publication output (O1 and O2)
where in each case we had a measure expressed in two different
forms. This becomes unnecessary when we control for differences
in income levels. We delete R5 and move the weight to R4, so that
each of the four measures of Resources has a weight of 5 per cent
in the overall ranking. In the output module, we use as a single
publication measure the number of articles divided by (total)
GDP, thus combining O1 and O2 (the weights are added).
4. Methodology of adjusting for levels of economic development.
Expenditures are best described by a linear relationship with
GDP except for research expenditure where a quadratic curve
fits best. The highest ranked countries for resources are Malaysia
and Serbia where expenditures are nearly 40 per cent more than
what is expected given their income levels. Resources devoted
to higher education are 25 to 30 per cent more than expected in
Canada, Finland, Sweden and Ukraine and around 22 per cent
above expected for Denmark and Saudi Arabia.
Compared with the non-adjusted rankings, the countries showing
the largest increase in rank are South Africa (up 32 places to
9th), India (up 28 places to 11th), Serbia (up 27 places to first) and
China (up 25 places to 19th). At the top end of the income range,
Singapore falls from third to 32nd and the United States from
sixth to 17th.
Turning to the four variables that are included in the Resources
module, government expenditure and total expenditure on
higher education show only slight increases as a share of GDP
as income levels rise. For each ten-thousand-dollar increase in
GDP per capita, government expenditure is estimated to increase
by only 0.06 per cent of GDP and total expenditure by 0.08 per
cent. It follows that rankings are like those discussed in section
3.1. The top five countries for the level of government expenditure
after adjusting for GDP per capita are Ukraine, Saudi Arabia,
Finland, Austria and Malaysia. The highest ranked countries for
total expenditure as a share of GDP are now Canada, Malaysia,
the United States, Ukraine, Saudi Arabia, Korea and Chile.
Expenditure (which includes research expenditure) per student
increases markedly with income levels: on average by around
USD352 for each USD1,000 increase in GDP per capita (R2 =
0.73). The top three countries on an income-adjusted basis
are, in order, South Africa, Malaysia and Brazil (data for public
institutions only). Next in rank are the United Kingdom, the United
States, Sweden and India.
Research expenditure in higher education as a share of GDP
increases with GDP per capita, but at a declining rate. The
quadratic regression estimates imply that at GDP per capita of
USD25,000 the expected expenditure on R&D is 0.31 per cent
of GDP whereas the corresponding figure at GDP per capita
of USD50,000 is 0.57. The top eight countries for research
expenditure as a share of GDP are now Serbia, South Africa,
Denmark, Portugal, Sweden, Switzerland, Finland, and Turkey.
5.
5.1
5.2
Results after adjusting for levels of economic developmentResources
EnvironmentIn principle, the creation of a favourable environment is independent
of income levels so we do not carry out regression analysis.
Instead, we use mean values for expected values and calculate the
percentage deviation from expected as was done in other modules.
The rankings are necessarily very like those for the unadjusted data.
The scores for the top four countries (the United States, Australia,
New Zealand and Singapore) are around 20 per cent above
expected values.

U21 Ranking of National Higher Educational Systems 2018 2322 U21 Ranking of National Higher Educational Systems 2018
All five connectivity measures are positively related to levels of
GDP per head. For all but joint international publications (C2), the
R2 values are in the range 0.37 to 0.55. The relationship between
joint international publications and GDP, while significant, is
weaker than in last year’s ranking. Recall that a different data
source is used this year. The top five countries for Connectivity,
after adjusting for income levels, are, in rank order, Ukraine,
the United Kingdom, New Zealand, Austria and Switzerland.
Compared with the unadjusted data it is of course lower income
countries that show the greatest improvement in rank. In addition
to Ukraine, four countries increase their rank by around 20 places:
South Africa (to 10th), Serbia (to 16th), Brazil (to 22nd) and India
(to 26th). Conversely, at the high-income end, Norway, Saudi
Arabia and Singapore all fall by around 20 places.
The equation for international co-authorship (C2) implies that
for each USD10,000 increase in GDP per capita, the percentage
of articles that have an international co-author increase by
approximately 4 percentage points. The top three countries are
Chile, Saudi Arabia and South Africa, unchanged from the 2017
rankings despite the change in data source.
Knowledge transfer is rated most highly by business (C5) in Israel,
Malaysia and China. Joint publications with industry are ranked
highest in Ukraine, Hungary, Indonesia, and South Africa, after
allowing for levels of income.
All but one of the Output measures (unemployment, O9) show
a significant increase with levels of GDP per capita but for most
measures the increase flattens out at high income levels. Two
Output measures show a particularly strong relationship with
GDP per capita (R2 > 0.6): impact as measured by citations
(O3) and researchers per head of population (O8). The impact
measure picks up not only the quality of research but its nature:
applied research in developing countries is less likely to be highly
referenced despite its relevance for economic development.
The top five ranked countries for Output are Serbia, Israel,
Portugal, Israel, Greece and the United Kingdom. For these
countries, Output is more than 25 per cent above expected
values for their levels of income. Compared with the unadjusted
rankings, Serbia’s rank increases by 44 places; the ranks of Iran,
Greece, Portugal and South Africa improve by between 20 and
30 places; and the ranks of Brazil, Chile, China and India increase
by between 10 and 20 places. The United States falls 14 places to
15th and similar falls in rank are recorded for Ireland, Germany,
Japan and Saudi Arabia.
Turning to the components, the top seven countries for
publications (measured as the number of research documents
deflated by total GDP) are now Serbia, Portugal, Singapore,
Slovenia, Denmark, Australia and India. After adjusting for
differences in income levels, the impact of publications (O3) is
highest for South Africa, India, the United Kingdom, Italy and
Switzerland. China, the United States and the United Kingdom are
ranked at the top for the quality of the best three universities; next
in rank order are Russia and Brazil.
After allowing for income levels, Ukraine is ranked first on
participation rates (O6), followed by Greece, Turkey, Chile,
Argentina and Korea. Ukraine also comes first on tertiary
qualifications of the workforce (O7), followed in rank order by
Russia, Israel, Canada, Japan and Korea. Serbia and Israel are
first for researchers per head of population; next in rank are
Korea, Finland, Denmark, Sweden and China.
5.3
5.4 Output
Connectivity
The overall score is calculated by weighting the percentage
deviations for each module using the same weights as for the
unadjusted data: Resources (20%), Environment (20%), Connectivity
(20%) and Output (40%). The median aggregate score is minus
8.6 per cent so that a score above this level can be interpreted as
being above average for the 50 countries we consider.
The top ranked countries after allowing for income levels are
Finland and the United Kingdom, where the scores imply on
overall performance of 20 per cent above the average level of
achievement for countries at their income levels. Next in rank
order are Serbia, Denmark, Sweden, Portugal, Switzerland and
South Africa.
Compared with the original rankings in Section 3, nine countries
improve their ranking by more than ten places. Serbia, South
Africa and India improve by more than 20 places. The countries
that improve by between eleven and twenty places are Brazil,
China, Greece, Iran, Portugal and Ukraine.
The largest fall in rank compared with the Section 3 results is that
of Saudi Arabia. The United States is measured as performing
above expected values but nevertheless falls to 15th position;
similarly, Singapore, the country with the with the highest income
levels now ranks only 21st. Ireland falls substantially in rank to
36th, but this is heavily influenced by its high GDP per capita
measured in purchasing power parity: it is the third highest
among our 50 countries. Given the large number of foreign
companies in Ireland, Gross National Income would probably be
a more appropriate measure than Gross Domestic Product.
5.5 Overall Ranking

U21 Ranking of National Higher Educational Systems 2018 2524 U21 Ranking of National Higher Educational Systems 2018
%dev = percentage deviation from expected value at nation’s level of GDP per capita
Rank Resources % Dev Environment % Dev Connectivity % Dev Output % Dev
1 Serbia 39.1 United States 26.1 Ukraine 58.4 Serbia 37.5
2 Malaysia 37.9 Australia 20.1 United Kingdom 35.0 Israel 33.8
3 Ukraine 29.1 New Zealand 19.9 New Zealand 33.2 Portugal 32.7
4 Sweden 26.1 Singapore 16.2 Austria 31.8 Greece 32.3
5 Finland 25.9 Finland 15.8 Switzerland 27.2 United Kingdom 25.4
6 Canada 24.9 Hong Kong SAR 13.8 Finland 24.4 Denmark 18.8
6 Denmark 22.5 United Kingdom 13.7 Hungary 21.3 Australia 17.8
8 Saudi Arabia 21.0 Netherlands 12.4 Denmark 17.3 Finland 17.5
9 South Africa 19.0 Taiwan-China 12.1 Netherlands 17.0 South Africa 16.2
10 Turkey 17.7 Belgium 9.6 South Africa 16.6 China 15.0
11 India 17.3 Switzerland 7.4 Belgium 14.0 Sweden 13.9
12 Austria 17.0 Sweden 6.8 Sweden 11.4 Switzerland 11.1
13 Brazil 14.6 China 5.1 Czech Republic 9.9 Canada 9.2
14 Switzerland 11.3 Canada 5.0 Canada 5.4 New Zealand 6.4
15 Portugal 8.6 Malaysia 4.3 Australia 5.1 United States 4.9
16 Netherlands 6.8 Poland 4.2 Serbia 4.6 Netherlands 4.9
17 United States 1.5 Norway 3.9 Portugal 3.6 Belgium 2.9
18 Belgium -0.5 Ireland 3.8 Greece 3.0 Singapore 1.2
19 China -0.9 Israel 3.5 Bulgaria 2.1 Slovenia -0.9
20 France -0.9 Chile 1.8 Germany 1.9 France -1.7
21 Norway -1.2 Denmark 1.6 France 0.4 Brazil -2.5
22 Israel -1.4 France 1.1 Brazil -0.4 Iran -3.3
23 Mexico -1.5 Austria 1.0 Israel -6.4 Chile -3.8
24 Greece -2.1 Japan 0.7 United States -9.3 Poland -6.3
25 New Zealand -3.9 South Africa -0.7 Slovenia -9.6 Spain -8.3
26 Australia -4.4 Mexico -1.8 India -11.2 Italy -11.5
27 Poland -4.7 Germany -2.0 Slovakia -11.6 Norway -12.7
28 Korea -5.3 Thailand -2.1 Romania -15.2 Korea -13.7
29 Slovakia -5.8 Russia -2.2 Thailand -16.3 Czech Republic -14.2
30 United Kingdom -6.0 Indonesia -3.0 Ireland -16.6 India -16.0
31 Czech Republic -6.7 Spain -4.4 Singapore -19.3 Germany -18.2
32 Singapore -9.3 Czech Republic -4.6 Italy -19.4 Austria -20.1
33 Germany -12.2 Argentina -4.9 Hong Kong SAR -20.4 Malaysia -21.7
34 Hong Kong SAR -13.7 Romania -5.0 Taiwan - China -21.5 Ireland -23.7
35 Spain -16.5 Portugal -6.2 Spain -22.7 Hong Kong SAR -26.6
36 Japan -19.2 Slovenia -7.0 Malaysia -23.1 Argentina -27.2
37 Iran -19.7 Ukraine -8.9 China -25.0 Japan -29.9
38 Argentina -19.9 Italy -9.7 Norway -26.0 Russia -33.1
39 Chile -21.9 Slovakia -13.8 Japan -30.1 Taiwan - China -34.5
40 Croatia -22.3 Iran -14.4 Poland -34.2 Turkey -39.0
41 Slovenia -22.4 Brazil -17.5 Indonesia -34.6 Croatia -42.0
42 Italy -29.6 Korea -17.6 Chile -40.8 Bulgaria -47.6
43 Thailand -35.0 Hungary -18.0 Korea -44.0 Ukraine -47.9
44 Romania -35.1 Bulgaria -18.6 Croatia -45.1 Hungary -52.9
45 Taiwan - China -37.8 Saudi Arabia -19.5 Russia -49.5 Slovakia -56.2
46 Russia -39.0 India -19.7 Argentina -58.9 Thailand -61.2
47 Hungary -42.4 Turkey -23.0 Saudi Arabia -61.1 Romania -63.1
48 Ireland -53.7 Croatia -28.3 Mexico -66.3 Saudi Arabia -81.0
49 Bulgaria -54.1 Serbia -31.6 Turkey -72.4 Mexico -81.2
50 Indonesia -62.4 Greece -56.3 Iran -73.9 Indonesia -127.2
Overleaf:
National Rankings Controlling for Level of Economic Development
Above:
Top National Rankings for Modules Controlling for Level of Economic Development
United States
Serbia
Ukraine
Serbia
Resources:Serbia | Rank 1
Environment:United States | Rank 1
Output:Serbia | Rank 1
Connectivity:Ukraine | Rank 1

U21 Ranking of National Higher Educational Systems 2018 2726 U21 Ranking of National Higher Educational Systems 2018
Rank Country Score
1 Finland 20.2
2 United Kingdom 18.7
3 Serbia 17.4
4 Denmark 15.8
5 Sweden 14.4
6 Portugal 14.3
7 Switzerland 13.6
8 South Africa 13.4
9 Israel 12.7
10 New Zealand 12.4
11 Australia 11.3
12 Canada 10.8
13 Netherlands 9.2
14 Belgium 5.8
15 United States 5.6
16 Austria 1.9
17 Greece 1.8
Rank Country Score
18 China 1.8
19 France -0.6
20 Brazil -1.6
21 Singapore -2.0
22 Ukraine -3.4
23 Malaysia -4.9
24 Czech Republic -6.0
25 Slovenia -8.1
26 India -9.1
27 Poland -9.4
28 Norway -9.7
29 Germany -9.7
30 Spain -12.0
31 Chile -13.7
32 Hong Kong SAR -14.7
33 Italy -16.3
34 Korea -18.9
Rank Country Score
35 Japan -21.7
36 Ireland -22.8
37 Iran -22.9
38 Taiwan - China -23.3
39 Argentina -27.6
40 Slovakia -28.7
41 Hungary -29.0
42 Turkey -31.1
43 Russia -31.4
44 Bulgaria -33.2
45 Thailand -35.2
46 Croatia -36.0
47 Romania -36.3
48 Saudi Arabia -44.3
49 Mexico -46.4
50 Indonesia -70.9
%dev = percentage deviation from expected value at nation’s level of GDP per capita
Below:
Overall Ranking Controlling for Level of Economic Development
Below:
Top 5 Ranking Controlling for Level of Economic Development
Finland | Rank 1
Denmark | Rank 4
Serbia | Rank 3
Sweden | Rank 5
United Kingdom | Rank 2

U21 Ranking of National Higher Educational Systems 2018 2928 U21 Ranking of National Higher Educational Systems 2018
Of our four modules, two are inputs (Resources and Environment)
and two measure outcomes (Output and Connectivity).
The relationship between inputs and outcomes provides an
indicator of the efficiency of systems. Outcomes are measured
by combining the scores for Resources and Connectivity using
the same weights as before. There is a need to recognise that
there will be a lag between an increase in Resources and an
improvement in Outcomes. Because the Outcomes data relate
primarily to 2016, whereas the data for Resources are heavily
weighted towards 2014, taking all data from the current ranking
has an inbuilt lag of two years. We explore the lagged behaviour
further by using, in turn, the Resources’ scores for each year
of previous rankings. The results are not especially sensitive
to the choice of the lagged value for Resources, but the best
fit is obtained by using the values from the 2016 ranking (data
for 2012): an average lag of four years between an increase
in Resources and subsequent improvements in Outcomes. The
estimated equation, with standard errors in parentheses, is:
Outcomes = -27.79 + 0.593 Resources (-4) + 0.573 Environment R2 = 0.741, n = 50 countries (10. 59) (0.079) (0.157)
6.1 Aggregate Relationships
Both Resources and Environment exert a significant effect on
outcomes and together they explain 74 per cent of the variation
in Outcomes. The point estimates imply that for each 1 point
increase in the Resources score, the Outcomes score increases
by 0.59; the corresponding effect for Environment is 0.57. The
general conclusion is that Resources and the policy Environment
are both key factors determining outcomes and they are roughly
of equal importance.
Several commentators have emphasised the desirability of
institutional financial autonomy. If the aggregate measure of the
Environment is replaced by such a measure (E4.3) the coefficient
is positive and significant (coefficient of 0.150 with a t-value of
2.0), but the explanatory power of the equation is reduced (R2
= 0.695). This implies that while financial autonomy matters,
other features of the higher education environment, such as the
monitoring of standards (E4.2), are also important.
Lagged effects will be picked up more precisely for subsets of
measures. The time intervals between increases in inputs and
resultant increases in outcomes will vary greatly with the type of
outcome. For example, the lag between an increase in resources
and the full effect on the percentage of the work force with a
tertiary qualification will be measured in decades. In the next
sub-section, we look at the lag between an increase in research
funding and an increase in publications.
Ranking provides a valuable indication of how a country
benchmarks against other countries in a range of measures. But
we can go further than this and look at the relationships between
our variables which can throw light on what makes a good higher
education system. Moreover, we can use our seven years of data
to explore lagged responses to change.
6. Using the findings to improve performance.
Quantity:
As expected, there is a strong positive relationship between
research expenditure and publications, albeit the effect tails
off a little at high levels of expenditure. Regressing publications
per capita (O2) on research expenditure per capita (R5) and its
square, we find that the best explanation is obtained by using
research expenditure from our 2015 rankings. This implies an
average lag of four years between an increase in research
funding and publications. (The actual data relate to 2016 for
publications and 2012 for funding.) Funding levels explain 86 per
cent of the country differences in research publications. But some
countries do very much better than expected. If we look at the
25 countries that are ranked highest for publications per head
of population, six countries perform at more than 20 per cent
above expected: Australia, Portugal, New Zealand, Slovenia and
the United Kingdom. On the other hand, Germany and Austria
fall more than 20 per cent below expected values. Factors that
can cause divergence between funding and publications include
the areas of research, the importance of performance based
funding, the source of research funds, and whether government
research funds are concentrated on selected institutions.
Quality / Impact:
There is a relatively strong positive relationship between the
number of articles published, O1, and their average impact as
measures by standardized citations, O3 (correlation coefficient of
0.845). It follows that impact can also be increased by the same
means as output: through research funding. But another factor
that may increase the impact of research is joint publication with
international authors. In this way research programs are more
immediately known in more than one country. Our data confirm
this hypothesis: the correlation between impact (O3) and joint
international authorship (C2) is 0.64 (0.69 if the United States is
excluded). There is also a similar positive correlation between
impact and joint scientific research with industry (r = 0.64).
Does concentration of research in selected institutions matter?
In the absence of appropriate data on research funding we
define concentration as the percentage of research output that is
produced by the top 10 per cent of tertiary institutions. Incites data
is again used for 2016. Institutions with less than 100 publications
are excluded. For countries with fewer than ten institutions the
share of the top university is calculated, for between ten and less
than 20 institutions we take the top 2, and so on. The median level
of publications attributable to the top ten per cent of institutions
is 43.1 per cent. The performance of each country is as follows (in
rank order):
60%+: Slovenia, Saudi Arabia, Croatia, Serbia
50–<60%: Portugal, Norway, Bulgaria, Mexico, Brazil, China,
Argentina, Belgium, France, USA
40–<50%: Japan, UK, Canada, Sweden, India, Ireland, Chile,
Russia, Thailand, Taiwan-China, Indonesia, Korea, Australia,
Iran, Slovakia, Israel, Greece
30–<40%: Malaysia, Hungary, South Africa, Spain, Czech
Republic, Singapore, Turkey, Switzerland, Italy, Denmark,
Poland, New Zealand, Romania, Austria, Finland, Germany
<30%: Hong Kong SAR, Netherlands, Ukraine
To test for the influence of this measure of research concentration
we add it to research expenditure as a potential explanation of
research publications. It does exert a positive effect on national
publications but the coefficient is not statistically significant at
conventional levels (t-value is 0.9). Our concentration measure
fails to explain differences in the number of research publications.
We note that several smaller western European countries have
low concentration ratios but most institutions are relatively well
funded.
6.2 Research Output
U21 Ranking of National Higher Educational Systems 2018 3130 U21 Ranking of National Higher Educational Systems 2018
The two measures that we use for engagement with industry are
business ratings of the degree of knowledge transfer (C5) and
joint scientific publication (C6). Links measured by C5 are likely
to cover a wider range of businesses and activities than those in
C6; they may also be more embedded in the operations of firms.
If the two measures are combined, the best performing countries
are the small western European nations of the Netherlands,
Austria, Switzerland, Denmark, Sweden, Belgium and Finland.
In countries with smaller populations, academics and business
people, through personal interaction, are more able to know the
needs and capabilities of each other. Next in order for combined
strength in engagement with industry are the large industrialised
countries of Germany, the United States, the United Kingdom
and Japan. Countries where overall engagement with industry is
lowest are Brazil, Iran and Turkey. Engagement is also relatively
low in India, Mexico and Russia.
Relationships with industry reveal different emphasis between
countries on informal links through knowledge transfer (C5)
versus ‘basic research links’ as exhibited through joint publications
(C6). While there is an overall positive correlation between
the two measures (r = 0.51), in many countries the strength
of engagement lies much more in one of the measures. An
interesting pattern emerges with knowledge transfer ranking
much higher than joint publications in many East Asian countries,
whereas the converse is true for Eastern Europe. Of the eight
countries where knowledge transfer ranks at least 15 positions
better than joint publications, five are in East Asia: Malaysia,
Singapore, Hong Kong SAR, China and Taiwan-China. The other
three countries are Ireland, Saudi Arabia, and Israel. Of the
nine countries where the rank for joint publications is at least 15
better than for knowledge transfer, seven are in Eastern Europe:
Hungary, Slovenia, Croatia, Bulgaria, Czech Republic, Slovakia
and Ukraine. The other two countries are Greece and Japan.
Relating these findings to economic growth, while it is preferable
to engage with industry on all fronts, for economic development it
appears that knowledge transfer in all its forms is more important
than joint publications.
6.3 Engagement with Industry
Research training is an important function of institutions of higher
education. Through the training of new researchers, universities
provide the innovators of the future and thus contribute to
improvements in standards of living. A highly skilled labour
force is particularly important for countries near the technology
frontier where growth requires new inventions and innovations
(Vandenbussche, Aghion and Meghir (2006).
We concentrate analysis on PhD students: the ISCED level 8
classification. While many masters programs have a significant
research training component, the ISCED classification 7 covers
a wide range of programs which make the data less suitable for
our purposes. National PhD programs provide future researchers
for both the nation and, increasingly, other nations, through the
enrolment of foreign students. This complicates the definition of
what is a good national system of higher education. A good PhD
program contributes to both future national and non-national
growth. Of course, many international students remain in their
country of training; many of those who return home will maintain
links with the host country to the benefit of all parties.
The first three data columns of the Research Training table look
at the scale and composition of PhD degree programs. We use
graduation numbers as the measure. The data are taken from
the OECD and UNESCO data bases. Data are not provided
for Hong Kong SAR, Singapore and Taiwan-China. For the 47
included countries, the mean number of PhD graduates per
hundred thousand population is 20.7. The top seven countries on
this measure are, in rank order, Switzerland, the United Kingdom,
Slovenia, Denmark, Ireland, Australia and Germany. But one-
half of the Swiss PhD graduates are non-nationals, the highest
of any country for which we have the data; similarly, 43 per
cent of PhD graduates in the United Kingdom are international
students. The other countries where over one-third of PhDs are
granted to international students are Australia, Belgium, France,
the Netherlands, New Zealand, Sweden, and the United States.
(The percentages for France and the United States relate to
PhD enrolments.) The ability to attract international students to
PhD programs is in itself a measure of the quality of faculty and
programs.
One measure of the worth of a PhD training is salary levels. The
fourth data column contains data on earnings of those with a
master’s or doctorate compared with earnings by those with a
bachelor’s degree. In all the 25 countries for which we have data,
those with the advanced degree earn more and the median
earnings premium is 35 per cent. The highest earnings premiums
(80 to 100 per cent) are in Austria, Brazil, Mexico and Chile. The
lowest earnings premiums (20 per cent or less) are in Poland,
Germany, Ireland, the United Kingdom and Switzerland.
PhD students are trained by research-active academics. OECD
estimates of researchers in higher education are given in the
middle section of the table for 33 countries. The caveat to the
data is that there seem to be some differences across countries
on the classification of qualified support staff and classification of
academic staff. Notwithstanding these difficulties, countries that
rank the highest on researchers in higher education are Denmark,
Australia, the United Kingdom, Portugal, Finland and Switzerland.
Not surprisingly, there is negative correlation (r = -0.41) between
the earnings premium and the stock of PhD researchers in higher
education.
By combining the data on PhD completions and researchers it
is possible to obtain estimates of PhD graduates per researcher.
This is done in the last two columns of the table. The countries
which have the highest values here are Mexico, Slovenia, Russia,
Korea and Germany. The ratio is a measure of the speed with
which the number of researchers in the nation is being increased.
7. Research Training

U21 Ranking of National Higher Educational Systems 2018 3332 U21 Ranking of National Higher Educational Systems 2018
PhD Completions (2015 or latest)
PhD and Master’s
Earnings vs Bachelor’s
HE Researchers (fte)
PhD graduates per researcher
Country Per 100k pop Rank % International Per 100k pop Rank Ratio Rank
Argentina 4.8 40 n.a. n.a. n.a. n.a. n.a. n.a.
Australia 35.9 6 37.2 1.25 285.4 2 0.13 26
Austria 25.1 15 30.0 2.01 155.9 15 0.16 18
Belgium 23.0 17 38.5 1.38 210.4 9 0.11 30
Brazil 8.2 37 2.4 1.91 n.a. n.a. n.a. n.a.
Bulgaria 20.2 25 n.a. n.a. n.a. n.a. n.a. n.a.
Canada 21.1 22 23.4 1.29 168.3 13 0.13 28
Chile 3.4 43 5.0 1.78 22.2 31 0.15 20
China 4.0 42 2.4* n.a. 21.7 32 0.18 15
Croatia 20.9 23 n.a. n.a. n.a. n.a. n.a. n.a.
Czech Republic 22.8 18 14.1 1.26 107.8 22 0.21 9
Denmark 38.4 4 32.1 1.49 286.0 1 0.13 24
Finland 33.7 9 25.1 1.35 223.7 6 0.15 21
France 21.4 21 40.1* 1.49 114.1 20 0.19 13
Germany 35.8 7 16.7 1.17 125.1 17 0.29 5
Greece 14.7 31 n.a. 1.23 210.7 8 0.07 33
Hungary 12.2 33 7.1 1.36 56.9 28 0.21 8
India 1.8 46 n.a. n.a. n.a. n.a. n.a. n.a.
Indonesia 2.1 45 n.a. n.a. n.a. n.a. n.a. n.a.
Iran 9.3 36 n.a. n.a. n.a. n.a. n.a. n.a.
Ireland 37.3 5 22.3 1.19 202.2 11 0.18 14
Israel 19.2 28 3.8 1.31 115.1 19 0.17 16
Italy 17.2 29 11.4 n.a. 79.4 26 0.22 7
Japan 12.4 32 18.2* n.a. 108.0 21 0.11 29
Korea 25.3 14 8.7* 1.31 80.1 25 0.32 4
Malaysia 11.4 34 n.a. n.a. n.a. n.a. n.a. n.a.
Mexico 5.0 39 n.a. 1.89 11.9 33 0.42 1
Netherlands 27.5 12 41.8 1.40 131.7 16 0.21 10
New Zealand 28.6 11 51.2 1.30 210.9 7 0.14 23
Norway 26.5 13 26.4 1.38 207.6 10 0.13 25
Poland 10.0 35 1.9* 1.16 105.6 23 0.09 31
Portugal 22.6 19 16.3 n.a. 253.8 4 0.09 32
Romania 20.1 26 n.a. n.a. n.a. n.a. n.a. n.a.
Russia 20.7 24 2.8 n.a. 64.5 27 0.32 3
Saudi Arabia 1.4 47 n.a. n.a. n.a. n.a. n.a. n.a.
Serbia 15.3 30 n.a. n.a. n.a. n.a. n.a. n.a.
Slovakia 35.3 8 7.3 1.42 156.9 14 0.22 6
Slovenia 39.3 3 6.3 n.a. 100.3 24 0.39 2
South Africa 4.1 41 n.a. n.a. 28.8 30 0.14 22
Spain 24.4 16 16.2 n.a. 123.0 18 0.20 12
Sweden 30.5 10 41.1 n.a. 184.1 12 0.17 17
Switzerland 46.5 1 54.3 1.20 227.7 5 0.20 11
Thailand 2.9 44 n.a. n.a. n.a. n.a. n.a. n.a.
Turkey 6.6 38 4.1 n.a. 52.4 29 0.13 27
Ukraine 19.4 27 n.a. n.a. n.a. n.a. n.a. n.a.
United Kingdom 40.5 2 43.4 1.20 259.1 3 0.16 19
United States 21.5 20 37.8* 1.40 n.a. n.a. n.a. n.a.
* Percentage of enrolments (2015); n.a. indicates not available
The paper has considered a range of measures for evaluating
the quality of national systems of higher education. In our
core ranking we measure performance under four headings:
Resources, Environment, Connectivity and Output. We recognise
that a nation’s performance should be measured both against
best practice and against that of countries at similar levels of
economic development.
It is beyond the scope of this paper to measure the contribution
of the higher education sector to economic growth. However, we
can note the importance of time lags. The quality and quantity
of new graduates can be improved through funding and the
monitoring of performance, but new graduates are only a
relatively small percentage of the labour force. It will be several
decades before most of the labour force reflect the new model.
The effect can be speeded up, though, by appropriate further
education for older workers. On the other hand, investment in
research activity may contribute to economic growth relatively
quickly. The constraint may be a labour force that cannot use
innovation wisely. There is evidence that an educated workforce
more readily accepts and adapts to new ways of doing things.
In section 7 we noted the relatively large number of international
graduates from PhD programs, especially in high-income
countries. The same is true at the undergraduate level. More
generally, internationalisation affects most of the activities
of tertiary institutions. In our rankings, we partly deal with
this through our connectivity measures, but there is another
dimension: national systems educate and train non-nationals, thus
contributing to growth in other countries, at least for those who
return home. Another aspect of internationalisation that we do not
explicitly refer to is the setting up of foreign campuses by some of
a nation’s institutions. We treat them the same as other institutions
in the destination country. This seems appropriate as they are akin
to a nation sub-contracting part of its education system.
Finally, some remarks on what is a good system of higher
education: There is no single best model. Resources are very
important but it is not crucial where they come from. Salmi (2017b,
p.120) points to three types of relatively well-funded systems:
(i) public provision to public institutions (the Nordic countries,
Saudi Arabia and Switzerland);
(ii) predominantly public institutions with both public and
private funding (Australia, Canada, England, Hong-Kong SAR,
the Netherlands and New Zealand);
(iii) mixed system of private and public institutions both
resourced by a mixture of private and public funding (Chile,
China, Japan, Malaysia, Korea and the United States).
On top of this overlays the policy environment, which should
combine financial and academic autonomy for institutions,
combined with external monitoring of performance. Efficiency is
promoted by a diverse system, and institutional competition for
students and resources.
8. Concluding Remarks
Overleaf:
Research Training Ranking

U21 Ranking of National Higher Educational Systems 2018 3534 U21 Ranking of National Higher Educational Systems 2018
R1 and R2: OECD, Education at a Glance, 2017, Table B2.3 and UNESCO, Institute for Statistics (www.uis.unesco.org)
R3: OECD, Education at a Glance, 2017, Table B1.1; UNESCO, Institute for Statistics; and IMF, Data and Statistics. UNESCO student
numbers converted to full-time equivalents using average for countries where both sets of student data exist
R4 and R5: UNESCO, Institute for Statistics and IMF, Data and Statistics
E1 and E2: UNESCO, Institute for Statistics
E4: OECD, Education at a Glance 2017; UNESCO; surveys as described in Appendix 2
E5: World Economic Forum, The Global Competitiveness Report 2016–17, Table 5.03.
C1: OECD, Education at a Glance 2017, Table C4.1; UNESCO
C2: InCites based on Web of Science databank (www.clarivate.com/products/incites)
C4: Webometrics (www.webometrics.info), July 2017 version.
C5: IMD World Competitiveness Report 2017, Table 4.3.23, World Competitiveness Center,
Institute for Management Development, Lausanne, Switzerland.
C6: CWTS, Leiden University
O1, O2 and O3: InCites based on Web of Science databank (www.clarivate.com/products/incites)
O4 and O5: Shanghai Jiao Tong University Rankings, 2017 (www.shanghairanking.com)
O6: UNESCO, Institute for Statistics
O7: OEDC, Education at a Glance, 2016, Table A1.1; ILOSTAT (www.ilo.org); UNESCO, Institute for Statistics
O8: UNESCO, Institute for Statistics
O9: OECD (www.stats.oecd.org) and ILOSTAT (www.ilo.org)
Appendix 1. Sources
The qualitative measures of the environment are based on responses to questionnaires. Replies were obtained from
U21 representatives, government agencies and educational research institutes. The survey for E4.2 was originally
carried out in 2012; the survey for E4.3 was undertaken in 2015. The responses have been updated as appropriate.
E4.2: The eight survey questions cover the following areas:
• Are there agencies that monitor standards of public tertiary institutions?
• If agencies exist are their findings made public?
• Are there agencies that monitor standards of private tertiary institutions?
• If agencies exist are their findings made public?
• The degree to which academics in public tertiary institutions are not government employees.
• Are academics in public research universities free to move to another university without government approval?
• Degree of freedom institutions have in choosing the CEO of a public research university.
• Degree of freedom to appoint foreign academics to ongoing positions?
E4.3: This was a survey primarily of the financial autonomy of publicly funded institutions.
The categories of responses draw on those used by the European University Association (EUA) given on the EUA
Autonomy in Europe website (www.university-autonomy.eu).
The six survey questions cover the following areas:
• To what extent is core public funding untied?
• Can institutions make market-adjustment allowances for academic staff in high demand?
• To what extent are institutions permitted to keep cash surpluses?
• What ability do institutions have to borrow money?
• To what extent can public institutions levy tuition fees for national (domestic) students?
• What freedom do institutions have over Bachelor degree programs offered?
Appendix 2: The Survey Components of E4: Qualitative measure of the environment
U21 Ranking of National Higher Educational Systems 2018 3736 U21 Ranking of National Higher Educational Systems 2018
de Rassenfosse, G. and Williams, R., ‘Rules of Engagement: Measuring Connectivity in National Systems of Higher Education’,
Higher Education, Vol. 70, No. 6, 2015, pp. 941–956.
Salmi, J., ‘Excellence Strategies and World-Class Universities’. In Ellen Hazelkorn (ed.),
Global Rankings and the Geopolitics of Higher Education, London: Routledge, 2017a.
Salmi, J., The Tertiary Education Imperative, Sense Publishers, Rotterdam, 2017b.
Vandenbussche, J., Aghion, P. and Meghir, C. (2006), ‘Growth, Distance to Frontier and Composition of Human Capital’,
Journal of Economic Growth, Vol. 11, 2006, pp. 97-127.
Williams, R., de Rassenfosse, G., Jensen, P. and Marginson, S. ‘The Determinants of Quality National Higher Education Systems’,
Journal of Higher Education Policy and Management, 35(6), 2013, pp. 599–611.
Williams, R. and de Rassenfosse, G., ‘Pitfalls in Aggregating Performance Measures in Higher Education’,
Studies in Higher Education, Vol. 41, Nos. 1–2, 2016, pp. 51-62.
Williams, R., ‘A Good National System of Higher Education: The Lessons of the U21 Rankings’. In G. Mihut, P. Altbach and H. de Wit (eds),
Understanding Global Higher Education: Insights from Key Global Publications, Centre for International Higher Education in conjunction
with University World News, Sense Publishers, Rotterdam, 2017.
Williams, R., ‘Comparing and Benchmarking Higher Education Systems’, in E. Hazelkorn, H. Coates and A. McCormick (eds),
Research Handbook on Quality, Performance and Accountability in Higher Education, Edward Elgar, 2018.
References and Further Reading
Argentina
Argentina ranks 40th overall, which combines ranks of 40 in
Resources, 32 in Environment, 43 in Connectivity and 38 in Output.
In the Resources category, the level of government expenditure
on higher education as a share of GDP is ranked at 19 but
total expenditure per student is ranked much lower at 45. The
difference is explained by the high enrolment rate, ranked at
14. Among the Connectivity variables, the best ranking (29th) is
for articles written jointly between academics and international
collaborators and the worst rank is (45th) for articles written
jointly with researchers from industry. Published articles per
head are ranked at 44 and their average impact is ranked at
41. Argentina is ranked highly at 4 for employment of graduates
compared with school leavers. When the rankings are adjusted
for differences in GDP per capita Argentina is ranked at 39; its
overall score is below that expected for its level of income.
Australia
Australia ranks 10th overall, which combines ranks of 14 for
Resources, 2 for Environment, 14 for Connectivity and 3 for
Output. The ranking for Resources is pulled down by the low
ranking (41st) for government expenditure on higher education,
although the official data do not reflect the full cost of the student
loans scheme. Private expenditure exceeds public expenditure
and total expenditure as a share of GDP is ranked 8th, an
improvement from 17th last year following an expansion in
total enrolments. Expenditure per student is static at 11th. In the
Connectivity measures, Australia has fallen to 6th on international
student numbers owing to a fall in their share of non-university
tertiary enrolments. Links with the private sector are at average
levels: 31st for joint publications with industry and 20th for
knowledge transfer. Australia is ranked ninth on total publications
and 14th on their average impact. On a per capita basis, it ranks
third on research publications compared with tenth on research
expenditure—an indicator of efficiency. Australia ranks tenth for
the (tertiary) educational qualifications of the labour force but
fourth for enrolment rates. On a per capita basis, the national
stock of researchers is ranked 14th but the annual number
of PhD completions is ranked sixth, 37 per cent of whom are
international. The unemployment rate for graduates compared
with school leavers is around the median value. Australia is
ranked 11th when levels of GDP per capita are taken into account
and the score is above that expected at its income level.
Austria
Austria ranks 11th overall, which combines ranks of 8 for
Resources, 24 for the Environment, 2 for Connectivity and 19 for
Output. In Connectivity it ranks in the top five for three of the
components: the share of international students, articles co-
authored with international researchers and articles co-authored
with industry researchers. Austria ranks fourth for government
expenditures and 14th for total expenditure as a share of GDP.
Within Output, the highest rank is for the number of national
researchers per head of population (tenth). It ranks 15th for PhD
graduates per head. Austria ranks 19th on published articles per
head of population, which compares unfavourably with research
expenditure per head which is ranked fifth. Publications rank
17th on their average impact. When the rankings are adjusted for
levels of GDP per capita, Austria’s ranking falls to 16th overall, but
its score is around what is expected at its income level.
Belgium
Belgium ranks 13th overall, which combines ranks of 15 for
Resources, 10 for Environment, 9 for Connectivity and 12 for
Output. The Output ranking has improved four places over the
past six years. Total expenditure as a share of GDP is ranked 28th
but government expenditure is ranked ninth and expenditure per
student is ranked 16th. Within the Connectivity module, Belgium
is ranked third for the proportion of articles co-authored with
international collaborators. It has good links with industry: ranked
seventh for joint publications and 14th for knowledge transfer.
In Output, Belgium is ranked 13th for publications per head and
seventh for their impact. It is ranked 13th on the quality of its
top three universities and 17th for PhD completions per head of
Country Summaries

U21 Ranking of National Higher Educational Systems 2018 3938 U21 Ranking of National Higher Educational Systems 2018
population. Belgium’s overall ranking is 14th when performance
is adjusted for levels of GDP per capita and its score is above that
expected for a country at its level of income.
Brazil
Brazil ranks 39th overall, which combines ranks of 34 for
Resources, 41 for Environment, 39 for Connectivity and 37 for
Output. The absence of official data on private expenditure and
R&D expenditure means that the ranking for Resources is only an
approximation. Government expenditure on higher education
as a share of GDP is ranked 34th. In Connectivity, Brazil has
risen to 14th in the proportion of students who are international,
but collaboration with international researchers and with local
business are ranked in the bottom quintile. In the Output module,
Brazil is 12th on total publications but only 41st on publications
per head and 46th for the average impact of papers. Around
half of the publications are produced by the top 10 per cent of
institutions. The country ranks 27th for the quality of its best three
universities but is in the bottom 20 per cent for participation rate
and the qualification of its workforce. It is ranked 37th for PhD
completions. When the country standings are adjusted for levels
of GDP per capita, Brazil rises to 20th in the rankings and its score
is around that expected at its income level.
Bulgaria
Bulgaria ranks 44th overall, which combines a ranking of 48 for
Resources, 43 for Environment, 34 for Connectivity and 39 for
Output. Bulgaria ranks 45th for government expenditure on higher
education as a share of GDP, a rise of five places from last year,
and 44th for total expenditure. Bulgaria is ranked seventh for
employment of those with a tertiary qualification relative to school
leavers. Enrolment rates and the educational attainments of its
workforce are around median levels. The absence of a university in
the Shanghai top 500 lowers the rank for Output. Publications per
head are ranked at 38. Joint publications with international authors
continue to increase relative to other countries and now rank 23rd.
Joint publications with industry have similarly increased and are
now ranked at 24, but business ranks knowledge transfer with
tertiary institutions at a low 47th. Taken together, these results imply
that Connectivity is limited to specialised groups. PhD completions
per head of population are ranked 25th. When account is taken of
the level of GDP per capita in each country, Bulgaria is ranked 44th
and its score is well below the expected level.
Canada
Canada is ranked 8th overall, which combining ranks of 5 for
Resources, 13 for Environment, 12 for Connectivity and 7 for
Output. The rank for Environment has increased seven places
owing to an improvement in rank from 16th to 7th in the WEF
rating of educational systems by business. In Resources, Canada
ranks second for total expenditure as a share of GDP and seventh
for expenditure per student. In the Output category, Canada is
ranked eighth for total publications and tenth for publications
deflated by population. Its best three universities are ranked third.
Canada is ranked first for the formal educational qualifications
of its workforce. In Connectivity, Canada ranks third for web
impact and 24th for joint publications with international authors.
Engagement with industry is above average: ranked 12th for
knowledge transfer and 17th for joint publications. Canada ranks
22nd for PhD completions per capita. When levels of GDP per
capita are taken into account, Canada ranks twelfth overall and
the score is above that expected at its income level.
Chile
Chile ranks 34th overall, which combines ranks of 35 for
Resources, 20 for Environment, 35 for Connectivity and 35 for
Output. In the Resources category, Chile is always ranked highly
on total expenditure as a share of GDP (7th this year) but much
lower on expenditure per student (currently 40th). However,
public expenditure varies markedly across years. In the current
ranking government expenditure as a share of GDP (data relate
to 2015) has fallen 12 places to 39th. In the Connectivity category,
Chile ranks fifth in the share of articles co-authored with
international collaborators but 42nd in joint articles with industry.
Country Summaries(continued)
However, the score by business on the extent of knowledge
transfer has risen eight places to 28th. In Output, Chile does best
on the tertiary enrolment rate (sixth) which is gradually leading
to a higher rank on the (tertiary) educational qualifications of its
workforce (now 35th). However, the high enrolment rate is not
seen at the PhD level where Chile ranks 43rd on completions.
Chile ranks 36th for published articles per head of population.
When levels of GDP per capita are allowed for, Chile ranks 31st
overall; although an improvement of five places this year, its
score remains below that expected at its income level.
China
China ranks 30th overall, a rise of 10 places over the last six
years. The overall rank combines ranks of 44 for Resources, 16
for Environment, 44 for Connectivity and 22 for Output. In the
Resources category, total expenditure on higher education as a
share of GDP is ranked 32th. Within the Connectivity category,
knowledge transfer with business is ranked 22nd and the share
of articles co-authored with industry is ranked 39th. Although
the proportion of articles written with international collaborators
is the third lowest of all countries it has risen by five percentage
points to 23 per cent. In Output, China is ranked second on total
publications but 43nd when population is allowed for. Around
half of the publications are produced by the top 10 per cent of
institutions. China ranks in the top quartile for the quality of its
best three universities. It ranks second on PhD completions but
42nd on a population adjusted basis. When levels of GDP per
capita are taken into account, China’s overall rank improves to
18th and its score is above that expected at its income level.
Croatia
Croatia ranks 45th overall, which combines ranks of 43 for
Resources, 48 for Environment, 42 for Connectivity and 41 for
Output. The Output rank has fallen by seven places because
Croatia no longer has a university in the Shanghai top 500.
Public expenditure on higher education as a share of GDP
has risen 11 places to 25th. Environment has fallen four places
following the availability of the new EUA data on autonomy of
institutions. External joint publications are the highest ranked
components in Connectivity: international co-authored papers
are ranked at 26 and those co-authored with industry are ranked
at 22. However, knowledge transfer with business is ranked at
48, suggesting that external links are with specialised groups.
The Output category includes a rank of 29 for publications
per head and their average impact is ranked at 36. 60 per
cent of publications emanate from one university (Zagreb).
Enrolment rates are at median levels and it is ranked 23rd for
PhD completions. Croatia scores well (rank 16) for employment of
those with a tertiary qualification compared with school leavers.
Croatia’s overall rank is 46 when allowance is made for income
differences across countries and its overall score is less than
expected at its level of income.
Czech Republic
The Czech Republic ranks 27th overall, which combines ranks
of 26 for Resources, 34 for Environment, 21 for Connectivity
and 30 for Output. Expenditure (both public and private) as a
share of GDP is ranked 39th and research expenditure 16th. The
highest ranking in Connectivity is for the international student
share (10th). Joint publications with international authors ranks
32nd. The Czech Republic is ranked 18th for joint publications
with industry but business views on knowledge transfer give a
much lower rank of 39. This suggests that external engagement
is specialised. Most of the Output variables yield values around
median levels, except that the country performs well on the
criterion of unemployment levels for those with a tertiary
qualification compared with school leavers (ranked 12th).
Publications adjusted for population are ranked equal 20th and
their impact 25th. The Output rank has remained remarkably
stable over six years of ranking. PhD completions per capita
are ranked 18th. When levels of GDP per capita are taken into
account the Czech Republic is ranked 24th and its score is about
that expected at its level of income.
U21 Ranking of National Higher Educational Systems 2018 4140 U21 Ranking of National Higher Educational Systems 2018
Denmark
Denmark is ranked fifth overall, which combines ranks of 4
for Resources, 23 for Environment, 5 for Connectivity and 5 for
Output. Within the Resources category, it is ranked sixth for
government expenditure as a share of GDP and 17th for total
expenditure (public plus private) per student. Denmark is ranked
first for spending on research and development by tertiary
institutions (as a share of GDP) and second for the number of
national researchers per head of population. It ranks fourth
for PhD completions per capita. In the Connectivity module,
Denmark is ranked fourth for both joint publications with industry
and knowledge transfer, and ninth for joint publications with
international authors. In Output it is ranked first for publications
per head of population and fifth for their average impact.
Denmark is ranked third for the overall quality of its universities.
Denmark maintains its overall ranking of fourth when adjustment
is made for different levels of GDP per capita. Its score is well
above that expected at its level of income.
Finland
Finland ranks sixth overall, which combines ranks of 9 for
Resources, 5 for Environment, 8 for Connectivity and 9 for Output.
It ranks third in government expenditure on higher education
as a share of GDP and 11th on total expenditure (public plus
private) per student. It ranks fifth in the number of national
researchers per head of population and PhD completions per
head are ranked ninth. Allowing for population, Finland ranks
sixth on publications which roughly matches its rank on research
expenditure of 8th. The average impact of papers is ranked
15th. Enrolment rates are ranked seventh which compares with
a rank of 11 for the tertiary qualifications of the workforce. In
Connectivity, Finland is ranked fourth for Web impact and eighth
for knowledge transfer with business. In joint publications it is
ranked tenth for those with international authors and ninth for
those with industry. When levels of GDP per capita are taken into
account Finland is ranked in first place and its score is well above
what is expected given its level of income.
France
France ranks 16th overall, which combines ranks of 17 in
Resources, 25 in Environment, 17 in Connectivity, and 13 in
Output. Within the Resources category it is ranked 16th for
government expenditure as a share of GDP and 18th for total
expenditure per student. (Private expenditure is about 20 per
cent of total expenditure.) In Connectivity, France ranks 12th for
joint publications with industry and 14th for joint publications
with international authors. France ranks 12th for international
students. In the Output module, France is ranked equal sixth for
the standing of its best three universities. The total number of
publications by the country’s universities is ranked fifth but this
falls to equal 20th when adjusted for population, compared
with a rank of 11 for research expenditure. Around one-half of
publications emanate from the top 10 per cent of institutions. The
average impact of publications is ranked 16th. France is ranked
20th for researchers per head and 21st for PhD completions per
head. When levels of GDP per capita are taken into account,
France’s overall rank is 19 and its score is around the level
expected at its level of income.
Germany
Germany is ranked 15th overall, which combines ranks of 18
for Resources, 27 for Environment, 13 for Connectivity and 11
for Output. In the Resources category it ranks 38th on total
expenditure (public plus private) as a share of GDP but 14th
on expenditure per student. The difference is explained by the
lower rank (27th) for the participation rate in higher education. In
Connectivity Germany performs well on links with industry: ranked
eighth for joint publications and tenth for knowledge transfer. It
ranks 21st for the share of publications that have international co-
authors. In Output, German universities are ranked fourth for total
publications and 23rd for publications deflated by population
even though research expenditure is ranked 11th. The average
impact of publications is ranked 11th. Germany ranks equal sixth
for the standing of its best three universities and seventh for
PhD completions per capita. The Environment score is pulled
Country Summaries(continued)
down in part because the points awarded for national policy
disadvantage federations. When levels of GDP per capita are
taken into account Germany’s overall ranking falls to 29th and its
score is just below what is expected given its level of income.
Greece
Greece is ranked equal 32th overall, which combines ranks of
27 for Resources, 50 for Environment, 28 for Connectivity and 27
for Output. It ranks 11th for government expenditure on higher
education as a share of GDP but 41st for expenditure per student.
This difference is explained by the high recorded participation rate
in tertiary education (ranked 1st). The low Environment rank occurs
because of an excessively centralised system and low grade from
business. In Connectivity, Greece is ranked 26th for joint publications
with industry but the tertiary system is rated lowly by business for
knowledge transfer (45th). This suggests that external links are
specialised. Web connectivity is around median levels. Other than for
the highly-ranked participation rate, the rankings for all the Output
measures lie around median values: ranging from a rank of 20 for
the average impact of research articles to 31st for the quality of its
best three universities. On a per head basis, the rank for publications
(27th) roughly matches that for research expenditure (29th). Greece
ranks 31st for PhD completions per head. When account is taken of
levels of per capita GDP, Greece’s overall ranking improves to 17th
and is at the level expected at its level of income.
Hong Kong SAR
Hong Kong SAR is ranked 17th overall, which combines ranks of
13 for Resources, 6 for Environment, 19 for Connectivity and 21
for Output. The Environment score is high reflecting a system
that gives significant autonomy to institutions while maintaining
overall surveillance. Government expenditure on higher education
as a share of GDP has fallen and is now ranked 22nd, a fall of
eight places. Total expenditure per student is ranked sixth. In
Connectivity, Hong Kong SAR is ranked ninth for articles co-
authored with international collaborators. The higher education
sector is ranked 16th for business satisfaction with the extent of
knowledge transfer but is ranked lower at 35th for articles written
with industry. Web-based connectivity is ranked 12th. In the Output
category, Hong Kong SAR is ranked 14th on publications per head
and equal ninth on the average impact of articles. Publications
are relatively evenly spread over institutions and it ranks 11th for
depth of its universities. When account is taken of levels of GDP
per capita Hong Kong’s ranking falls to 32nd and its score is a little
below that expected at its relatively high income level.
Hungary
Hungary is ranked 36th overall, which combines ranks of 47
for Resources, 42 for Environment, 18 for Connectivity and 32
for Output. Government expenditure on higher education as a
share of GDP ranks 44th. Declines in both public and private
expenditure has this year seen total expenditure as a share
of GDP decline fifteen places to 48th. Total expenditure per
student ranks 38th. The Connectivity ranking includes sixth in
joint publications with industry but business ranks knowledge
transfer lower at 33. Joint publications with international authors
rank 16th. Within the Output category, Hungary is ranked second
for employment of the tertiary educated workforce compared
with those who left after completing final year of schooling.
It is ranked 31st on publications per head and equal 27th for
their impact. PhD completions per head are ranked 33rd. The
Output rank is pulled down by the absence of a university in the
Shanghai top 500. When account is taken of relative levels of GDP
per capita, Hungary’s ranking is 41st and its score is below that
expected at its income level.
India
India is ranked 49th overall, which combines ranks of 39 for
Resources, 45 for Environment, 49 for Connectivity and 47 for
Output. It is ranked 18th for government expenditure on higher
education as a share of GDP but 47th for expenditure on research
by tertiary institutions. Under Environment, India scores low
grades for institutional autonomy and data quality. Within the
Connectivity category, India ranks well down for joint publications:
U21 Ranking of National Higher Educational Systems 2018 4342 U21 Ranking of National Higher Educational Systems 2018
both with international authors (50th) and with industry (46th). It
is scored a little higher by business on knowledge transfer (35th).
It rates lowly for web connectivity. Within the Output category,
India ranks 10th on total publications but 49th on publications
per head, which roughly matches the research expenditure rank
of 47. Nearly half the articles emanate from the top 10 per cent
of institutions. The average impact of articles is ranked at 42.
PhD completions per head rank 46th. When account is taken of
relative levels of GDP per capita, India’s overall ranking rises to
26th owing mainly to a large increase in the ranking for Resources
(now 11th). India’s GDP-adjusted overall score is around the level
expected at its income level.
Indonesia
Indonesia is ranked 50th overall, which combines ranks of 50
for Resources, 31 for Environment, 45 for Connectivity and 50
for Output. It is ranked 50th for government expenditure on
higher education as a share of GDP. In Connectivity, Indonesia
ranks, 32nd for joint publications with industry, 43rd for joint
publications with international authors and 29th for knowledge
transfer with business. Indonesia ranks in the bottom 20 per cent
for all Output measures (except employment rates of the tertiary
educated compared with school leavers) and loses points for not
having a university in the Shanghai top 500. It ranks 45th for PhD
completions per head. When allowance is made for levels of per
capita GDP, Indonesia’s overall ranking remains at 50 and the
score is well below that expected at its income level.
Iran
Iran is ranked 48th overall, which combines ranks of 46 for
Resources, 40 for Environment, 50 for Connectivity and 43
for Output. Government expenditure on higher education
as a share of GDP is ranked 36th, an improvement of seven
places. Connectivity remains very low. Iran ranks 50th for joint
publications with industry and 47th for joint publications with
international authors. Web-based impact is ranked 45th. The
number of articles published by Iranian authors is ranked 16th,
but this falls to 39th when population differences are allowed for;
the average impact of articles is ranked 44th. Iran ranks 23rd for
enrolment rates, 39th for the (tertiary) educational qualifications
of its workforce, and 36th for PhD completions per head. When
account is taken of levels of GDP per capita, the rank for Output
improves to 22nd and is about the level expected at Iran’s level
of income. However, the improvement in the overall rank is less
dramatic (to 37th) and the score is below that expected.
Ireland
Ireland is ranked 19th overall, which combines ranks of 30 for
Resources, 18 for Environment, 15 for Connectivity and 16 for
Output. Improvements in the ranking of outcomes (Connectivity
and Output) have offset deteriorations in inputs (Resources and
Environment) to keep the overall rank unchanged. Government
expenditure as a share of GDP has fallen 15 places to 35th and
the Environment rank has fallen four places to 15 because of
reductions in the financial autonomy of institutions. Expenditure
per student is ranked 21st. In Connectivity, the business rating
of knowledge transfer has improved markedly to sixth. Joint
publications with industry are ranked 23rd and with international
authors 18th. Under Output, Ireland is ranked 11th on publications
per head of population and 21st on their average impact. It
ranks 14th for the educational levels of its workforce and sixth for
employment of those with a tertiary qualification compared with
school leavers. PhD completions per head are ranked fifth. When
account is taken of relative levels of GDP per capita the ranking
is 36th but because of the importance of foreign firms in Ireland
the rank would be higher if Gross National Income was used as a
measure of income.
Israel
Israel is ranked 18th overall, which combines ranks of 22 for
Resources, 19 for Environment, 20 for Connectivity and 10 for
Output. Israel ranks 32nd for government expenditure on higher
education as a share of GDP, which improves to 22nd when
private expenditure is added. Expenditure per student is also
Country Summaries(continued)
ranked 22nd. Expenditure in tertiary institutions on R&D as a
percentage of GDP is ranked 13th. Israel is ranked first for the
number of researchers in the country per head of population
although PhD completions per head are ranked lower at 28th.
Israel is ranked seventh for the depth of quality universities.
Research output per head of population is ranked 17th and the
average impact of articles is ranked 19th. Israel is ranked fifth for
knowledge transfer with business and 20th for joint articles with
industry. Web impact is ranked 18th. Israel is ranked fourth for the
educational qualifications of its workforce. When account is taken
of relative levels of GDP per capita, the ranking improves to ninth
and the score is above that expected at Israel’s income level.
Italy
Italy is ranked equal 28th overall, which combines ranks of 38
for Resources, 38 for Environment, 27 for Connectivity and 25
for Output. The indicators show very little change from last
year. Government expenditure on higher education (75 per
cent of total expenditure) as a share of GDP is ranked 40th and
expenditure per student is ranked 28th. In Connectivity, joint
publications of academics with industry are ranked 19th and
joint publications with international authors 27th. Knowledge
transfer with firms is ranked 30th. In the Output category, Italian
tertiary institutions publish the seventh largest number of journal
articles but this rank falls to 22 when deflated by population size,
roughly matching the rank of 24 for research expenditure per
head. The average impact of articles is ranked 12th. The three
best performing universities are ranked equal 20th. Italy ranks
42nd on the education qualifications of its workforce, 34th on
number of researchers per head of population, and 29th on PhD
completions per head. When account is taken of relative levels of
GDP per capita, Italy’s ranking falls to 33rd and its score is below
that expected at its income level.
Japan
Japan is ranked 20th overall, which combines ranks of 23 for
Resources, 21 for Environment, 24 for Connectivity and 17 for
Output, little changed from last year. Total expenditure on higher
education (of which two-thirds is private) as a share of GDP is
ranked 21st but, because the participation rate is a little below
average, expenditure per student is ranked 12th. Connectivity is
predominantly internal: Japan ranks fifth for the percentage of
articles written jointly with industry collaborators, and knowledge
transfer with domestic business is ranked 24th. In contrast, the
international student share is ranked 33rd and the percentage of
articles co-authored with international researchers is ranked a
lowly 44th. In Output, Japan ranks sixth on total articles published
but 32nd when population size is allowed for, lower than the rank
for research expenditure of 20. Nearly half the articles emanate
from the top 10 per cent of institutions. The average impact of
articles is ranked equal 35th. Japan ranks fifth on the quality
of its best three universities. It ranks third on the educational
qualifications of its workforce, ninth for the number of researchers
in the country but 32nd for the number of completing PhDs. When
account is taken of relative levels of GDP per capita, Japan’s rank
falls to 35 and is below the level expected at its income level.
Korea
Korea is ranked 22nd overall, which combines ranks of 19
for Resources, 44 for Environment, 31 for Connectivity and 18
for Output. Government expenditure as a share of GDP has
improved by five places to 24th, but it still represents only 45 per
cent of total expenditure on higher education. Total expenditure
as a share of GDP ranks seventh but expenditure per student
ranks much lower at 33rd because Korea has the third highest
participation rate. The rank for Environment is pulled down by the
relatively low proportion of students and staff who are female.
Korean links with industry are ranked 13th for joint publications but
26th for knowledge transfer. Joint publications with international
authors are ranked 46th. In the Output category, Korea ranks 11th
on total publications but 25th when adjusted for population size,
the same rank as for research expenditure. The average impact
of publications is ranked at 33. Korea ranks sixth on the education
qualifications of its workforce; third on total researchers in the
U21 Ranking of National Higher Educational Systems 2018 4544 U21 Ranking of National Higher Educational Systems 2018
nation (adjusted for population); and 14th for PhD completions
per head. When account is taken of relative levels of GDP per
capita, Korea’s overall rank falls to 34 and is a little below that
expected at its income level.
Malaysia
Malaysia is ranked 26th overall, which combines ranks of 12 for
Resources, 15 for Environment, 33 for Connectivity and 42 for
Output. Malaysia is ranked eighth for government expenditure
on higher education as a share of GDP; expenditure per student
ranks tenth. Expenditure on R&D in tertiary institutions as a
share of GDP was abnormally high in last year’s rankings (11th)
and has now returned to more typical values (ranked 24th). In
Connectivity, Malaysia is ranked 17th for knowledge transfer
with business, but 48th for joint publications with industry. Joint
publications with international authors have risen in rank to 34th.
Using the new data base, Malaysian institutions are ranked 23rd
for total publications and 34th for both publications per head
of population and the average impact of articles. The country
is ranked 37th for the educational attainment of the workforce
and 31st for the number of researchers in the nation (adjusted for
population). PhD completions per head are ranked 34th. When
account is taken of relative levels of GDP per capita, Malaysia’s
overall ranking improves to 23rd and the estimated overall score
is around the level expected at Malaysia’s income level.
Mexico
Mexico is ranked 46th overall, which combines ranks of 37 for
Resources, 26 for Environment, 47 for Connectivity and 49 for
Output. Both public and private expenditure on higher education
has increased noticeably since last year’s ranking: the rank of
total expenditure as a share of GDP has increased ten places to
27th. Expenditure per student has improved five places to 35th.
Mexico ranks 40th for expenditure by tertiary institutions on
R&D as a share of GDP. In Connectivity, Mexico ranks 47th for
joint publications with industry and 36th for knowledge transfer.
Joint publications with international authors are ranked 36th.
Web connectivity is well below average. In Output, Mexico is
ranked equal 33rd for total publications but 47th when adjusted
for population. Tertiary enrolment rates are ranked 48th; PhD
completions per head are ranked 39th. When account is taken
of levels of GDP per capita Mexico’s overall rank is 49 and the
overall score is well below that expected at Mexico’s level of
income. The recent increase in resources can be expected to
improve outcomes in future years.
Netherlands
The Netherlands is ranked sixth overall, which combines ranks of
11 for Resources, 8 for Environment, 4 for Connectivity and 8 for
Output. It is ranked 13th for total expenditure on higher education
(which is 70 per cent government funded) as a share of GDP, an
increase of five places. Expenditure per student is ranked ninth.
It ranks highly for Connectivity with business: second for joint
publications and third for knowledge transfer. Joint publications
with international authors are ranked 11th and web connectivity is
above average. In Output, the Netherlands performs strongly in
research publications per head (seventh, which exactly matches
the research expenditure rank) and their average impact is
ranked third. The participation rate is ranked 19th, and the
education qualifications of the workforce 20th. The standing of
its universities is high: ranked fifth for depth (the Netherlands
has the most even spread of publications across institutions) and
10th for its best three universities. The Netherlands ranks 13th
for the national stock of researchers per head and 12th for PhD
completions per head. When account is taken of levels of GDP
per capita the overall rank is 13. The scores for each of the four
broad categories and overall are above those expected at the
Netherland’s income levels.
New Zealand
New Zealand is ranked equal 14th overall, which combines ranks
of 20 for Resources, 3 for Environment, 6 for Connectivity and
20 for Output. For expenditure as a share of GDP, New Zealand
is ranked 29th for government expenditure and 9th for total
Country Summaries(continued)
expenditure. In Connectivity, New Zealand’s highest score is
for the percentage of students who are international, where it
is ranked first. International students make up a third of short-
cycle tertiary programmes. It ranks 11th for the annual number
of PhD completions, 51 per cent of whom are international
(ranked second). New Zealand is ranked 12th for publications
with international researchers and 25th for publications with
industry. The rank for business views on knowledge transfer is
19, a fall of nine places from last year’s ranking. On a per capita
basis, New Zealand is ranked 15th for publications per head
but 26th for research expenditure: the difference is indicative
of high productivity. It ranks 18th on the average impact of
publications. New Zealand’s tertiary enrolment rate is ranked 10th
and the tertiary educational qualifications of its workforce 19th.
When account is taken of relative levels of GDP per capita, New
Zealand’s rank improves to tenth and its score is above the level
expected at its income level.
Norway
Norway is ranked 12th overall, which combines ranks of 7 for
Resources, 17 for Environment, 16 for Connectivity and 14 for
Output. In expenditure as a share of GDP, Norway is ranked 5th
for public expenditure (95 per cent of total expenditure) and 17th
for total expenditure. Expenditure per student is ranked eighth.
In Connectivity, co-authorship with international collaborators
is ranked eighth and with industry 15th. Web connectivity is
ranked eighth. There is a matching of research expenditure
as a share of GDP (10th) with research publications per head
(ranked ninth). Norway ranks ninth for both the average impact of
publications and the depth of quality universities. It is ranked 20th
for participation rates in higher education, 12th for the tertiary
educational qualifications of the workforce and eighth for the
number of national researchers per head. It ranks thirteenth for
PhD completions per head. Norway’s overall rank falls to 28th
when account is taken of levels of GDP per head and the overall
score is around that expected at its high income level.
Poland
Poland is ranked 31st overall, which combines ranks of 33 for
Resources, 14 for Environment, 40 for Connectivity and 31 for
Output. In expenditure as a share of GDP, Poland is ranked
17th for public expenditure, 33rd for total expenditure and 31st
for research expenditure. Connectivity with industry is below
average: Poland ranks 38th in joint articles with industry and 34th
in knowledge transfer with business, but the latter has improved
13 places since last year. In joint articles with international
collaborators Poland is ranked 40th. Web connectivity is a little
below the median. In Output, Poland is ranked 18th on published
articles but this falls to 30th when adjusted for population. The
average impact of articles is ranked at 27. Participation rates
are ranked 28nd and the tertiary educational qualifications of
the workforce 26th. PhD completion rates (per head) rank 35th.
Poland performs well (fifth) on the employment rates of those
with a tertiary qualification compared with those who only
complete final year of schooling. Poland’s rank improves to 27th
when account is taken of levels of GDP per capita and its score is
around that expected at its income level.
Portugal
Portugal is ranked 24th overall, an improvement of three places.
The component ranks are 24 for Resources, 35 for Environment,
25 for Connectivity and 28 for Output. In expenditure as a share
of GDP, Portugal is ranked 31st for both public expenditure, an
improvement of six places from last year’s ranking, and total
expenditure. Under the heading of Connectivity, Portugal is
ranked 19th for joint publications with international researchers
and 37th for publications with industry. Knowledge transfer with
business is ranked 25th. In the Output module, publications per
head are ranked 12th whereas research expenditure per head
ranks only 19th, which is an indicator of efficiency. Portugal ranks
30th in the tertiary educational qualifications of the workforce,
but the tertiary enrolment rate is ranked lower at 36th. After
allowing for population, Portugal ranks 22nd for the number of
researchers in the country and 19th for PhD completions. When
U21 Ranking of National Higher Educational Systems 2018 4746 U21 Ranking of National Higher Educational Systems 2018
account is taken of relative levels of GDP per capita, Portugal’s
ranking jumps to sixth (third on Output) and its score is above that
expected at its level of income.
Romania
Romania is ranked 43rd overall, which combines ranks of 45
for Resources, 30 for Environment, 41 for Connectivity and 46
for Output. The Connectivity score has fallen nine places as a
consequence of the score recorded by business for knowledge
transfer falling to 42nd. Total expenditure as a share of GDP is
ranked 41st and research expenditure 43rd. The Environment
measure benefits from institutions having a relatively high
percentage of female staff (ranked fifth). In the Connectivity
measures, joint publications with international authors are ranked
42nd and those with co-authors from industry are ranked 36th.
The absence of a university in the top 500 lowers the Output
score. Romania is ranked 37th on research articles per head and
40th on their average impact. The number of PhD completions
(per head) is ranked 26th. When account is taken of relative levels
of GDP per capita Romania is ranked 47th and its score is well
below that expected at its level of income.
Russia
Russia is ranked 33rd overall, which combines ranks of 42 for
Resources, 28 for Environment, 46 for Connectivity and 26 for
Output. For expenditure as a share of GDP, Russia is ranked 37th for
public expenditure, 35th for total expenditure and 42nd for research
expenditure. In the Connectivity module, Russia is relatively weak
on interactions with industry: it is ranked 43rd for each of joint
publications with industry and knowledge transfer with firms. It
ranks 35th for joint publications with international researchers. In
the Output module, Russia is ranked second for the educational
qualifications of its workforce and ninth for the employment rates
of those with a tertiary qualification compared with school leavers.
The annual number of PhD completions ranks 24th. Total research
publications rank 20th, publications per head 45th and their
average impact 32nd. Over the last six years Russia has improved
six places on Output. When account is taken of relative levels of
GDP per capita the rank is 43 and the GDP adjusted score for
Russia is well below that expected at its income level.
Saudi Arabia
Saudi Arabia is ranked equal 23rd overall, which combines ranks
of 10 for Resources, 46 for Environment, 26 for Connectivity and
33 for Output. It is ranked first for government expenditure on
higher education as a share of GDP. In the Connectivity module,
Saudi Arabia is ranked first for the share of publications that
have an international collaborator but it is ranked only 40th for
joint publications with industry. Web connectivity is in the lowest
quintile. The highest score in the Output module is for the quality
of its best three universities which are ranked 16th and account for
two-thirds of publications in the country. Saudi Arabia is ranked
40th for publications per head and 22nd for their average impact.
The annual number of PhD completions is ranked 47th. High
government expenditure is now showing up in the Output rank
that has improved 12 places over the last six years, the largest
improvement for any country. However, Saudi Arabia’s high level
of GDP per capita inevitably means that its ranking falls (to 48th)
when income levels are allowed for. The GDP adjusted score for
Saudi Arabia is well below that expected at its income level.
Serbia
Serbia is ranked 42nd overall, which combines ranks of 28 for
Resources, 49 for Environment, 38 for Connectivity and 45 for
Output. Government expenditure on higher education as a share
of GDP is ranked 13th and expenditure by institutions on R&D is
ranked 27th. Using the new EUA rating for Serbia for the financial
autonomy of institutions has lowered the score for the policy
Environment. Serbia ranks 41st on joint publications with industry
and 35tht on joint publications with international authors. In the
Output module, Serbia ranks 33rd in publications per head and
47th in their average impact. Serbia ranks 29th for the average
quality of its universities but 60 per cent of publications emanate
Country Summaries(continued)
from one university (Belgrade). It is ranked 36th for the tertiary
education qualifications of the work force and 37th for the tertiary
enrolment rate. In per capita terms, Serbia ranks 33rd for the
national stock of researchers and 30th for the annual number of
PhD completions. When account is taken of relative levels of GDP
per capita Serbia’s rank jumps to third place and the score is well
above that expected for its level of income.
Singapore
Singapore is ranked ninth overall, which combines ranks of 3
for Resources, 4 for Environment, 10 for Connectivity and 15 for
Output. It ranks 23rd for government expenditure on tertiary
education as a share of GDP but first for total expenditure
(public plus private) per student. Singapore ranks second for
R&D expenditure by universities per head of population and
this is reflected in the ranking of fifth for publications per head
and sixth for their average impact. In the Connectivity category,
it ranks second for the relative importance of international
students and sixth for joint publications with international
authors. In engagement with the private sector, Singapore
ranks ninth for knowledge transfer with firms but 33rd for joint
scientific publications with industry. The (tertiary) educational
qualifications of the workforce is ranked 13th and the number of
national researchers per head is ranked sixth. When allowance
is made for national levels of GDP per head Singapore’s ranking
falls to 21st but the score is around what is expected at its high
income level.
Slovakia
Slovakia is ranked 35th overall, which combines ranks of 31 for
Resources, 39 for Environment, 30 for Connectivity and 34 for
Output. Total expenditure on higher education (of which nearly
80 per cent is by government) as a share of GDP is ranked
45th; government expenditure at 33rd. Research expenditure
by tertiary institutions as a share of GDP has risen 19 places
to 12th. This can be expected to flow through to research
performance in later years. Currently, Slovakia is ranked 28th
for publications per head and 26th for their average impact.
Within the Connectivity module, Slovakia is ranked 33rd for
joint publications with international researchers, 21st for joint
scientific publications with industry and 40th for knowledge
transfer with firms. The Output score is lowered by the absence
of any university in the Shanghai top 500. On a per capita
basis, the national stock of researchers ranks 28th which can be
expected to increase as the annual number of PhD completions
ranks eighth. Slovakia ranks seventeenth for the employment
rate of those with a tertiary qualification compared with school
leavers. When account is taken of relative levels of GDP per
capita, Slovakia’s rank falls to 40th and its score is well below
that expected at its income level.
Slovenia
Slovenia is ranked 29th overall, which combines ranks of 36 for
Resources, 36 for Environment, 22 for Connectivity and 29 for
Output. It is ranked around the median level for many of the
indicators. Government expenditure on higher education as a
share of GDP is ranked 27th but because private expenditure
is low (14 per cent) total expenditure is ranked 43rd. On a per
capita basis, publications per head rank 16th, a creditable
performance given that R&D expenditure by tertiary institutions
ranks only 32nd. Nearly 70 percent of publications emanant
from one university (Ljnbljana). In the Connectivity module, joint
scientific papers with industry are ranked 11th but business ranks
knowledge transfer at a low 37th. This suggests engagement
is specialised. The share of publications that are joint with
international authors is ranked 13th. Slovenia has slipped five
places in the Output ranking over the last six years. The tertiary
qualification rate of the labour force is ranked 24th, but this will
increase as the participation rate in higher education is ranked
13th. On a per capita basis Slovenia is ranked 23rd for the number
of researchers in the nation but this is likely to rise as annual
PhD completions are ranked third. When allowance is made for
levels of GDP per capita, Slovenia is ranked 25th and the score is
around that expected at its income level.

U21 Ranking of National Higher Educational Systems 2018 4948 U21 Ranking of National Higher Educational Systems 2018
South Africa
South Africa is ranked 37th overall, which combines ranks of 41
for resources, 23 for Environment, 32 for Connectivity and 36
for Output. Government expenditure on higher education as
a share of GDP is ranked 47th and research expenditure 35th.
The Environment score is dragged down by a very low score
on the World Economic Forum rating by business (ranked 47th)
and its rank of 37 for data quality. In Connectivity, South Africa
is 17th for the percentage of joint publications with international
researchers, 29th for joint publications with industry and 32nd
for knowledge transfer with firms. But web-based connectivity
is in the bottom decile. South Africa’s rank in the Output module
has improved six places over the last six years. The tertiary
education sector is ranked equal 28th for total publications, 42nd
for publications per head and 24th for their average impact.
Both enrolment rates and the educational qualifications of the
workforce are in the bottom decile. South Africa ranks 41st on
the annual number of PhD completions. It ranks first for the
employment of those with a tertiary qualification compare with
school leavers. When allowance is made for differences in GDP
per head, South Africa’s rank jumps to eighth and the score is well
above that expected at its level of income.
Spain
Spain is ranked 25th overall, which combines ranks of 29 for
Resources, 33 for Environment, 29 for Connectivity and 24 for
Output. As a share of GDP, Spain is ranked 30th for government
expenditure on higher education (about 70 per cent of total
expenditure), 34th for total expenditure and 29th for research
expenditure. In engagement with the private sector, Spain
ranks 27th for joint scientific publications with industry and 38th
for knowledge transfer. Joint publications with international
collaborators are ranked 25th. Spain’s tertiary institutions are
ranked 23rd for web connectivity. In Output, Spain is ranked
13th for total publications and 26th on a per capita basis. The
average impact of published articles is ranked 23rd. In the
educational qualifications of the workforce, Spain is ranked
21st but this will increase as the participation rate in tertiary
education is ranked fifth. On a per capita basis, the national
stock of researchers is ranked 28th and the annual number of
PhD completions 16th. When allowance is made for differences
in GDP per head, Spain’s rank is 30 and its score is a little below
that expected at its level of income.
Sweden
Sweden is ranked fourth overall, which combines ranks of 2 for
Resources, 12 for Environment, 7 for Connectivity and 6 for Output.
In Resources as a share of GDP, Sweden is ranked seventh for
government expenditure (about 90 per cent of total expenditure),
16th for total expenditure and third for research expenditure.
Expenditure per student is ranked fifth. Sweden’s lowest rank is
for the policy Environment which owes to its score for institutional
autonomy being only around median values. Sweden performs
well in engagement with industry: ranks third for joint publications
and 13th for knowledge transfer. It ranks seventh for joint
publications with international researchers and is in the top ten
for web connectivity. In Output, Sweden is ranked fourth for
publications per head and eighth for their average impact. Its
university sector is ranked second for average quality. It is ranked
16th for the (tertiary) educational qualifications of its workforce.
On a per capita basis, Sweden ranks fourth for the number of
researchers in the nation and tenth for the annual number of
PhD completions. When allowance is made for levels of GDP per
capita, Sweden is ranked fifth overall and its score is well above
that expected at its level of income.
Switzerland
Switzerland is ranked second overall, which combines ranks
of 1 for Resources, 11 for Environment, 1 for Connectivity and 4
for Output. Government expenditure on higher education as
a share of GDP ranks 12th and expenditure per student third.
Connectivity within the nation and externally is high. It is rated
first for knowledge transfer with firms, 10th for joint publications
with industry, and second for joint publications with international
Country Summaries(continued)
researchers. It is fourth for the proportion of students who are
international. At the PhD level it ranks first for the annual number
of PhD completions, 54 per cent of whom are international.
Web-based impact is ranked second. On a per capita basis,
Switzerland is ranked second for publications which reflects
its number one rank for R&D expenditure. Publications are
ranked number one for average impact. Its universities are
ranked first for average quality. Switzerland ranks 15th for
the (tertiary) educational qualifications of its workforce and
16th for the number of researchers in the nation per head of
population. When levels of GDP per capita are taken into account,
Switzerland is ranked seventh and its score is well above that
expected at its level of income.
Taiwan-China
Taiwan-China is ranked 21st overall, which combines ranks of
32 for Resources, 9 for Environment, 23 for Connectivity and 23
for Output. Expenditure on higher education as a share of GDP
is ranked 24th, of which 55 per cent is private. In Connectivity,
knowledge transfer with firms is ranked 18th but joint scientific
publications with industry are ranked lower at 34th. Joint
publications with international researchers are rated lowly at
45th. Taiwan-China ranks 13th for Web connectivity. In Output,
it is ranked 17th for total publications and 39th for their average
impact. It is ranked seventh for the educational qualifications of
its workforce and 12th for the enrolment rate in higher education.
Taiwan-China is well provided with researchers per head of
population where it is ranked seventh. When levels of GDP per
capita are taken into account, Taiwan-China slips to 38th in the
ranking and is below the level expected at its income level.
Thailand
Thailand is ranked equal 47th overall, which combines ranks of
49 for Resources, 29 for Environment, 36 for Connectivity and 48
for Output. Government expenditure on higher education as a
share of GDP is ranked 46th and expenditure on R&D is ranked
41st. In Connectivity, knowledge transfer with industry is ranked
27th, joint publications with industry 28th, and joint articles with
international researchers 30th. The Output score is negatively
impacted by Thailand having no university in the Shanghai top
500. Publications per head are ranked 46th and their average
impact 38th. The (tertiary) educational qualifications of the
workforce is ranked 45th. The annual number of PhD completions
is ranked 44th. When levels of GDP per capita are taken into
account, Thailand ranks 45th and the adjusted score is well below
that expected at its level of income.
Turkey
Turkey is ranked equal 41st overall, which combines ranks
of 21 for Resources, 47 for Environment, 48 for Connectivity
and 40 for Output. Calculated as shares of GDP, government
expenditure on higher education ranks tenth, total expenditure
ranks 12th, and research expenditure by tertiary institutions
ranks 19th. Connectivity is weak: the highest rank is 39 for Web
impact. Knowledge transfer as viewed by business is ranked
41st, a fall of 12 places from last year’s ranking. Joint articles with
international authors and with industry are each ranked 49th. In
Output, Turkish institutions of higher education rank 15th for total
publications but 36th for publications per head. Citations per
article are ranked 45th. Participation rates are ranked second
but it will take time for this to flow through fully to the educational
qualifications of the workforce (currently ranked 41st). On a per
capita basis, the number of researchers is ranked 39th and the
annual number of PhD completions is ranked 38th. When levels of
GDP per capita are taken into account, Turkey’s rank is 42nd and
its score is well below that expected at its level of income.
Ukraine
Ukraine is ranked 38th overall, which combines ranks of 25 for
Resources, 37 for Environment, 37 for Connectivity and 44 for
Output. Ukraine is second for government expenditure on higher
education as a share of GDP. However, because of the relatively
high participation rate (ranked 16th) expenditure per student is
in the lower decile. R&D expenditure by tertiary institutions as a
U21 Ranking of National Higher Educational Systems 2018 5150 U21 Ranking of National Higher Educational Systems 2018
share of GDP has a low ranking of 45. In Connectivity, Ukraine
ranks 30th for joint scientific publications with industry but only
46th for knowledge transfer. It ranks 31st for joint publications
with international authors. In Output, Ukraine loses points for not
having a flagship university in the Shanghai top 500. Ukraine
ranks 50th for total publications, 48th for publications per head of
population, and 50th for their average impact. The Output rank
has fallen nine places over the last six years. The level of (tertiary)
educational qualifications of its workforce is ranked fifth. Using
per capita figures, the number of national researchers is ranked
40th and the annual number of PhD completions is ranked 27th.
When levels of GDP per capita are taken into account, Ukraine’s
overall ranking improves to 22nd and its score is about that
expected at its income level.
United Kingdom
The United Kingdom is ranked third overall, an improvement of
seven places over the last seven years. The overall rank combines
ranks of 16 for Resources, 7 for Environment, 3 for Connectivity
and 2 for Output. Total expenditure on higher education as a
share of GDP is ranked tenth. The OECD method of splitting
total expenditure between public and private is not consistent
over time, but in the current data public expenditure ranks 48th.
Expenditure per student is ranked fourth which reflects the lower
than average participation rate (ranked 39th). Connectivity with
industry is relatively strong: the United Kingdom ranks seventh
for knowledge transfer with business and 14th for joint scientific
publications. The rank for joint publications with international
authors is 15. The United Kingdom ranks third for the percentage
of students who are international and fifth for the number of
times external users access websites. In the Output category,
the United Kingdom ranks third for total publications and fourth
for the average impact of articles. On a per capita basis,
research publications rank eighth compared with a rank of 18
for research expenditure, which implies an above-average level
of efficiency. Nearly half the articles emanate from the top 10
per cent of institutions. The United Kingdom ranks second for
the quality of its best three universities. It is ranked ninth for the
(tertiary) educational qualifications of the workforce. In per
capita terms, the United Kingdom ranks 17th for the national
stock of researchers but second for the annual number of PhD
completions, 43 per cent of whom are international. When levels
of GDP per capita are taken into account, the United Kingdom is
ranked second and its score is well above the level expected at its
income level.
United States
The United States is ranked first overall, which combines ranks
of 6 for Resources, 1 for Environment, 11 for Connectivity and 1
for Output. Expenditure on higher education as a share of GDP
is ranked first (public expenditure has fallen to one-third of the
total) and expenditure per student second. Links with the private
sector are strong: knowledge transfer is rated second and joint
scientific publications 16th. However, as is expected for other
large countries, the percentage of publications that are joint
with international authors ranks much lower at 38. Although the
United States has the largest absolute number of international
students, as a share of its total students it ranks only 26th. It ranks
first for the number of times external users access websites of
tertiary institutions even when adjusted for population. In Output,
the United States is first for total publications and fourth for the
average impact of articles. On a per capita basis it ranks 18th
for publications, similar to the rank for research expenditure
of 14. Around 50 per cent of publications emanate from the
top 10 per cent of institutions. The United States ranks eighth
for participation rates and ninth for the (tertiary) educational
credentials of its workforce. It is ranked first for the quality of its
best three universities. On a per capita basis it is ranked 19th for
the national stock of researchers and 20th for the annual number
of PhD completions. When levels of GDP per capita are taken into
account, the overall rank for the United States falls to 15th but its
score is above the level expected at its income level.
Country Summaries(continued)

52 U21 Ranking of National Higher Educational Systems 2018
Universitas 21c/o Strathcona 109University of BirminghamEdgebaston, BirminghamB15 2TTUK
T: +44 (0)121 414 9596F: +44 (0)121 415 8873E: [email protected]


