Page 1
Ranking Web Services Using
Centralities and Social Indicators
Tilo Zemke*
José I. Fernández-Villamor**
Carlos Á. Iglesias**
ENASE 2012, Wroclaw
29th June 2012
* Chemnitz University of Technology
** Technical University of Madrid
Page 2
Ranking Web Services Using Centralities
and Social Indicators
2
Page 3
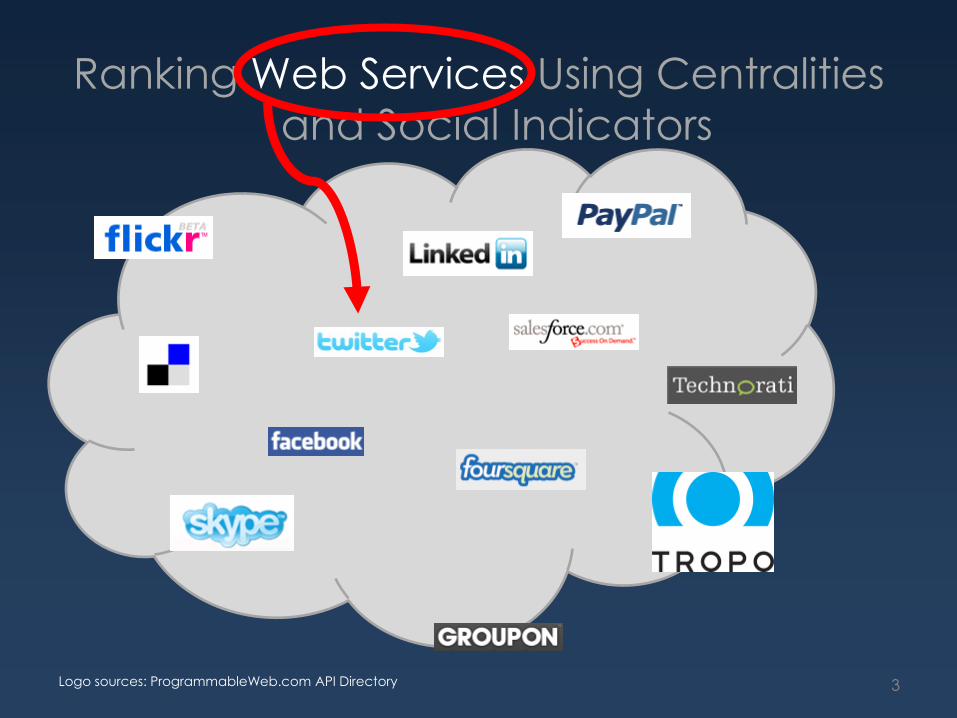
Ranking Web Services Using Centralities
and Social Indicators
Logo sources: ProgrammableWeb.com API Directory 3
Page 4
Ranking Web Services Using Centralities
and Social Indicators
Logo sources: ProgrammableWeb.com API Directory 4
Page 5
Ranking Web Services Using Centralities
and Social Indicators
Logo sources: ProgrammableWeb.com API Directory 5
Page 6
http://blog.programmableweb.com/2012/05/22/6000-apis-its-business-its-social-and-its-happening-quickly/
6
Page 8
How can we bring order to the set of
web services?
8
Page 9
Ranking Web Services Using Centralities
and Social Indicators
9
Page 10
• Relative importance of a vertex within
a graph
Ranking Web Services Using Centralities
and Social Indicators
10
Page 11
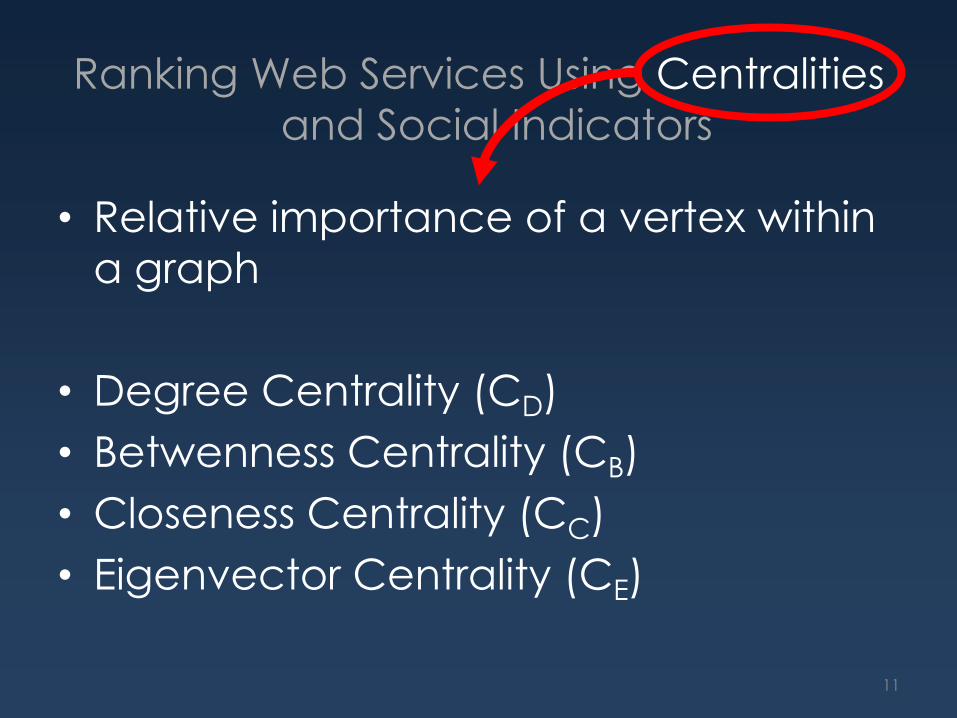
• Relative importance of a vertex within
a graph
• Degree Centrality (CD)
• Betwenness Centrality (CB)
• Closeness Centrality (CC)
• Eigenvector Centrality (CE)
Ranking Web Services Using Centralities
and Social Indicators
11
Page 12
Graph representation
12
Page 13
Graph representation (simplified)
13
Page 14
Degree Centrality (CD)
14
Page 15
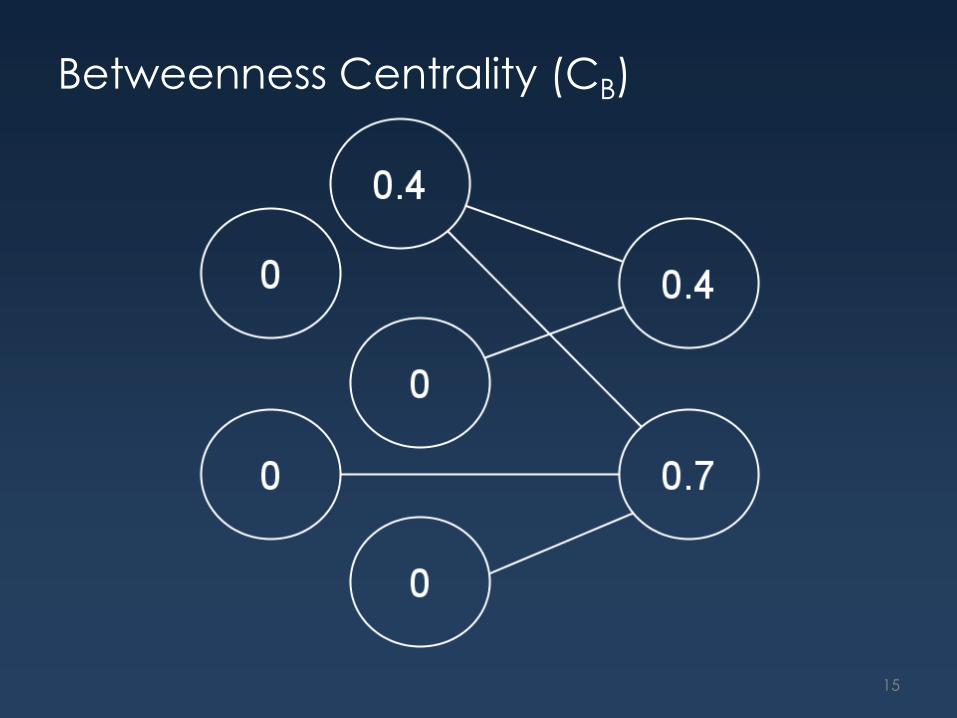
Betweenness Centrality (CB)
15
Page 16
Closeness Centrality (CC)
16
Page 17
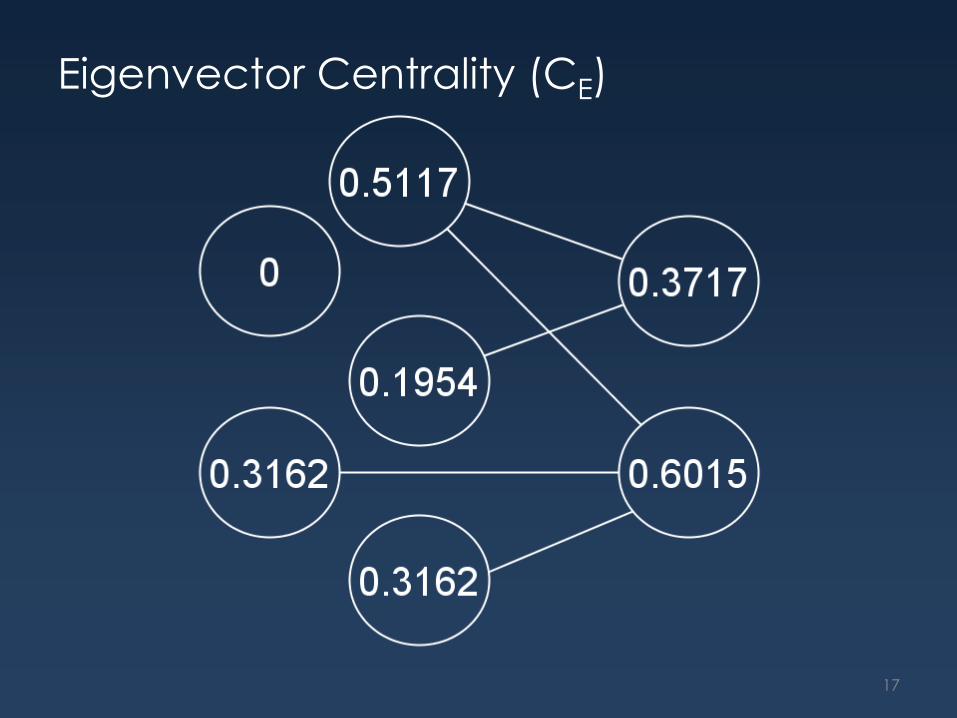
Eigenvector Centrality (CE)
17
Page 18
Ranking Web Services Using Centralities
and Social Indicators
18
Page 19
Ranking Web Services Using Centralities
and Social Indicators
• ProgrammableWeb User Rating (PUR)
• Hits on Stackoverflow.com (GSO)
19
Page 20
ProgrammableWeb User Rating (PUR)
20
Page 21
Hits on Stackoverflow.com (GSO)
+
Ranking!
„Twitter API site:stackoverflow.com“
21
Page 22
How can we measure the quality?
22
Page 23
•Subsets of Dataset
•„image“ (32), „voice“ (19), „twitter“ (18)
23
Page 24
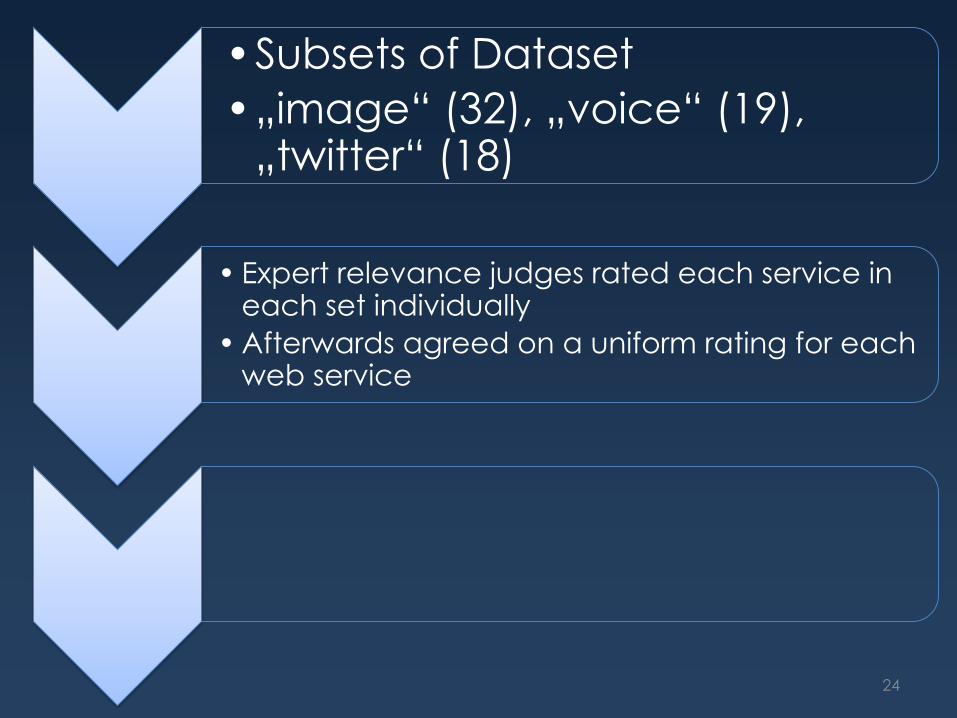
•Subsets of Dataset
•„image“ (32), „voice“ (19), „twitter“ (18)
• Expert relevance judges rated each service in each set individually
• Afterwards agreed on a uniform rating for each web service
24
Page 25
•Subsets of Dataset
•„image“ (32), „voice“ (19), „twitter“ (18)
• Expert relevance judges rated each service in each set individually
• Afterwards agreed on a uniform rating for each web service
• Ratings served as gain quantifications for the normalized Discounted Cumulated Gain (nDCG) calculations
25
Page 26
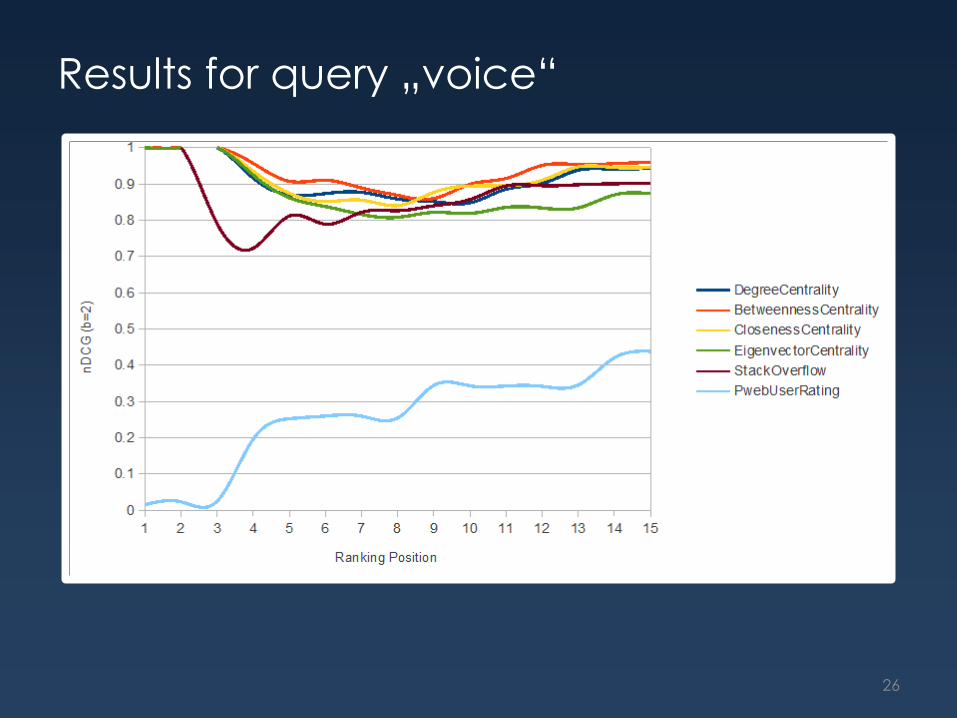
Results for query „voice“
26
Page 27
Results for query „twitter“
27
Page 28
Results for query „image“
28
Page 29
Part of this research was funded by the
European Commission under the
project ICT-OMELETTE (FP7-ICT-2009-5):
European Project on Open Platform for
Telco Mashups
www.ict-omelette.eu
29
Page 30
OMELETTE Mashup Registry
30
Page 31
Thank you! Tilo Zemke
[email protected]
31