Rapid, Accurate, and Non-Invasive Measurement of Zebrafish Axial Length and Other Eye Dimensions Using SD-OCT Allows Longitudinal Analysis of Myopia and Emmetropization Ross F. Collery 1 , Kerry N. Veth 1 , Adam M. Dubis 1 , Joseph Carroll 1,2,3 , Brian A. Link 1 * 1 Department of Cell Biology, Neurobiology and Anatomy, Medical College of Wisconsin, Milwaukee, Wisconsin, United States of America, 2 Department of Ophthalmology, Medical College of Wisconsin, Milwaukee, Wisconsin, United States of America, 3 Department of Biophysics, Medical College of Wisconsin, Milwaukee, Wisconsin, United States of America Abstract Refractive errors in vision can be caused by aberrant axial length of the eye, irregular corneal shape, or lens abnormalities. Causes of eye length overgrowth include multiple genetic loci, and visual parameters. We evaluate zebrafish as a potential animal model for studies of the genetic, cellular, and signaling basis of emmetropization and myopia. Axial length and other eye dimensions of zebrafish were measured using spectral domain-optical coherence tomography (SD-OCT). We used ocular lens and body metrics to normalize and compare eye size and relative refractive error (difference between observed retinal radial length and controls) in wild-type and lrp2 zebrafish. Zebrafish were dark-reared to assess effects of visual deprivation on eye size. Two relative measurements, ocular axial length to body length and axial length to lens diameter, were found to accurately normalize comparisons of eye sizes between different sized fish (R 2 = 0.9548, R 2 = 0.9921). Ray-traced focal lengths of wild-type zebrafish lenses were equal to their retinal radii, while lrp2 eyes had longer retinal radii than focal lengths. Both genetic mutation (lrp2) and environmental manipulation (dark-rearing) caused elongated eye axes. lrp2 mutants had relative refractive errors of 20.327 compared to wild-types, and dark-reared wild-type fish had relative refractive errors of 20.132 compared to light-reared siblings. Therefore, zebrafish eye anatomy (axial length, lens radius, retinal radius) can be rapidly and accurately measured by SD-OCT, facilitating longitudinal studies of regulated eye growth and emmetropization. Specifically, genes homologous to human myopia candidates may be modified, inactivated or overexpressed in zebrafish, and myopia-sensitizing conditions used to probe gene-environment interactions. Our studies provide foundation for such investigations into genetic contributions that control eye size and impact refractive errors. Citation: Collery RF, Veth KN, Dubis AM, Carroll J, Link BA (2014) Rapid, Accurate, and Non-Invasive Measurement of Zebrafish Axial Length and Other Eye Dimensions Using SD-OCT Allows Longitudinal Analysis of Myopia and Emmetropization. PLoS ONE 9(10): e110699. doi:10.1371/journal.pone.0110699 Editor: Michael G. Anderson, University of Iowa, United States of America Received June 12, 2014; Accepted September 19, 2014; Published October 21, 2014 Copyright: ß 2014 Collery et al. This is an open-access article distributed under the terms of the Creative Commons Attribution License, which permits unrestricted use, distribution, and reproduction in any medium, provided the original author and source are credited. Data Availability: The authors confirm that all data underlying the findings are fully available without restriction. All relevant data are within the paper and its Supporting Information files. Funding: This study was supported by Research Training Program in Vision Sciences Grants T32EYE014537 (KNV; AMD)(https://www.nei.nih.gov/funding/neifm. asp); National Institutes of Health Grant R01EY16060 (BAL)(https://www.nei.nih.gov/funding/neifm.asp); and National Eye Institute Core Facilities Grant P30EY001931 (https://www.nei.nih.gov/funding/neifm.asp), and an unrestricted Departmental grant from Research to Prevent Blindness (JC)(https://www.rpbusa. org/rpb/grants/grants/). The funders had no role in study design, data collection and analysis, decision to publish, or preparation of the manuscript. Competing Interests: The authors have declared that no competing interests exist. * Email: [email protected]Introduction Emmetropization is the process of correctly regulating eye globe size so that it matches the dioptric power of the anterior ocular structures, resulting in a sharply focused retinal image. This process requires tight control of the axial length of the eye, since an axial length longer than the focal length of the lens results in myopia (nearsightedness), while an axial length shorter than the focal length leads to hyperopia (farsightedness). Axial length, comprising the cornea, aqueous, lens, vitreous, retina and retinal pigment epithelium (RPE), is the largest contributor to refractive error leading to myopia [1] and is one of the most useful individual metrics used to assess myopia in humans. Homeostasis of axial length is controlled by regulated eye growth and subtle remodeling of ocular shape. Myopia is the most common visual disorder in the world [2], affecting over 25% of people over 40 in the US and western Europe [3]. Prevalence rates are even higher in regions of Asia, where myopia approaches epidemic levels [4], as well as in certain ethnic populations from Indonesia and Japan [5,6]. In addition to defocus of vision, myopia is also associated with pathologies including increased incidence of glaucoma, retinal detachment, cataracts, chorioretinal atrophy, scleral thinning, staphyloma, and damage to Bruch’s membrane caused by choroidal thinning [3,7– 10]. The genetic causes of myopia are complex, with a large number of gene associations [11]. Genome-wide association studies have provided insights into the spectrum of candidate genes causing myopia in humans [12,13], and have added to the considerable number of genes found to be modified by mutation or expression PLOS ONE | www.plosone.org 1 October 2014 | Volume 9 | Issue 10 | e110699
Transcript
Rapid, Accurate, and Non-Invasive Measurement ofZebrafish Axial Length and Other Eye Dimensions UsingSD-OCT Allows Longitudinal Analysis of Myopia andEmmetropizationRoss F. Collery1, Kerry N. Veth1, Adam M. Dubis1, Joseph Carroll1,2,3, Brian A. Link1*
1Department of Cell Biology, Neurobiology and Anatomy, Medical College of Wisconsin, Milwaukee, Wisconsin, United States of America, 2Department of
Ophthalmology, Medical College of Wisconsin, Milwaukee, Wisconsin, United States of America, 3Department of Biophysics, Medical College of Wisconsin, Milwaukee,
Wisconsin, United States of America
Abstract
Refractive errors in vision can be caused by aberrant axial length of the eye, irregular corneal shape, or lens abnormalities.Causes of eye length overgrowth include multiple genetic loci, and visual parameters. We evaluate zebrafish as a potentialanimal model for studies of the genetic, cellular, and signaling basis of emmetropization and myopia. Axial length and othereye dimensions of zebrafish were measured using spectral domain-optical coherence tomography (SD-OCT). We used ocularlens and body metrics to normalize and compare eye size and relative refractive error (difference between observed retinalradial length and controls) in wild-type and lrp2 zebrafish. Zebrafish were dark-reared to assess effects of visual deprivationon eye size. Two relative measurements, ocular axial length to body length and axial length to lens diameter, were found toaccurately normalize comparisons of eye sizes between different sized fish (R2 = 0.9548, R2 = 0.9921). Ray-traced focallengths of wild-type zebrafish lenses were equal to their retinal radii, while lrp2 eyes had longer retinal radii than focallengths. Both genetic mutation (lrp2) and environmental manipulation (dark-rearing) caused elongated eye axes. lrp2mutants had relative refractive errors of 20.327 compared to wild-types, and dark-reared wild-type fish had relativerefractive errors of 20.132 compared to light-reared siblings. Therefore, zebrafish eye anatomy (axial length, lens radius,retinal radius) can be rapidly and accurately measured by SD-OCT, facilitating longitudinal studies of regulated eye growthand emmetropization. Specifically, genes homologous to human myopia candidates may be modified, inactivated oroverexpressed in zebrafish, and myopia-sensitizing conditions used to probe gene-environment interactions. Our studiesprovide foundation for such investigations into genetic contributions that control eye size and impact refractive errors.
Citation: Collery RF, Veth KN, Dubis AM, Carroll J, Link BA (2014) Rapid, Accurate, and Non-Invasive Measurement of Zebrafish Axial Length and Other EyeDimensions Using SD-OCT Allows Longitudinal Analysis of Myopia and Emmetropization. PLoS ONE 9(10): e110699. doi:10.1371/journal.pone.0110699
Editor: Michael G. Anderson, University of Iowa, United States of America
Received June 12, 2014; Accepted September 19, 2014; Published October 21, 2014
Copyright: � 2014 Collery et al. This is an open-access article distributed under the terms of the Creative Commons Attribution License, which permitsunrestricted use, distribution, and reproduction in any medium, provided the original author and source are credited.
Data Availability: The authors confirm that all data underlying the findings are fully available without restriction. All relevant data are within the paper and itsSupporting Information files.
Funding: This study was supported by Research Training Program in Vision Sciences Grants T32EYE014537 (KNV; AMD)(https://www.nei.nih.gov/funding/neifm.asp); National Institutes of Health Grant R01EY16060 (BAL)(https://www.nei.nih.gov/funding/neifm.asp); and National Eye Institute Core Facilities GrantP30EY001931 (https://www.nei.nih.gov/funding/neifm.asp), and an unrestricted Departmental grant from Research to Prevent Blindness (JC)(https://www.rpbusa.org/rpb/grants/grants/). The funders had no role in study design, data collection and analysis, decision to publish, or preparation of the manuscript.
Competing Interests: The authors have declared that no competing interests exist.
likely reflecting the variability in lrp2 eye size. We cannot,
however, rule out the possibility that lrp2 mutants have different
eye axis:body length or eye axis:lens diameter relationships that
may contribute to the lower coefficients of determination.
Zebrafish lens size is correlated with retinal radius with alinear constant, which can be used to calculate relativerefractive error in experimental groupsWe plotted the lens radius against retinal radius of 240 zebrafish
eyes at timepoints throughout the lifespan of the fish. This allowed
us to determine a general constant, or coefficient, relating lens
radius to retinal radius (lens-retinal radius coefficient), also known
as Matthiessen’s ratio [54,55] (Figure 4 A). Using this coefficient,
we defined the expected retinal radius for wild-type fish with
respect to lens size, and compared retinal radii for other fish with
potential myopia or hyperopia to these values. We refer to this
comparison as relative refractive error. We found that lens radius
6 2.324 equaled the calculated retinal radius based on the
Figure 1. SD-OCT imaging stage and B-scan examples. A. Imaging stage for Bioptigen Envisu 2200 with zebrafish immersion cuvette. B.Zebrafish immobilized using a strip of modeling clay to prevent movement or floating during immersion. C. Schematic showing highly reflectivestructures of the zebrafish eye traced over 1 mpf B-scan; l, lens radius; r, retinal radius. D. 15 dpf; E. 1 mpf; F. 2 mpf. Scale bars: 300 mm. D9, E9, F9: asabove with aspect ratio corrected to 1:1. As zebrafish eyes age and increase in size, the reflected signal from the retina is reduced, making laminationless visible, though the strongly hyper-reflective RPE can still be observed.doi:10.1371/journal.pone.0110699.g001
Zebrafish and Myopia
PLOS ONE | www.plosone.org 4 October 2014 | Volume 9 | Issue 10 | e110699
equation of the best fit linear regression, with a strong coefficient of
determination (R2 = 0.9845, p,0.0001). This number is nearly
identical to the coefficient determined for goldfish [56]. Calculat-
ing the general lens-retinal radius coefficient for all lrp2 eyes
measured gave a value of 4.140, with a lower coefficient of
determination (R2= 0.8010, p,0.0001), showing that lrp2 retinal
radii are significantly greater than the values predicted from lens
measurement. The lower coefficient of determination likely reflects
the variability observed in lrp2 eye size. At 1 month, lrp2 zebrafish
have greater negative relative refractive error than wild-type (2
0.175 vs 0, respectively), and as they age, their relative refractive
errors continue to become greater than wild-type controls (20.244
vs 0.037 at 3 mpf, 20.327 vs 0.058 at 1 ypf) (Figure 4 B). To
define normal axial length variability, individual wild-type
zebrafish used to derive the relative refractive error showed a
range of relative refractive errors from 0.06 to 20.07 (Figure 4 B,
gray bar). Applying these normalization and relative refractive
error calculations to sample wild-type and lrp2 mutants at 2 mpf
demonstrates that variability in mutant populations requires
accurate measurements to assess myopic phenotypes (Figure 3
C, D).
Optical ray-tracing shows wild-type zebrafish eyes havematching focal lengths and retinal radii, while retinalradii exceed focal lengths in myopic lrp2 zebrafishTo verify that the focal length of the zebrafish lens correlated
with the retinal radius, or distance from the center of the lens to
the RPE measured using SD-OCT, we carried out ray-tracing on
wild-type and lrp2 mutant lenses to calibrate medial dimension
measurements (Figure 4 C). Comparing measurements of ten
wild-type lenses, the average distance of the RPE from the center
of the lens as measured by SD-OCT was 0.995 mm60.037 mm,
while the ray-traced focal length was 1.080 mm60.083 mm. The
retinal radius calculated from lens radius and lens-retinal radius
coefficient was 1.157 mm60.043 mm. There were no significant
differences in these values, validating OCT methods for calculat-
ing retinal radii. Importantly, the focal length in wild-type fish
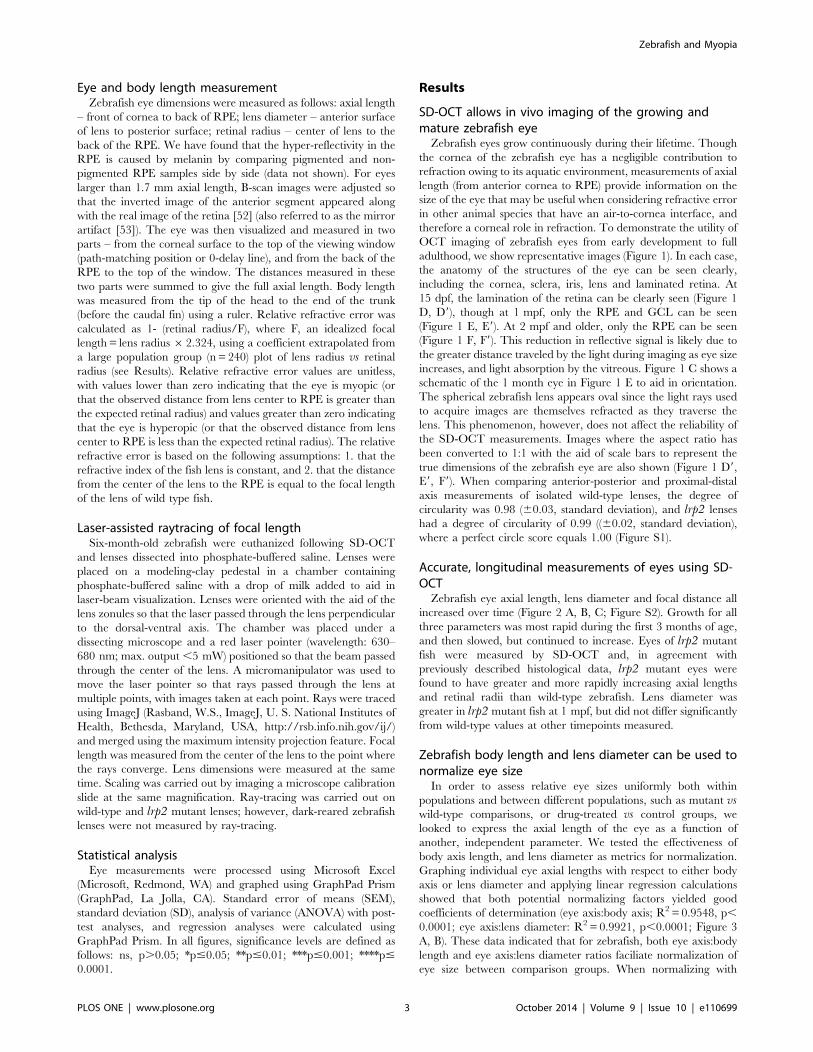
Figure 2. Zebrafish eye metrics graphed with respect to time. A. Eye axial length measured by SD-OCT increases during the lifetime of thegrowing fish. lrp2 zebrafish eyes are larger than wild-type at all timepoints measured. B. Lens diameter increases as the fish grows. lrp2 zebrafishlenses are larger than wild-type at 1 month, but are not significantly larger at 3 months or 1 year. C. Retinal radius increases consistently as the fishage, and lrp2 retinal radii are greater than wild-type at all timepoints measured. Error bars show SD.doi:10.1371/journal.pone.0110699.g002
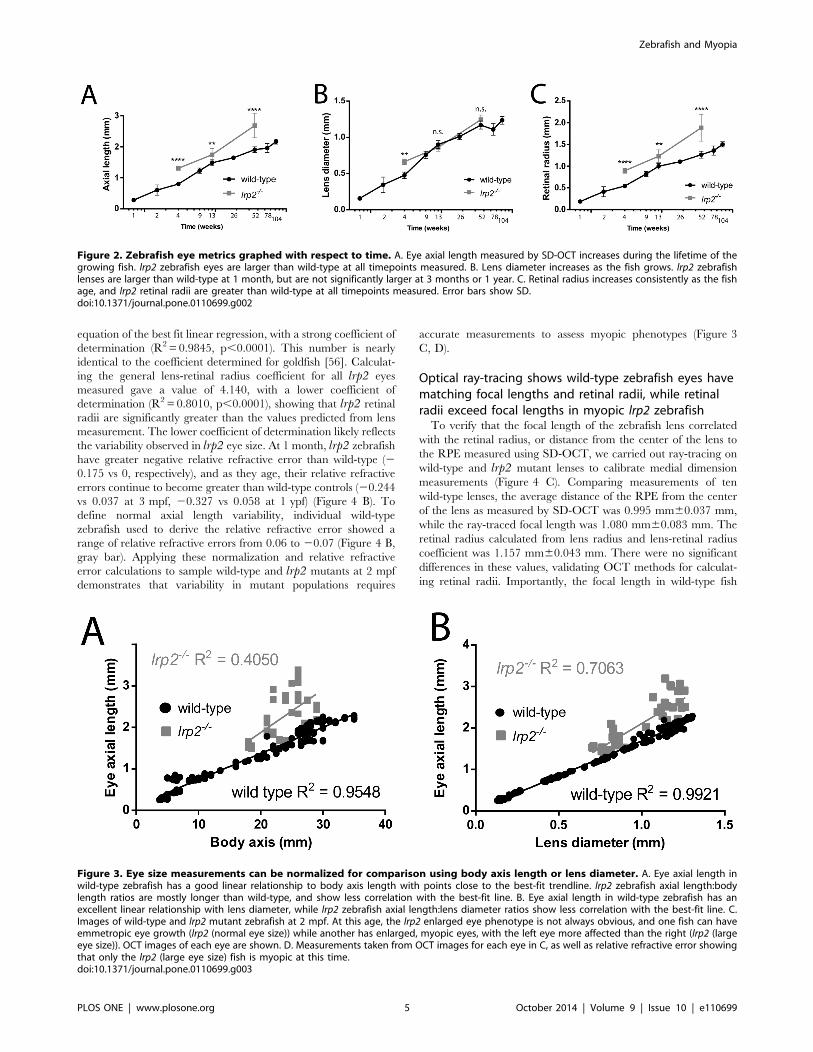
Figure 3. Eye size measurements can be normalized for comparison using body axis length or lens diameter. A. Eye axial length inwild-type zebrafish has a good linear relationship to body axis length with points close to the best-fit trendline. lrp2 zebrafish axial length:bodylength ratios are mostly longer than wild-type, and show less correlation with the best-fit line. B. Eye axial length in wild-type zebrafish has anexcellent linear relationship with lens diameter, while lrp2 zebrafish axial length:lens diameter ratios show less correlation with the best-fit line. C.Images of wild-type and lrp2 mutant zebrafish at 2 mpf. At this age, the lrp2 enlarged eye phenotype is not always obvious, and one fish can haveemmetropic eye growth (lrp2 (normal eye size)) while another has enlarged, myopic eyes, with the left eye more affected than the right (lrp2 (largeeye size)). OCT images of each eye are shown. D. Measurements taken from OCT images for each eye in C, as well as relative refractive error showingthat only the lrp2 (large eye size) fish is myopic at this time.doi:10.1371/journal.pone.0110699.g003
Zebrafish and Myopia
PLOS ONE | www.plosone.org 5 October 2014 | Volume 9 | Issue 10 | e110699
measured directly by lens refraction matches the retinal radius,
strongly suggesting wild-type fish are emmetropic, and confirming
retinal radius as a good proxy for focal length (Table 1). There was
no difference between the ray-traced focal length and expected
retinal radii (lens-radius derived) for ten lrp2 fish of the same age.
However, when comparing focal length, or expected retinal radius,
to the observed position of the RPE from the lens center as
measured by SD-OCT, lrp2 fish were found to be myopic (SD-
OCT measured retinal radius = 1.550 mm60.437 mm; raytraced
focal length = 1.228 mm60.050 mm; expected retinal radius from
lens radius and lens-retinal radius coeffi-
cient = 1.144 mm60.057 mm).
We also attempted to directly measure in vivo the degree of
refractive error in wild-type zebrafish using retinoscopy. To do so,
adult zebrafish were anesthesized and either placed out of water or
immobilized in water and examined using a retinoscope.
However, using a standard apparatus (standard streak retinoscope,
Welch Allyn, NY), retinoscopy was not possible in zebrafish due to
the small eye size and fixed pupil diameter.
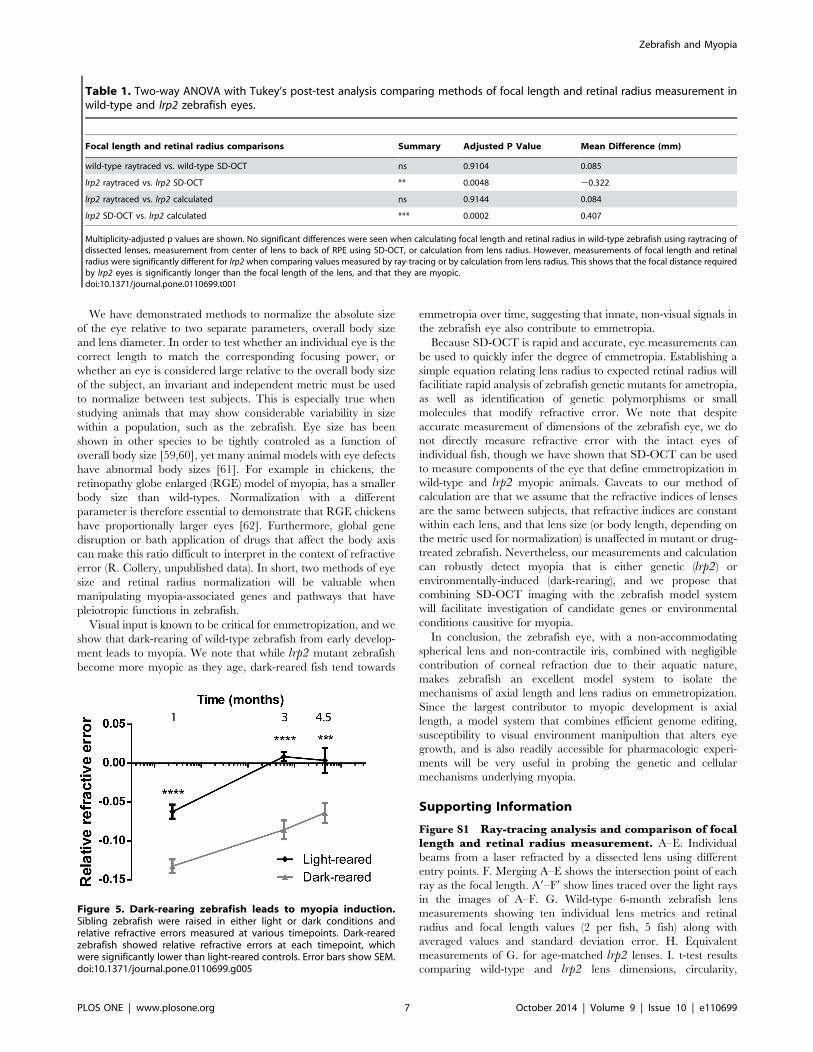
Zebrafish respond to dark-rearing by becoming myopicAmetropia has been induced in several animal models by dark-
rearing, where the lack of light deprives animals of an
emmetropization input signal [57,58]. At 1 month, dark-reared
zebrafish were significantly more myopic than light-reared siblings
(relative refractive errors of 20.062 for light-reared vs 20.132 for
dark-reared) (Figure 5). Three month and 4.5 month dark-reared
zebrafish were also significantly more myopic than their light-
reared siblings (0.008 for light-reared vs 20.086 for dark-reared at
3 mpf, 0.004 for light-reared vs 20.064 for dark-reared at
4.5 mpf). Changes in retinal radius were caused by axial length
elongation, as the lens diameters were only significantly different
between age-matched light- and dark-reared zebrafish at 1 month
(Table S1). Axial lengths and retinal radii that have not been
normalized should be viewed with caution as they do not take the
size of the animal into account. Nonetheless, at 1 month and 4.5
months, axial lengths and retinal radii are significantly longer in
dark-reared fish than light-reared controls.
Discussion
This study shows that SD-OCT can be used to rapidly and
accurately measure the size of the zebrafish eye, lens and retinal
radius during both emmetropic wild-type and myopic lrp2 eye
growth. Using SD-OCT, high quality images can be non-
invasively acquired of developing and mature eyes and used to
generate a representation of the interior of the eye. We show that
the zebrafish eye, lens, and retinal radius grow rapidly during
larval and juvenile development, then grow more slowly. By
comparing lens dimensions and refractive properties in vivo and
ex vivo, we show that SD-OCT measurements can be used to
measure retinal radius, which correlates with focal length in wild-
type fish, and to infer refractive error in the zebrafish eye.
Comparing ray-traced focal length and retinal radius measured by
SD-OCT showed no significant difference within a wild-type
sample group. However, lrp2 fish were found to have retinal radii
significantly longer than predicted by the refractive power of their
lenses, and are therefore myopic.
Figure 4. SD-OCT used to measure the relationship betweenzebrafish retinal radius and lens radius, or relative refractiveerror. A. Wild-type zebrafish retinal radius shows a very good linearrelationship with lens radius, and the best-fit line can be used tocalculate the ratio coefficient which predicts correct retinal radius foreach eye from the measured lens radius. lrp2 retinal radius: lens radiusratios have poorer linear relationships and have a higher ratiocoefficient predicting that each lrp2 eye will have a longer requiredfocal distance than wild-type. B. Relative refractive error compares thedifference between calculated retinal radius based on lens radiusmeasurements and observed retinal radius (center of lens to back ofRPE). Relative refractive errors are made from a general equation, andindividual wild-type sample groups are shown at each timepoint todemonstrate the variability seen when using this equation (grey barshows lowest and highest average values). lrp2 zebrafish are moremyopic than wild-types and consistently become more myopic as theyage. Error bars show SD. C. Example of laser-assisted ray-tracing
through a dissected lens to calculate focal length. Shown are individualimages (i, iii), or composites (ii, iv) to indicate the light-ray intersectionpoint either without line tracing (i, ii), and with lines tracing (iii, iv) to aidvisualization.doi:10.1371/journal.pone.0110699.g004
Zebrafish and Myopia
PLOS ONE | www.plosone.org 6 October 2014 | Volume 9 | Issue 10 | e110699
We have demonstrated methods to normalize the absolute size
of the eye relative to two separate parameters, overall body size
and lens diameter. In order to test whether an individual eye is the
correct length to match the corresponding focusing power, or
whether an eye is considered large relative to the overall body size
of the subject, an invariant and independent metric must be used
to normalize between test subjects. This is especially true when
studying animals that may show considerable variability in size
within a population, such as the zebrafish. Eye size has been
shown in other species to be tightly controled as a function of
overall body size [59,60], yet many animal models with eye defects
have abnormal body sizes [61]. For example in chickens, the
retinopathy globe enlarged (RGE) model of myopia, has a smaller
body size than wild-types. Normalization with a different
parameter is therefore essential to demonstrate that RGE chickens
have proportionally larger eyes [62]. Furthermore, global gene
disruption or bath application of drugs that affect the body axis
can make this ratio difficult to interpret in the context of refractive
error (R. Collery, unpublished data). In short, two methods of eye
size and retinal radius normalization will be valuable when
manipulating myopia-associated genes and pathways that have
pleiotropic functions in zebrafish.
Visual input is known to be critical for emmetropization, and we
show that dark-rearing of wild-type zebrafish from early develop-
ment leads to myopia. We note that while lrp2 mutant zebrafish
become more myopic as they age, dark-reared fish tend towards
emmetropia over time, suggesting that innate, non-visual signals in
the zebrafish eye also contribute to emmetropia.
Because SD-OCT is rapid and accurate, eye measurements can
be used to quickly infer the degree of emmetropia. Establishing a
simple equation relating lens radius to expected retinal radius will
facilitiate rapid analysis of zebrafish genetic mutants for ametropia,
as well as identification of genetic polymorphisms or small
molecules that modify refractive error. We note that despite
accurate measurement of dimensions of the zebrafish eye, we do
not directly measure refractive error with the intact eyes of
individual fish, though we have shown that SD-OCT can be used
to measure components of the eye that define emmetropization in
wild-type and lrp2 myopic animals. Caveats to our method of
calculation are that we assume that the refractive indices of lenses
are the same between subjects, that refractive indices are constant
within each lens, and that lens size (or body length, depending on
the metric used for normalization) is unaffected in mutant or drug-
treated zebrafish. Nevertheless, our measurements and calculation
can robustly detect myopia that is either genetic (lrp2) or
environmentally-induced (dark-rearing), and we propose that
combining SD-OCT imaging with the zebrafish model system
will facilitate investigation of candidate genes or environmental
conditions causitive for myopia.
In conclusion, the zebrafish eye, with a non-accommodating
spherical lens and non-contractile iris, combined with negligible
contribution of corneal refraction due to their aquatic nature,
makes zebrafish an excellent model system to isolate the
mechanisms of axial length and lens radius on emmetropization.
Since the largest contributor to myopic development is axial
length, a model system that combines efficient genome editing,
susceptibility to visual environment manipultion that alters eye
growth, and is also readily accessible for pharmacologic experi-
ments will be very useful in probing the genetic and cellular
mechanisms underlying myopia.
Supporting Information
Figure S1 Ray-tracing analysis and comparison of focallength and retinal radius measurement. A–E. Individual
beams from a laser refracted by a dissected lens using different
entry points. F. Merging A–E shows the intersection point of each
ray as the focal length. A9–F9 show lines traced over the light rays
in the images of A–F. G. Wild-type 6-month zebrafish lens
measurements showing ten individual lens metrics and retinal
radius and focal length values (2 per fish, 5 fish) along with
averaged values and standard deviation error. H. Equivalent
measurements of G. for age-matched lrp2 lenses. I. t-test results
comparing wild-type and lrp2 lens dimensions, circularity,
Table 1. Two-way ANOVA with Tukey’s post-test analysis comparing methods of focal length and retinal radius measurement inwild-type and lrp2 zebrafish eyes.
Focal length and retinal radius comparisons Summary Adjusted P Value Mean Difference (mm)
wild-type raytraced vs. wild-type SD-OCT ns 0.9104 0.085
lrp2 raytraced vs. lrp2 SD-OCT ** 0.0048 20.322
lrp2 raytraced vs. lrp2 calculated ns 0.9144 0.084
lrp2 SD-OCT vs. lrp2 calculated *** 0.0002 0.407
Multiplicity-adjusted p values are shown. No significant differences were seen when calculating focal length and retinal radius in wild-type zebrafish using raytracing ofdissected lenses, measurement from center of lens to back of RPE using SD-OCT, or calculation from lens radius. However, measurements of focal length and retinalradius were significantly different for lrp2 when comparing values measured by ray-tracing or by calculation from lens radius. This shows that the focal distance requiredby lrp2 eyes is significantly longer than the focal length of the lens, and that they are myopic.doi:10.1371/journal.pone.0110699.t001
Figure 5. Dark-rearing zebrafish leads to myopia induction.Sibling zebrafish were raised in either light or dark conditions andrelative refractive errors measured at various timepoints. Dark-rearedzebrafish showed relative refractive errors at each timepoint, whichwere significantly lower than light-reared controls. Error bars show SEM.doi:10.1371/journal.pone.0110699.g005
Zebrafish and Myopia
PLOS ONE | www.plosone.org 7 October 2014 | Volume 9 | Issue 10 | e110699
software refractive index correction factor and raytraced focal
length. J. Comparison of methods of retinal radius measurement
and prediction, using raytracing of dissected lenses, measurement
from center of lens to back of RPE using SD-OCT, and
calculation from lens radius for ten individual wild-type 6-month
zebrafish eyes (2 per fish, 5 fish). K. as J, for age-matched lrp2eyes. L. t-test results comparing wild-type and lrp2 lens and retinal
radius and focal length measurements. Statistical analysis is shown
in Table 1.
(TIF)
Figure S2 Zebrafish eye and body parameters graphedwith respect to time using a linear X-axis for time. A. Eyeaxial length measured by SD-OCT increases during the lifetime of
the growing wild-type fish in two phases. The first is rapid (labeled
I, dark grey box, slope = 0.0132660.0003736 (1/slope = 75)) and
the second is slower (labeled II, light grey box, slo-
pe = 0.000958464.517e-005 (1/slope = 1043)). B. Lens diameter
increases as the fish grows in two phases. The first is rapid (labeled
I, dark grey box, slope= 0.160260.009701 (1/slope = 120)) and
the second is slower (labeled II, light grey box, slo-
pe = 0.000433363.207e-005 (1/slope = 2308)). C. Retinal radius
increases as the fish grows in two phases. The first is rapid (labeled
I, dark grey box, slope= 0.00886360.0002589 (1/slope = 113))
and the second is slower (labeled II, light grey box, slo-
pe = 0.000727963.085e-005 (1/slope = 1374)).
(TIF)
Table S1 A. Comparison of axial length, lens radius and retinal
radius at 1 month, 3 months and 4.5 months between light-reared
and dark-reared zebrafish. Values show average measurements 6
SD. B. t-test results comparing axial length, lens radius and retinal
radius for significant differences.
(TIF)
Acknowledgments
The authors wish to thank Jonathan Skarie for assistance with retinoscopy.
We thank Michael Cliff, William Hudzinski, Thomas Waeltz, Joseph
Hudzinski, Brandon Mikulski and Courtney Mendini for excellent
zebrafish husbandry, and Jonathan Bostrom and Anitha Ponnuswami for
assistance with molecular biology.
Author Contributions
Conceived and designed the experiments: RFC BAL. Performed the
experiments: RFC. Analyzed the data: RFC. Contributed reagents/
materials/analysis tools: RFC. Contributed to the writing of the
manuscript: RFC BAL. Provided critical revision of the manuscript:
KNV AMD JC BAL.
References
1. Atchison DA, Jones CE, Schmid KL, Pritchard N, Pope JM, et al. (2004) Eye
shape in emmetropia and myopia. Invest Ophthalmol Vis Sci 45: 3380–3386.
doi:10.1167/iovs.04-0292.
2. Pizzarello L, Abiose A, Ffytche T, Duerksen R, Thulasiraj R, et al. (2004)
VISION 2020: The Right to Sight: a global initiative to eliminate avoidable
37. Kwan KM, Fujimoto E, Grabher C, Mangum BD, Hardy ME, et al. (2007) TheTol2kit: a multisite gateway-based construction kit for Tol2 transposon
transgenesis constructs. Dev Dyn 236: 3088–3099.38. Bedell VM, Wang Y, Campbell JM, Poshusta TL, Starker CG, et al. (2012) In
vivo genome editing using a high-efficiency TALEN system. Nature 491: 114–118. doi:10.1038/nature11537.
39. Hwang WY, Fu Y, Reyon D, Maeder ML, Tsai SQ, et al. (2013) Efficient
genome editing in zebrafish using a CRISPR-Cas system. Nat Biotechnol 31:227–229. doi:10.1038/nbt.2501.
40. Yeh LK, Liu CY, Kao WW, Huang CJ, Hu FR, et al. (2010) Knockdown ofzebrafish lumican gene (zlum) causes scleral thinning and increased size of scleral
coats. J Biol Chem 285: 28141–28155.
41. Kennedy BN, Alvarez Y, Brockerhoff SE, Stearns GW, Sapetto-Rebow B, et al.(2007) Identification of a zebrafish cone photoreceptor-specific promoter and
genetic rescue of achromatopsia in the nof mutant. Invest Ophthalmol Vis Sci48: 522–529.
42. Kennedy BN, Vihtelic TS, Checkley L, Vaughan KT, Hyde DR (2001) Isolationof a zebrafish rod opsin promoter to generate a transgenic zebrafish line
expressing enhanced green fluorescent protein in rod photoreceptors. J Biol
Chem 276: 14037-43 Epub 2001 Jan 18.43. Bernardos RL, Raymond PA (2006) GFAP transgenic zebrafish. Gene Expr
Patterns 6: 1007–1013.44. Shields CR, Klooster J, Claassen Y, Ul-Hussain M, Zoidl G, et al. (2007) Retinal
horizontal cell-specific promoter activity and protein expression of zebrafish
47. Kay JN, Link BA, Baier H (2005) Staggered cell-intrinsic timing of ath5expression underlies the wave of ganglion cell neurogenesis in the zebrafish
retina. Dev Camb Engl 132: 2573–2585. doi:10.1242/dev.01831.
48. Kurita R, Sagara H, Aoki Y, Link BA, Arai K, et al. (2003) Suppression of lens
growth by alphaA-crystallin promoter-driven expression of diphtheria toxinresults in disruption of retinal cell organization in zebrafish. Dev Biol 255: 113–
127.
49. Westerfield M (2000) The zebrafish book. A guide for the laboratory use ofzebrafish (Danio rerio). 4th ed. University of Oregon, Eugene, OR 97403.
50. Stujenske JM, Dowling JE, Emran F (2011) The Bugeye Mutant ZebrafishExhibits Visual Deficits that Arise with the Onset of an Enlarged Eye Phenotype.
Invest Ophthalmol Vis Sci 52: 4200–4207.
51. Howell GR, Soto I, Zhu X, Ryan M, Macalinao DG, et al. (2012) Radiationtreatment inhibits monocyte entry into the optic nerve head and prevents
neuronal damage in a mouse model of glaucoma. J Clin Invest 122: 1246–1261.doi:10.1172/JCI61135.
52. Park H na, Qazi Y, Tan C, Jabbar SB, Cao Y, et al. (2012) Assessment of AxialLength Measurements in Mouse Eyes. Optom Vis Sci 89: 296–303.
doi:10.1097/OPX.0b013e31824529e5.
53. Ho J, Castro DPE, Castro LC, Chen Y, Liu J, et al. (2010) Clinical Assessment ofMirror Artifacts in Spectral-Domain Optical Coherence Tomography. Invest
Ophthalmol Vis Sci 51: 3714–3720. doi:10.1167/iovs.09-4057.54. Matthiessen PL (1882) Ueber die Beziehungen, welche zwischen dem
Brechungsindex des Kerncentrums der Krystalllinse und den Dimensionen
des Auges bestehen. Arch Fur Gesamte Physiol Menschen Tiere 27: 510–523.doi:10.1007/BF01802978.
55. Shand J, Døving KB, Collin SP (1999) Optics of the developing fish eye:comparisons of Matthiessen’s ratio and the focal length of the lens in the black
bream Acanthopagrus butcheri (Sparidae, Teleostei). Vision Res 39: 1071–1078.56. Charman WN, Tucker J (1973) The optical system of the goldfish eye. Vision
Res 13: 1–8.
57. Norton TT, Amedo AO, Siegwart JT Jr (2006) Darkness causes myopia invisually experienced tree shrews. Invest Ophthalmol Vis Sci 47: 4700–4707.
doi:10.1167/iovs.05-1641.58. Tkatchenko TV, Shen Y, Braun RD, Bawa G, Kumar P, et al. (2013) Photopic
visual input is necessary for emmetropization in mice. Exp Eye Res.
doi:10.1016/j.exer.2013.06.025.59. Yin G, Wang YX, Zheng ZY, Yang H, Xu L, et al. (2012) Ocular axial length
and its associations in Chinese: the Beijing Eye Study. PloS One 7: e43172.doi:10.1371/journal.pone.0043172.
60. Prashar A, Hocking PM, Erichsen JT, Fan Q, Saw SM, et al. (2009) Commondeterminants of body size and eye size in chickens from an advanced intercross
line. Exp Eye Res 89: 42–48. doi:10.1016/j.exer.2009.02.008.
61. Pardue MT, Stone RA, Iuvone PM (2013) Investigating mechanisms of myopiain mice. Exp Eye Res 114: 96–105. doi:10.1016/j.exer.2012.12.014.
62. Ritchey ER, Zelinka C, Tang J, Liu J, Code KA, et al. (2012) Vision-guidedocular growth in a mutant chicken model with diminished visual acuity. Exp Eye
Res 102: 59–69. doi:10.1016/j.exer.2012.07.001.
Zebrafish and Myopia
PLOS ONE | www.plosone.org 9 October 2014 | Volume 9 | Issue 10 | e110699