70
Nr 1/2014 i Rapid Bio-methanation of Syngas by High Cell-density in Reverse Membrane Bioreactors Konstantinos Chandolias
Nr 1/2014 i
Rapid Bio-methanation of Syngas by
High Cell-density in Reverse
Membrane Bioreactors
Konstantinos Chandolias
Nr 1/2014 ii
Rapid Bio-methanation of Syngas by High Cell Density in Reverse Membrane
Bioreactors
Konstantinos Chandolias ([email protected])
Master thesis Project
Subject Category: Industrial Biotechnology
University of Borås
School of Engineering
SE-501 90, BORÅS
Telephone +46 033 435 4640
Examiner: Professor Mohammad J. Taherzadeh
Supervisor: SupansaYoungsukkasem, PhD
Supervisor, address: University of Borås, Allégatan 1
501 90, Borås
The cover page figure was adapted from Gutierrez (2012) & Gordons (2013).
Nr 1/2014 iii
Acknowledgements
First of all, I would like to express my gratitude to Professor Mohammad Taherzadeh for his
guidelines and trust as well as my supervisor Dr. Supansa Youngsukkasem, who has been
very supportive, committed and an excellent teacher. Moreover, I would like to thank the
Biotechnology and Bioethanol group for their warm welcome and for assisting me in the lab
and the staff of the School of Engineering for their professionalism, punctuality and accurate
work. Last but not least, I thank my family for their love and support and especially Magda
for her love, understanding and for filling me with positive energy.
Nr 1/2014 iv
Abstract
Syngas fermentation via gasification is a two-stage process, which contains gasification of
feedstock into syngas and syngas bio-methanation by anaerobic microorganisms. This project
is a study on syngas fermentation. The gasification feedstock can be difficult-to-degrade solid
waste so; waste volumes are reduced while green energy is produced. The main target of this
thesis was to study novel configurations of reverse membrane bioreactors (RMB) in order to
retain microbial cells inside the digesters and thereafter increase methane production. In the
first experiment, microbial cells encased in PVDF sachets were proved to perform efficiently
in batch mode in comparison to free cells at optimum temperature, 55 oC. Moreover, encased
cells in co-digestion of syngas and organic waste exhibited higher methane amounts
compared to pure syngas treatment. Encased cells were then tested in thermophilic semi-
continuous process and showed better performance compared to the free cell reactor. The
RMB retained successfully the encased cells during the 154 days of the experiment, while
free cells were washed-out. The highest amounts of methane from RMB and the free cell
reactor were produced during the 126th
- 130th
day (6 and 1.5 mmol/day, respectively). In the
last experiment, a RMB containing 13 membrane layers of enclosed cells was studied and
compared to a conventional reactor of free cells. The RMB performed successfully in syngas
bio-methanation under semi-continuous conditions during 49 days. The highest methane
amount produced was 10 mmol/day in both RMB and free cell reactor.
Keywords: syngas fermentation, reverse membrane bioreactor, bio-methanation, high cell
density.
Nr 1/2014 v
Publications from this thesis
1. Youngsukkasem S., Chandolias. K., Taherzadeh M. J. (2014a). Rapid Bio-
methanation of Syngas in a Reverse Membrane Bioreactor: Membrane encased
Microorganisms. Bioresource Technology. [Submitted].
2. Youngsukkasem S., Chandolias. K., Taherzadeh M. J. (2014b). Syngas Bio-
methanation in a Reverse Membrane Bioreactor. Efficiency of Moving-membrane-
sachets (MMS) in a Continuous Fermentation Process. Membranes. [Manuscript in
progress].
3. Chandolias K., Youngsukkasem S., Taherzadeh M.J. (2014). Biomethane Generation
via Syngas Fermentation in a Multi-layer Reverse Membrane Bioreactor. Bioresource
Technology. [Manuscript in progress].
Nr 1/2014 vi
Contents
Chapter 1: Introduction ........................................................................................................... 1
Chapter 2: Background ........................................................................................................... 3
2.1 Feedstock for renewable energy production .................................................................... 3
2.2 Biogas ............................................................................................................................... 3
2.3 Feedstock conversion routes into bio-methane ................................................................ 4
2.3.1 Syngas ....................................................................................................................... 5
2.3.2 Thermochemical process – syngas production.......................................................... 5
2.3.3 Biochemical conversion and microbiology ............................................................... 6
2.4 Membrane bioreactors ...................................................................................................... 9
2.4.1 Membrane fundamentals ........................................................................................... 9
2.4.2 Polyvinylidene fluoride (PVDF) membrane ........................................................... 11
2.4.3 Membrane bioreactors and syngas fermentation ..................................................... 11
2.5 Current research on syngas fermentation ....................................................................... 13
2.5.1 Advantages of syngas fermentation ........................................................................ 14
2.5.2 Ethics and social aspect ........................................................................................... 14
2.5.3 Challenges ............................................................................................................... 15
Chapter 3: Materials and methods ....................................................................................... 18
3.1 Materials ......................................................................................................................... 18
3.1.1 Anaerobic culture .................................................................................................... 18
3.1.2 Medium and nutrients.............................................................................................. 18
3.1.3 Equipment ............................................................................................................... 19
3.1.4 Synthetic Membranes .............................................................................................. 20
3.2 Methodology .................................................................................................................. 21
3.2.1 Preparation of the anaerobic culture ........................................................................ 21
3.2.2 Experiment 1: Investigation of a novel technique with encased methane-producing
microorganisms in PVDF membrane for syngas bio-methanation in batch and repeated
batch mode ....................................................................................................................... 22
3.2.3 Experiment 2: Investigation of the efficiency of PVDF membrane with encased
methane-producing microorganisms for syngas bio-methanation in semi-continuous
process. ............................................................................................................................. 25
3.2.4 Experiment 3: Investigation of the efficiency of a compact reverse membrane
bioreactor (RMB) for syngas bio-methanation in semi-continuous process. ................... 27
3.3 Data collection and calculations ..................................................................................... 29
3.3.1 Gas analysis process ................................................................................................ 29
3.3.2 Function of Gas chromatographer (GC) .................................................................. 30
Nr 1/2014 vii
Contents (continuation)
3.3.3 Calculation of gas amount (mmol) .......................................................................... 31
3.3.4 Analysis of VFA concentration ............................................................................... 31
Chapter 4: Results and discussion ........................................................................................ 34
4.1 Syngas bio-methanation by methane-producing cells enclosed in PVDF membranes in
batch and repeated batch conditions ..................................................................................... 34
4.1.1 The efficiency of encased cells compared to free cells at 35 oC and 55
oC in batch
conditions ......................................................................................................................... 35
4.1.2 Efficiency of encased cells in pure syngas fermentation and co-digestion (syngas
and organic waste) in repeated batch conditions. ............................................................. 36
4.1.3 Effect of different substrates on methane production by encased cells in repeated
batch conditions................................................................................................................ 39
4.1.4 pH values of experiment 1 ...................................................................................... 42
4.2 Performance of encased cells in a long term, semi-continuous bio-methanation process
.............................................................................................................................................. 43
4.3 Rapid syngas bio-methanation by a compact reverse membrane bioreactor (RMB) ..... 47
4.3.1 Reactor start up........................................................................................................ 48
4.3.2 Performance of RMB in semi-continuous mode of syngas bio-methanation process
.......................................................................................................................................... 48
Chapter 5: Conclusions and future work ............................................................................. 52
5.1.1 Experiment 1 ........................................................................................................... 52
5.1.2 Experiment 2 ........................................................................................................... 52
5.1.3 Experiment 3 ........................................................................................................... 53
5.2 Future work .................................................................................................................... 53
References ............................................................................................................................... 55
Nr 1/2014 viii
List of figures
Figure 1.1 Chart pie of the global solid waste composition…………………………………. 1
Figure 2.1 Schematic presentation of the main stages in anaerobic fermentation for biogas
production………………………………………………………………………... 7
Figure 2. 2 Acetate conversion into methane and carbon dioxide production by
Methanosaeta sp…………………………………………………………………. 9
Figure 2.3 Chemical structures of polyvinylidene fluoride, polyethersulfone,
polypropylene and polyamide 6 that are commonly used in membrane
technology……………………………………………………………………….. 11
Figure 2.4 Different configurations of membrane bioreactors with (a) submerged and (b)
external membrane………………………………………………………………. 12
Figure 2.5 Design of a RMB, encased microbial cells inside a membrane…………………. 12
12 Figure 2.6 Illustration of the combined gasification and fermentation process highlighting
the cell washout challenge……………………………………………………….. 16
Figure 3.1 Overall plan of experiment 1 in repeated-batch conditions presenting all the
experimental factors…………………………………………………………......
…………………………………………………………....... 23
Figure 3.2 The method of membrane pocket preparation…………………………………… 24
Figure 3.3 Sachets and batch reactors……………………………………………………….. 24
Figure 3.4 Overall plan of the semi-continuous system comparing the performance of
encased and free cells at 55 oC…………………………………………………... 26
Figure 3.5 Schematic diagram of the semi-continuous bio-methanation process performed
in experiment 2…………………………………………………………………... 26
Figure 3.6 Overall experimental plan of experiment 3……………………………………… 27
Figure 3.7 Parts of a multilayer reverse membrane bioreactor.………………………......... 28
Figure 3.8 Compartments of reverse membrane multilayer bioreactor. …………………… 28
Figure 3.9 Schematic illustration of multilayer RMB ……………………………………… 29
Figure 3.10 The method of gas sampling and gas analysing during bio-methanation process
using GC……………………………………………………………………….... 30
Figure 3.11 Schematic explanation of the GC operation and data analysis…………………. 30
Figure 3.12 The VFA analysis………………………………………………………………... 32
Figure 4.1 Membrane and free cell reactors on the first day of syngas bio-methanation…. 34
Figure 4.2 Comparison of the performance of encased and free cells at 35 and 55 oC,
during 9 days of syngas bio-methanation (batch conditions)…………………… 35
Figure 4.3 Reactors containing sachets with inoculum……………………………………… 37
Figure 4.4 Comparison of the performance of encased cells in syngas and syngas + organic
waste bio-methanation, at 35 and 55 oC, in repeated batch conditions………… 38
Nr 1/2014 ix
List of figures (continuation)
Figure 4.5 Comparison of the performance of encased cells with syngas, organic waste,
syngas + organic waste and no substrate (blank) bio-methanation, at 55 oC in
repeated batch conditions………………………………………………………... 40
Figure 4.6 Semi-condinuous membrane and free cell bioreactors………………………… 43
Figure 4.7 Comparison of the performance of encased and free cells at 55 oC in semi-
continuous bio-methanation process……………………………………………. 45
Figure 4.8 Total VFA concentration (a) and pH (b) values in encased cell and free cell
reactors, at 55 oC, in semi-continuous bio-methanation………………………. 46
Figure 4.9 Gas bubbles occurred during the performance of RMB in syngas bio-
methanation……………………………………………………………………… 48
Figure 4.10 Comparison of the performance of enclosed and free cells in semi- continuous
bio-methanation………………………………………………………………….. 50
Figure 4.11 Illustration of pH values in RMB and free cell reactor, in different time periods,
at 55 oC, in semi-continuous conditions……………………………………….... 51
Figure 5.1 Membranes with cracks in batch bioreactors…………………………………… 54
Figure 5.2 Cell sedimentation in free cell batch bioreactors ………………………………... 54
Nr 1/2014 x
List of tables
Table 2.1 Energy content of various fuels…………………………………………….. 4
Table 2.2 Various methanogens that consume syngas………………………………… 7
Table 2.3 Common polymers used in filtration processes…………………………….. 10
Table 3.1 Components and amounts of basal medium………………………………… 18
Table 3.2a Summarized list of the equipment…………………………………………. 19
Table3.2b Summarized list of the equipment (continuation)………………………...... 20
Table 3.3 Durapore® membrane filter properties and characteristics…………………. 21
Table 3.4 Experimental design of experiment 1……………………………………...... 22
Table 3.5 Experimental design of experiment 2……………………………………….. 25
Table 3.6 Methanol and VFA amounts detected during the VFA analysis……………. 32
Table 4.1 VFA concentration during bio-methanation by encased cells in repeated
batch process of pure syngas fermentation and co-digestion of syngas and
organic substances at different temperatures and retention
times…………………………………………………………………………. 39
Table 4.2 VFA concentration in MBR, at 55 oC, using as substrate: pure syngas,
syngas + organic waste, no substrate (blanks) and organic waste…………. 41
Table 4.3 The pH values in reactors with free cells at 35 and 55 oC, using as
substrates: pure syngas, organic waste, syngas + organic waste and no
substrate (blanks)…………………………………………………………….
42
Table 4.4 The pH values in reactors with encased cells at 35 and 55 oC, using as
substrates: pure syngas, organic waste, syngas + organic waste…………... 42
Table 4.5 Factors and parameters during the semi-continuous bio-methanation
process……………………………………………………………………….. 44
Table 4.6 Time period correlation with factors and parameters during the semi-
continuous bio-methanation process………………………………………... 49
Nr 1/2014 xi
List of abbreviations
BS
Basal medium
BTU
British thermal unit (1 BTU 1 KJ)
cal
Calorie
CSTR
Continuous stirred tank reactor
D
Dialysis
DM
Dry mass
FID
Flame ionization detector
GC
Gas chromatographer
GS
Gas separation
G
Centrifugal power
g
Gram
He
Helium (chemical element)
HFM
Hollow fibre membrane
J
Joule
Kg
kilo
L Litre
lb Libra
MBR Membrane bioreactor
MF Microfiltration
m3
Cubic meters
NF
nanofiltration
OLR
Organic loading rate
PE Polyethylene
PES Polyethersulphone
PP Polypropylene
PS Polysulphone
PTFE Polytetrafluoroethylene
PV Pervaporation
PVDF Polyvinylidene fluoride
RMB Reverse membrane bioreactor
RO Reverse osmosis
SNG Synthetic natural gas
TCD Thermal conductivity detector
TS Total solids
UF Ultra filtration
VFA Volatile fatty acid
VS Volatile solid
WGS Water gas-shift reaction
1
Chapter 1
Introduction
Modern world is deeply depended on the use of fossil fuels (coal, oil and natural gas). The
massive use of these fuels is unsustainable and results to the emission of dangerous
greenhouse gases into the atmosphere. Moreover, the reserves of fossil fuels cannot meet the
rising global energy demand. At the same time, oil prices are increasing, deranging the global
economy. So, there is an urgent need for alternative energy from renewable and eco-friendly
resources and in the last decades many new “green” technologies have been tested and some
of them have been commercialized. Biomass is abundant and renewable and it can be
converted into biofuels and partially substitute the traditional fuels. Solid waste consists of
vast quantities of biomass, which is rich in hydrocarbons.
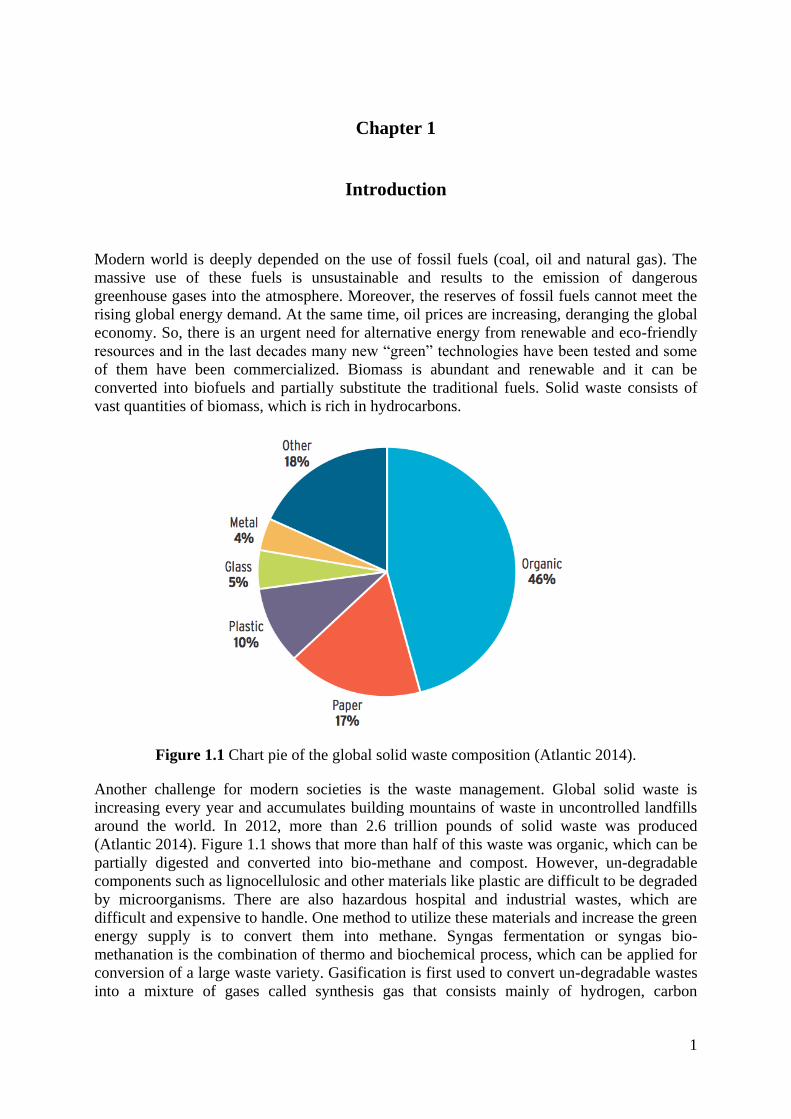
Figure 1.1 Chart pie of the global solid waste composition (Atlantic 2014).
Another challenge for modern societies is the waste management. Global solid waste is
increasing every year and accumulates building mountains of waste in uncontrolled landfills
around the world. In 2012, more than 2.6 trillion pounds of solid waste was produced
(Atlantic 2014). Figure 1.1 shows that more than half of this waste was organic, which can be
partially digested and converted into bio-methane and compost. However, un-degradable
components such as lignocellulosic and other materials like plastic are difficult to be degraded
by microorganisms. There are also hazardous hospital and industrial wastes, which are
difficult and expensive to handle. One method to utilize these materials and increase the green
energy supply is to convert them into methane. Syngas fermentation or syngas bio-
methanation is the combination of thermo and biochemical process, which can be applied for
conversion of a large waste variety. Gasification is first used to convert un-degradable wastes
into a mixture of gases called synthesis gas that consists mainly of hydrogen, carbon
2
monoxide and carbon dioxide. This process takes place at high temperatures (800 - 900 oC)
and the solids are converted into syngas and fly ash. Syngas can be used in a bioprocess called
syngas fermentation during which acetogenic microorganisms that follow the Wood-
Lungdahl pathway like Methanospirillumhungatii, act as biocatalysts by consuming syngas
and producing bio-methane and carbon dioxide. So, syngas fermentation via gasification is a
two-stage process that starts with the conversion of feedstock into syngas (gasification) and
ends with the bio-methanation of syngas in anaerobic digesters (fermentation). This thesis
was a study on the syngas fermentation process.
An important challenge that limits the methane productivity during syngas fermentation is the
low cell density in the bioreactors. Methane-producing microorganisms usually need long
retention time to grow and to perform efficiently, but in continuous processes, the cells are in
high risk of washing out of the reactors because of the continuous replacement of the old
digested sludge. Moreover, this group of microbial cells are very sensitive to the process
conditions so low cell population may cause inhibition on the performance of the remaining
cells. These issues lead to low methane productivity.
The objective of this thesis was to investigate the possibility of using novel techniques to
retain the microbial cells in the bioreactors during syngas bio-methanation. The high cell
density was achieved by the use of polymeric membranes while different techniques and
process configurations were studied.
3
Chapter 2
Background
2.1 Feedstock for renewable energy production
One of the most abundant renewable feedstock is biomass, which is widely used for biofuel
production. Biomass mainly consists of carbon, hydrogen and oxygen and it is biologically
generated by nature. The global biomass production is more than 146 billion tons per year
(mainly forest residues) (Lynn Osburn 1993). A big portion of this energy source is
lignocellulosic biomass, which consists of 55 - 65 % carbohydrates (the biggest pool of
carbohydrates on earth) (Zeng et al. 2013). According to some estimations, 40 - 60 % of
biomass like wood, straw, corn stover and switch grass is comprised by cellulose (Company
2013). Other types of biomass that can be used as feedstock for gasification are agricultural
residues and energy crops.
However, lignocellulosic biomass is difficult to be degraded by microorganisms and it
accumulates in nature causing methane emissions in the atmosphere. Forest residues such as
broken branches and leaves, form a thick “carpet” above the soil, killing every plant beneath.
Degradation is difficult because of the complex structure of lignocellulose (bonds between
cellulose, hemicellulose and lignin). Cellulose is a polymer of glucose molecules that bond in
linear rows. These rows form parallel bigger rows, which synthesize a solid crystalline
structure that gives the strength characteristic to lignocellulosic biomass (D'Alessio &
Paolucci 1989). Cellulose is formed by hexose blocks (e.g. glucose), while hemicellulose is a
polymer of pentose (xylose). Glucose and xylose can be fermented into biofuels, while most
microorganisms digest hexoses easier than pentoses. Lignin is a complex aromatic
hydrocarbon with very high energy content (Agblevor 2007). It is built by non-sugar
molecules and holds together the biomass molecules. It can be burned for energy generation
and converted into high-strength carbon fibres, which are used in modern aviation (Company
2013). A common biomass composition is: 38 - 50 % cellulose, 23 - 32 % hemicellulose and
15 - 25 % lignin (Agblevor 2007).
Waste that is difficult to degrade, like lignocellulosic biomass, can generate energy by
gasification, which is a preferable treatment for solid waste in many countries. An important
advantage of gasification is that it can convert a large variety of feedstock into biofuels. These
materials can be also mixed limiting the separation cost. Coal and coke from petroleum are
used in large gasification facilities around the globe. Other possible feedstocks are wood
pallets, wood chips as well as municipal solid waste, sewage, agricultural and industrial waste
(E4Tech 2009). Landfill solid waste containing plastic, paper and other mixed materials can
be also gasified into syngas. A Swedish company called Chemrec uses even black liquor
during the gasification process (Chemerc 2014).
2.2 Biogas
Biogas market is rising and it is expected to reach at $338.5 million by the year 2016 at the
compounded annual growth rate of 22 % (Research 2012). The production of biogas does not
demand high capital and operating costs and reduces the landfill areas (Future 2014). Biogas
4
consists mainly of methane, carbon dioxide, carbon monoxide and in smaller quantities
hydrogen sulphide, oxygen, alkanes, alkenes and particles.
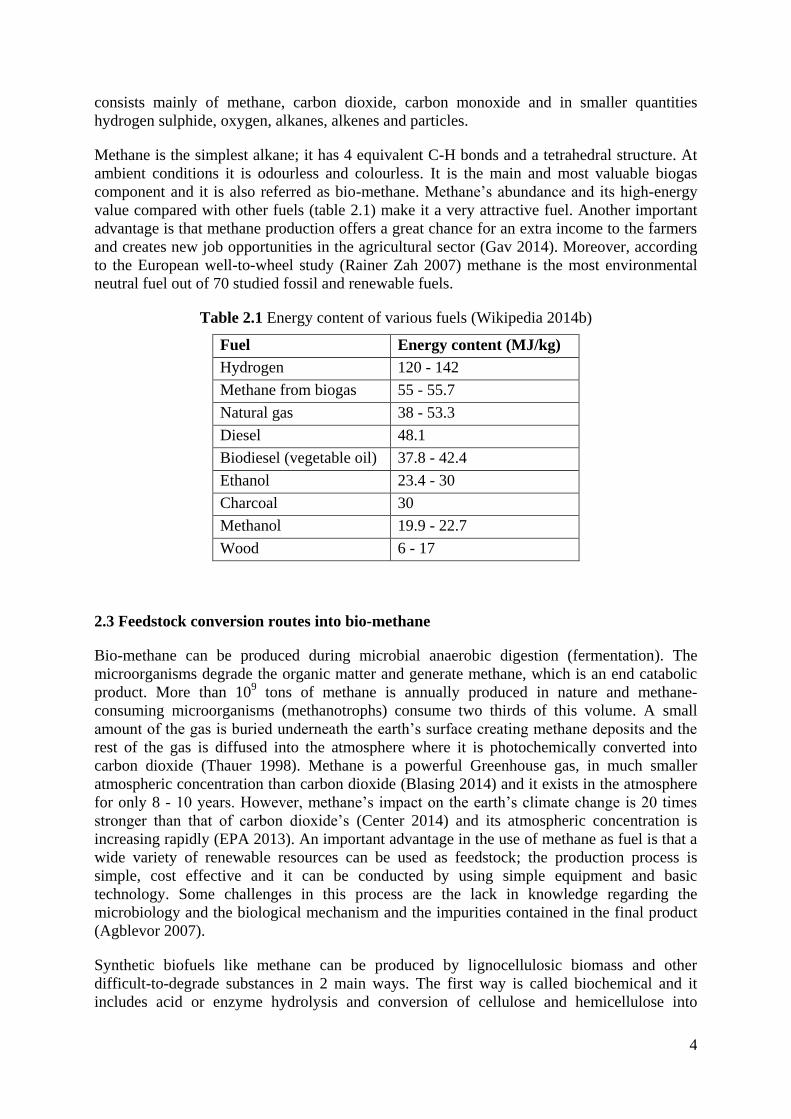
Methane is the simplest alkane; it has 4 equivalent C-H bonds and a tetrahedral structure. At
ambient conditions it is odourless and colourless. It is the main and most valuable biogas
component and it is also referred as bio-methane. Methane’s abundance and its high-energy
value compared with other fuels (table 2.1) make it a very attractive fuel. Another important
advantage is that methane production offers a great chance for an extra income to the farmers
and creates new job opportunities in the agricultural sector (Gav 2014). Moreover, according
to the European well-to-wheel study (Rainer Zah 2007) methane is the most environmental
neutral fuel out of 70 studied fossil and renewable fuels.
Table 2.1 Energy content of various fuels (Wikipedia 2014b)
Fuel Energy content (MJ/kg)
Hydrogen 120 - 142
Methane from biogas 55 - 55.7
Natural gas 38 - 53.3
Diesel 48.1
Biodiesel (vegetable oil) 37.8 - 42.4
Ethanol 23.4 - 30
Charcoal 30
Methanol 19.9 - 22.7
Wood 6 - 17
2.3 Feedstock conversion routes into bio-methane
Bio-methane can be produced during microbial anaerobic digestion (fermentation). The
microorganisms degrade the organic matter and generate methane, which is an end catabolic
product. More than 109 tons of methane is annually produced in nature and methane-
consuming microorganisms (methanotrophs) consume two thirds of this volume. A small
amount of the gas is buried underneath the earth’s surface creating methane deposits and the
rest of the gas is diffused into the atmosphere where it is photochemically converted into
carbon dioxide (Thauer 1998). Methane is a powerful Greenhouse gas, in much smaller
atmospheric concentration than carbon dioxide (Blasing 2014) and it exists in the atmosphere
for only 8 - 10 years. However, methane’s impact on the earth’s climate change is 20 times
stronger than that of carbon dioxide’s (Center 2014) and its atmospheric concentration is
increasing rapidly (EPA 2013). An important advantage in the use of methane as fuel is that a
wide variety of renewable resources can be used as feedstock; the production process is
simple, cost effective and it can be conducted by using simple equipment and basic
technology. Some challenges in this process are the lack in knowledge regarding the
microbiology and the biological mechanism and the impurities contained in the final product
(Agblevor 2007).
Synthetic biofuels like methane can be produced by lignocellulosic biomass and other
difficult-to-degrade substances in 2 main ways. The first way is called biochemical and it
includes acid or enzyme hydrolysis and conversion of cellulose and hemicellulose into
5
fermentable sugars. Enzyme hydrolysis occurs in lower temperatures with higher conversion
rates than acid hydrolysis. Initially the enzymes loosen the bonds between cellulose and
hemicellulose and cellulose is isolated. Then, a water molecule is added and converts
cellulose molecules into glucose monomers. However, the use of acids and enzymes is not
cost-effective.
2.3.1 Syngas
Syngas or synthesis gas consists mainly of carbon monoxide, hydrogen and carbon dioxide. It
is named after its use as an intermediate in synthetic natural gas (SNG) production. It is also
used in ammonia and methanol production as well as in synthetic petroleum generation
(Fischer - Tropsch process) (Beychok 1975). Syngas is combustible and has half the energy
density of natural gas. It is often used as fuel in internal combustion engines (Energy). It can
be generated by a variety of feedstock such as biomass, coal, oil shale and residual, tar sands,
methane even solar energy (D'Alessio & Paolucci 1989). Additionally, there is a plethora of
production methods with small costs ( $6 per million BTU, with raw material cost of $10
/lb. product) (Mark Burk 2013).
2.3.2 Thermochemical process – syngas production
A more efficient conversion of feedstock into bio-methane is the thermochemical process, in
which a gas intermediate (syngas) is produced via pyrolysis (high temperature) and
gasification. This conversion is conducted in three steps: pre-treatment, gasification and
purification. Pre-treatment consists of processes that alter the physical and chemical
properties of the feedstock. Some of these processes are drying, pelleting and composting
(Bronson et al. 2012). This step aims to the preparation of the biomass in order to be
homogenous and ready for the gasification step. Pyrolysis or liquefaction is the thermal
conversion of feedstock in the absence of oxidizing agent (e.g. oxygen) and it occurs always
before gasification. The products of pyrolysis are coke (liquefied feedstock), hydrogen, tars
and methane. Coke reacts with oxygen and water at high temperatures during gasification
(Agblevor 2007). Biomass gasification is the thermochemical conversion of carbon-based
biomass into gases. Biomass is partially oxidized at high temperatures (750 - 850 oC) mainly
into syngas (Datar 2004). The process has a high-energy conversion rate of 75 - 80 %. The
following key reactions occur during the gasification process (McKendry)
C + 0.5 O2 ↔ CO (eq. 2.1)
C + O2 ↔ CO2 (eq. 2.2)
C + H2O ↔ CO + H2 (eq. 2.3)
The first reaction (eq. 2.1) is the partial oxidation of carbon molecules into carbon monoxide
and the second reaction (eq. 2.2) is the complete oxidation of carbon into carbon dioxide. The
third reaction (eq. 2.3) is the complete water gas-shift reaction (WGS), which can be used in
order to modify the composition of syngas. The energy required for the WGS reaction is taken
by the electron transferring from CO to H2O (CO oxidation) as shown in the 2 following
reactions (Newsome 1980):
H+ + 2e
-H2 (eq. 2.4)
6
CO + H2O CO2 + H2 (eq. 2.5)
CO + 3H2 ↔ CH4 + H2O (eq. 2.6)
In the electrochemical reaction (eq. 2.4) the electrons and protons are provided by the carbon
monoxide dehydrogenase (CODH) and in equation 2.5 an enzyme catalyst called hydrogenase
provides the energy for the cell growth (Phillips 1994). Equation 2.6 shows the methane
formation that occurs during biomass gasification.
In anaerobic WGS reaction low energy is generated (4.46 kcal/mol), which results to slower
cell growth. On the contrary, 61.6 kcal/mol are produced in aerobic reaction (Amos 2004).
The H2/CO ratio can be changed through the WGS reaction. The previous common
commercial method for this alteration was steam methane reforming, were methane and steam
were endothermically converted to CO and H2 by a catalyst (Czernik 2000).
A number of complex chemical reactions take place during the gasification process. The most
important are: drying, pyrolysis, oxidation and reduction (Puig-Arnavat 2010). Drying occurs
at 100 oC - 200
oC and decomposes the biomass. Pyrolysis produces hydrocarbon gases like
methane and carbon monoxide in the absence of oxygen. Biomass is carbonated while water
and tars are also generated (Puig-Arnavat 2010). During oxidation (exothermic reaction)
carbon is oxidized to carbon dioxide and hydrogen is oxidized to water. Reduction is done at
800 oC - 1000
oC at anaerobic conditions (Puig-Arnavat 2010). Finally, the produced syngas
is purified. Two commonly used gasifiers in this process are fixed bed and fluidized bed
gasifiers (Munasinghe & Khanal 2010). The most cost-efficient for large-scale operation is
the fluidized bed gasification process (PROBIOPOL 2014).
2.3.3 Biochemical conversion and microbiology
The generation of methane using syngas is mostly conducted in 2 ways. The 1st way is the
biological digestion or syngas fermentation process where microorganisms are used as
biocatalysts. The 2nd
method is the use of chemical catalysts (metals) and it was introduced by
Franz Fischer and Hans Tropsch in 1925 in Germany (Wikipedia 2013). This method has
been used in industrial scale especially during the 1940’s and 1950’s but the high
manufacturing cost questions its economical sustainability.
The relatively new technology that combines gasification and fermentation is very promising
and a good alternative against the 1st-generation biofuel processes (Abubackar et al. 2011).
Biological digestion can generate a variety of products such as methane, bio plastics, ethanol,
butanol, acetic acid and butyric acid (Worden et al. 1997). The methane-forming cells belong
to Archaea-group and more specifically to the kingdom of Euryarchaeota. They are the only
microorganisms known to generate methane as a catabolic end product and this is the only
way that they can produce energy for themselves. The methanogens are very specialized and
can convert acetate, hydrogen, carbon dioxide, formate and other C1-compounds into methane
(Thauer 1998). During syngas fermentation syngas is converted into fuels and chemicals via
the acetyl-CoA pathway (Daniell et al. 2012).
Three main cell groups are usually found inside anaerobic digesters, the acetate forming
(acetogens), the sulphate reducing and the methane forming (methanogens) cells. The
acetogens consume simple compounds like ethanol and carbon dioxide and generate acetate
and hydrogen (eq. 2.9). The generated hydrogen is consumed by the methanogens, which live
7
in symbiotic conditions with the acetogens. If hydrogen was continuously accumulated, the
acetogens would die. The reproduction time for acetogens is usually more than 3 days. The
sulphate-reducing bacteria consume sulphate (when present) and use hydrogen in order to
reduce sulphate into hydrogen sulphate. This way they compete with the methanogens for
hydrogen. At low sulphate concentration, methanogens are favoured.
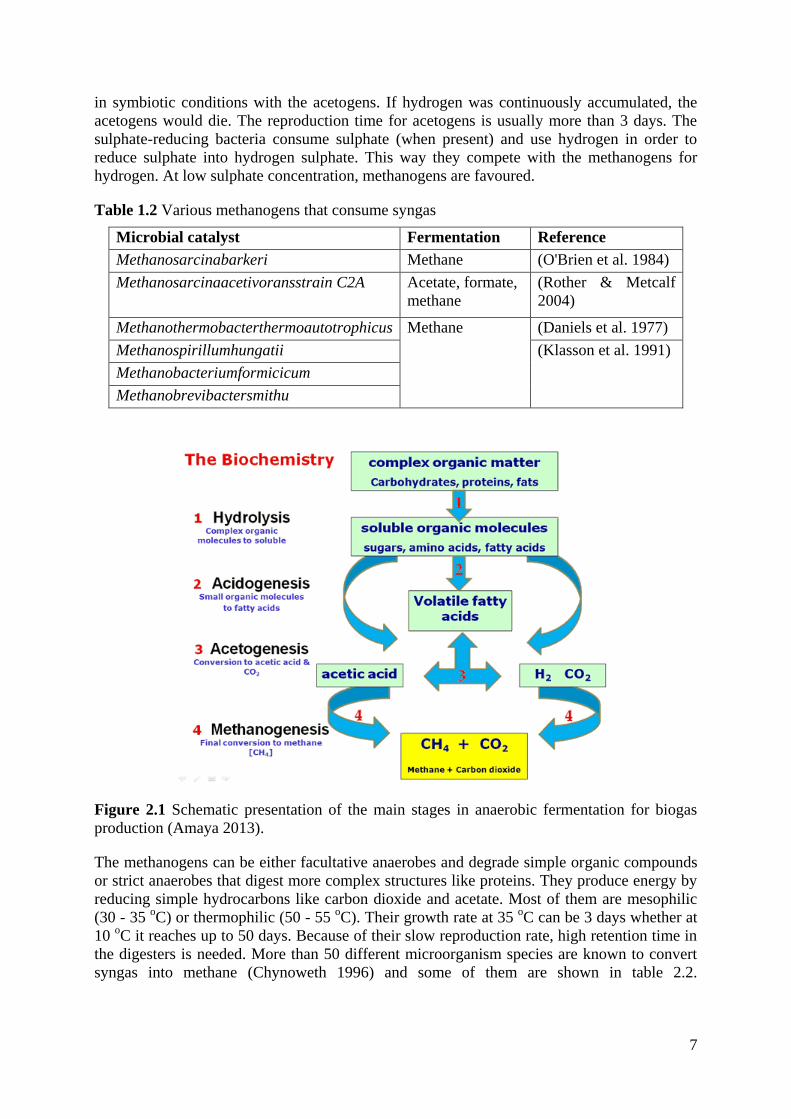
Table 1.2 Various methanogens that consume syngas
Microbial catalyst Fermentation
product
Reference
Methanosarcinabarkeri Methane (O'Brien et al. 1984)
Methanosarcinaacetivoransstrain C2A Acetate, formate,
methane
(Rother & Metcalf
2004)
Methanothermobacterthermoautotrophicus Methane
(Daniels et al. 1977)
Methanospirillumhungatii (Klasson et al. 1991)
Methanobacteriumformicicum
Methanobrevibactersmithu
Figure 2.1 Schematic presentation of the main stages in anaerobic fermentation for biogas
production (Amaya 2013).
The methanogens can be either facultative anaerobes and degrade simple organic compounds
or strict anaerobes that digest more complex structures like proteins. They produce energy by
reducing simple hydrocarbons like carbon dioxide and acetate. Most of them are mesophilic
(30 - 35 oC) or thermophilic (50 - 55
oC). Their growth rate at 35
oC can be 3 days whether at
10 oC it reaches up to 50 days. Because of their slow reproduction rate, high retention time in
the digesters is needed. More than 50 different microorganism species are known to convert
syngas into methane (Chynoweth 1996) and some of them are shown in table 2.2.
8
Methanogens exist in a variety of shapes, growth patterns and sizes while they are oxygen-
sensitive and fastidious anaerobes.
During the anaerobic digestion a series of reactions take place and the overall process is
usually divided in 4 main steps (figure 2.1). The first step is the hydrolysis of high molecular
weight-compounds like proteins and polymeric carbohydrates into smaller compounds like
monomeric carbohydrates and amino acids. This means the solubilisation of organic
compounds such as cellulose (particulate) and proteins (colloidal) into simpler structures that
can be absorbed by the cell membrane. The second step is called acidogenesis and is usually
considered a part of the acetogenesis step. In acidogenesis and acetogenesis the cells degrade
the absorbed molecules resulting to the production of volatile acids and alcohols (ethanol,
propanol). The acids are converted into acetate and hydrogen, which can be directly
consumed by methanotrophic bacteria. Finally, carbon dioxide is reduced by hydrogen,
methanogenesis takes place and the end products are methane and carbon dioxide (Gerardi
2003).
During methanogenesis, carbon monoxide and hydrogen are consumed by acetogenic
microorganisms, which produce the Acetyl-CoA intermediate. Afterwards, methanogenic
microorganisms consume acetate and produce methane and carbon dioxide in the absence of
oxygen (figure 2.2). The following equations show the key reactions of methane production in
a simplified way:
Cellulose + H2O −hydrolysis soluble sugars (2.7)
Proteins + H2O −hydrolysis soluble amino acids (2.8)
CH3CH2OH + CO2 CH3COOH + 2H2 (2.9)
CH3COOH CH4 + CO2 (2.10)
CO2 + 4H2 2H2O (2.11)
In the first 2 reactions (eq. 2.7, 2.8) complex hydrocarbons like cellulose and proteins are
hydrolysed into soluble sugars and aminoacids, which can be fermented easier. During
acidogenesis, small organic acids are converted into fatty acids (eq. 2.19). Acetogens
consume short C-changed alcohols and convert them into acetate and hydrogen. In equation
2.10, acetate is consumed by methanogens that generate methane and carbon dioxide, while in
equation 2.11, carbon dioxide reacts with hydrogen and produce water.
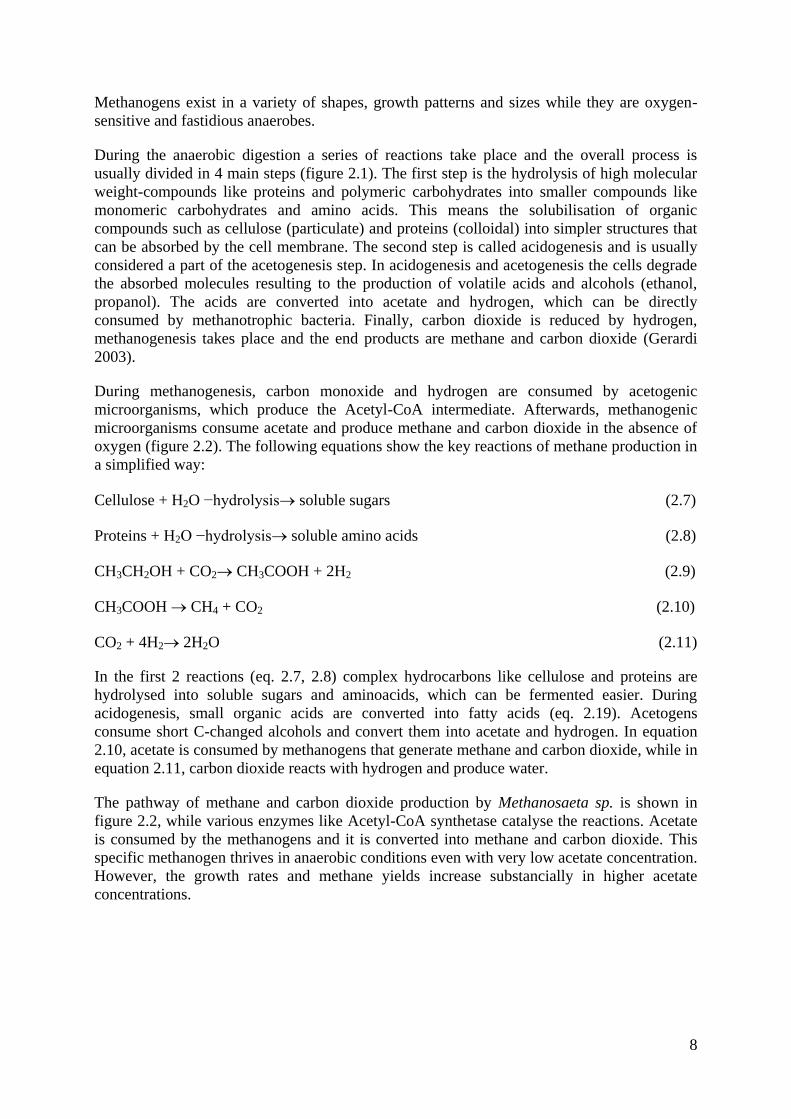
The pathway of methane and carbon dioxide production by Methanosaeta sp. is shown in
figure 2.2, while various enzymes like Acetyl-CoA synthetase catalyse the reactions. Acetate
is consumed by the methanogens and it is converted into methane and carbon dioxide. This
specific methanogen thrives in anaerobic conditions even with very low acetate concentration.
However, the growth rates and methane yields increase substancially in higher acetate
concentrations.
9
Figure 2. 2 Acetate conversion into methane and carbon dioxide by Methanosaeta sp. (Jetten
et al. 1992).
2.4 Membrane bioreactors
2.4.1 Membrane fundamentals
Membranes are semipermeable or selectively permeable barriers that allow to specific
molecules and ions to pass through them. In this way membranes separate different
compounds. The part of molecules that passes through the filters is called permeate and the
part that is rejected is called retentate. The driving force that is responsible for the molecular
transportation via the membranes can be a difference in pressure, concentration, electrical
charge or temperature (Wuang 2013). The permeate passes through the membrane pores, so
the pore morphology is a crucial characteristic in membranes. The membranes that have the
same chemical and physical structure through their cross-section are called symmetric or
isotropic. These membranes have cylindrical pores and the pore diameter is stable through the
cross-flow section. On the contrary, the asymmetric or anisotropic membranes do not have a
homogenous structure. In these membranes the pore diameter is not stable and this means that
10
a particle that enters these membranes may be entrapped inside them when the pore diameter
through the cross-flow gets smaller (Wuang 2013). Another way to categorize membranes is
the pore size. Membranes with pore diameters between 0.005 - 1 μm are called porous
membranes. Microporous membranes have pore-diameter less than 0.005 μm while for pore
diameters smaller than 1 nm, diffusion occurs and the membranes are non-porous or semi-
permeable (Sutherland 2007). The full name of the processes is shown in the abbreviation
list.
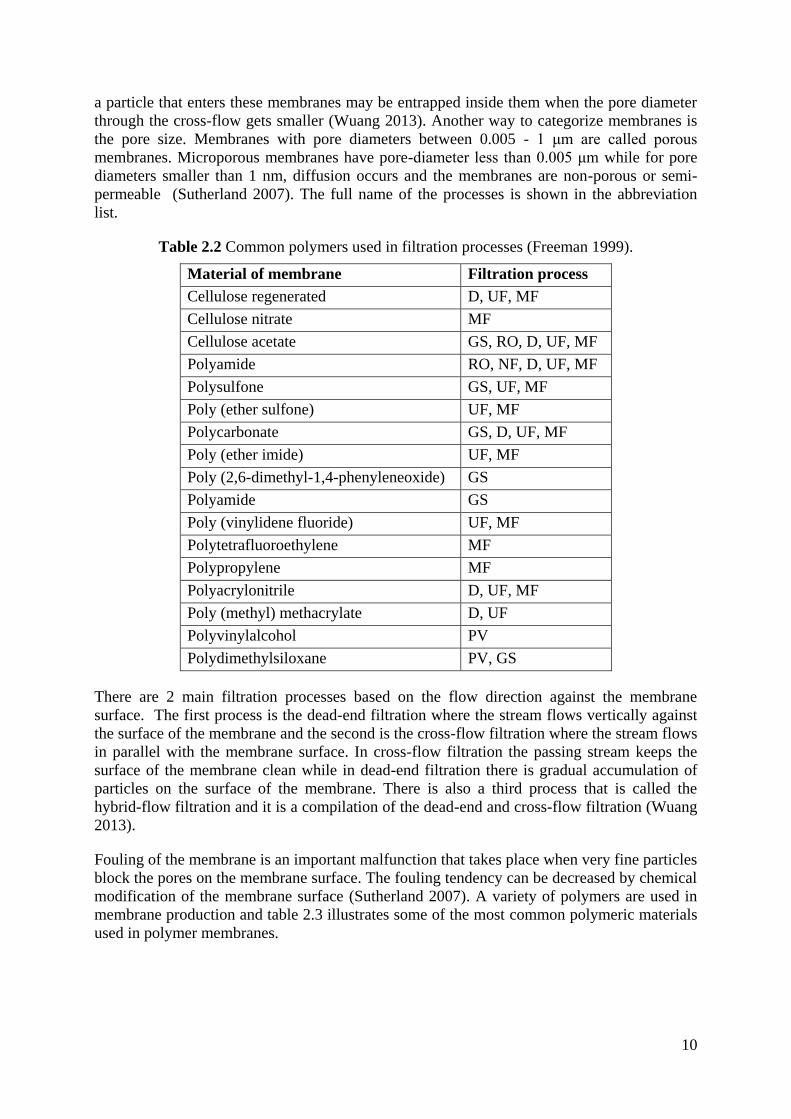
Table 2.2 Common polymers used in filtration processes (Freeman 1999).
Material of membrane Filtration process
Cellulose regenerated
D, UF, MF
Cellulose nitrate MF
Cellulose acetate GS, RO, D, UF, MF
Polyamide RO, NF, D, UF, MF
Polysulfone GS, UF, MF
Poly (ether sulfone) UF, MF
Polycarbonate GS, D, UF, MF
Poly (ether imide) UF, MF
Poly (2,6-dimethyl-1,4-phenyleneoxide) GS
Polyamide GS
Poly (vinylidene fluoride) UF, MF
Polytetrafluoroethylene MF
Polypropylene MF
Polyacrylonitrile D, UF, MF
Poly (methyl) methacrylate D, UF
Polyvinylalcohol PV
Polydimethylsiloxane PV, GS
There are 2 main filtration processes based on the flow direction against the membrane
surface. The first process is the dead-end filtration where the stream flows vertically against
the surface of the membrane and the second is the cross-flow filtration where the stream flows
in parallel with the membrane surface. In cross-flow filtration the passing stream keeps the
surface of the membrane clean while in dead-end filtration there is gradual accumulation of
particles on the surface of the membrane. There is also a third process that is called the
hybrid-flow filtration and it is a compilation of the dead-end and cross-flow filtration (Wuang
2013).
Fouling of the membrane is an important malfunction that takes place when very fine particles
block the pores on the membrane surface. The fouling tendency can be decreased by chemical
modification of the membrane surface (Sutherland 2007). A variety of polymers are used in
membrane production and table 2.3 illustrates some of the most common polymeric materials
used in polymer membranes.
11
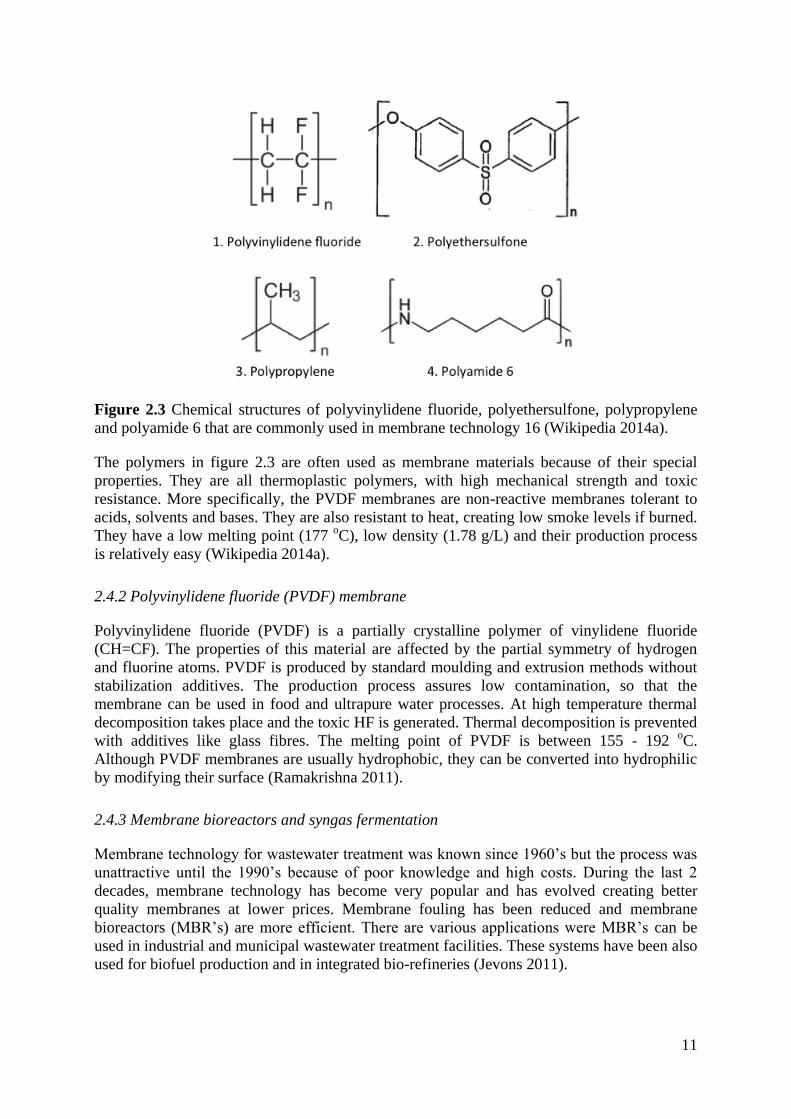
Figure 2.3 Chemical structures of polyvinylidene fluoride, polyethersulfone, polypropylene
and polyamide 6 that are commonly used in membrane technology 16 (Wikipedia 2014a).
The polymers in figure 2.3 are often used as membrane materials because of their special
properties. They are all thermoplastic polymers, with high mechanical strength and toxic
resistance. More specifically, the PVDF membranes are non-reactive membranes tolerant to
acids, solvents and bases. They are also resistant to heat, creating low smoke levels if burned.
They have a low melting point (177 oC), low density (1.78 g/L) and their production process
is relatively easy (Wikipedia 2014a).
2.4.2 Polyvinylidene fluoride (PVDF) membrane
Polyvinylidene fluoride (PVDF) is a partially crystalline polymer of vinylidene fluoride
(CH=CF). The properties of this material are affected by the partial symmetry of hydrogen
and fluorine atoms. PVDF is produced by standard moulding and extrusion methods without
stabilization additives. The production process assures low contamination, so that the
membrane can be used in food and ultrapure water processes. At high temperature thermal
decomposition takes place and the toxic HF is generated. Thermal decomposition is prevented
with additives like glass fibres. The melting point of PVDF is between 155 - 192 oC.
Although PVDF membranes are usually hydrophobic, they can be converted into hydrophilic
by modifying their surface (Ramakrishna 2011).
2.4.3 Membrane bioreactors and syngas fermentation
Membrane technology for wastewater treatment was known since 1960’s but the process was
unattractive until the 1990’s because of poor knowledge and high costs. During the last 2
decades, membrane technology has become very popular and has evolved creating better
quality membranes at lower prices. Membrane fouling has been reduced and membrane
bioreactors (MBR’s) are more efficient. There are various applications were MBR’s can be
used in industrial and municipal wastewater treatment facilities. These systems have been also
used for biofuel production and in integrated bio-refineries (Jevons 2011).
12
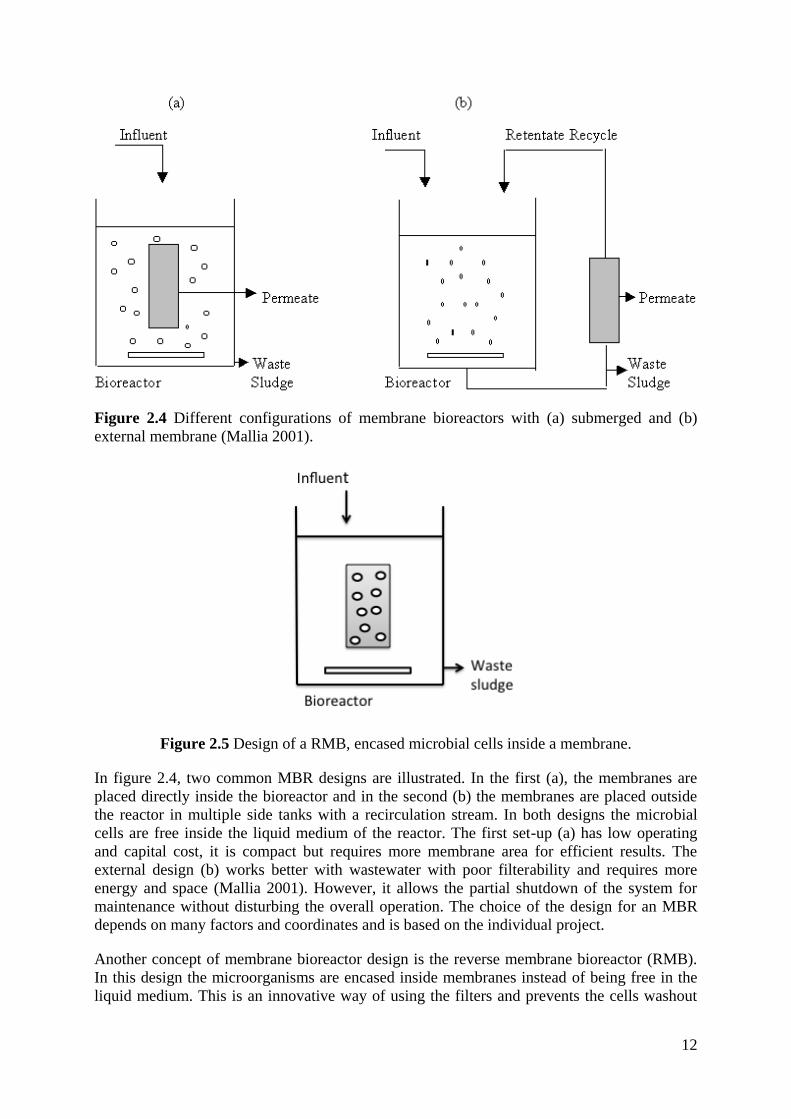
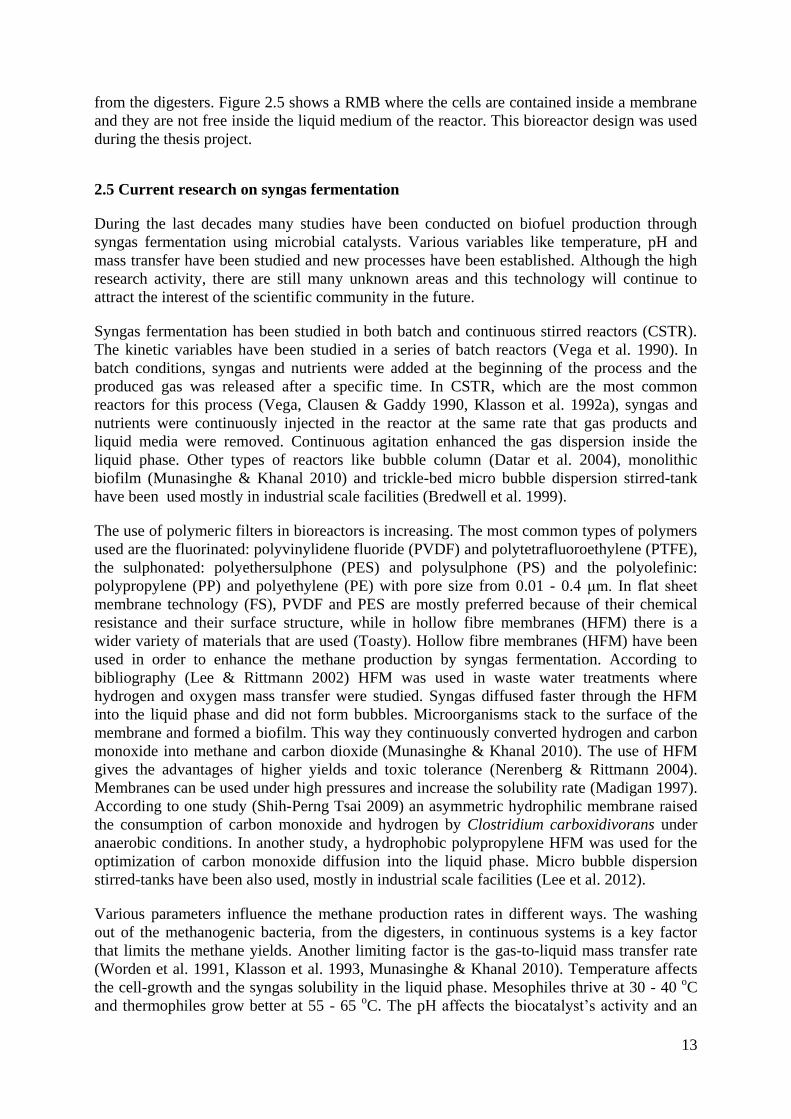
Figure 2.4 Different configurations of membrane bioreactors with (a) submerged and (b)
external membrane (Mallia 2001).
Figure 2.5 Design of a RMB, encased microbial cells inside a membrane.
In figure 2.4, two common MBR designs are illustrated. In the first (a), the membranes are
placed directly inside the bioreactor and in the second (b) the membranes are placed outside
the reactor in multiple side tanks with a recirculation stream. In both designs the microbial
cells are free inside the liquid medium of the reactor. The first set-up (a) has low operating
and capital cost, it is compact but requires more membrane area for efficient results. The
external design (b) works better with wastewater with poor filterability and requires more
energy and space (Mallia 2001). However, it allows the partial shutdown of the system for
maintenance without disturbing the overall operation. The choice of the design for an MBR
depends on many factors and coordinates and is based on the individual project.
Another concept of membrane bioreactor design is the reverse membrane bioreactor (RMB).
In this design the microorganisms are encased inside membranes instead of being free in the
liquid medium. This is an innovative way of using the filters and prevents the cells washout
13
from the digesters. Figure 2.5 shows a RMB where the cells are contained inside a membrane
and they are not free inside the liquid medium of the reactor. This bioreactor design was used
during the thesis project.
2.5 Current research on syngas fermentation
During the last decades many studies have been conducted on biofuel production through
syngas fermentation using microbial catalysts. Various variables like temperature, pH and
mass transfer have been studied and new processes have been established. Although the high
research activity, there are still many unknown areas and this technology will continue to
attract the interest of the scientific community in the future.
Syngas fermentation has been studied in both batch and continuous stirred reactors (CSTR).
The kinetic variables have been studied in a series of batch reactors (Vega et al. 1990). In
batch conditions, syngas and nutrients were added at the beginning of the process and the
produced gas was released after a specific time. In CSTR, which are the most common
reactors for this process (Vega, Clausen & Gaddy 1990, Klasson et al. 1992a), syngas and
nutrients were continuously injected in the reactor at the same rate that gas products and
liquid media were removed. Continuous agitation enhanced the gas dispersion inside the
liquid phase. Other types of reactors like bubble column (Datar et al. 2004), monolithic
biofilm (Munasinghe & Khanal 2010) and trickle-bed micro bubble dispersion stirred-tank
have been used mostly in industrial scale facilities (Bredwell et al. 1999).
The use of polymeric filters in bioreactors is increasing. The most common types of polymers
used are the fluorinated: polyvinylidene fluoride (PVDF) and polytetrafluoroethylene (PTFE),
the sulphonated: polyethersulphone (PES) and polysulphone (PS) and the polyolefinic:
polypropylene (PP) and polyethylene (PE) with pore size from 0.01 - 0.4 μm. In flat sheet
membrane technology (FS), PVDF and PES are mostly preferred because of their chemical
resistance and their surface structure, while in hollow fibre membranes (HFM) there is a
wider variety of materials that are used (Toasty). Hollow fibre membranes (HFM) have been
used in order to enhance the methane production by syngas fermentation. According to
bibliography (Lee & Rittmann 2002) HFM was used in waste water treatments where
hydrogen and oxygen mass transfer were studied. Syngas diffused faster through the HFM
into the liquid phase and did not form bubbles. Microorganisms stack to the surface of the
membrane and formed a biofilm. This way they continuously converted hydrogen and carbon
monoxide into methane and carbon dioxide (Munasinghe & Khanal 2010). The use of HFM
gives the advantages of higher yields and toxic tolerance (Nerenberg & Rittmann 2004).
Membranes can be used under high pressures and increase the solubility rate (Madigan 1997).
According to one study (Shih-Perng Tsai 2009) an asymmetric hydrophilic membrane raised
the consumption of carbon monoxide and hydrogen by Clostridium carboxidivorans under
anaerobic conditions. In another study, a hydrophobic polypropylene HFM was used for the
optimization of carbon monoxide diffusion into the liquid phase. Micro bubble dispersion
stirred-tanks have been also used, mostly in industrial scale facilities (Lee et al. 2012).
Various parameters influence the methane production rates in different ways. The washing
out of the methanogenic bacteria, from the digesters, in continuous systems is a key factor
that limits the methane yields. Another limiting factor is the gas-to-liquid mass transfer rate
(Worden et al. 1991, Klasson et al. 1993, Munasinghe & Khanal 2010). Temperature affects
the cell-growth and the syngas solubility in the liquid phase. Mesophiles thrive at 30 - 40 oC
and thermophiles grow better at 55 - 65 oC. The pH affects the biocatalyst’s activity and an
14
optimum pH in syngas fermentation is around 5.8 - 6.0 (Munasinghe & Khanal 2010).
Nutrients are very important for the microbial growth and must consist of minerals, metal co-
factors, vitamins and reducing agents.
Membranes have been mainly used in order to increase the gas-to-liquid mass transfer during
the digestion process. The substrate gas (syngas) has been usually flashed inside the liquid
medium of reactors through HFM (Judd 2011). However, a study (Youngsukkasem 2013)
showed that membranes can also detain the cells inside the digesters. In this specific study,
circular flat sheets (FS) were folded and heat-sealed forming pocket membranes that retained
the encased anaerobic bacteria. Different kind of synthetic membranes were also compared in
a trickle-bed reactor.
2.5.1 Advantages of syngas fermentation
Syngas fermentation via gasification is a relatively new process that gathers many advantages
in comparison to other relative methods. In syngas fermentation the biocatalysts provide with
high specificity and the process takes place in ambient conditions. Moreover, in syngas
fermentation there is a better resistance to catalyst poisoning and the ratio H2/CO does not
affect the process (Klasson et al., 1992a, Bredwell, Srivastava & Worden, 1999) in contrast to
metal catalytic process. The whole volume of biomass is utilised including lignin and
expensive pre-treatments and enzymes are avoided. Furthermore, fermentation has a high
conversion rate avoiding thermodynamic equilibrium situations (Klasson et al. 1992b). High-
energy rates and process economics make syngas fermentation a very promising method
(Daniell, Köpke & Simpson 2012). Finally, the rising interest in waste treatment attracts
companies, which invest on research and key projects.
2.5.2 Ethics and social aspect
The use of renewable energy reduces the utilisation of fossil fuels and oil that contributes
greatly to the global environmental pollution. The levels of nanoparticles and smog in some
parts of the world has increased to such levels that the citizens are advised to leave their
apartments only for emergency reasons. Specifically, 3 million people suffer in the city
Linfen in China that is considered the most polluted city globally, because of high particulate
concentration from motor engines and industrial emissions (Mibazaar 2014). Moreover, the
limited reserves of conventional fuels result to a substantial price increase. The use of
conventional fuels must be reduced and the best alternative is biofuels. These fuels are
produced through biological processes by renewable resources and can replace partially the
use of conventional fuels. The reduction in the use of coal and fossil fuels will lead to less
pollution and the increase of the living standard for millions of people. The reduction of the
waste volumes and fossil fuel emissions will also decrease illnesses like cholera, and cancer.
A great amount of funds intended to be placed on the health sector could be then invested in
research for cleaner energy purposes. Bioenergy production affects substantially the local
societies that surround the facilities. The feedstock is usually, plant residues, food crops and
waste, so a number of professions benefit by the bioenergy production. Furthermore, green
energy centres can be created in many places and this will provide the local societies with
cheap energy and the cost and pollution from the traditional fuels will be eliminated.
Biogas (methane and carbon dioxide) can be produced by a large variety of waste like:
sewage slurry, forest and agricultural residues, animal manure and municipal solid waste.
Biogas is unique because there is no need for complicated equipment, and waste is used as
15
substrate. The anaerobic microorganisms that catalyse the fermentation process are already
contained in the feedstock and do not need extra cultivation expenses. Farmers can easily
produce and sell biogas and compost, via the fermentation of animal manure and plant
residues in anaerobic digesters. This green fuel has been used in the early 1930´s in France,
initially for the reduction of forest residues that could cause fire during summer. Moreover, by
a compost-based bioenergy process called “biomeiler”, biogas, thermal energy and compost
could be produced in efficient quantities and the first biogas automobile was operated in 1931
(Pain 2014).
The combination of syngas fermentation and gasification gathers also a number of
environmental advantages. Solid waste like forest residuals, municipal waste, landfill mixed
waste (plastic, paper etc.) and sludge can be gasified. The volumes of pathogens, fungi,
worms and viruses, are reduced due to high temperature and long retention time in the
digesters (Judd 2011). Toxic gases like carbon monoxide are used as substrate and renewable
energy (methane) is generated. Syngas generated from the industry can supplement the
substrate fermentation gas. There are no ethical issues that rise by this specific method and
this is an important advantage against the 1st generation biofuels. A variety of non-food
feedstock can be used so the food prices are not affected and food resources are not used for
energy purposes while many populations are starving. On the contrary, the substrates of
gasification and fermentation are polluting the environment if not treated.
Syngas fermentation facilities may have economic benefits and subsidies by handling toxic
gases and municipal waste. Gasification reduces drastically the volume of the waste, there are
no landfill taxes and the waste transportation cost is decreased. Moreover, farmers can
increase their income by producing energy (biogas) and bio-fertilizer (compost). The handling
of hard-to-digest solids has also a positive social aspect by creating many new jobs around the
world. The microorganisms, which catalyse syngas-fermentation, are cheap and easy to be
cultivated. In conclusion, the bio-methanation of syngas is a process with no ethical dilemmas
and with positive social aspects. It can lead to the creation of cheap green energy, new jobs
and additional income for farmers, cleaner environment and higher living standards. Finally,
the benefits from biogas production can influence the public opinion and promote resource
recovery as a necessary lifestyle.
2.5.3 Challenges
One important limitation, which is common in anaerobic digestion, is the cell washout of the
digesters that results to a decrease of methane productivity. Another challenge in syngas
fermentation specifically is the slow gas-to-liquid mass transfer that slows down the overall
process and results to longer retention time. Moreover, the process must be done under
anaerobic conditions, which increases the overall process cost.
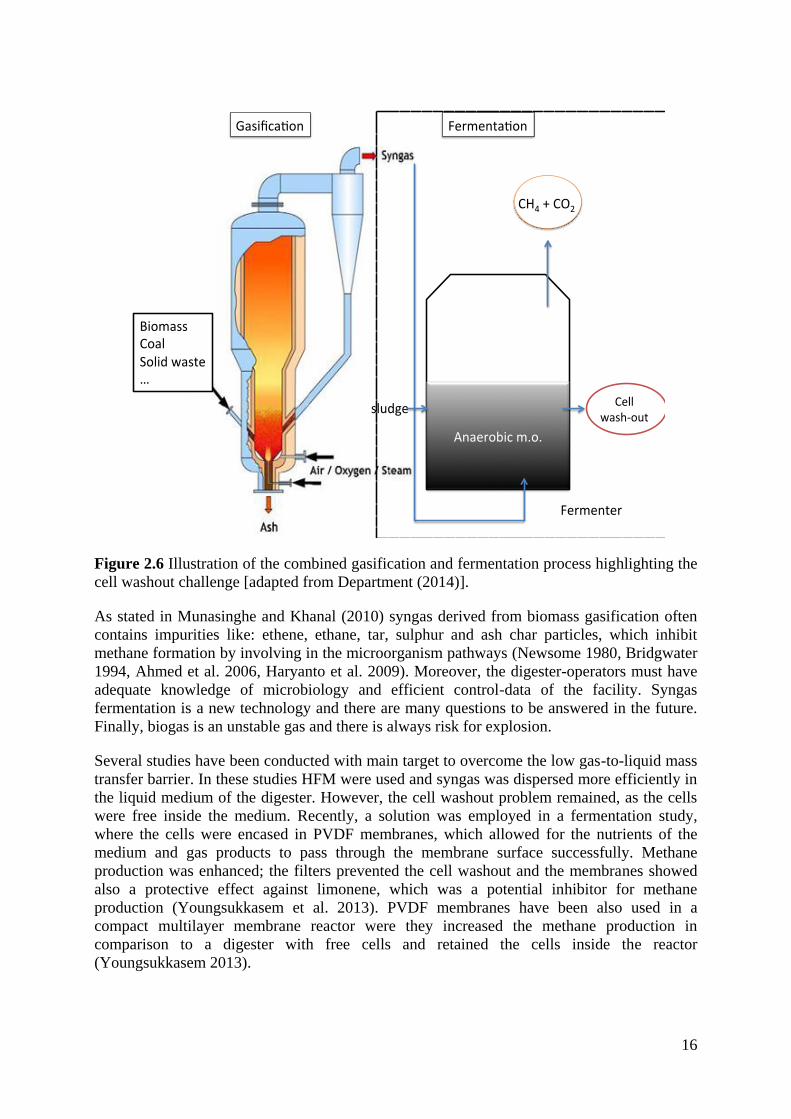
Figure 2.6 shows the combination of feedstock gasification and syngas fermentation for
methane production. Various types of feedstock can be used like biomass and coal. This
feedstock is burned and converted into syngas, which is fed inside anaerobic bioreactors as
gas substrate. The digesters contain sludge from municipal or industrial wastewater. The
sludge is rich in microorganisms that consume syngas and produce methane and carbon
dioxide. One important limitation in this process, as stated before, is the cell washout from the
digester where in continuous processes the methane-forming cells are poured out of the
reactor along with the old digestate.
16
Figure 2.6 Illustration of the combined gasification and fermentation process highlighting the
cell washout challenge [adapted from Department (2014)].
As stated in Munasinghe and Khanal (2010) syngas derived from biomass gasification often
contains impurities like: ethene, ethane, tar, sulphur and ash char particles, which inhibit
methane formation by involving in the microorganism pathways (Newsome 1980, Bridgwater
1994, Ahmed et al. 2006, Haryanto et al. 2009). Moreover, the digester-operators must have
adequate knowledge of microbiology and efficient control-data of the facility. Syngas
fermentation is a new technology and there are many questions to be answered in the future.
Finally, biogas is an unstable gas and there is always risk for explosion.
Several studies have been conducted with main target to overcome the low gas-to-liquid mass
transfer barrier. In these studies HFM were used and syngas was dispersed more efficiently in
the liquid medium of the digester. However, the cell washout problem remained, as the cells
were free inside the medium. Recently, a solution was employed in a fermentation study,
where the cells were encased in PVDF membranes, which allowed for the nutrients of the
medium and gas products to pass through the membrane surface successfully. Methane
production was enhanced; the filters prevented the cell washout and the membranes showed
also a protective effect against limonene, which was a potential inhibitor for methane
production (Youngsukkasem et al. 2013). PVDF membranes have been also used in a
compact multilayer membrane reactor were they increased the methane production in
comparison to a digester with free cells and retained the cells inside the reactor
(Youngsukkasem 2013).
17
In this thesis project the syngas used as gas substrate had specific composition and did not
contain any other impurities. The experimental process took place in a laboratory air hood and
carbon monoxide detectors were placed near the hood. PVDF filters were chosen because of
their good mechanical and toxic resistance. Their hydrophilic structure allowed nutrients and
gases to pass through their surface. Moreover, this polymeric material has been successfully
used before in biogas production (Youngsukkasem et al. 2013). The filters were used in order
to retain the methanogenic cells inside the digester so that the methane production would
increase.
18
Chapter 3
Materials and methods
3.1 Materials
3.1.1 Anaerobic culture
The anaerobic culture used for this project was in form of suspended sludge and was obtained
from a 3000 m3
thermophilic municipal solid digester (Borås Energy and Environment AB,
Sweden). The culture preparation was conducted according to previous works (Angelidaki et
al. 2009). Fresh inoculum was collected and used in the beginning of every experiment. The
methane-forming microorganisms required anaerobic conditions, so the culture treatment took
place as quickly as possible in order to avoid oxygen contamination.
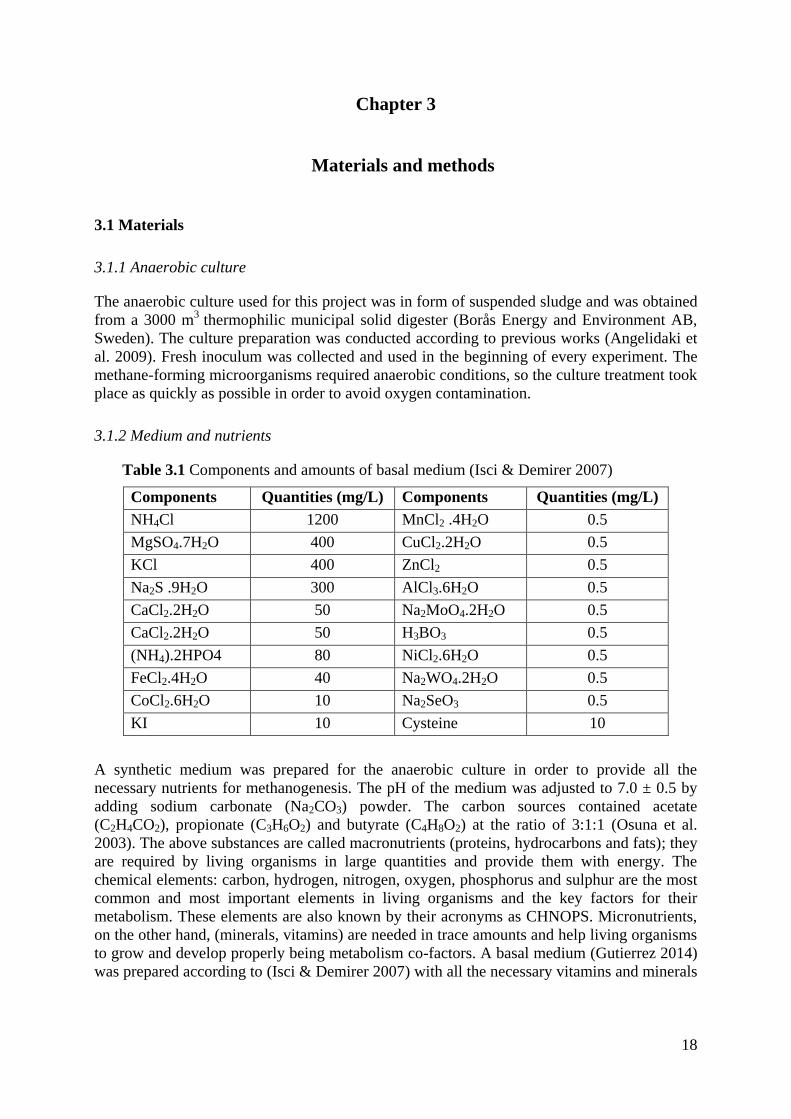
3.1.2 Medium and nutrients
Table 3.1 Components and amounts of basal medium (Isci & Demirer 2007)
Components Quantities (mg/L) Components Quantities (mg/L)
NH4Cl 1200 MnCl2 .4H2O 0.5
MgSO4.7H2O 400 CuCl2.2H2O 0.5
KCl 400 ZnCl2 0.5
Na2S .9H2O 300 AlCl3.6H2O 0.5
CaCl2.2H2O 50 Na2MoO4.2H2O 0.5
CaCl2.2H2O 50 H3BO3 0.5
(NH4).2HPO4 80 NiCl2.6H2O 0.5
FeCl2.4H2O 40 Na2WO4.2H2O 0.5
CoCl2.6H2O 10 Na2SeO3 0.5
KI 10 Cysteine 10
A synthetic medium was prepared for the anaerobic culture in order to provide all the
necessary nutrients for methanogenesis. The pH of the medium was adjusted to 7.0 ± 0.5 by
adding sodium carbonate (Na2CO3) powder. The carbon sources contained acetate
(C2H4CO2), propionate (C3H6O2) and butyrate (C4H8O2) at the ratio of 3:1:1 (Osuna et al.
2003). The above substances are called macronutrients (proteins, hydrocarbons and fats); they
are required by living organisms in large quantities and provide them with energy. The
chemical elements: carbon, hydrogen, nitrogen, oxygen, phosphorus and sulphur are the most
common and most important elements in living organisms and the key factors for their
metabolism. These elements are also known by their acronyms as CHNOPS. Micronutrients,
on the other hand, (minerals, vitamins) are needed in trace amounts and help living organisms
to grow and develop properly being metabolism co-factors. A basal medium (Gutierrez 2014)
was prepared according to (Isci & Demirer 2007) with all the necessary vitamins and minerals
19
for the optimal performance of the microorganisms. Table 3.1 shows the components of basal
medium in mg/L.
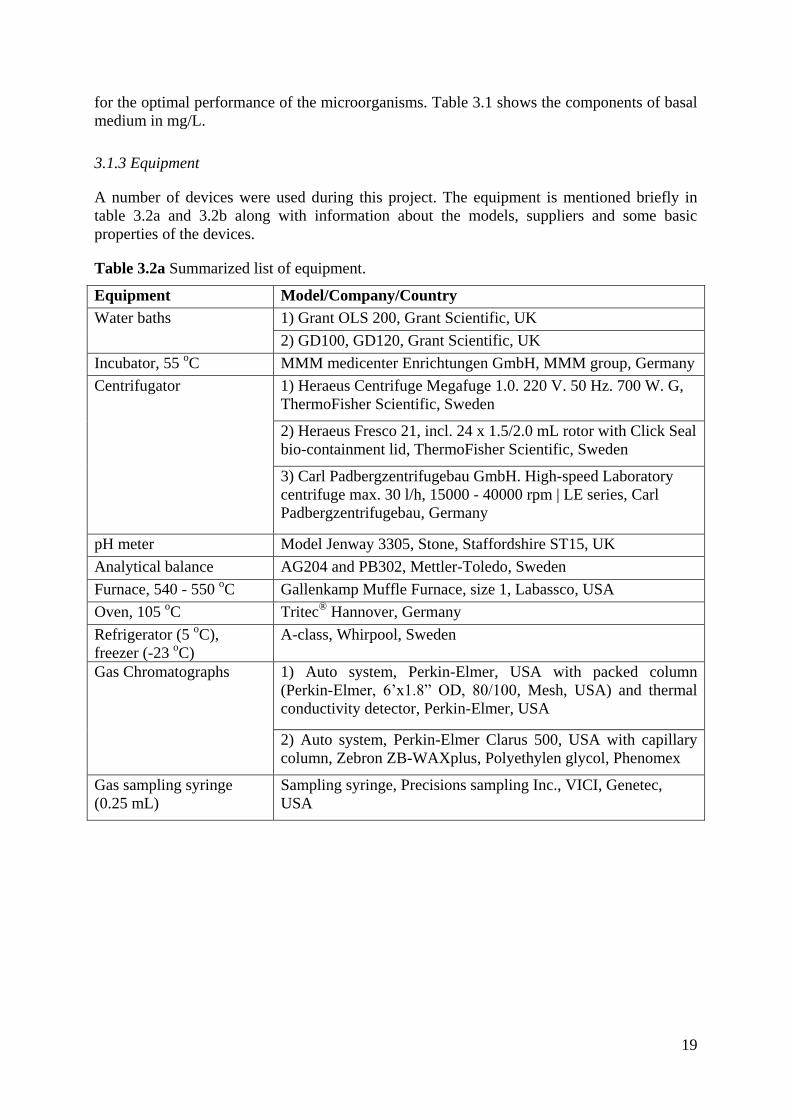
3.1.3 Equipment
A number of devices were used during this project. The equipment is mentioned briefly in
table 3.2a and 3.2b along with information about the models, suppliers and some basic
properties of the devices.
Table 3.2a Summarized list of equipment.
Equipment Model/Company/Country
Water baths 1) Grant OLS 200, Grant Scientific, UK
2) GD100, GD120, Grant Scientific, UK
Incubator, 55 oC MMM medicenter Enrichtungen GmbH, MMM group, Germany
Centrifugator
1) Heraeus Centrifuge Megafuge 1.0. 220 V. 50 Hz. 700 W. G,
ThermoFisher Scientific, Sweden
2) Heraeus Fresco 21, incl. 24 x 1.5/2.0 mL rotor with Click Seal
bio-containment lid, ThermoFisher Scientific, Sweden
3) Carl Padbergzentrifugebau GmbH. High-speed Laboratory
centrifuge max. 30 l/h, 15000 - 40000 rpm | LE series, Carl
Padbergzentrifugebau, Germany
pH meter Model Jenway 3305, Stone, Staffordshire ST15, UK
Analytical balance AG204 and PB302, Mettler-Toledo, Sweden
Furnace, 540 - 550 oC Gallenkamp Muffle Furnace, size 1, Labassco, USA
Oven, 105 oC Tritec
® Hannover, Germany
Refrigerator (5 oC),
freezer (-23 oC)
A-class, Whirpool, Sweden
Gas Chromatographs
1) Auto system, Perkin-Elmer, USA with packed column
(Perkin-Elmer, 6’x1.8” OD, 80/100, Mesh, USA) and thermal
conductivity detector, Perkin-Elmer, USA
2) Auto system, Perkin-Elmer Clarus 500, USA with capillary
column, Zebron ZB-WAXplus, Polyethylen glycol, Phenomex
Gas sampling syringe
(0.25 mL)
Sampling syringe, Precisions sampling Inc., VICI, Genetec,
USA
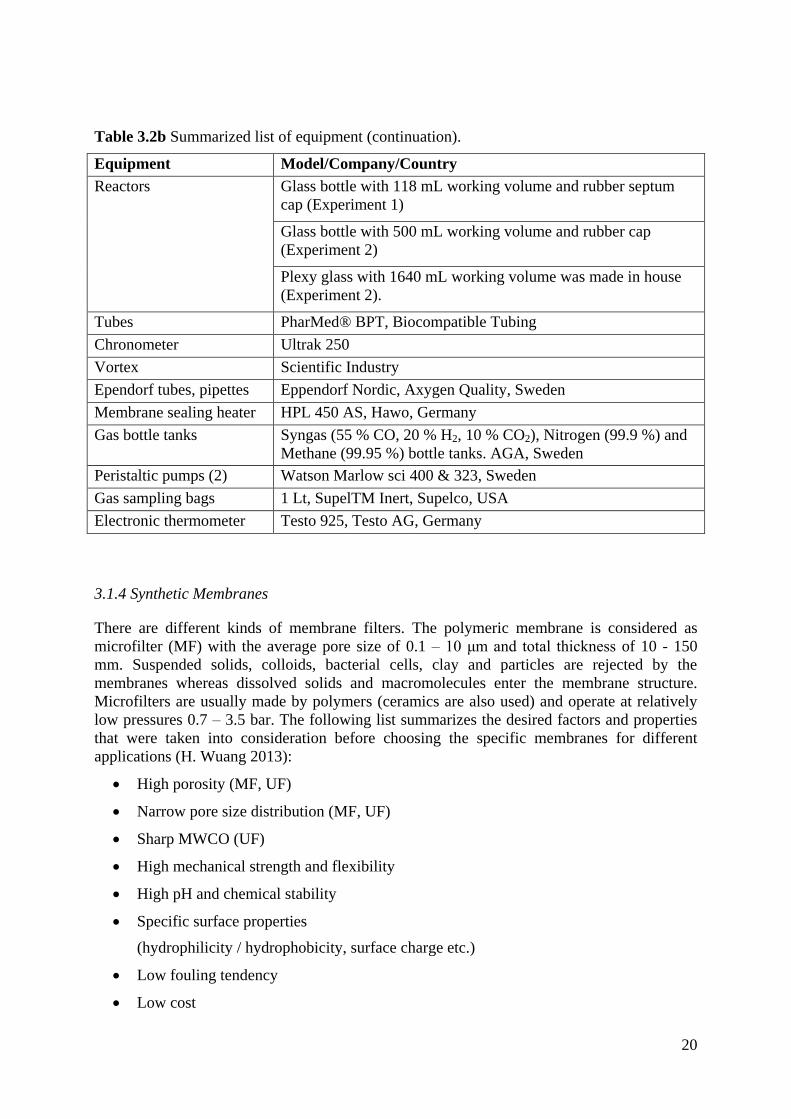
20
Table 3.2b Summarized list of equipment (continuation).
Equipment Model/Company/Country
Reactors Glass bottle with 118 mL working volume and rubber septum
cap (Experiment 1)
Glass bottle with 500 mL working volume and rubber cap
(Experiment 2)
Plexy glass with 1640 mL working volume was made in house
(Experiment 2).
Tubes PharMed® BPT, Biocompatible Tubing
Chronometer Ultrak 250
Vortex Scientific Industry
Ependorf tubes, pipettes Eppendorf Nordic, Axygen Quality, Sweden
Membrane sealing heater HPL 450 AS, Hawo, Germany
Gas bottle tanks Syngas (55 % CO, 20 % H2, 10 % CO2), Nitrogen (99.9 %) and
Methane (99.95 %) bottle tanks. AGA, Sweden
Peristaltic pumps (2) Watson Marlow sci 400 & 323, Sweden
Gas sampling bags 1 Lt, SupelTM Inert, Supelco, USA
Electronic thermometer Testo 925, Testo AG, Germany
3.1.4 Synthetic Membranes
There are different kinds of membrane filters. The polymeric membrane is considered as
microfilter (MF) with the average pore size of 0.1 – 10 μm and total thickness of 10 - 150
mm. Suspended solids, colloids, bacterial cells, clay and particles are rejected by the
membranes whereas dissolved solids and macromolecules enter the membrane structure.
Microfilters are usually made by polymers (ceramics are also used) and operate at relatively
low pressures 0.7 – 3.5 bar. The following list summarizes the desired factors and properties
that were taken into consideration before choosing the specific membranes for different
applications (H. Wuang 2013):
High porosity (MF, UF)
Narrow pore size distribution (MF, UF)
Sharp MWCO (UF)
High mechanical strength and flexibility
High pH and chemical stability
Specific surface properties
(hydrophilicity / hydrophobicity, surface charge etc.)
Low fouling tendency
Low cost
21
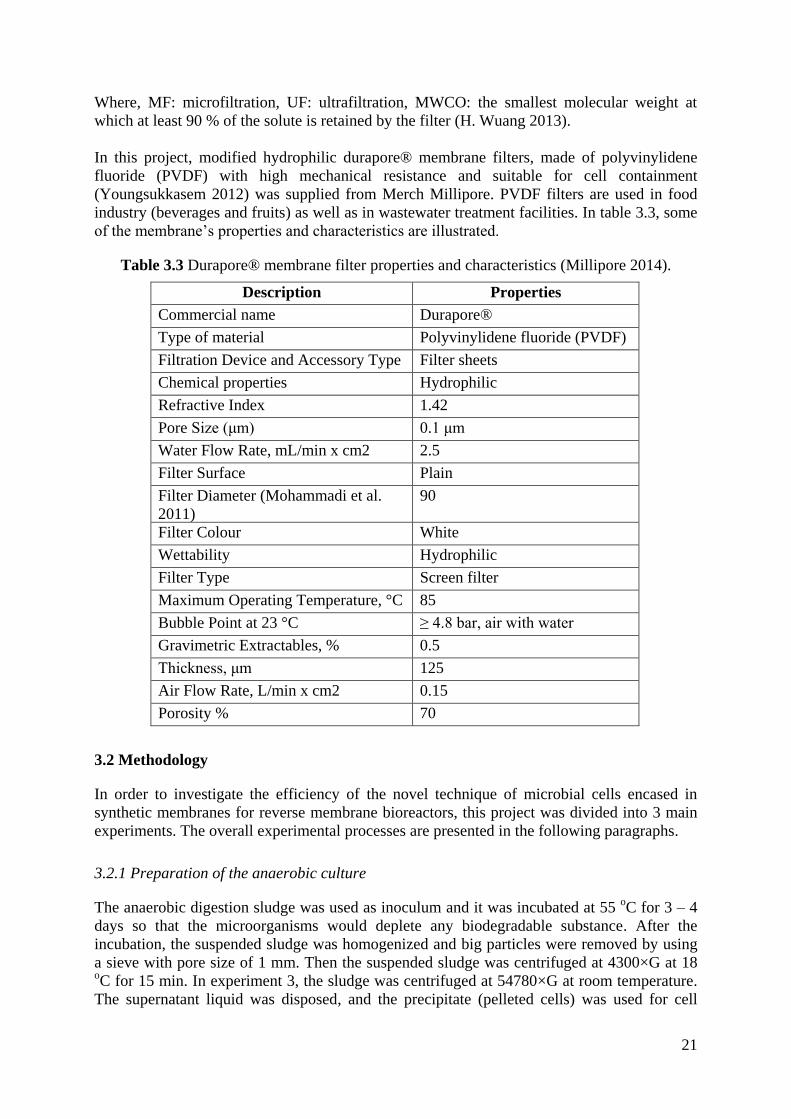
Where, MF: microfiltration, UF: ultrafiltration, MWCO: the smallest molecular weight at
which at least 90 % of the solute is retained by the filter (H. Wuang 2013).
In this project, modified hydrophilic durapore® membrane filters, made of polyvinylidene
fluoride (PVDF) with high mechanical resistance and suitable for cell containment
(Youngsukkasem 2012) was supplied from Merch Millipore. PVDF filters are used in food
industry (beverages and fruits) as well as in wastewater treatment facilities. In table 3.3, some
of the membrane’s properties and characteristics are illustrated.
Table 3.3 Durapore® membrane filter properties and characteristics (Millipore 2014).
Description Properties
Commercial name Durapore®
Type of material Polyvinylidene fluoride (PVDF)
Filtration Device and Accessory Type Filter sheets
Chemical properties Hydrophilic
Refractive Index 1.42
Pore Size (μm) 0.1 μm
Water Flow Rate, mL/min x cm2 2.5
Filter Surface Plain
Filter Diameter (Mohammadi et al.
2011)
90
Filter Colour White
Wettability Hydrophilic
Filter Type Screen filter
Maximum Operating Temperature, °C 85
Bubble Point at 23 °C ≥ 4.8 bar, air with water
Gravimetric Extractables, % 0.5
Thickness, μm 125
Air Flow Rate, L/min x cm2 0.15
Porosity % 70
3.2 Methodology
In order to investigate the efficiency of the novel technique of microbial cells encased in
synthetic membranes for reverse membrane bioreactors, this project was divided into 3 main
experiments. The overall experimental processes are presented in the following paragraphs.
3.2.1 Preparation of the anaerobic culture
The anaerobic digestion sludge was used as inoculum and it was incubated at 55 oC for 3 – 4
days so that the microorganisms would deplete any biodegradable substance. After the
incubation, the suspended sludge was homogenized and big particles were removed by using
a sieve with pore size of 1 mm. Then the suspended sludge was centrifuged at 4300×G at 18 oC for 15 min. In experiment 3, the sludge was centrifuged at 54780×G at room temperature.
The supernatant liquid was disposed, and the precipitate (pelleted cells) was used for cell
22
encasement. During its preparation the anaerobic culture had a vivid black colour, which
meant that the cells were active and robust. However, when the suspended sludge turned into
faint brown, this was an indication that some negative factors, such as the presence of oxygen
or the toxicity of carbon monoxide, inhibited the cell performance.
3.2.2 Experiment 1: Investigation of a novel technique with encased methane-producing
microorganisms in PVDF membrane for syngas bio-methanation in batch and repeated batch
mode
The design of this experiment is presented in table 3.4. All measurements were conducted
with 3 replications. Biogas production, syngas consumption, VFA degradation and the pH of
the liquid medium were measured while the total syngas pressure was stable. The
performances of encased cells in membrane filters (PVDF, polyvinylidene fluoride) and free
cells were compared at different temperatures, substrates, OLRs and retention times.
Table 3.4 Experimental design of experiment 1
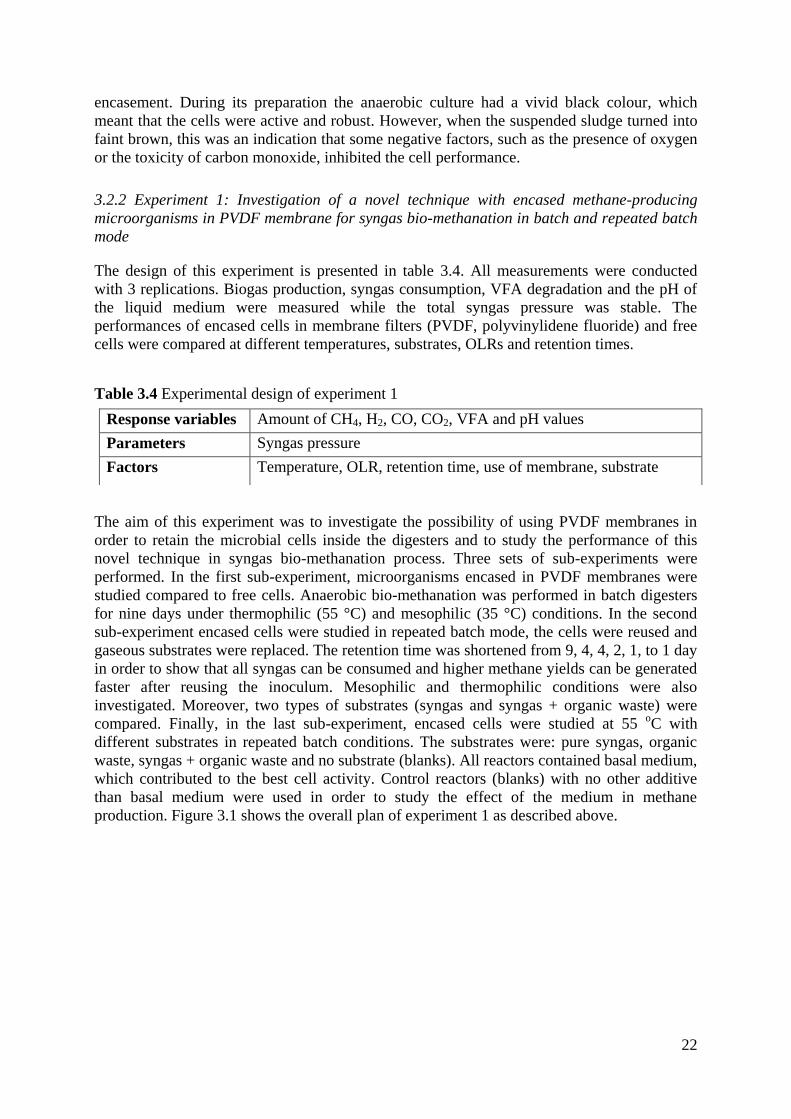
The aim of this experiment was to investigate the possibility of using PVDF membranes in
order to retain the microbial cells inside the digesters and to study the performance of this
novel technique in syngas bio-methanation process. Three sets of sub-experiments were
performed. In the first sub-experiment, microorganisms encased in PVDF membranes were
studied compared to free cells. Anaerobic bio-methanation was performed in batch digesters
for nine days under thermophilic (55 °C) and mesophilic (35 °C) conditions. In the second
sub-experiment encased cells were studied in repeated batch mode, the cells were reused and
gaseous substrates were replaced. The retention time was shortened from 9, 4, 4, 2, 1, to 1 day
in order to show that all syngas can be consumed and higher methane yields can be generated
faster after reusing the inoculum. Mesophilic and thermophilic conditions were also
investigated. Moreover, two types of substrates (syngas and syngas + organic waste) were
compared. Finally, in the last sub-experiment, encased cells were studied at 55 oC with
different substrates in repeated batch conditions. The substrates were: pure syngas, organic
waste, syngas + organic waste and no substrate (blanks). All reactors contained basal medium,
which contributed to the best cell activity. Control reactors (blanks) with no other additive
than basal medium were used in order to study the effect of the medium in methane
production. Figure 3.1 shows the overall plan of experiment 1 as described above.
Response variables Amount of CH4, H2, CO, CO2, VFA and pH values
Parameters Syngas pressure
Factors Temperature, OLR, retention time, use of membrane, substrate
23
Figure 3.1 Overall plan of experiment 1 in repeated-batch conditions presenting all the
experimental factors. a) Sub-experiment 1, b) sub-experiment 2 and c) sub-experiment 3.
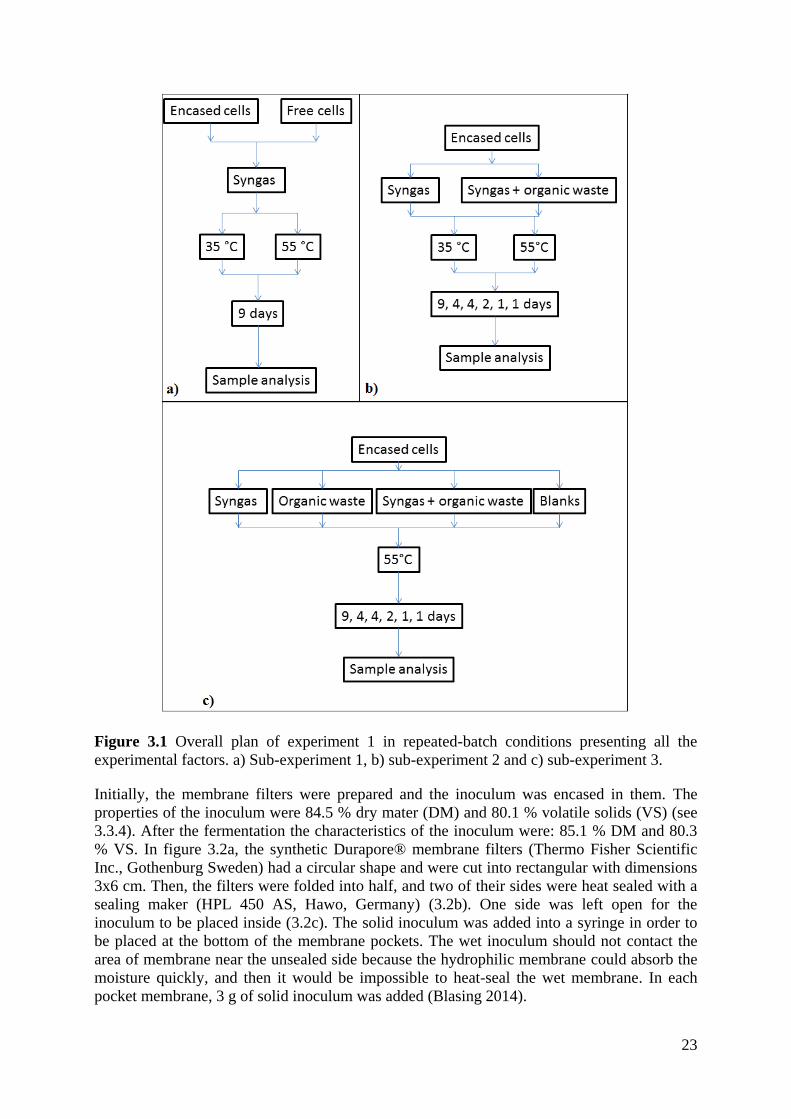
Initially, the membrane filters were prepared and the inoculum was encased in them. The
properties of the inoculum were 84.5 % dry mater (DM) and 80.1 % volatile solids (VS) (see
3.3.4). After the fermentation the characteristics of the inoculum were: 85.1 % DM and 80.3
% VS. In figure 3.2a, the synthetic Durapore® membrane filters (Thermo Fisher Scientific
Inc., Gothenburg Sweden) had a circular shape and were cut into rectangular with dimensions
3x6 cm. Then, the filters were folded into half, and two of their sides were heat sealed with a
sealing maker (HPL 450 AS, Hawo, Germany) (3.2b). One side was left open for the
inoculum to be placed inside (3.2c). The solid inoculum was added into a syringe in order to
be placed at the bottom of the membrane pockets. The wet inoculum should not contact the
area of membrane near the unsealed side because the hydrophilic membrane could absorb the
moisture quickly, and then it would be impossible to heat-seal the wet membrane. In each
pocket membrane, 3 g of solid inoculum was added (Blasing 2014).
24
Figure 3.2 The method of membrane pocket preparation. a) Drawing dimensions on the
membrane sheets, b) heat-sealing device, c) membrane pocket ready to be filled with
inoculum.
After the inoculum was added inside the pocket membranes, the membranes were weighed
and the remaining open side was heat-sealed immediately. The heat-sealed membrane area
was inspected for air bubbles, which could lead to cell leaking during the experiment. The
membrane sachets containing the microorganisms were immediately used after their
preparation. One sachet was placed inside every reactor along with 40 mL of liquid medium.
The medium was basal mixture or basal mixture and synthetic organic waste (see 3.1.2).
Finally, the reactors were closed with butyl rubber seals supported by aluminium caps and
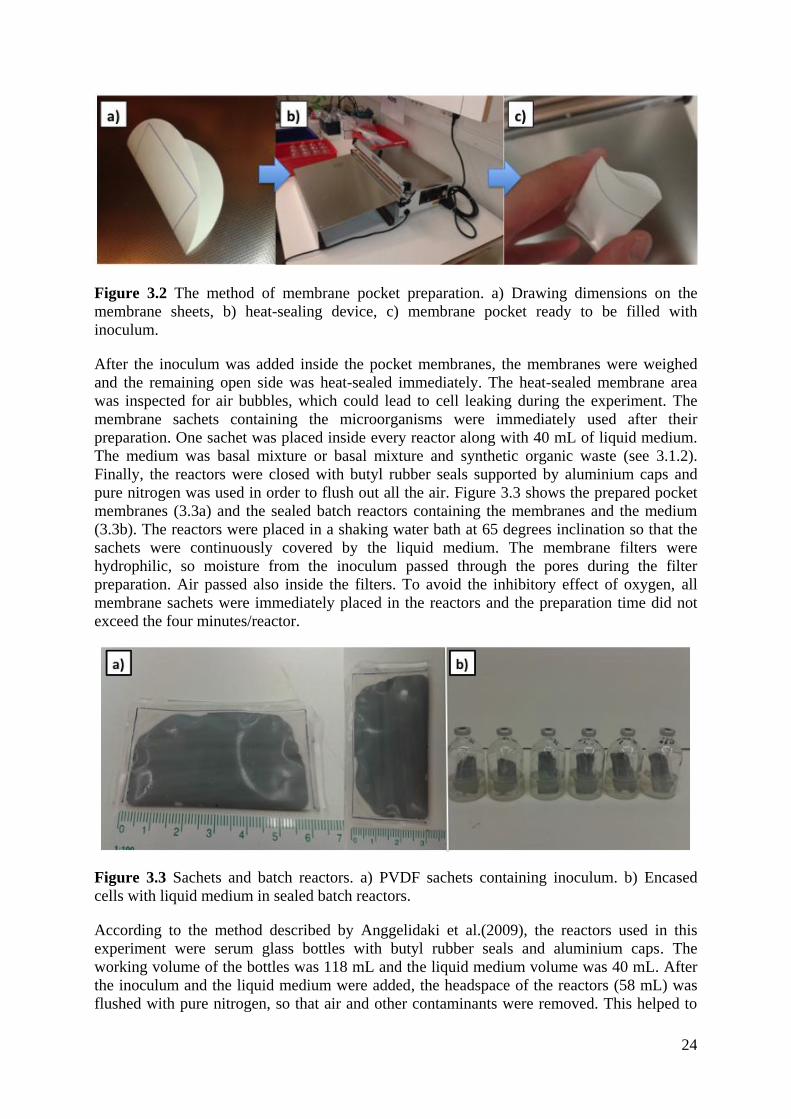
pure nitrogen was used in order to flush out all the air. Figure 3.3 shows the prepared pocket
membranes (3.3a) and the sealed batch reactors containing the membranes and the medium
(3.3b). The reactors were placed in a shaking water bath at 65 degrees inclination so that the
sachets were continuously covered by the liquid medium. The membrane filters were
hydrophilic, so moisture from the inoculum passed through the pores during the filter
preparation. Air passed also inside the filters. To avoid the inhibitory effect of oxygen, all
membrane sachets were immediately placed in the reactors and the preparation time did not
exceed the four minutes/reactor.
Figure 3.3 Sachets and batch reactors. a) PVDF sachets containing inoculum. b) Encased
cells with liquid medium in sealed batch reactors.
According to the method described by Anggelidaki et al.(2009), the reactors used in this
experiment were serum glass bottles with butyl rubber seals and aluminium caps. The
working volume of the bottles was 118 mL and the liquid medium volume was 40 mL. After
the inoculum and the liquid medium were added, the headspace of the reactors (58 mL) was
flushed with pure nitrogen, so that air and other contaminants were removed. This helped to
25
create an oxygen-free environment close to neutral pH (Raposo et al. 2012). Syngas and
nitrogen were fed directly from the gas tank via a needle that penetrated the septum of the
caps. The syngas pressure was controlled empirically by using a chronometer, while the exact
gas composition fed in the reactors was analysed by a Gas Chromatographer (GC). The
desired gas composition was achieved by adding more syngas or washing out the excess
syngas with pure nitrogen. Atmospheric pressure was adjusted in the reactors by a needle that
released all the extra pressure. After the syngas-feeding, the reactors were shaken in water
baths (100 rpm) at 35 oC and 55
oC for 24 hours.
3.2.3 Experiment 2: Investigation of the efficiency of PVDF membrane with encased methane-
producing microorganisms for syngas bio-methanation in semi-continuous process.
In the previous experiment, the performance of microbial cells encased in synthetic PVDF
membranes was investigated in batch and repeated batch conditions. During the second
experiment the performance of encased cells was studied in a semi-continuous process.
Initially, suspended sludge (free cells) was encased in PVDF sachets as previously described
(figure 3.2). The suspended sludge that was used as inoculum contained 87.14 % DM and
79.8 % VS. The encased cells were compared with free cells at thermophilic conditions and
the process was conducted in duplicates. Table 8 shows the experimental design of
experiment 3. The variables measured were the production of biogas (methane and carbon
dioxide), syngas consumption (hydrogen, carbon monoxide, and carbon dioxide), VFA
degradation and the pH of the liquid substrate while the temperature of the process was kept
stable at 55 oC.
Table 3.5 Experimental design of experiment 2
Response variables Amounts of CH4, CO2, H2, CO, VFA and pH values
Parameters Temperature (55 ± 2 oC)
Factors Syngas pressure, substrate, OLR, gas recirculation flow rate, use of
membrane
Figure 3.4 shows the general plan of this experiment. The experiment was divided into
different periods with different specific conditions (Table 4.3). In the beginning of the
experiment only basal medium was added and the OLR’s were relatively low. However, a
mixture of basal medium and synthetic organic waste was added after the first two months of
the process, while the total syngas pressure, the OLR’s and the pump flow rate were gradually
increased.
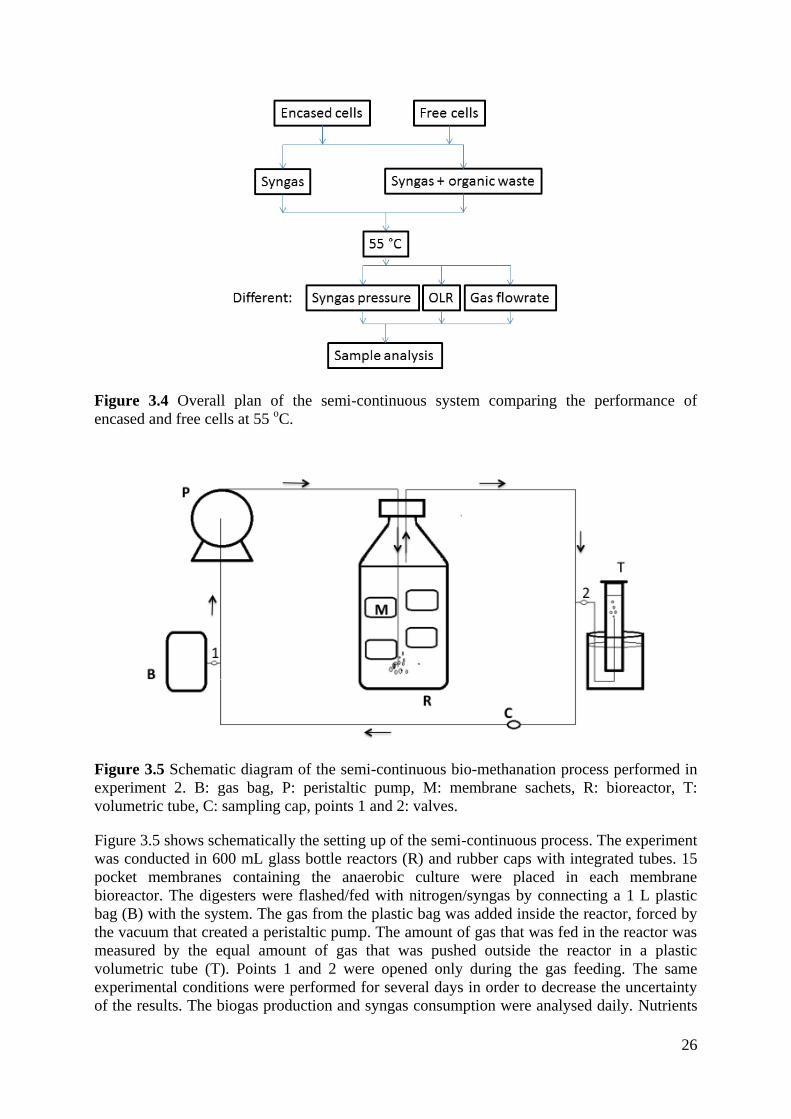
26
Figure 3.4 Overall plan of the semi-continuous system comparing the performance of
encased and free cells at 55 oC.
Figure 3.5 Schematic diagram of the semi-continuous bio-methanation process performed in
experiment 2. B: gas bag, P: peristaltic pump, M: membrane sachets, R: bioreactor, T:
volumetric tube, C: sampling cap, points 1 and 2: valves.
Figure 3.5 shows schematically the setting up of the semi-continuous process. The experiment
was conducted in 600 mL glass bottle reactors (R) and rubber caps with integrated tubes. 15
pocket membranes containing the anaerobic culture were placed in each membrane
bioreactor. The digesters were flashed/fed with nitrogen/syngas by connecting a 1 L plastic
bag (B) with the system. The gas from the plastic bag was added inside the reactor, forced by
the vacuum that created a peristaltic pump. The amount of gas that was fed in the reactor was
measured by the equal amount of gas that was pushed outside the reactor in a plastic
volumetric tube (T). Points 1 and 2 were opened only during the gas feeding. The same
experimental conditions were performed for several days in order to decrease the uncertainty
of the results. The biogas production and syngas consumption were analysed daily. Nutrients
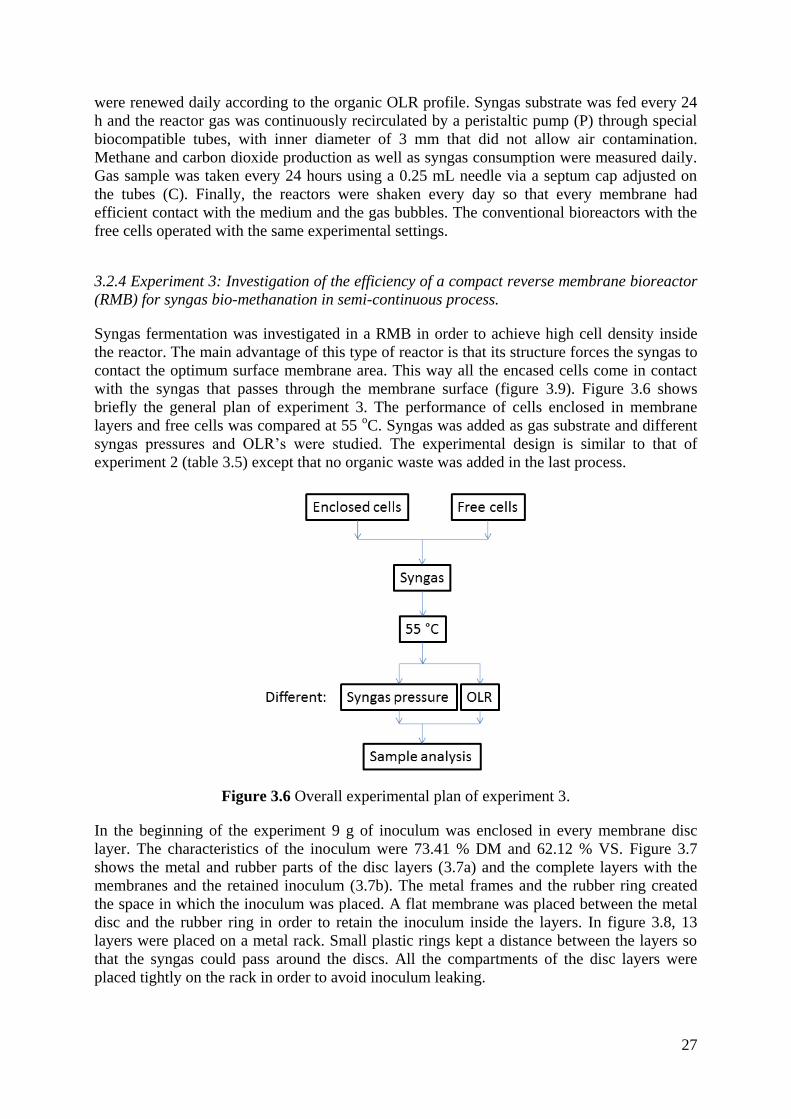
27
were renewed daily according to the organic OLR profile. Syngas substrate was fed every 24
h and the reactor gas was continuously recirculated by a peristaltic pump (P) through special
biocompatible tubes, with inner diameter of 3 mm that did not allow air contamination.
Methane and carbon dioxide production as well as syngas consumption were measured daily.
Gas sample was taken every 24 hours using a 0.25 mL needle via a septum cap adjusted on
the tubes (C). Finally, the reactors were shaken every day so that every membrane had
efficient contact with the medium and the gas bubbles. The conventional bioreactors with the
free cells operated with the same experimental settings.
3.2.4 Experiment 3: Investigation of the efficiency of a compact reverse membrane bioreactor
(RMB) for syngas bio-methanation in semi-continuous process.
Syngas fermentation was investigated in a RMB in order to achieve high cell density inside
the reactor. The main advantage of this type of reactor is that its structure forces the syngas to
contact the optimum surface membrane area. This way all the encased cells come in contact
with the syngas that passes through the membrane surface (figure 3.9). Figure 3.6 shows
briefly the general plan of experiment 3. The performance of cells enclosed in membrane
layers and free cells was compared at 55 oC. Syngas was added as gas substrate and different
syngas pressures and OLR’s were studied. The experimental design is similar to that of
experiment 2 (table 3.5) except that no organic waste was added in the last process.
Figure 3.6 Overall experimental plan of experiment 3.
In the beginning of the experiment 9 g of inoculum was enclosed in every membrane disc
layer. The characteristics of the inoculum were 73.41 % DM and 62.12 % VS. Figure 3.7
shows the metal and rubber parts of the disc layers (3.7a) and the complete layers with the
membranes and the retained inoculum (3.7b). The metal frames and the rubber ring created
the space in which the inoculum was placed. A flat membrane was placed between the metal
disc and the rubber ring in order to retain the inoculum inside the layers. In figure 3.8, 13
layers were placed on a metal rack. Small plastic rings kept a distance between the layers so
that the syngas could pass around the discs. All the compartments of the disc layers were
placed tightly on the rack in order to avoid inoculum leaking.
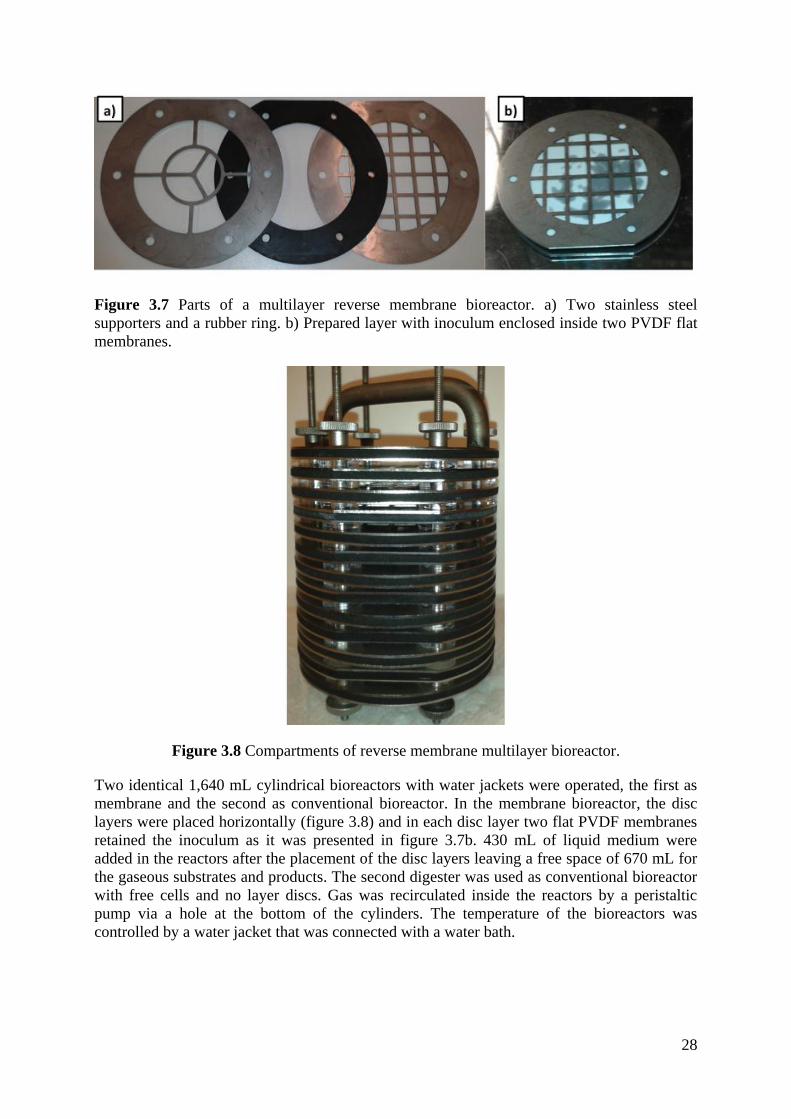
28
Figure 3.7 Parts of a multilayer reverse membrane bioreactor. a) Two stainless steel
supporters and a rubber ring. b) Prepared layer with inoculum enclosed inside two PVDF flat
membranes.
Figure 3.8 Compartments of reverse membrane multilayer bioreactor.
Two identical 1,640 mL cylindrical bioreactors with water jackets were operated, the first as
membrane and the second as conventional bioreactor. In the membrane bioreactor, the disc
layers were placed horizontally (figure 3.8) and in each disc layer two flat PVDF membranes
retained the inoculum as it was presented in figure 3.7b. 430 mL of liquid medium were
added in the reactors after the placement of the disc layers leaving a free space of 670 mL for
the gaseous substrates and products. The second digester was used as conventional bioreactor
with free cells and no layer discs. Gas was recirculated inside the reactors by a peristaltic
pump via a hole at the bottom of the cylinders. The temperature of the bioreactors was
controlled by a water jacket that was connected with a water bath.
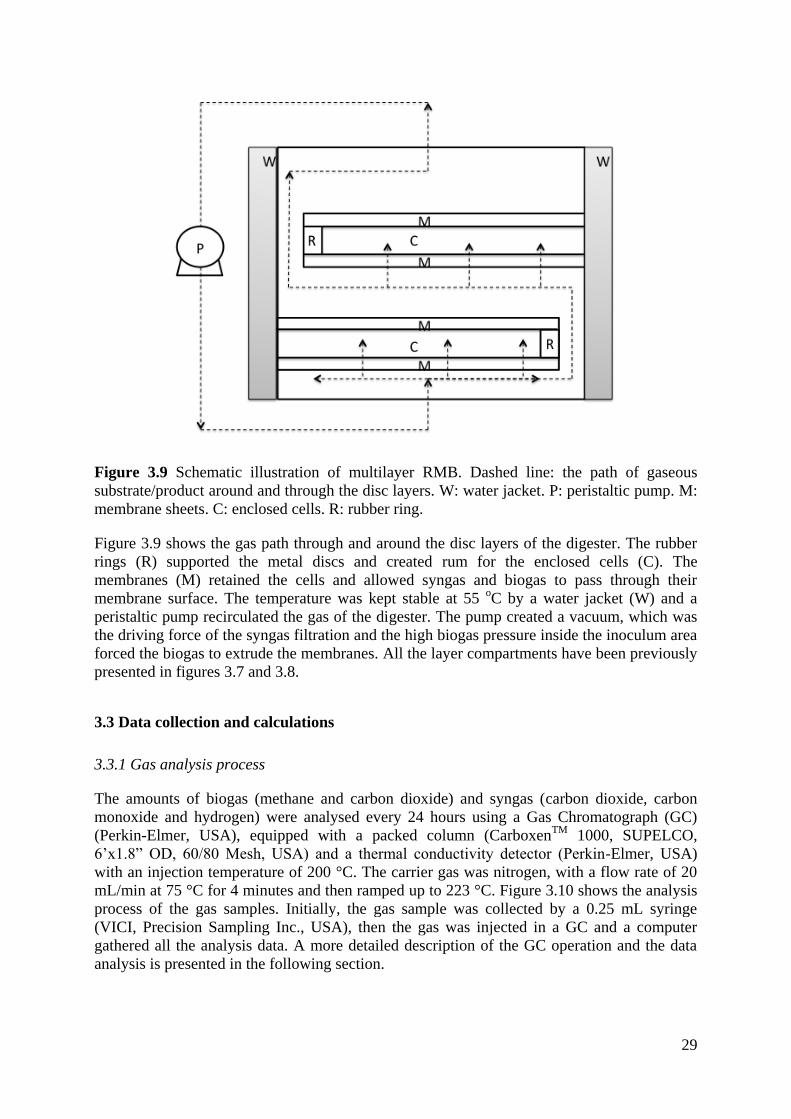
29
Figure 3.9 Schematic illustration of multilayer RMB. Dashed line: the path of gaseous
substrate/product around and through the disc layers. W: water jacket. P: peristaltic pump. M:
membrane sheets. C: enclosed cells. R: rubber ring.
Figure 3.9 shows the gas path through and around the disc layers of the digester. The rubber
rings (R) supported the metal discs and created rum for the enclosed cells (C). The
membranes (M) retained the cells and allowed syngas and biogas to pass through their
membrane surface. The temperature was kept stable at 55 oC by a water jacket (W) and a
peristaltic pump recirculated the gas of the digester. The pump created a vacuum, which was
the driving force of the syngas filtration and the high biogas pressure inside the inoculum area
forced the biogas to extrude the membranes. All the layer compartments have been previously
presented in figures 3.7 and 3.8.
3.3 Data collection and calculations
3.3.1 Gas analysis process
The amounts of biogas (methane and carbon dioxide) and syngas (carbon dioxide, carbon
monoxide and hydrogen) were analysed every 24 hours using a Gas Chromatograph (GC)
(Perkin-Elmer, USA), equipped with a packed column (CarboxenTM
1000, SUPELCO,
6’x1.8” OD, 60/80 Mesh, USA) and a thermal conductivity detector (Perkin-Elmer, USA)
with an injection temperature of 200 °C. The carrier gas was nitrogen, with a flow rate of 20
mL/min at 75 °C for 4 minutes and then ramped up to 223 °C. Figure 3.10 shows the analysis
process of the gas samples. Initially, the gas sample was collected by a 0.25 mL syringe
(VICI, Precision Sampling Inc., USA), then the gas was injected in a GC and a computer
gathered all the analysis data. A more detailed description of the GC operation and the data
analysis is presented in the following section.
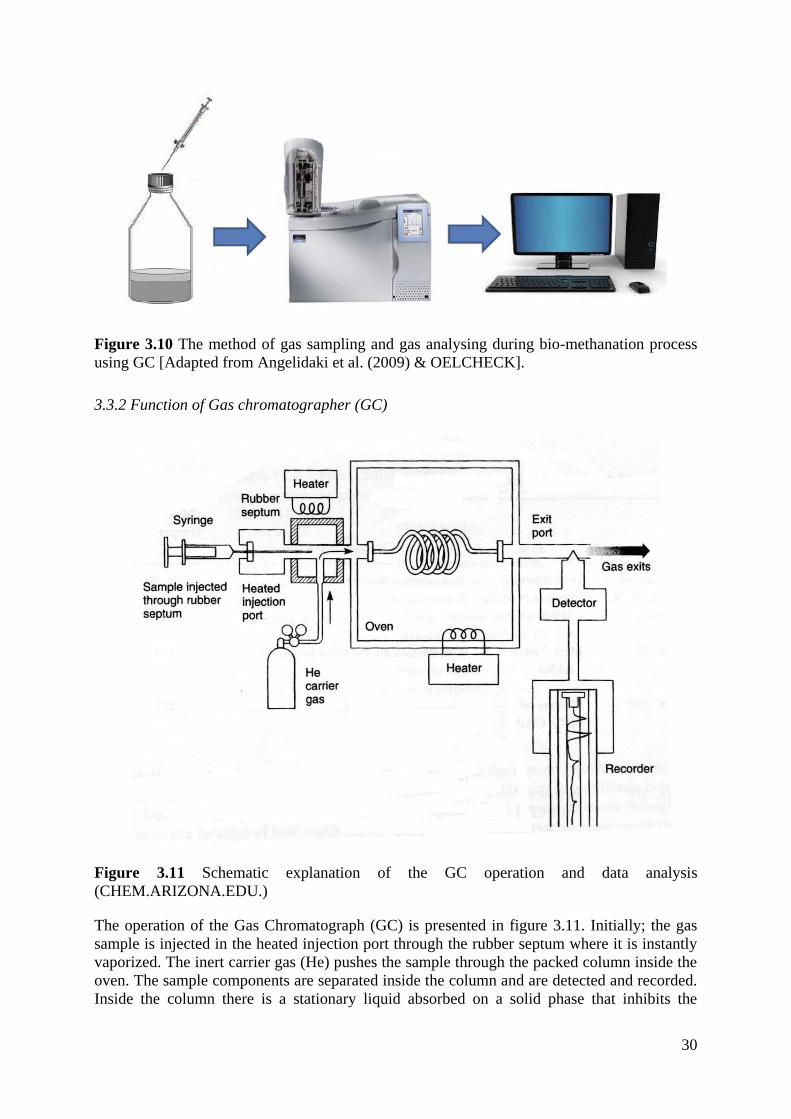
30
Figure 3.10 The method of gas sampling and gas analysing during bio-methanation process
using GC [Adapted from Angelidaki et al. (2009) & OELCHECK].
3.3.2 Function of Gas chromatographer (GC)
Figure 3.11 Schematic explanation of the GC operation and data analysis
(CHEM.ARIZONA.EDU.)
The operation of the Gas Chromatograph (GC) is presented in figure 3.11. Initially; the gas
sample is injected in the heated injection port through the rubber septum where it is instantly
vaporized. The inert carrier gas (He) pushes the sample through the packed column inside the
oven. The sample components are separated inside the column and are detected and recorded.
Inside the column there is a stationary liquid absorbed on a solid phase that inhibits the
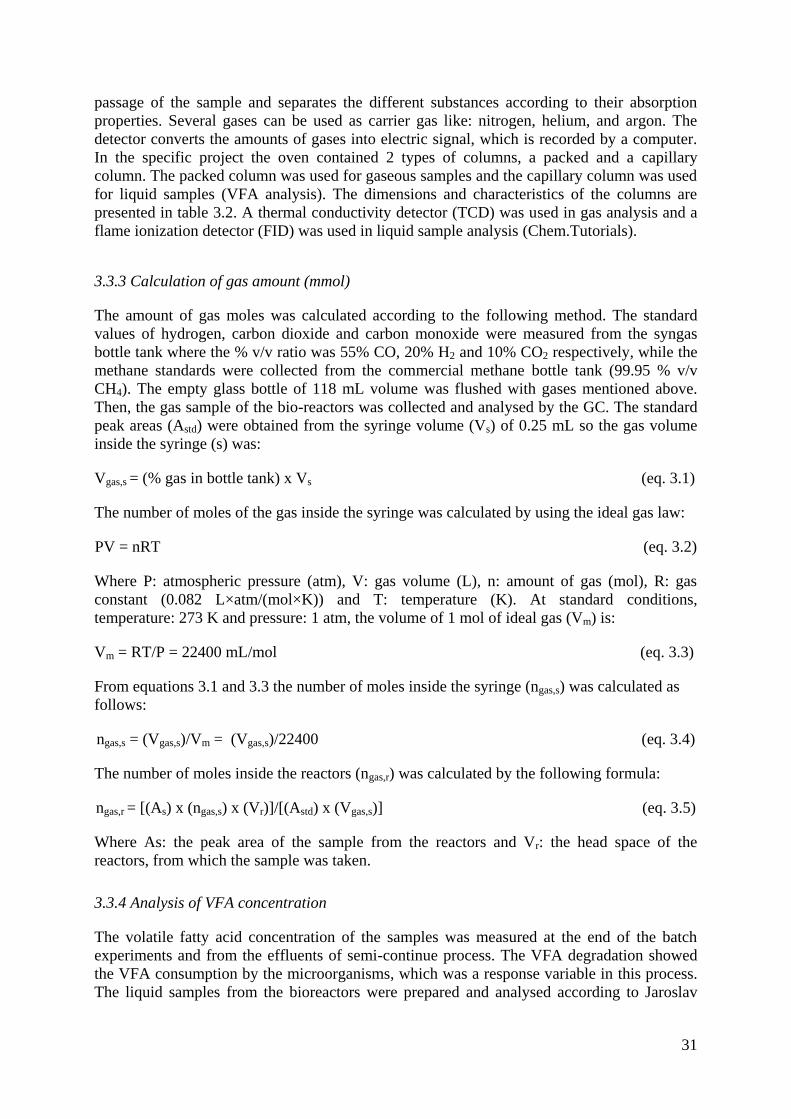
31
passage of the sample and separates the different substances according to their absorption
properties. Several gases can be used as carrier gas like: nitrogen, helium, and argon. The
detector converts the amounts of gases into electric signal, which is recorded by a computer.
In the specific project the oven contained 2 types of columns, a packed and a capillary
column. The packed column was used for gaseous samples and the capillary column was used
for liquid samples (VFA analysis). The dimensions and characteristics of the columns are
presented in table 3.2. A thermal conductivity detector (TCD) was used in gas analysis and a
flame ionization detector (FID) was used in liquid sample analysis (Chem.Tutorials).
3.3.3 Calculation of gas amount (mmol)
The amount of gas moles was calculated according to the following method. The standard
values of hydrogen, carbon dioxide and carbon monoxide were measured from the syngas
bottle tank where the % v/v ratio was 55% CO, 20% H2 and 10% CO2 respectively, while the
methane standards were collected from the commercial methane bottle tank (99.95 % v/v
CH4). The empty glass bottle of 118 mL volume was flushed with gases mentioned above.
Then, the gas sample of the bio-reactors was collected and analysed by the GC. The standard
peak areas (Astd) were obtained from the syringe volume (Vs) of 0.25 mL so the gas volume
inside the syringe (s) was:
Vgas,s = (% gas in bottle tank) x Vs (eq. 3.1)
The number of moles of the gas inside the syringe was calculated by using the ideal gas law:
PV = nRT (eq. 3.2)
Where P: atmospheric pressure (atm), V: gas volume (L), n: amount of gas (mol), R: gas
constant (0.082 L×atm/(mol×K)) and T: temperature (K). At standard conditions,
temperature: 273 K and pressure: 1 atm, the volume of 1 mol of ideal gas (Vm) is:
Vm = RT/P = 22400 mL/mol (eq. 3.3)
From equations 3.1 and 3.3 the number of moles inside the syringe (ngas,s) was calculated as
follows:
ngas,s = (Vgas,s)/Vm = (Vgas,s)/22400 (eq. 3.4)
The number of moles inside the reactors (ngas,r) was calculated by the following formula:
ngas,r = [(As) x (ngas,s) x (Vr)]/[(Astd) x (Vgas,s)] (eq. 3.5)
Where As: the peak area of the sample from the reactors and Vr: the head space of the
reactors, from which the sample was taken.
3.3.4 Analysis of VFA concentration
The volatile fatty acid concentration of the samples was measured at the end of the batch
experiments and from the effluents of semi-continue process. The VFA degradation showed
the VFA consumption by the microorganisms, which was a response variable in this process.
The liquid samples from the bioreactors were prepared and analysed according to Jaroslav
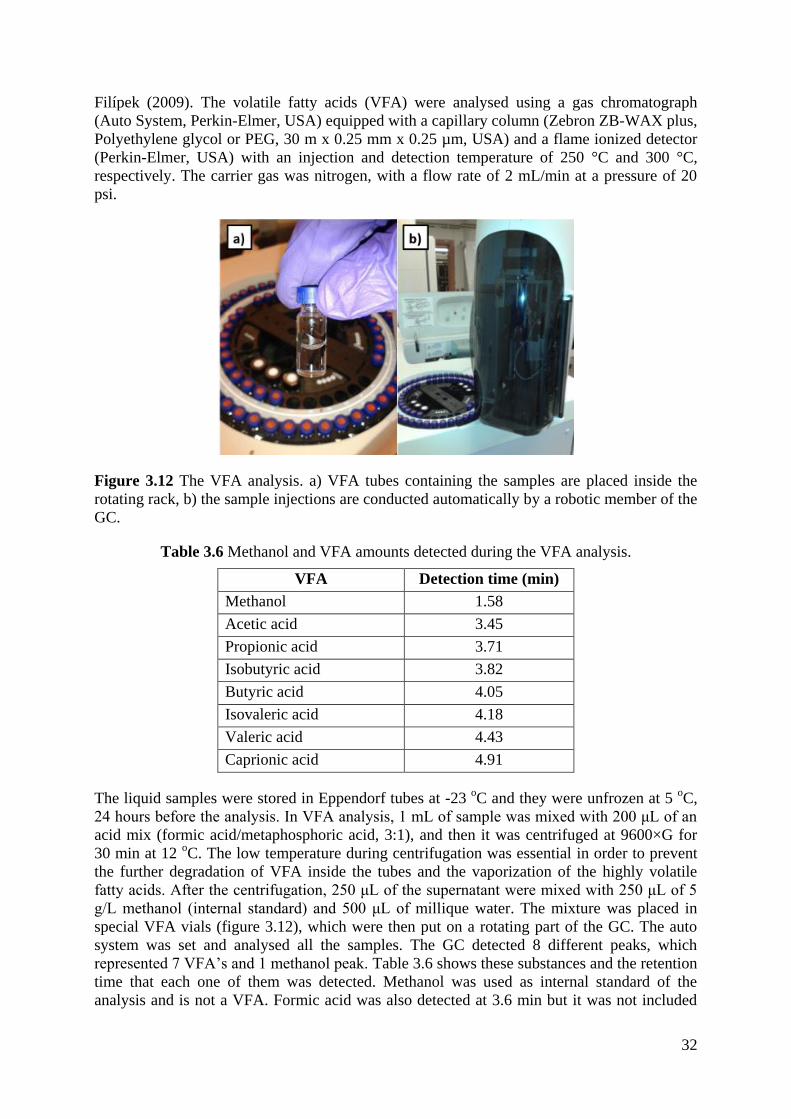
32
Filípek (2009). The volatile fatty acids (VFA) were analysed using a gas chromatograph
(Auto System, Perkin-Elmer, USA) equipped with a capillary column (Zebron ZB-WAX plus,
Polyethylene glycol or PEG, 30 m x 0.25 mm x 0.25 µm, USA) and a flame ionized detector
(Perkin-Elmer, USA) with an injection and detection temperature of 250 °C and 300 °C,
respectively. The carrier gas was nitrogen, with a flow rate of 2 mL/min at a pressure of 20
psi.
Figure 3.12 The VFA analysis. a) VFA tubes containing the samples are placed inside the
rotating rack, b) the sample injections are conducted automatically by a robotic member of the
GC.
Table 3.6 Methanol and VFA amounts detected during the VFA analysis.
VFA Detection time (min)
Methanol 1.58
Acetic acid 3.45
Propionic acid 3.71
Isobutyric acid 3.82
Butyric acid 4.05
Isovaleric acid 4.18
Valeric acid 4.43
Caprionic acid 4.91
The liquid samples were stored in Eppendorf tubes at -23 oC and they were unfrozen at 5
oC,
24 hours before the analysis. In VFA analysis, 1 mL of sample was mixed with 200 μL of an
acid mix (formic acid/metaphosphoric acid, 3:1), and then it was centrifuged at 9600×G for
30 min at 12 oC. The low temperature during centrifugation was essential in order to prevent
the further degradation of VFA inside the tubes and the vaporization of the highly volatile
fatty acids. After the centrifugation, 250 μL of the supernatant were mixed with 250 μL of 5
g/L methanol (internal standard) and 500 μL of millique water. The mixture was placed in
special VFA vials (figure 3.12), which were then put on a rotating part of the GC. The auto
system was set and analysed all the samples. The GC detected 8 different peaks, which
represented 7 VFA’s and 1 methanol peak. Table 3.6 shows these substances and the retention
time that each one of them was detected. Methanol was used as internal standard of the
analysis and is not a VFA. Formic acid was also detected at 3.6 min but it was not included
33
into the results. The detection time of the substances can change according to alterations in
the method settings. 4 standard solutions with specific VFA concentrations were prepared
before the VFA analysis. Formic acid was also detected during the analysis at 3.60 min but it
was not considered in the calculations.
The results from the GC were in form of electric signals that formed peaks on a time line axis.
A horizontal baseline delimited the zero VFA level. The area between the peaks and the
baseline was used for the VFA analysis. Firstly, α was calculated:
y = a x (eq. 3.6)
[VFA]i = {(VFAarea,i)/methanolarea,i}/α (eq. 3.7)
Where, y: VFAarea/methanolarea, [VFA]: VFA concentration, x: [VFA] in standard solutions
and i: sample number.
3.3.4 Dry matter (DM) & volatile solids (VS) analysis
The solid content of a sample without its moisture is called dry matter content (DM) or total
solids (Shih-Perng Tsai). Usually, higher DM gives higher energy yields. To calculate DM,
inoculum samples were put into ceramic cups, weighed and placed inside an oven at 105 oC
for 24 hours. Then, using equation 3.8, the % DM was calculated (Widodo 2008):
% DM = x/y (eq. 3.8)
Where x: the amount of dried inoculum (g) and y: the amount of the sample before drying (g).
After the % DM was calculated, the cups were placed inside a furnace at 540 – 550 oC for 1
hour. Under these conditions, all volatile solids (VS) were removed and only dry ash was left
inside the cups. VS (%) was calculated as follows (Widodo 2008):
% Ash = w/x (eq. 3.9)
% ODM = 100 - % Ash (eq. 3.10)
VS = % ODM x DM (eq. 3.11)
Where w: weight of Ash (g) and ODM: organic dry matter (g).
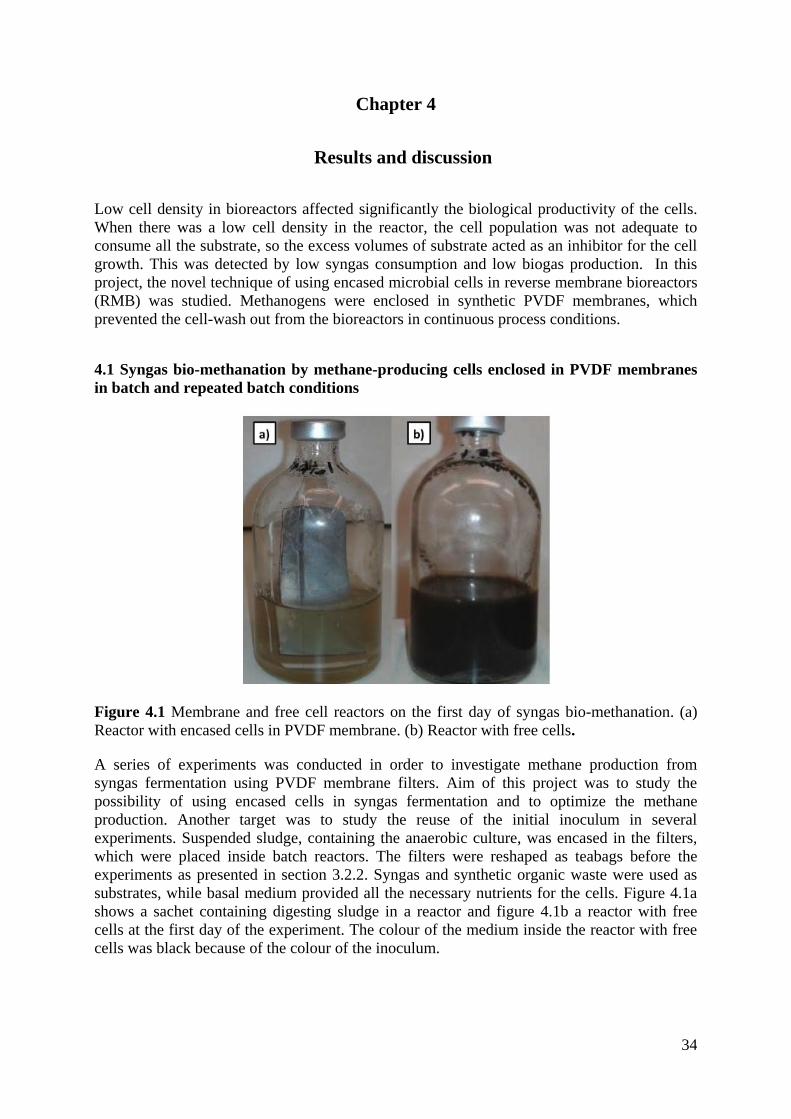
34
Chapter 4
Results and discussion
Low cell density in bioreactors affected significantly the biological productivity of the cells.
When there was a low cell density in the reactor, the cell population was not adequate to
consume all the substrate, so the excess volumes of substrate acted as an inhibitor for the cell
growth. This was detected by low syngas consumption and low biogas production. In this
project, the novel technique of using encased microbial cells in reverse membrane bioreactors
(RMB) was studied. Methanogens were enclosed in synthetic PVDF membranes, which
prevented the cell-wash out from the bioreactors in continuous process conditions.
4.1 Syngas bio-methanation by methane-producing cells enclosed in PVDF membranes
in batch and repeated batch conditions
Figure 4.1 Membrane and free cell reactors on the first day of syngas bio-methanation. (a)
Reactor with encased cells in PVDF membrane. (b) Reactor with free cells.
A series of experiments was conducted in order to investigate methane production from
syngas fermentation using PVDF membrane filters. Aim of this project was to study the
possibility of using encased cells in syngas fermentation and to optimize the methane
production. Another target was to study the reuse of the initial inoculum in several
experiments. Suspended sludge, containing the anaerobic culture, was encased in the filters,
which were placed inside batch reactors. The filters were reshaped as teabags before the
experiments as presented in section 3.2.2. Syngas and synthetic organic waste were used as
substrates, while basal medium provided all the necessary nutrients for the cells. Figure 4.1a
shows a sachet containing digesting sludge in a reactor and figure 4.1b a reactor with free
cells at the first day of the experiment. The colour of the medium inside the reactor with free
cells was black because of the colour of the inoculum.
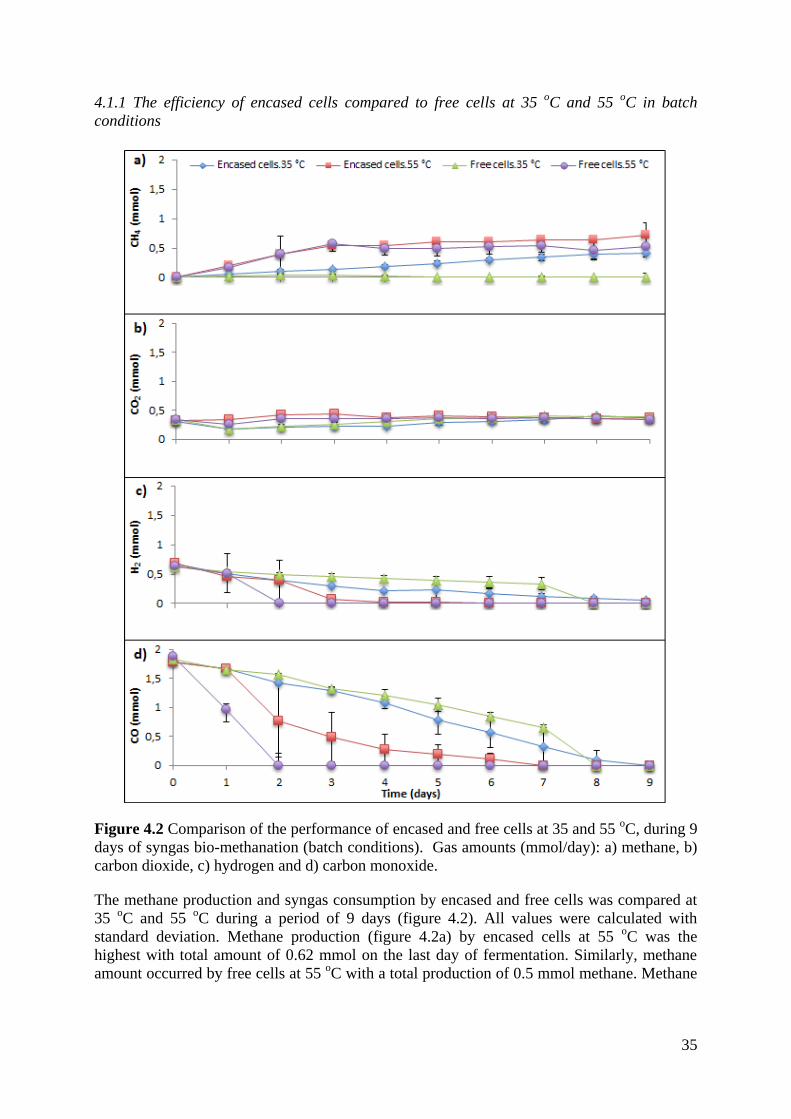
35
4.1.1 The efficiency of encased cells compared to free cells at 35 oC and 55
oC in batch
conditions
Figure 4.2 Comparison of the performance of encased and free cells at 35 and 55 oC, during 9
days of syngas bio-methanation (batch conditions). Gas amounts (mmol/day): a) methane, b)
carbon dioxide, c) hydrogen and d) carbon monoxide.
The methane production and syngas consumption by encased and free cells was compared at
35 oC and 55
oC during a period of 9 days (figure 4.2). All values were calculated with
standard deviation. Methane production (figure 4.2a) by encased cells at 55 oC was the
highest with total amount of 0.62 mmol on the last day of fermentation. Similarly, methane
amount occurred by free cells at 55 oC with a total production of 0.5 mmol methane. Methane
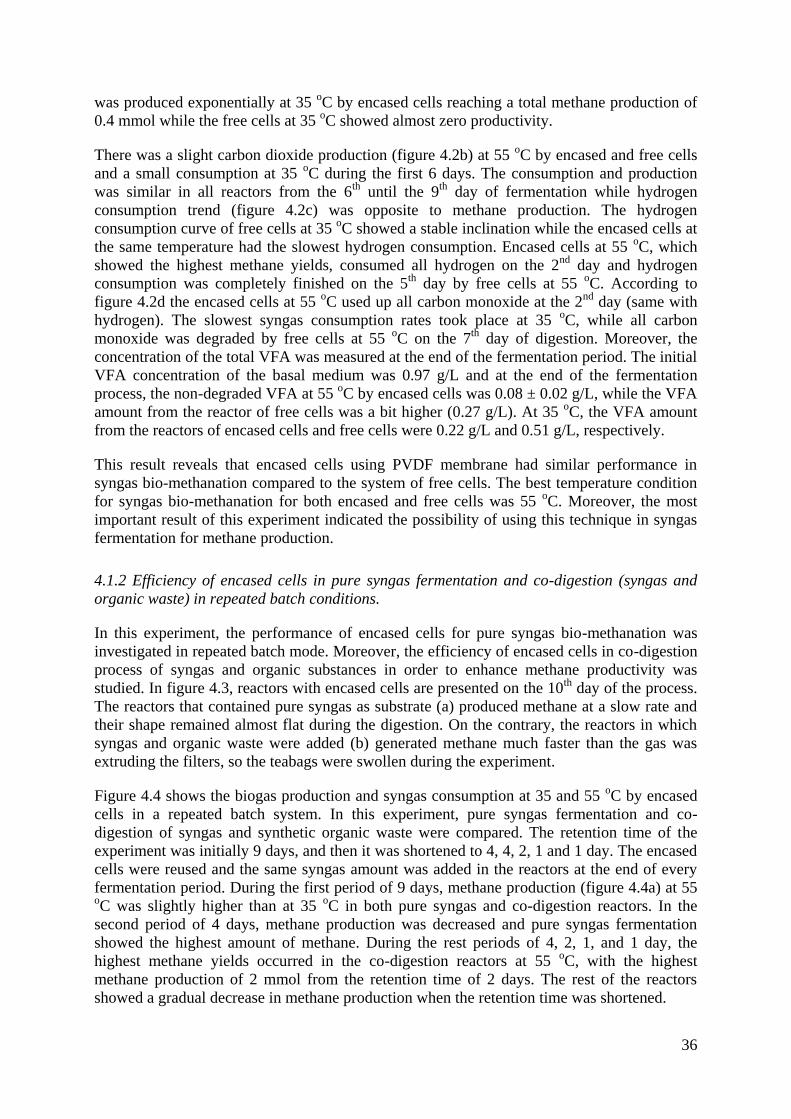
36
was produced exponentially at 35 oC by encased cells reaching a total methane production of
0.4 mmol while the free cells at 35 oC showed almost zero productivity.
There was a slight carbon dioxide production (figure 4.2b) at 55 oC by encased and free cells
and a small consumption at 35 oC during the first 6 days. The consumption and production
was similar in all reactors from the 6th
until the 9th
day of fermentation while hydrogen
consumption trend (figure 4.2c) was opposite to methane production. The hydrogen
consumption curve of free cells at 35 oC showed a stable inclination while the encased cells at
the same temperature had the slowest hydrogen consumption. Encased cells at 55 oC, which
showed the highest methane yields, consumed all hydrogen on the 2nd
day and hydrogen
consumption was completely finished on the 5th
day by free cells at 55 oC. According to
figure 4.2d the encased cells at 55 oC used up all carbon monoxide at the 2
nd day (same with
hydrogen). The slowest syngas consumption rates took place at 35 oC, while all carbon
monoxide was degraded by free cells at 55 oC on the 7
th day of digestion. Moreover, the
concentration of the total VFA was measured at the end of the fermentation period. The initial
VFA concentration of the basal medium was 0.97 g/L and at the end of the fermentation
process, the non-degraded VFA at 55 oC by encased cells was 0.08 ± 0.02 g/L, while the VFA
amount from the reactor of free cells was a bit higher (0.27 g/L). At 35 oC, the VFA amount
from the reactors of encased cells and free cells were 0.22 g/L and 0.51 g/L, respectively.
This result reveals that encased cells using PVDF membrane had similar performance in
syngas bio-methanation compared to the system of free cells. The best temperature condition
for syngas bio-methanation for both encased and free cells was 55 oC. Moreover, the most
important result of this experiment indicated the possibility of using this technique in syngas
fermentation for methane production.
4.1.2 Efficiency of encased cells in pure syngas fermentation and co-digestion (syngas and
organic waste) in repeated batch conditions.
In this experiment, the performance of encased cells for pure syngas bio-methanation was
investigated in repeated batch mode. Moreover, the efficiency of encased cells in co-digestion
process of syngas and organic substances in order to enhance methane productivity was
studied. In figure 4.3, reactors with encased cells are presented on the 10th
day of the process.
The reactors that contained pure syngas as substrate (a) produced methane at a slow rate and
their shape remained almost flat during the digestion. On the contrary, the reactors in which
syngas and organic waste were added (b) generated methane much faster than the gas was
extruding the filters, so the teabags were swollen during the experiment.
Figure 4.4 shows the biogas production and syngas consumption at 35 and 55 oC by encased
cells in a repeated batch system. In this experiment, pure syngas fermentation and co-
digestion of syngas and synthetic organic waste were compared. The retention time of the
experiment was initially 9 days, and then it was shortened to 4, 4, 2, 1 and 1 day. The encased
cells were reused and the same syngas amount was added in the reactors at the end of every
fermentation period. During the first period of 9 days, methane production (figure 4.4a) at 55 oC was slightly higher than at 35
oC in both pure syngas and co-digestion reactors. In the
second period of 4 days, methane production was decreased and pure syngas fermentation
showed the highest amount of methane. During the rest periods of 4, 2, 1, and 1 day, the
highest methane yields occurred in the co-digestion reactors at 55 oC, with the highest
methane production of 2 mmol from the retention time of 2 days. The rest of the reactors
showed a gradual decrease in methane production when the retention time was shortened.
37
Figure 4.3 Reactors containing sachets with inoculum. a) Reactor fed with syngas and b)
reactor fed with syngas and organic waste - fermentation day 10.
During the first 9 days of digestion, carbon dioxide amounts (figure 4.4b) were rather stable
in all reactors. In the 2 following periods of 4 and 4 days, there was a small consumption in
the co-digestion system and low production in pure syngas fermentation at 35 and 55 oC.
Finally, in the last days carbon dioxide amounts in all reactors were almost stable. The fastest
hydrogen consumption (figure 4.4c) was detected in co-digestion at 55 oC where all hydrogen
was depleted on the 5th
day of fermentation. Similar consumption occurred in all reactors
during the rest of the fermentation process. During pure syngas fermentation at 55 oC, a small
amount of hydrogen was produced on the 2 periods of 4 days and hydrogen consumption was
reduced after the first digestion period. Carbon monoxide consumption (figure 4.4d) was
faster at 55 oC than at 35
oC in the first 3 periods (9, 4 and 4 days). In the last periods (2, 1
and 1 day) the carbon monoxide consumption was decreased in all reactors.
Table 4.1 shows the amount of VFA at the end of fermentation process by encased cells at 35 oC and 55
oC in pure syngas fermentation and co-digestion of syngas and organic substances.
In pure syngas fermentation the initial VFA concentration was 0.87 g/L. At 55 oC the VFA
consumption was higher than at 35 oC. The VFA consumption decreased at 55
oC as the
retention time was gradually shortened. At 55 oC the VFA concentration rised from the 1
st till
the 4th
period but it decreased in the last 2 periods. The lowest VFA concentrations were
detected at the end of the first period at 55 oC (0.08 g/L) and at 35
oC (0.22 g/L).
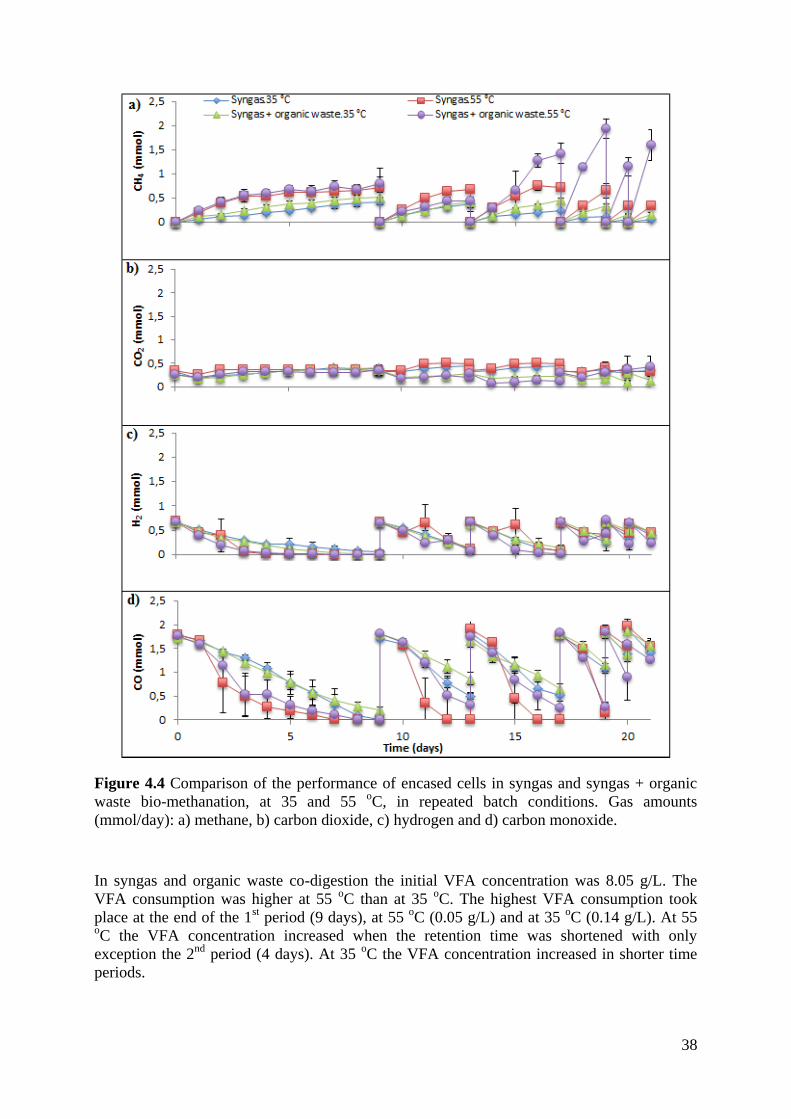
38
Figure 4.4 Comparison of the performance of encased cells in syngas and syngas + organic
waste bio-methanation, at 35 and 55 oC, in repeated batch conditions. Gas amounts
(mmol/day): a) methane, b) carbon dioxide, c) hydrogen and d) carbon monoxide.
In syngas and organic waste co-digestion the initial VFA concentration was 8.05 g/L. The
VFA consumption was higher at 55 oC than at 35
oC. The highest VFA consumption took
place at the end of the 1st period (9 days), at 55
oC (0.05 g/L) and at 35
oC (0.14 g/L). At 55
oC the VFA concentration increased when the retention time was shortened with only
exception the 2nd
period (4 days). At 35 oC the VFA concentration increased in shorter time
periods.
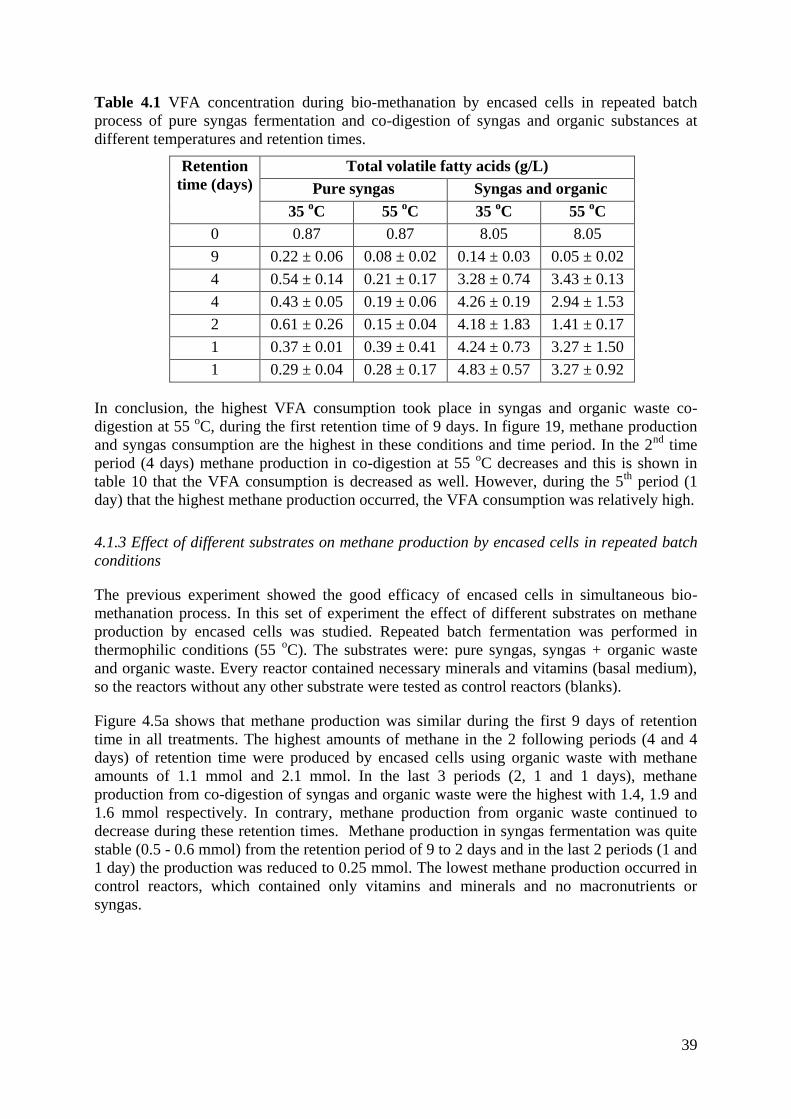
39
Table 4.1 VFA concentration during bio-methanation by encased cells in repeated batch
process of pure syngas fermentation and co-digestion of syngas and organic substances at
different temperatures and retention times.
Retention
time (days)
Total volatile fatty acids (g/L)
Pure syngas Syngas and organic
waste 35 oC 55
oC 35
oC 55
oC
0 0.87 0.87 8.05 8.05
9 0.22 ± 0.06 0.08 ± 0.02 0.14 ± 0.03 0.05 ± 0.02
4 0.54 ± 0.14 0.21 ± 0.17 3.28 ± 0.74 3.43 ± 0.13
4 0.43 ± 0.05 0.19 ± 0.06 4.26 ± 0.19 2.94 ± 1.53
2 0.61 ± 0.26 0.15 ± 0.04 4.18 ± 1.83 1.41 ± 0.17
1 0.37 ± 0.01 0.39 ± 0.41 4.24 ± 0.73 3.27 ± 1.50
1 0.29 ± 0.04 0.28 ± 0.17 4.83 ± 0.57 3.27 ± 0.92
In conclusion, the highest VFA consumption took place in syngas and organic waste co-
digestion at 55 oC, during the first retention time of 9 days. In figure 19, methane production
and syngas consumption are the highest in these conditions and time period. In the 2nd
time
period (4 days) methane production in co-digestion at 55 oC decreases and this is shown in
table 10 that the VFA consumption is decreased as well. However, during the 5th
period (1
day) that the highest methane production occurred, the VFA consumption was relatively high.
4.1.3 Effect of different substrates on methane production by encased cells in repeated batch
conditions
The previous experiment showed the good efficacy of encased cells in simultaneous bio-
methanation process. In this set of experiment the effect of different substrates on methane
production by encased cells was studied. Repeated batch fermentation was performed in
thermophilic conditions (55 oC). The substrates were: pure syngas, syngas + organic waste
and organic waste. Every reactor contained necessary minerals and vitamins (basal medium),
so the reactors without any other substrate were tested as control reactors (blanks).
Figure 4.5a shows that methane production was similar during the first 9 days of retention
time in all treatments. The highest amounts of methane in the 2 following periods (4 and 4
days) of retention time were produced by encased cells using organic waste with methane
amounts of 1.1 mmol and 2.1 mmol. In the last 3 periods (2, 1 and 1 days), methane
production from co-digestion of syngas and organic waste were the highest with 1.4, 1.9 and
1.6 mmol respectively. In contrary, methane production from organic waste continued to
decrease during these retention times. Methane production in syngas fermentation was quite
stable (0.5 - 0.6 mmol) from the retention period of 9 to 2 days and in the last 2 periods (1 and
1 day) the production was reduced to 0.25 mmol. The lowest methane production occurred in
control reactors, which contained only vitamins and minerals and no macronutrients or
syngas.
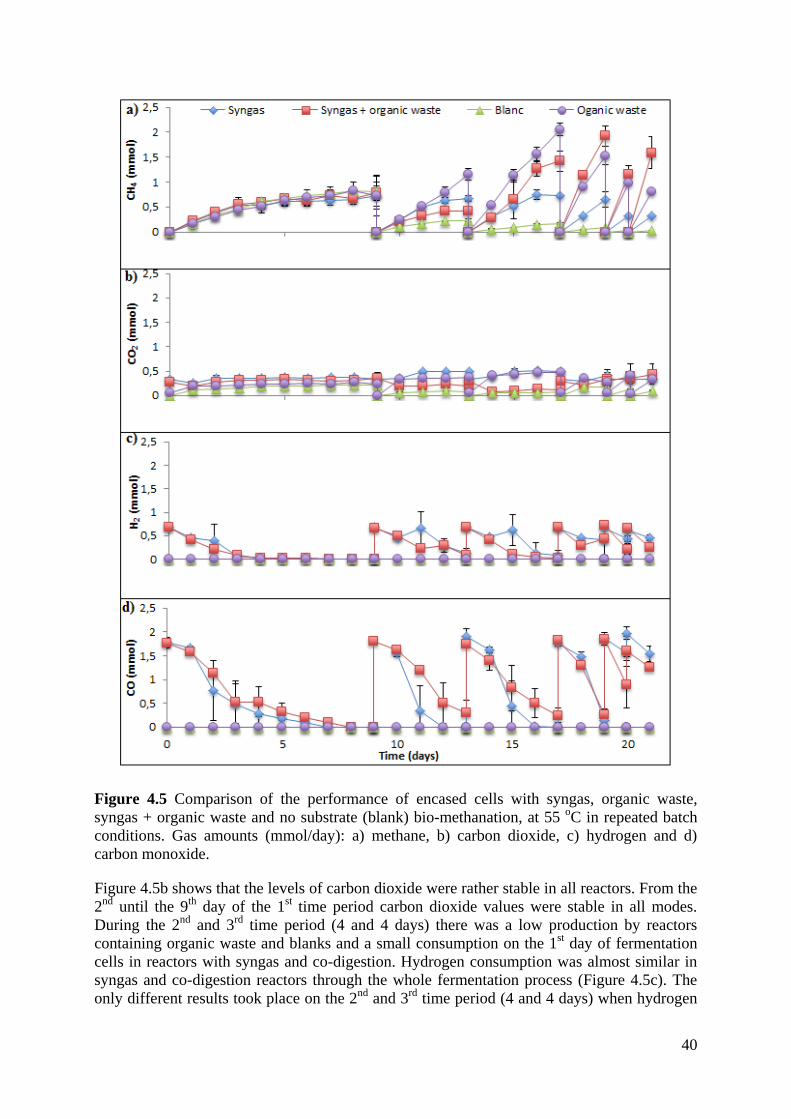
40
Figure 4.5 Comparison of the performance of encased cells with syngas, organic waste,
syngas + organic waste and no substrate (blank) bio-methanation, at 55 oC in repeated batch
conditions. Gas amounts (mmol/day): a) methane, b) carbon dioxide, c) hydrogen and d)
carbon monoxide.
Figure 4.5b shows that the levels of carbon dioxide were rather stable in all reactors. From the
2nd
until the 9th
day of the 1st time period carbon dioxide values were stable in all modes.
During the 2nd
and 3rd
time period (4 and 4 days) there was a low production by reactors
containing organic waste and blanks and a small consumption on the 1st day of fermentation
cells in reactors with syngas and co-digestion. Hydrogen consumption was almost similar in
syngas and co-digestion reactors through the whole fermentation process (Figure 4.5c). The
only different results took place on the 2nd
and 3rd
time period (4 and 4 days) when hydrogen
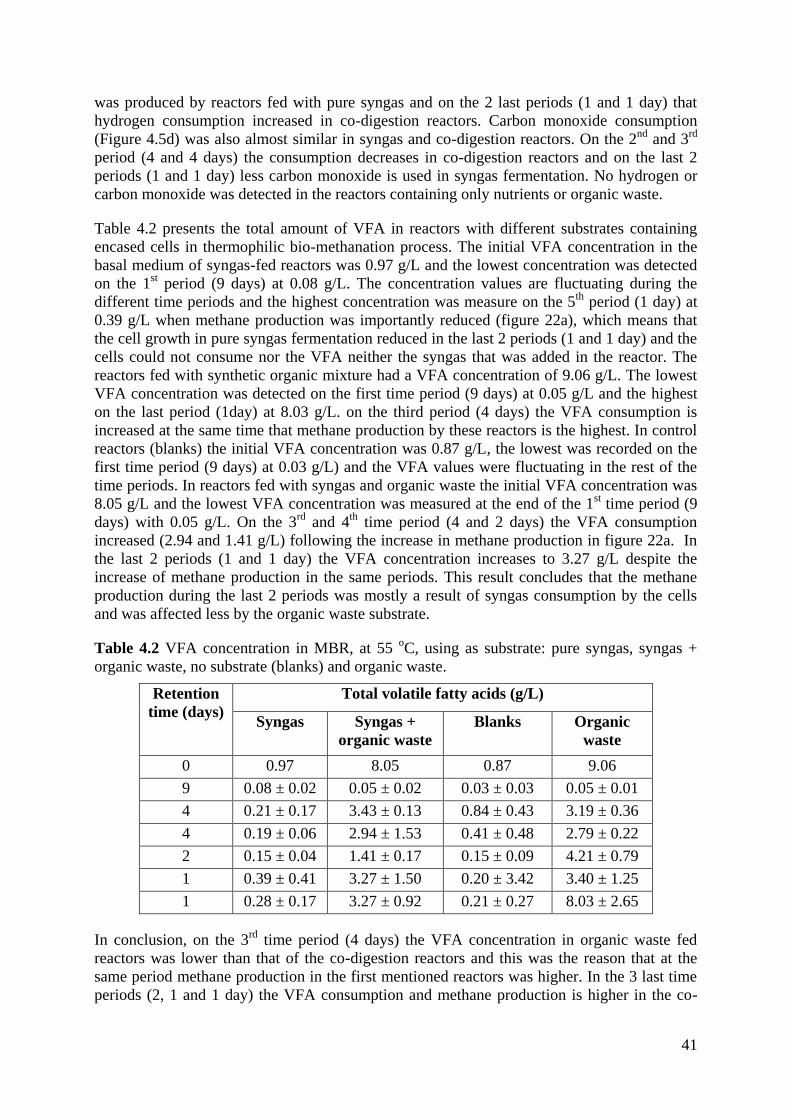
41
was produced by reactors fed with pure syngas and on the 2 last periods (1 and 1 day) that
hydrogen consumption increased in co-digestion reactors. Carbon monoxide consumption
(Figure 4.5d) was also almost similar in syngas and co-digestion reactors. On the 2nd
and 3rd
period (4 and 4 days) the consumption decreases in co-digestion reactors and on the last 2
periods (1 and 1 day) less carbon monoxide is used in syngas fermentation. No hydrogen or
carbon monoxide was detected in the reactors containing only nutrients or organic waste.
Table 4.2 presents the total amount of VFA in reactors with different substrates containing
encased cells in thermophilic bio-methanation process. The initial VFA concentration in the
basal medium of syngas-fed reactors was 0.97 g/L and the lowest concentration was detected
on the 1st period (9 days) at 0.08 g/L. The concentration values are fluctuating during the
different time periods and the highest concentration was measure on the 5th
period (1 day) at
0.39 g/L when methane production was importantly reduced (figure 22a), which means that
the cell growth in pure syngas fermentation reduced in the last 2 periods (1 and 1 day) and the
cells could not consume nor the VFA neither the syngas that was added in the reactor. The
reactors fed with synthetic organic mixture had a VFA concentration of 9.06 g/L. The lowest
VFA concentration was detected on the first time period (9 days) at 0.05 g/L and the highest
on the last period (1day) at 8.03 g/L. on the third period (4 days) the VFA consumption is
increased at the same time that methane production by these reactors is the highest. In control
reactors (blanks) the initial VFA concentration was 0.87 g/L, the lowest was recorded on the
first time period (9 days) at 0.03 g/L) and the VFA values were fluctuating in the rest of the
time periods. In reactors fed with syngas and organic waste the initial VFA concentration was
8.05 g/L and the lowest VFA concentration was measured at the end of the 1st time period (9
days) with 0.05 g/L. On the 3rd
and 4th
time period (4 and 2 days) the VFA consumption
increased (2.94 and 1.41 g/L) following the increase in methane production in figure 22a. In
the last 2 periods (1 and 1 day) the VFA concentration increases to 3.27 g/L despite the
increase of methane production in the same periods. This result concludes that the methane
production during the last 2 periods was mostly a result of syngas consumption by the cells
and was affected less by the organic waste substrate.
Table 4.2 VFA concentration in MBR, at 55 oC, using as substrate: pure syngas, syngas +
organic waste, no substrate (blanks) and organic waste.
Retention
time (days)
Total volatile fatty acids (g/L)
Syngas Syngas +
organic waste
Blanks Organic
waste
0 0.97 8.05 0.87 9.06
9 0.08 ± 0.02 0.05 ± 0.02 0.03 ± 0.03 0.05 ± 0.01
4 0.21 ± 0.17 3.43 ± 0.13 0.84 ± 0.43 3.19 ± 0.36
4 0.19 ± 0.06 2.94 ± 1.53 0.41 ± 0.48 2.79 ± 0.22
2 0.15 ± 0.04 1.41 ± 0.17 0.15 ± 0.09 4.21 ± 0.79
1 0.39 ± 0.41 3.27 ± 1.50 0.20 ± 3.42 3.40 ± 1.25
1 0.28 ± 0.17 3.27 ± 0.92 0.21 ± 0.27 8.03 ± 2.65
In conclusion, on the 3rd
time period (4 days) the VFA concentration in organic waste fed
reactors was lower than that of the co-digestion reactors and this was the reason that at the
same period methane production in the first mentioned reactors was higher. In the 3 last time
periods (2, 1 and 1 day) the VFA consumption and methane production is higher in the co-
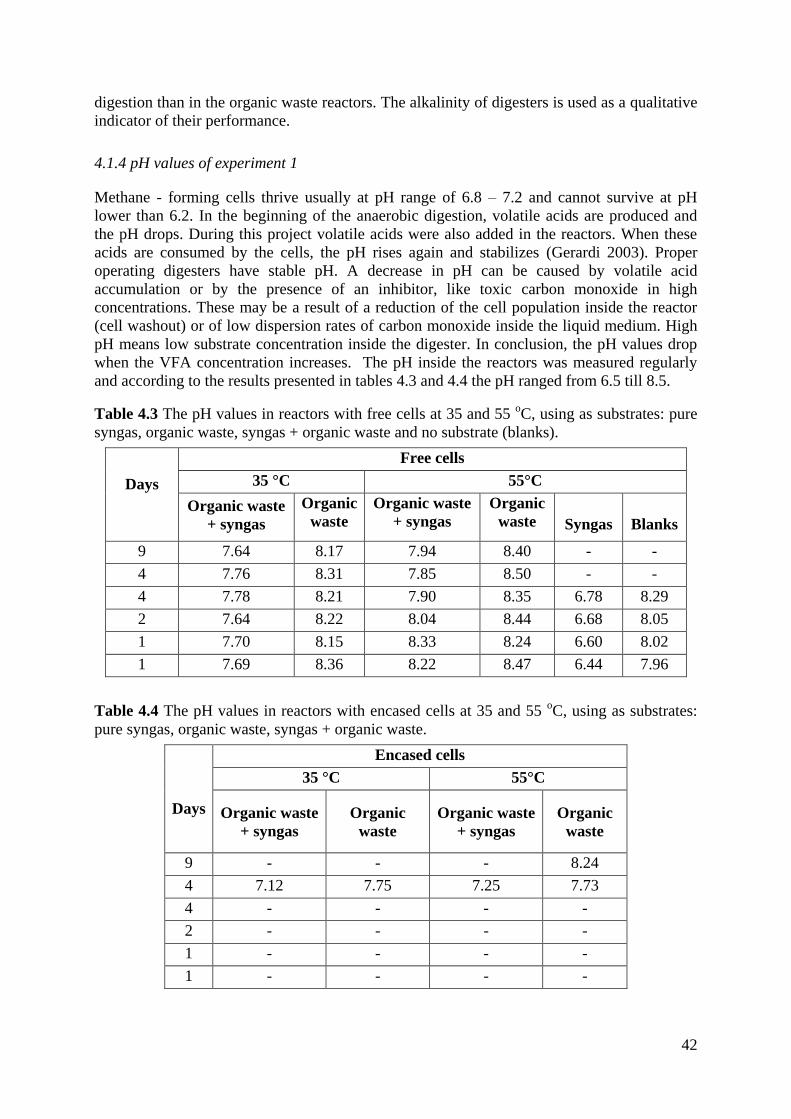
42
digestion than in the organic waste reactors. The alkalinity of digesters is used as a qualitative
indicator of their performance.
4.1.4 pH values of experiment 1
Methane - forming cells thrive usually at pH range of 6.8 – 7.2 and cannot survive at pH
lower than 6.2. In the beginning of the anaerobic digestion, volatile acids are produced and
the pH drops. During this project volatile acids were also added in the reactors. When these
acids are consumed by the cells, the pH rises again and stabilizes (Gerardi 2003). Proper
operating digesters have stable pH. A decrease in pH can be caused by volatile acid
accumulation or by the presence of an inhibitor, like toxic carbon monoxide in high
concentrations. These may be a result of a reduction of the cell population inside the reactor
(cell washout) or of low dispersion rates of carbon monoxide inside the liquid medium. High
pH means low substrate concentration inside the digester. In conclusion, the pH values drop
when the VFA concentration increases. The pH inside the reactors was measured regularly
and according to the results presented in tables 4.3 and 4.4 the pH ranged from 6.5 till 8.5.
Table 4.3 The pH values in reactors with free cells at 35 and 55 oC, using as substrates: pure
syngas, organic waste, syngas + organic waste and no substrate (blanks).
Days
Free cells
35 °C 55°C
Organic waste
+ syngas
Organic
waste
Organic waste
+ syngas
Organic
waste Syngas Blanks
9 7.64 8.17 7.94 8.40 - -
4 7.76 8.31 7.85 8.50 - -
4 7.78 8.21 7.90 8.35 6.78 8.29
2 7.64 8.22 8.04 8.44 6.68 8.05
1 7.70 8.15 8.33 8.24 6.60 8.02
1 7.69 8.36 8.22 8.47 6.44 7.96
Table 4.4 The pH values in reactors with encased cells at 35 and 55 oC, using as substrates:
pure syngas, organic waste, syngas + organic waste.
Days
Encased cells
35 °C 55°C
Organic waste
+ syngas
Organic
waste
Organic waste
+ syngas
Organic
waste
9 - - - 8.24
4 7.12 7.75 7.25 7.73
4 - - - -
2 - - - -
1 - - - -
1 - - - -
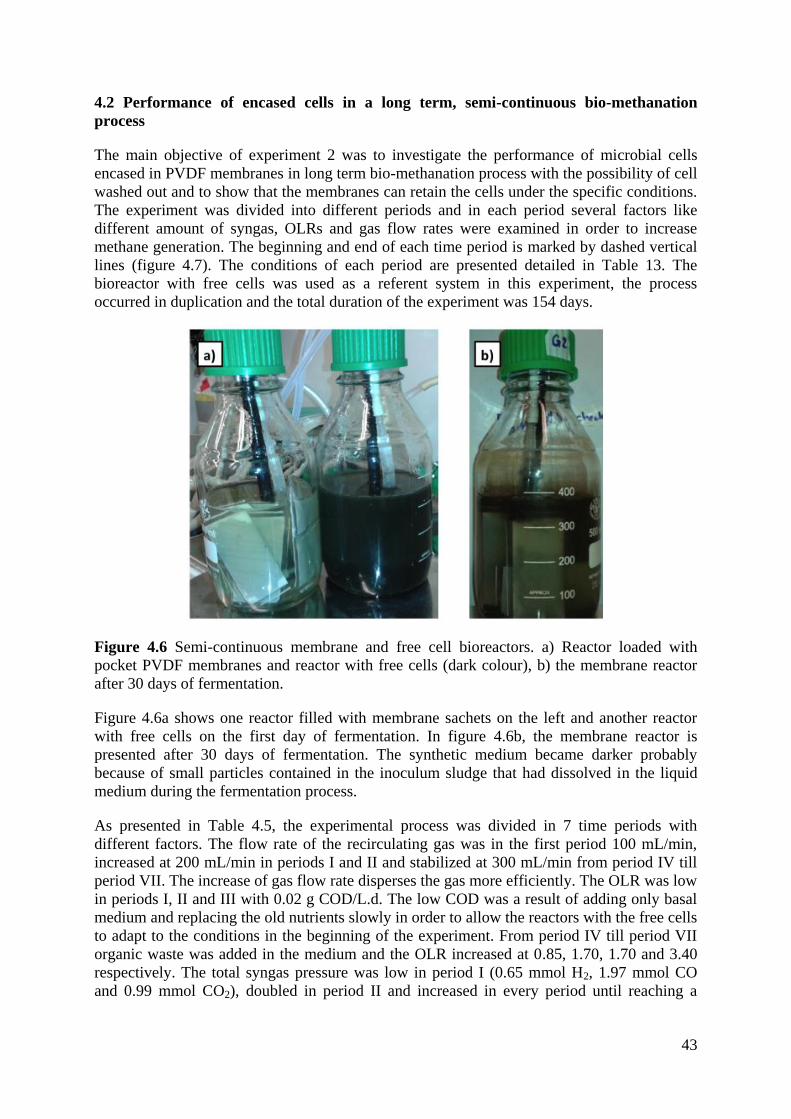
43
4.2 Performance of encased cells in a long term, semi-continuous bio-methanation
process
The main objective of experiment 2 was to investigate the performance of microbial cells
encased in PVDF membranes in long term bio-methanation process with the possibility of cell
washed out and to show that the membranes can retain the cells under the specific conditions.
The experiment was divided into different periods and in each period several factors like
different amount of syngas, OLRs and gas flow rates were examined in order to increase
methane generation. The beginning and end of each time period is marked by dashed vertical
lines (figure 4.7). The conditions of each period are presented detailed in Table 13. The
bioreactor with free cells was used as a referent system in this experiment, the process
occurred in duplication and the total duration of the experiment was 154 days.
Figure 4.6 Semi-continuous membrane and free cell bioreactors. a) Reactor loaded with
pocket PVDF membranes and reactor with free cells (dark colour), b) the membrane reactor
after 30 days of fermentation.
Figure 4.6a shows one reactor filled with membrane sachets on the left and another reactor
with free cells on the first day of fermentation. In figure 4.6b, the membrane reactor is
presented after 30 days of fermentation. The synthetic medium became darker probably
because of small particles contained in the inoculum sludge that had dissolved in the liquid
medium during the fermentation process.
As presented in Table 4.5, the experimental process was divided in 7 time periods with
different factors. The flow rate of the recirculating gas was in the first period 100 mL/min,
increased at 200 mL/min in periods I and II and stabilized at 300 mL/min from period IV till
period VII. The increase of gas flow rate disperses the gas more efficiently. The OLR was low
in periods I, II and III with 0.02 g COD/L.d. The low COD was a result of adding only basal
medium and replacing the old nutrients slowly in order to allow the reactors with the free cells
to adapt to the conditions in the beginning of the experiment. From period IV till period VII
organic waste was added in the medium and the OLR increased at 0.85, 1.70, 1.70 and 3.40
respectively. The total syngas pressure was low in period I (0.65 mmol H2, 1.97 mmol CO
and 0.99 mmol CO2), doubled in period II and increased in every period until reaching a
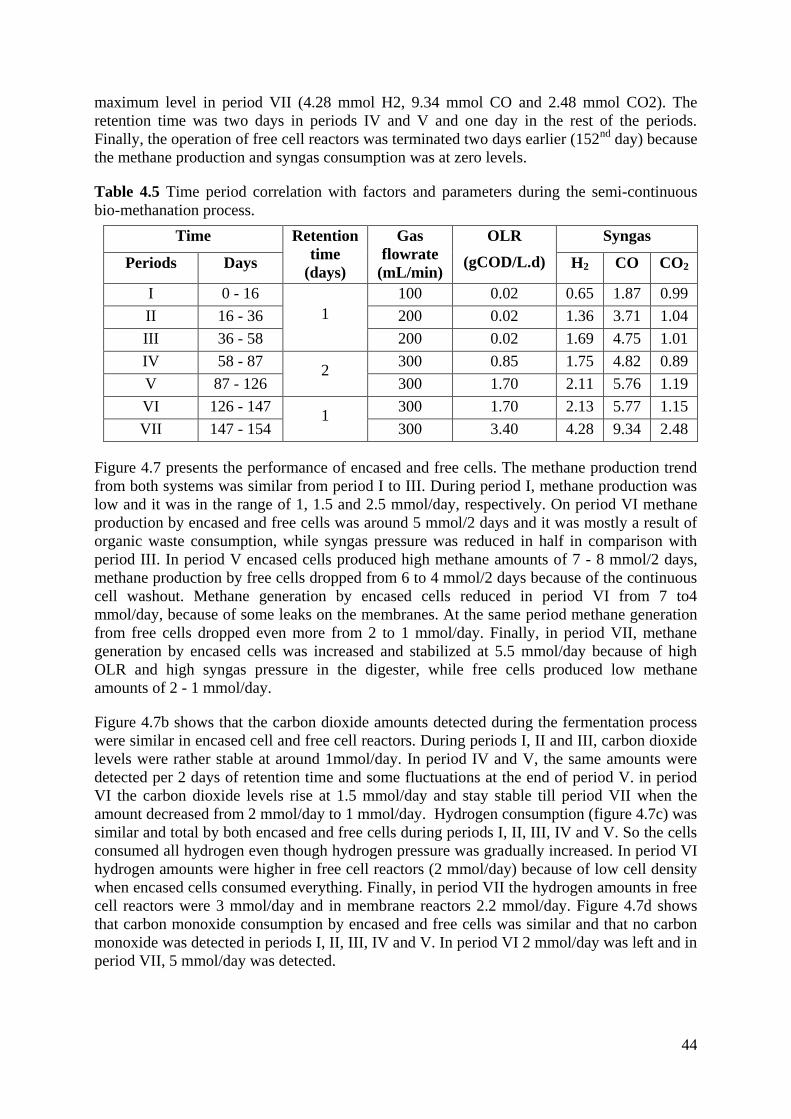
44
maximum level in period VII (4.28 mmol H2, 9.34 mmol CO and 2.48 mmol CO2). The
retention time was two days in periods IV and V and one day in the rest of the periods.
Finally, the operation of free cell reactors was terminated two days earlier (152nd
day) because
the methane production and syngas consumption was at zero levels.
Table 4.5 Time period correlation with factors and parameters during the semi-continuous
bio-methanation process.
Time Retention
time
(days)
Gas
flowrate
(mL/min)
OLR
(gCOD/L.d)
Syngas
Periods Days H2 CO CO2
I 0 - 16
1
100 0.02 0.65 1.87 0.99
II 16 - 36 200 0.02 1.36 3.71 1.04
III 36 - 58 200 0.02 1.69 4.75 1.01
IV 58 - 87 2
300 0.85 1.75 4.82 0.89
V 87 - 126 300 1.70 2.11 5.76 1.19
VI 126 - 147 1
300 1.70 2.13 5.77 1.15
VII 147 - 154 300 3.40 4.28 9.34 2.48
Figure 4.7 presents the performance of encased and free cells. The methane production trend
from both systems was similar from period I to III. During period I, methane production was
low and it was in the range of 1, 1.5 and 2.5 mmol/day, respectively. On period VI methane
production by encased and free cells was around 5 mmol/2 days and it was mostly a result of
organic waste consumption, while syngas pressure was reduced in half in comparison with
period III. In period V encased cells produced high methane amounts of 7 - 8 mmol/2 days,
methane production by free cells dropped from 6 to 4 mmol/2 days because of the continuous
cell washout. Methane generation by encased cells reduced in period VI from 7 to4
mmol/day, because of some leaks on the membranes. At the same period methane generation
from free cells dropped even more from 2 to 1 mmol/day. Finally, in period VII, methane
generation by encased cells was increased and stabilized at 5.5 mmol/day because of high
OLR and high syngas pressure in the digester, while free cells produced low methane
amounts of 2 - 1 mmol/day.
Figure 4.7b shows that the carbon dioxide amounts detected during the fermentation process
were similar in encased cell and free cell reactors. During periods I, II and III, carbon dioxide
levels were rather stable at around 1mmol/day. In period IV and V, the same amounts were
detected per 2 days of retention time and some fluctuations at the end of period V. in period
VI the carbon dioxide levels rise at 1.5 mmol/day and stay stable till period VII when the
amount decreased from 2 mmol/day to 1 mmol/day. Hydrogen consumption (figure 4.7c) was
similar and total by both encased and free cells during periods I, II, III, IV and V. So the cells
consumed all hydrogen even though hydrogen pressure was gradually increased. In period VI
hydrogen amounts were higher in free cell reactors (2 mmol/day) because of low cell density
when encased cells consumed everything. Finally, in period VII the hydrogen amounts in free
cell reactors were 3 mmol/day and in membrane reactors 2.2 mmol/day. Figure 4.7d shows
that carbon monoxide consumption by encased and free cells was similar and that no carbon
monoxide was detected in periods I, II, III, IV and V. In period VI 2 mmol/day was left and in
period VII, 5 mmol/day was detected.
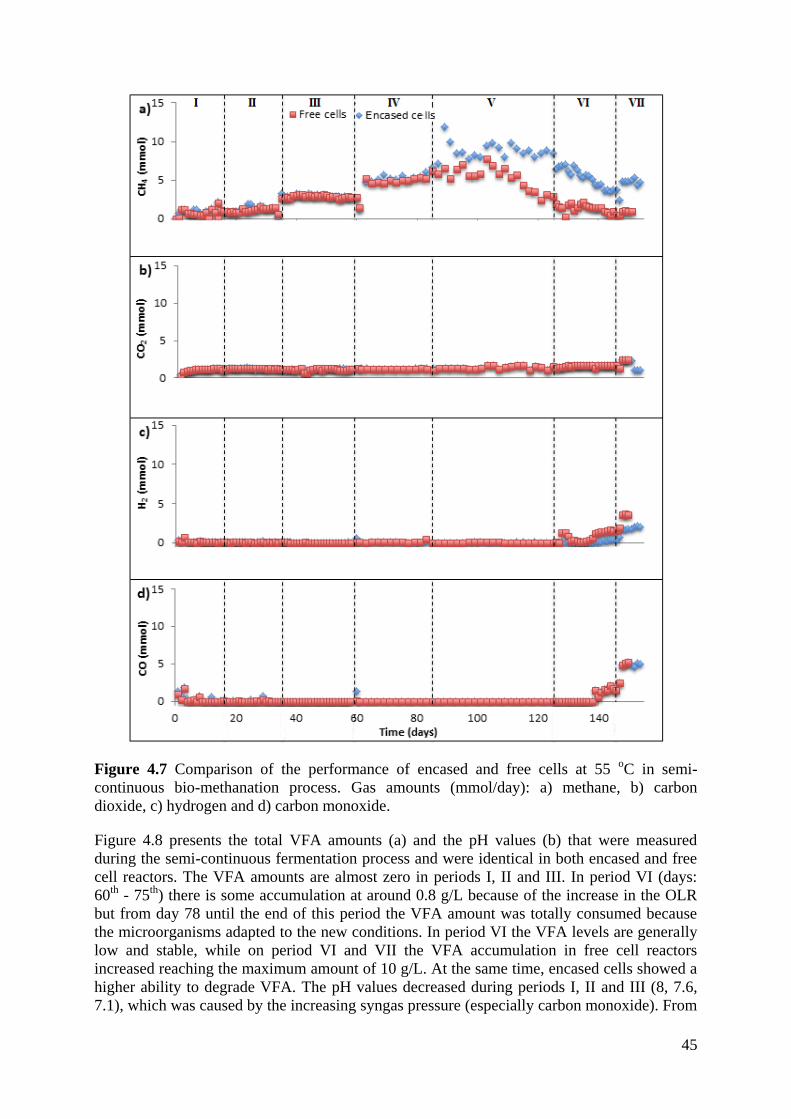
45
Figure 4.7 Comparison of the performance of encased and free cells at 55 oC in semi-
continuous bio-methanation process. Gas amounts (mmol/day): a) methane, b) carbon
dioxide, c) hydrogen and d) carbon monoxide.
Figure 4.8 presents the total VFA amounts (a) and the pH values (b) that were measured
during the semi-continuous fermentation process and were identical in both encased and free
cell reactors. The VFA amounts are almost zero in periods I, II and III. In period VI (days:
60th
- 75th
) there is some accumulation at around 0.8 g/L because of the increase in the OLR
but from day 78 until the end of this period the VFA amount was totally consumed because
the microorganisms adapted to the new conditions. In period VI the VFA levels are generally
low and stable, while on period VI and VII the VFA accumulation in free cell reactors
increased reaching the maximum amount of 10 g/L. At the same time, encased cells showed a
higher ability to degrade VFA. The pH values decreased during periods I, II and III (8, 7.6,
7.1), which was caused by the increasing syngas pressure (especially carbon monoxide). From
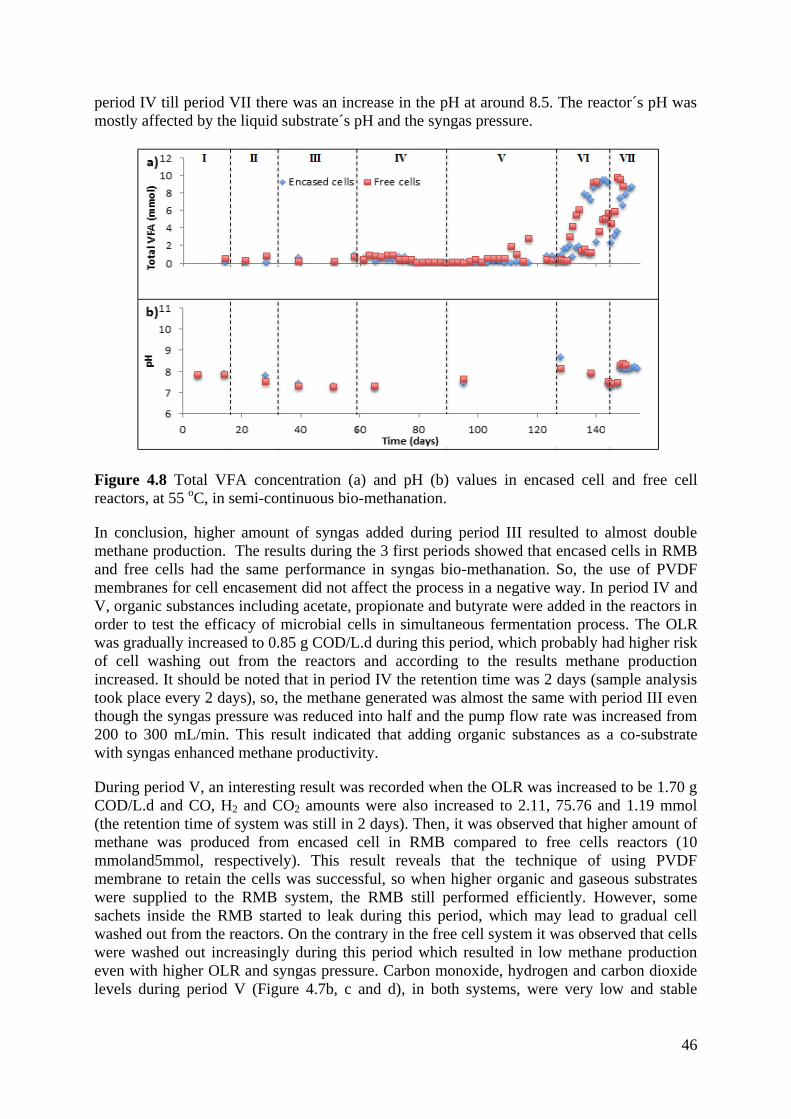
46
period IV till period VII there was an increase in the pH at around 8.5. The reactor´s pH was
mostly affected by the liquid substrate´s pH and the syngas pressure.
Figure 4.8 Total VFA concentration (a) and pH (b) values in encased cell and free cell
reactors, at 55 oC, in semi-continuous bio-methanation.
In conclusion, higher amount of syngas added during period III resulted to almost double
methane production. The results during the 3 first periods showed that encased cells in RMB
and free cells had the same performance in syngas bio-methanation. So, the use of PVDF
membranes for cell encasement did not affect the process in a negative way. In period IV and
V, organic substances including acetate, propionate and butyrate were added in the reactors in
order to test the efficacy of microbial cells in simultaneous fermentation process. The OLR
was gradually increased to 0.85 g COD/L.d during this period, which probably had higher risk
of cell washing out from the reactors and according to the results methane production
increased. It should be noted that in period IV the retention time was 2 days (sample analysis
took place every 2 days), so, the methane generated was almost the same with period III even
though the syngas pressure was reduced into half and the pump flow rate was increased from
200 to 300 mL/min. This result indicated that adding organic substances as a co-substrate
with syngas enhanced methane productivity.
During period V, an interesting result was recorded when the OLR was increased to be 1.70 g
COD/L.d and CO, H2 and CO2 amounts were also increased to 2.11, 75.76 and 1.19 mmol
(the retention time of system was still in 2 days). Then, it was observed that higher amount of
methane was produced from encased cell in RMB compared to free cells reactors (10
mmoland5mmol, respectively). This result reveals that the technique of using PVDF
membrane to retain the cells was successful, so when higher organic and gaseous substrates
were supplied to the RMB system, the RMB still performed efficiently. However, some
sachets inside the RMB started to leak during this period, which may lead to gradual cell
washed out from the reactors. On the contrary in the free cell system it was observed that cells
were washed out increasingly during this period which resulted in low methane production
even with higher OLR and syngas pressure. Carbon monoxide, hydrogen and carbon dioxide
levels during period V (Figure 4.7b, c and d), in both systems, were very low and stable
47
through the co-digestion process of syngas and organic substances. This indicated that
microorganisms contained in both reactors were still capable to consumed syngas efficiently.
Also, it meant that the total digestion of the co-substrate (organic waste) (Figure 4.8a) by the
microorganisms resulted in high methane productivity. When during period VI the retention
time was shortened to 1 day and the conditions of organic and gaseous substrates were the
same with the previous period, the trend of methane generation and substrate consumption
were changed. Methane production from both reactors declined continuously (Figure 4.7a).
Therefore, higher methane amount was still produced from the RMB compared to the reactor
of free cells. The average methane amount during this period from RMB and the reactor of
free cells were as stated before 6 -7 mmol/day and 2 mmol/day respectively. Accordingly,
syngas started to accumulate at the end of this period. It was observed that hydrogen was the
first gas, which started to accumulate (125th
day). The free cell reactor showed the lowest
hydrogen consumption by that time. Carbon monoxide levels started to increase on the 139th
day in both reactors. The amount of carbon dioxide was not different from the previous
period. In addition, Figure 4.8a indicates the continuous accumulation of VFA during this
period. The amount of total VFA at the end of this period in both systems was around 10 g/L.
This means that the organic substances were not completely used by methane-producing
microorganisms. The high concentration of VFA in co-digestion process most likely inhibited
the metabolism of microorganisms and resulted in decreasing methane productivity.
Although, methane production decreased continuously in the previous period, the possibility
to enhance methane production by increasing the substrate volumes was investigated during
period VII. It was clearly proven that encased cells in RMB were still able to produced
methane during this period. On the contrary, in the reactor with free cells failed in this
condition and only small amounts of methane occurred. Moreover, high amounts of carbon
monoxide, hydrogen, carbon dioxide and high accumulation of VFA from both reactors were
detected. This period indicated that the free cell system had reached its maximum
performance in co-digestion due to very low methane production and high accumulation of
substrates. The encased cells in RMB still showed a better performance during the co-
digestion system.
From this experiment, it can be concluded that retaining microorganisms in PVDF membrane
was a successful technique. Encased cells in RMB showed a similar performance in semi-
continuous bio-methanation process of syngas compared to the system of free cells when the
cell washout rate was too slow. Moreover, higher efficiency to accumulate co-substrates and
increased methane production in co-digestion process of syngas and organic substances was
obtained from encased cells in RMB. Finally, higher cell density was achieved in the RMB
and higher methane amounts were generated in contrast to free cell reactors.
4.3 Rapid syngas bio-methanation by a compact reverse membrane bioreactor (RMB)
The aim of this experiment was to investigate the performance of a semi-continuous system
for syngas bio-methanation by using a RMB in order to retain the methane-producing
microorganisms inside the reactor. The performances of the membrane and conventional free
cell bioreactor were compared. All measurements were conducted with standard deviation
analysis.
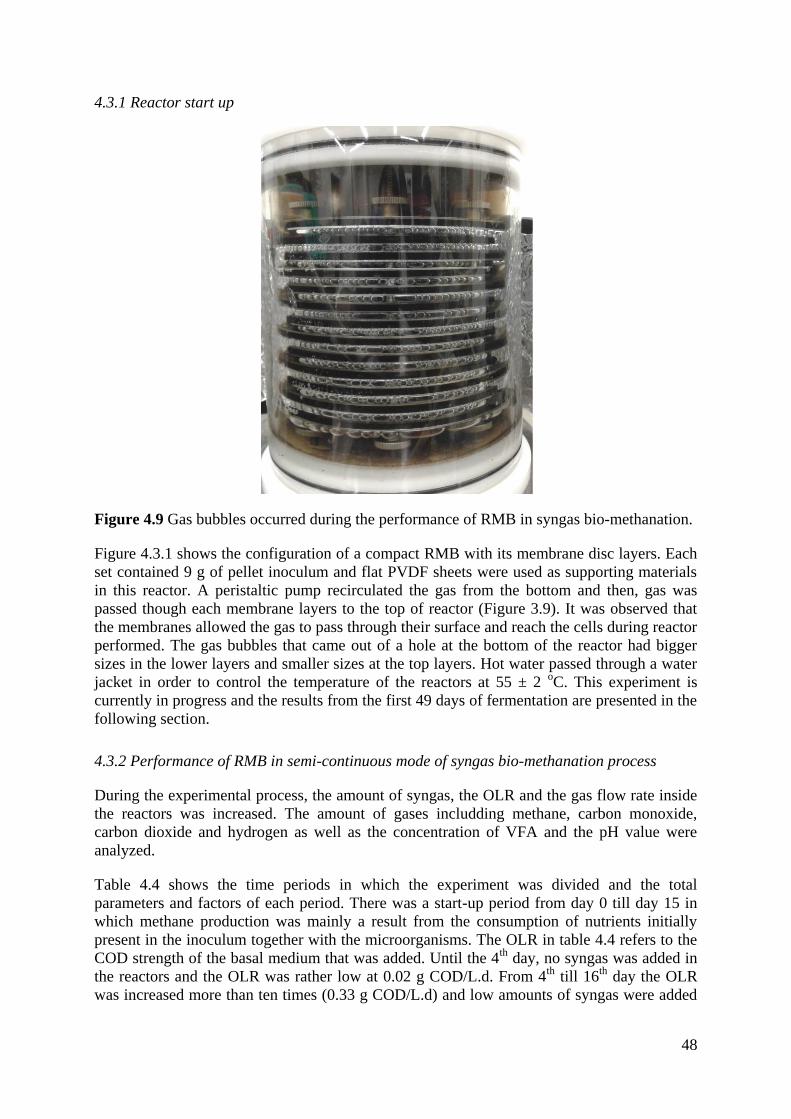
48
4.3.1 Reactor start up
!
Figure 4.9 Gas bubbles occurred during the performance of RMB in syngas bio-methanation.
Figure 4.3.1 shows the configuration of a compact RMB with its membrane disc layers. Each
set contained 9 g of pellet inoculum and flat PVDF sheets were used as supporting materials
in this reactor. A peristaltic pump recirculated the gas from the bottom and then, gas was
passed though each membrane layers to the top of reactor (Figure 3.9). It was observed that
the membranes allowed the gas to pass through their surface and reach the cells during reactor
performed. The gas bubbles that came out of a hole at the bottom of the reactor had bigger
sizes in the lower layers and smaller sizes at the top layers. Hot water passed through a water
jacket in order to control the temperature of the reactors at 55 ± 2 oC. This experiment is
currently in progress and the results from the first 49 days of fermentation are presented in the
following section.
4.3.2 Performance of RMB in semi-continuous mode of syngas bio-methanation process
During the experimental process, the amount of syngas, the OLR and the gas flow rate inside
the reactors was increased. The amount of gases includding methane, carbon monoxide,
carbon dioxide and hydrogen as well as the concentration of VFA and the pH value were
analyzed.
Table 4.4 shows the time periods in which the experiment was divided and the total
parameters and factors of each period. There was a start-up period from day 0 till day 15 in
which methane production was mainly a result from the consumption of nutrients initially
present in the inoculum together with the microorganisms. The OLR in table 4.4 refers to the
COD strength of the basal medium that was added. Until the 4th
day, no syngas was added in
the reactors and the OLR was rather low at 0.02 g COD/L.d. From 4th
till 16th
day the OLR
was increased more than ten times (0.33 g COD/L.d) and low amounts of syngas were added
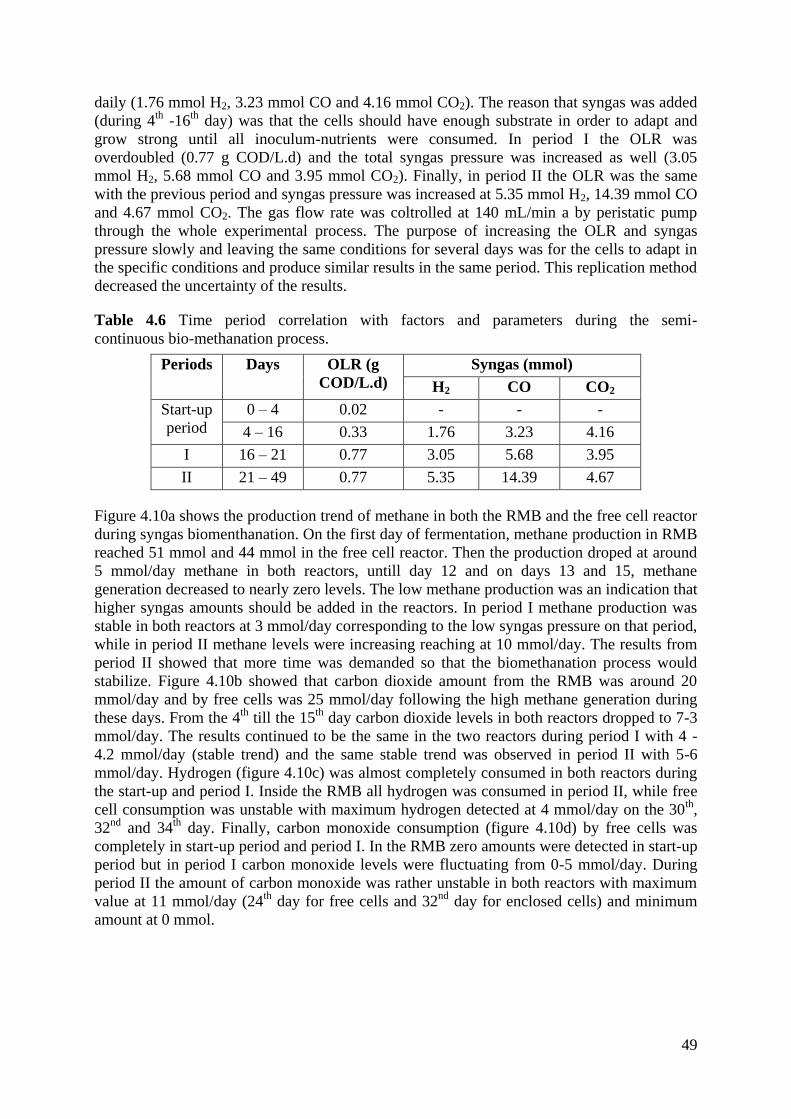
49
daily (1.76 mmol H2, 3.23 mmol CO and 4.16 mmol CO2). The reason that syngas was added
(during 4th
-16th
day) was that the cells should have enough substrate in order to adapt and
grow strong until all inoculum-nutrients were consumed. In period I the OLR was
overdoubled (0.77 g COD/L.d) and the total syngas pressure was increased as well (3.05
mmol H2, 5.68 mmol CO and 3.95 mmol CO2). Finally, in period II the OLR was the same
with the previous period and syngas pressure was increased at 5.35 mmol H2, 14.39 mmol CO
and 4.67 mmol CO2. The gas flow rate was coltrolled at 140 mL/min a by peristatic pump
through the whole experimental process. The purpose of increasing the OLR and syngas
pressure slowly and leaving the same conditions for several days was for the cells to adapt in
the specific conditions and produce similar results in the same period. This replication method
decreased the uncertainty of the results.
Table 4.6 Time period correlation with factors and parameters during the semi-
continuous bio-methanation process.
Periods Days OLR (g
COD/L.d)
Syngas (mmol)
H2 CO CO2
Start-up
period
0 – 4 0.02 - - -
4 – 16 0.33 1.76 3.23
4.16
I 16 – 21 0.77 3.05 5.68 3.95
II 21 – 49 0.77 5.35 14.39 4.67
Figure 4.10a shows the production trend of methane in both the RMB and the free cell reactor
during syngas biomenthanation. On the first day of fermentation, methane production in RMB
reached 51 mmol and 44 mmol in the free cell reactor. Then the production droped at around
5 mmol/day methane in both reactors, untill day 12 and on days 13 and 15, methane
generation decreased to nearly zero levels. The low methane production was an indication that
higher syngas amounts should be added in the reactors. In period I methane production was
stable in both reactors at 3 mmol/day corresponding to the low syngas pressure on that period,
while in period II methane levels were increasing reaching at 10 mmol/day. The results from
period II showed that more time was demanded so that the biomethanation process would
stabilize. Figure 4.10b showed that carbon dioxide amount from the RMB was around 20
mmol/day and by free cells was 25 mmol/day following the high methane generation during
these days. From the 4th
till the 15th
day carbon dioxide levels in both reactors dropped to 7-3
mmol/day. The results continued to be the same in the two reactors during period I with 4 -
4.2 mmol/day (stable trend) and the same stable trend was observed in period II with 5-6
mmol/day. Hydrogen (figure 4.10c) was almost completely consumed in both reactors during
the start-up and period I. Inside the RMB all hydrogen was consumed in period II, while free
cell consumption was unstable with maximum hydrogen detected at 4 mmol/day on the 30th
,
32nd
and 34th
day. Finally, carbon monoxide consumption (figure 4.10d) by free cells was
completely in start-up period and period I. In the RMB zero amounts were detected in start-up
period but in period I carbon monoxide levels were fluctuating from 0-5 mmol/day. During
period II the amount of carbon monoxide was rather unstable in both reactors with maximum
value at 11 mmol/day (24th
day for free cells and 32nd
day for enclosed cells) and minimum
amount at 0 mmol.
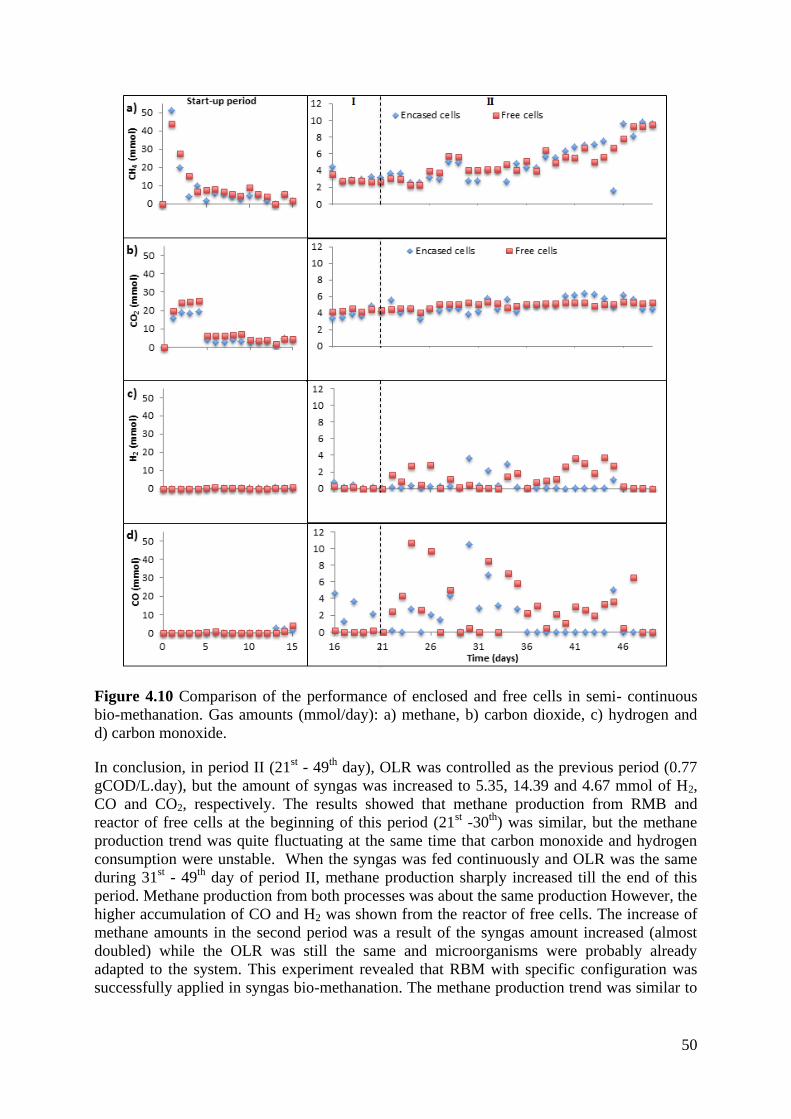
50
Figure 4.10 Comparison of the performance of enclosed and free cells in semi- continuous
bio-methanation. Gas amounts (mmol/day): a) methane, b) carbon dioxide, c) hydrogen and
d) carbon monoxide.
In conclusion, in period II (21st - 49
th day), OLR was controlled as the previous period (0.77
gCOD/L.day), but the amount of syngas was increased to 5.35, 14.39 and 4.67 mmol of H2,
CO and CO2, respectively. The results showed that methane production from RMB and
reactor of free cells at the beginning of this period (21st -30
th) was similar, but the methane
production trend was quite fluctuating at the same time that carbon monoxide and hydrogen
consumption were unstable. When the syngas was fed continuously and OLR was the same
during 31st - 49
th day of period II, methane production sharply increased till the end of this
period. Methane production from both processes was about the same production However, the
higher accumulation of CO and H2 was shown from the reactor of free cells. The increase of
methane amounts in the second period was a result of the syngas amount increased (almost
doubled) while the OLR was still the same and microorganisms were probably already
adapted to the system. This experiment revealed that RBM with specific configuration was
successfully applied in syngas bio-methanation. The methane production trend was similar to
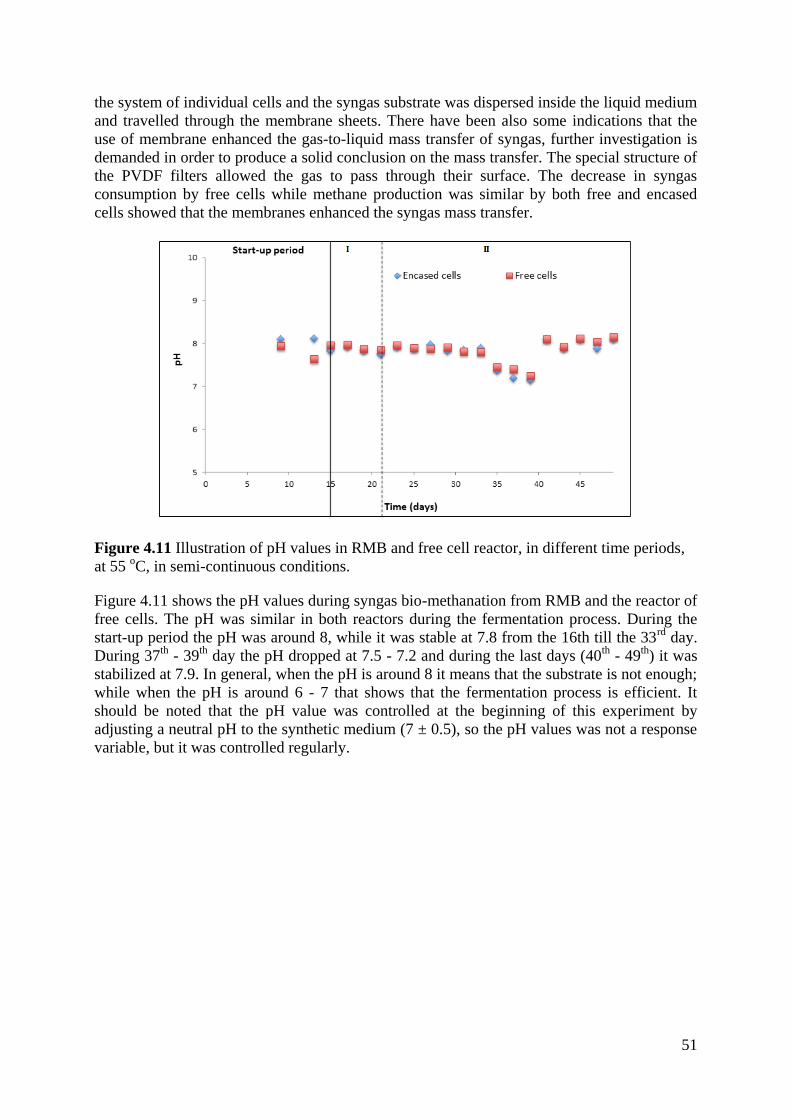
51
the system of individual cells and the syngas substrate was dispersed inside the liquid medium
and travelled through the membrane sheets. There have been also some indications that the
use of membrane enhanced the gas-to-liquid mass transfer of syngas, further investigation is
demanded in order to produce a solid conclusion on the mass transfer. The special structure of
the PVDF filters allowed the gas to pass through their surface. The decrease in syngas
consumption by free cells while methane production was similar by both free and encased
cells showed that the membranes enhanced the syngas mass transfer.
Figure 4.11 Illustration of pH values in RMB and free cell reactor, in different time periods,
at 55 oC, in semi-continuous conditions.
Figure 4.11 shows the pH values during syngas bio-methanation from RMB and the reactor of
free cells. The pH was similar in both reactors during the fermentation process. During the
start-up period the pH was around 8, while it was stable at 7.8 from the 16th till the 33rd
day.
During 37th
- 39th
day the pH dropped at 7.5 - 7.2 and during the last days (40th
- 49th
) it was
stabilized at 7.9. In general, when the pH is around 8 it means that the substrate is not enough;
while when the pH is around 6 - 7 that shows that the fermentation process is efficient. It
should be noted that the pH value was controlled at the beginning of this experiment by
adjusting a neutral pH to the synthetic medium (7 ± 0.5), so the pH values was not a response
variable, but it was controlled regularly.
52
Chapter 5
Conclusions and future work
Syngas fermentation via gasification is a two-step process. The first step is the gasification of
feedstock into syngas at high temperatures and the second is the bio-methanation of syngas by
anaerobic biocatalysts. It is an efficient method to threat solid wastes that are difficult to be
degraded, like lignocellulosic and plastic material. This study project was focused on syngas
fermentation. An important challenge in the fermentation process is to achieve high cell
density by preventing the cell washout from the digesters. In this project, syngas bio-
methanation by using novel reverse membrane bioreactors was studied in order to retain high
cell loading and thereafter increase the methane production. The conclusions of this project
are described in the following sections.
5.1. Conclusions
5.1.1 Experiment 1
In this experiment the performance of cells encased in synthetic PVDF membranes was
compared to that of free cells in batch and repeated batch conditions. Firstly, it was proven
that the encased cells performed the same with free cells during 9 days of batch fermentation,
so the membranes did not inhibit the bio-methanation process and the cells performed better
at 55 oC than at 35
oC. Then the co-digestion of syngas and organic waste generated better
results than the use of pure syngas as substrate for encased cells in repeated batch conditions.
Moreover, in the co-digestion, the encased cells were successfully reused and methane
productivity increased when the retention time was shortened. Finally, encased cells were
studied with different substrates at repeated batch mode and the results showed that the co-
digestion of syngas and organic waste produced the highest methane amounts during the last 3
time periods (2, 1 and 1 day). However, encased cells fed with organic waste produced the
highest methane amounts in the first 3 periods (9, 4 and 4 days).
5.1.2 Experiment 2
The main target of this experiment was to prove that cells encased in PVDF sachets could be
used efficiently in syngas fermentation under semi-continuous conditions and compare them
with free cells. According to the results, the encased cells performed very good and generated
efficient methane amounts during the whole experiment, which lasted 154 days. The study
showed that encased cells were successfully retained and generated more methane than free
cells. In the beginning of the experiment similar methane amounts were produced by the
encased and free cells during the first four periods. Methane production in period II was
increased to 2 mmol/day (from 1 mmol/day in period I) because of the increase of total syngas
pressure. In period III methane productivity was more than doubled at 5 mmol/day because
OLR was increased from 0.02 to 0.85 g COD/L.d. In period IV organic waste was added in
the reactor, the OLR was increased to 1.7 g COD/L.d and the syngas pressure remained the
same. Even though liquid and gaseous substrates were added every 2 days, the methane
production remained at the same levels because of the organic waste fermentation. In period
V higher syngas amounts were added and the encased cells produced approximately 10 mmol
53
methane/2 days. Methane production from free cell reactor was dramatically reduced to 3
mmol/day due to the systematically cell washout. In period VI methane production from
encased cells was decreased because of some leaks on the surface of the membranes. In the
same period free cells generate very low methane amounts (2 mmol/day). Finally, in period
VII, methane production by encased cells increased again at 5 mmol/day after doubling the
OLR at 3.4 g COD/L.d and the syngas amount. Free cells produced only 1 mmol methane/day
and their performance was terminated on the two last days of the experiment.
5.1.3 Experiment 3
In the last experiment cells enclosed inside membrane disc layers in a RMB were studied in a
semi-continuous syngas fermentation process and a free cell reactor was used as referent.
During the experiment, methane production was similar in both the membrane and the
conventional bioreactor. This proved that the membrane sheets did not inhibit the syngas
fermentation process. Until the 4th
day of the start-up period high amounts of syngas were
produced because of the consumption of nutrients that had remained in the inoculum together
with the cells. From day 4 till day 15 low syngas amounts were added in the reactors so that
the cells would grow efficiently until the end of the start-up period. In period I, 2.1 mmol
methane/day was generated in both reactors and the syngas pressure was doubled in
comparison to the previous period. In period II methane amounts exponentially increased to
10 mmol/day due to a new doubling of syngas pressure.
5.2 Future work
There are several interesting suggestions for future studies on this process area. One is the
study and comparison of different types of membranes, like polyether sulfone (PES) in the
RMB. Various factors can be studied like: syngas composition (e.g. higher CO concentration)
and addition of real organic waste from the municipal waste treatment facilities. There are
also different experimental settings that can be studied. One idea is to combine a hollow fibre
membrane (HFM) and sachets made of PVDF filters in order to enhance the gas-to-liquid
mass transfer in liquid medium and retain high cell density inside the digester. Another
possibility is the use of several reactors connected in series and the study of methane
production and syngas consumption in all of them.
There are also some minor challenges that must be overcome in order to optimize even more
the current experimental processes used in this thesis. One is the prevention of cracks or leaks
on the teabags. Figure 5.1 shows a membrane with a crack that retains successfully the cells
until the end of the experiment 1 (a) and another membrane that was completely destroyed on
the 19th
day of digestion (b). The percentage of failed membranes was only 2 %. The basic
reason for the cracks appearance was the inefficient heat-sealed sides. Another challenge
during the first experiment was to prevent the sedimentation of the suspended sludge on the
walls and the bottom of the free cell reactors (Figure 5.2). To avoid this, the digesters were
shaken once a day in order to disperse the cells in the liquid medium.
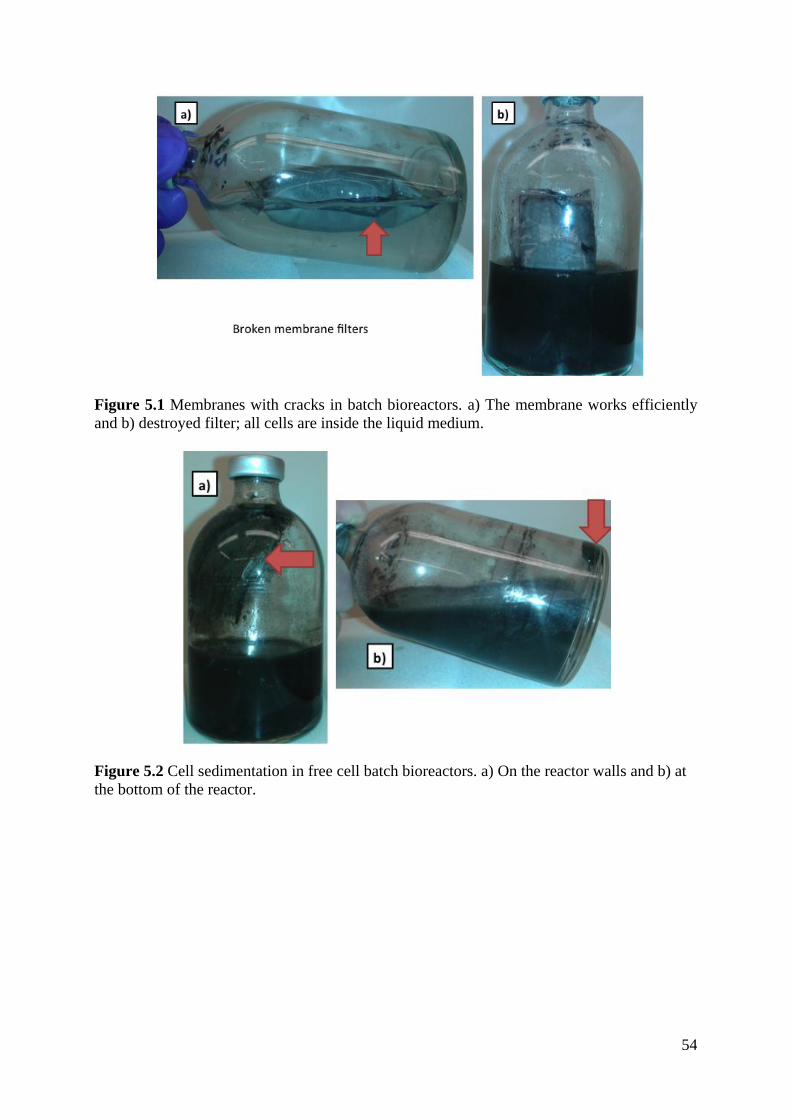
54
Figure 5.1 Membranes with cracks in batch bioreactors. a) The membrane works efficiently
and b) destroyed filter; all cells are inside the liquid medium.
Figure 5.2 Cell sedimentation in free cell batch bioreactors. a) On the reactor walls and b) at
the bottom of the reactor.
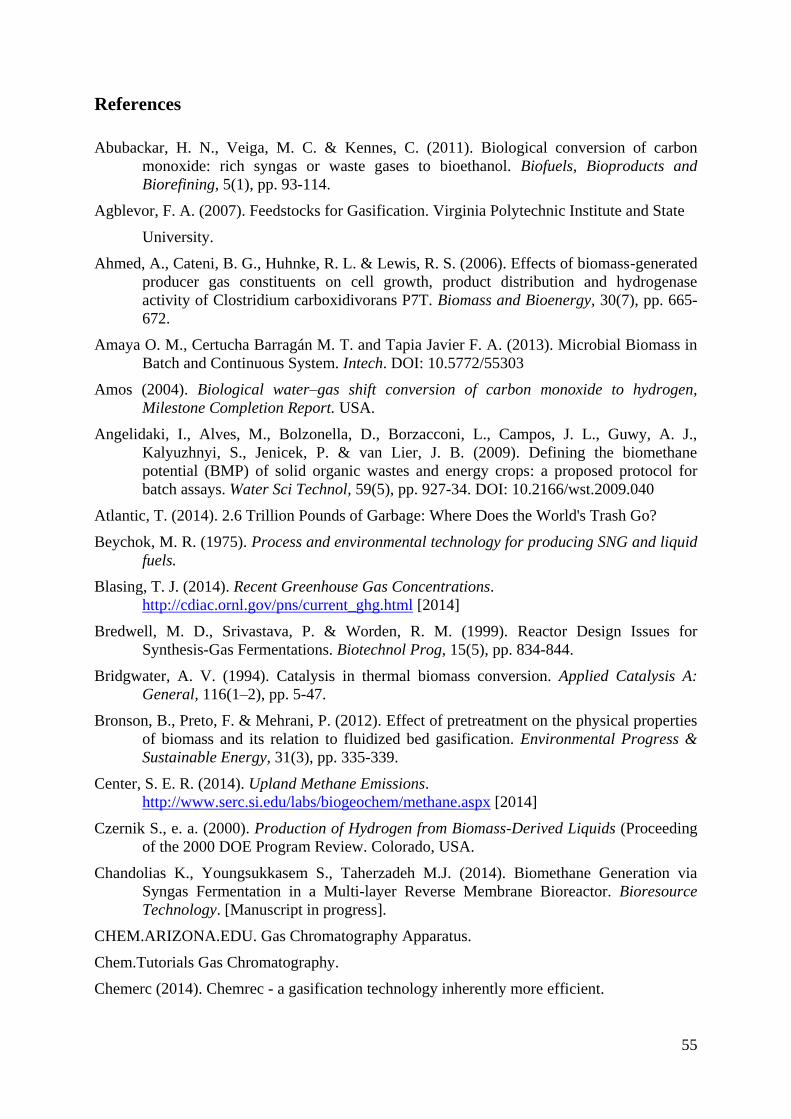
55
References
Abubackar, H. N., Veiga, M. C. & Kennes, C. (2011). Biological conversion of carbon
monoxide: rich syngas or waste gases to bioethanol. Biofuels, Bioproducts and
Biorefining, 5(1), pp. 93-114.
Agblevor, F. A. (2007). Feedstocks for Gasification. Virginia Polytechnic Institute and State
University.
Ahmed, A., Cateni, B. G., Huhnke, R. L. & Lewis, R. S. (2006). Effects of biomass-generated
producer gas constituents on cell growth, product distribution and hydrogenase
activity of Clostridium carboxidivorans P7T. Biomass and Bioenergy, 30(7), pp. 665-
672.
Amaya O. M., Certucha Barragán M. T. and Tapia Javier F. A. (2013). Microbial Biomass in
Batch and Continuous System. Intech. DOI: 10.5772/55303
Amos (2004). Biological water–gas shift conversion of carbon monoxide to hydrogen,
Milestone Completion Report. USA.
Angelidaki, I., Alves, M., Bolzonella, D., Borzacconi, L., Campos, J. L., Guwy, A. J.,
Kalyuzhnyi, S., Jenicek, P. & van Lier, J. B. (2009). Defining the biomethane
potential (BMP) of solid organic wastes and energy crops: a proposed protocol for
batch assays. Water Sci Technol, 59(5), pp. 927-34. DOI: 10.2166/wst.2009.040
Atlantic, T. (2014). 2.6 Trillion Pounds of Garbage: Where Does the World's Trash Go?
Beychok, M. R. (1975). Process and environmental technology for producing SNG and liquid
fuels.
Blasing, T. J. (2014). Recent Greenhouse Gas Concentrations.
http://cdiac.ornl.gov/pns/current_ghg.html [2014]
Bredwell, M. D., Srivastava, P. & Worden, R. M. (1999). Reactor Design Issues for
Synthesis-Gas Fermentations. Biotechnol Prog, 15(5), pp. 834-844.
Bridgwater, A. V. (1994). Catalysis in thermal biomass conversion. Applied Catalysis A:
General, 116(1–2), pp. 5-47.
Bronson, B., Preto, F. & Mehrani, P. (2012). Effect of pretreatment on the physical properties
of biomass and its relation to fluidized bed gasification. Environmental Progress &
Sustainable Energy, 31(3), pp. 335-339.
Center, S. E. R. (2014). Upland Methane Emissions.
http://www.serc.si.edu/labs/biogeochem/methane.aspx [2014]
Czernik S., e. a. (2000). Production of Hydrogen from Biomass-Derived Liquids (Proceeding
of the 2000 DOE Program Review. Colorado, USA.
Chandolias K., Youngsukkasem S., Taherzadeh M.J. (2014). Biomethane Generation via
Syngas Fermentation in a Multi-layer Reverse Membrane Bioreactor. Bioresource
Technology. [Manuscript in progress].
CHEM.ARIZONA.EDU. Gas Chromatography Apparatus.
Chem.Tutorials Gas Chromatography.
Chemerc (2014). Chemrec - a gasification technology inherently more efficient.
56
Chynoweth, D. (1996). Environmental impact of biomethanogenesis. Environmental
Monitoring and Assessment, 42(1-2), pp. 3-18.
Company, G. B. (2013). Cellulosic technology.
http://www.generalbiomass.com/cellethanol1.htm [4 September 2013]
D'Alessio, L. & Paolucci, M. (1989). Energetic aspects of the syngas production by solar
energy: Reforming of methane and carbon gasification. Solar & Wind Technology,
6(2), pp. 101-104.
Daniell, J., Köpke, M. & Simpson, S. (2012). Commercial Biomass Syngas Fermentation.
Energies, 5(12), pp. 5372-5417.
Daniels, L., Fuchs, G., Thauer, R. K. & Zeikus, J. G. (1977). Carbon monoxide oxidation by
methanogenic bacteria. J Bacteriol, 132(1), pp. 118-26.
Datar, R. P., Shenkman, R. M., Cateni, B. G., Huhnke, R. L. & Lewis, R. S. (2004).
Fermentation of biomass-generated producer gas to ethanol. Biotechnol Bioeng, 86(5),
pp. 587-94.
Datar, R. P., Shenkman, R.M., Cateni, B.G., Huhnke, R.L., Lewis, R.S. (2004). Fermentation
of biomass-generated producer gas to ethanol. Biotechnology and Bioengineering 86,
pp. 587 - 594.
Department E. (2014). Types of Gasifiers - Fluidized bed Gasifiers.
http://netl.doe.gov/research/coal/energy-systems/gasification/gasifipedia/u-gas
E4Tech (2009). Review of Technologies for Gasification of Biomass and Wastes.
http://www.nnfcc.co.uk/tools/review-of-technologies-for-gasification-of-biomass-and-
wastes-nnfcc-09-008#sthash.0kI4x088.dpuf
Energy, C. Syngas Cogeneration / Combined Heat & Power. http://www.clarke-
energy.com/gas-type/synthesis-gas-syngas/ [3 September 2013]
EPA (2013). Climate Change Indicators In the United States.
http://www.epa.gov/climatechange/science/indicators/ghg/ghg-concentrations.html
Freeman, P. a. B. D. (1999). Formation and Modification of Polymeric Membranes:
Overview. American Chemical Society. DOI: 10.1021/bk-2000-0744.ch001
Future, C. E. (2014). Advantages and Disadvantages of Biogas.
Gav, B. (2014). Banana Methane Powered Cars, Pig Poo Power and Other Uses Of Biogas.
Peak Energy.
Gerardi, M. H. (2003). The microbiology of anaerobic digesters. Hoboken, N.J: John Wiley.
Gutierrez T., G. W. (2012). Trash city: Inside America's largest landfill site. CNN.
Haryanto, A., Fernando, S. D., Pordesimo, L. O. & Adhikari, S. (2009). Upgrading of syngas
derived from biomass gasification: A thermodynamic analysis. Biomass and
Bioenergy, 33(5), pp. 882-889.
Henry Mallia, F. S., Steven Till (2001). Membrane Bioreactors: Wastewater Treatment
Applications to Achieve High Quality Effluent [2014 21 April]
Isci, A. & Demirer, G. N. (2007). Biogas production potential from cotton wastes. Renewable
Energy, 32(5), pp. 750-757. DOI: http://dx.doi.org/10.1016/j.renene.2006.03.018
57
Jetten M. S. M., Stams A. J. M. & Zehnder, A. J. B. (1992). Methanogenesis from acetate: a
comparison of the acetate metabolism in Methanothrix soehngenii and
Methanosarcina spp. FEMS Microbiology Letters, 88(3–4), pp. 181-197.
Jevons, K. (2011). Membrane Technology in Production of Biofuels. Ethanol Producer
Magazine.
Judd, S. (2011). The MBR book. Elsevier.
Klasson, K. T., Ackerson, C. M. D., Clausen, E. C. & Gaddy, J. L. (1992a). Biological
conversion of synthesis gas into fuels. International Journal of Hydrogen Energy,
17(4), pp. 281-288.
Klasson, K. T., Ackerson, M. D., Clausen, E. C. & Gaddy, J. L. (1991). Bioreactor design for
synthesis gas fermentations. Fuel, 70(5), pp. 605-614.
Klasson, K. T., Ackerson, M. D., Clausen, E. C. & Gaddy, J. L. (1992b). Bioconversion of
synthesis gas into liquid or gaseous fuels. Enzyme and Microbial Technology, 14(8),
pp. 602-608.
Klasson, K. T., Ackerson, M. D., Clausen, E. C. & Gaddy, J. L. (1993). Biological conversion
of coal and coal-derived synthesis gas. Fuel, 72(12), pp. 1673-1678.
Lee, K. C. & Rittmann, B. E. (2002). Applying a novel autohydrogenotrophic hollow-fiber
membrane biofilm reactor for denitrification of drinking water. Water Res, 36(8), pp.
2040-52.
Lee, P.H., Ni, S.Q., Chang, S.Y., Sung, S. & Kim, S.H. (2012). Enhancement of carbon
monoxide mass transfer using an innovative external hollow fiber membrane (HFM)
diffuser for syngas fermentation: Experimental studies and model development.
Chemical Engineering Journal, 184(0), pp. 268-277.
Lynn Osburn, J. O. (1993). Biomass Resources for Energy and Industry.
Madigan M. T., Martinko J. M., Dunlap P. V., Clark D. P. (1997). Brock Biology of
microorganisms. 8th
ed. New Jersey: Prentice-Hall.
Mark Burk, C. H. S., Anthony Burgard, John D. Trawick (2013). Methods and organisms for
utilizing synthesis gas or other gaseous carbon sources and methanol. USA.
McKendry, P. (2002). Energy production from biomass (Part 3): Gasification technologies.
Bioresource Technology, 83, pp. 55 - 63.
Mibazaar (2014). The World's most polluted cities - as mentioned in TIME.
http://www.mibazaar.com/pollutedcities.html.
Millipore, M. (2014). Durapore® Membrane Filters.
Mohammadi, M., Najafpour, G. D., Younesi, H., Lahijani, P., Uzir, M. H. & Mohamed, A. R.
(2011). Bioconversion of synthesis gas to second generation biofuels: A review.
Renewable and Sustainable Energy Reviews, 15(9), pp. 4255-4273.
Munasinghe, P. C. & Khanal, S. K. (2010). Biomass-derived syngas fermentation into
biofuels: Opportunities and challenges. Bioresource Technology, 101(13), pp. 5013-
5022.
Nerenberg, R. & Rittmann, B. E. (2004). Hydrogen-based, hollow-fiber membrane biofilm
reactor for reduction of perchlorate and other oxidized contaminants. Water Sci
Technol, 49(11-12), pp. 223-30.
58
Newsome, D. S. (1980). The Water-Gas Shift Reaction. Catalysis Reviews, 21(2), pp. 275-
318.
O'Brien, J. M., Wolkin, R. H., Moench, T. T., Morgan, J. B. & Zeikus, J. G. (1984).
Association of hydrogen metabolism with unitrophic or mixotrophic growth of
Methanosarcina barkeri on carbon monoxide. J Bacteriol, 158(1), pp. 373-5.
Osuna M. B., Zandvoort M. H., Iza J. M., Lettinga G. & Lens P. N. L. (2003). Effects of trace
element addition on volatile fatty acid conversions in anaerobic granular sludge
reactors. Environmental Technology, 24(5), pp. 573-587. DOI:
10.1080/09593330309385592
Pain, J. (2014). Methods of Jean Pain. http://www.jean-pain.com/en/index2.php
Phillips, J., et al. (1994). Synthesis gas as substrate for the biological production of fuels and
chemicals." Applied Biochemistry and Biotechnology, 45 - 46(1), pp. 145 - 157.
PROBIOPOL (2014). The standard process of biogas production.
http://www.probiopol.de/6_What_is_the_standard_proces.52.0.html
Puig-Arnavat, M., et al (2010). Review and analysis of biomass gasification models. Renew.
Sustain. Energy Rev. , 14, pp. 2841-2851.
Ramakrishna S., e. a. (2011). Polymer Membranes in Biotechnology. Preparation,
Functionalization and Application. UK: Imperial College Press.
Rainer Zah, H. B., Marcel Gauch, Roland Hischier, Martin Lehmann, Patrick Wäger (2007).
A Life Cycle Assessment of Energy Products: Environmental Impact Assessment of
Biofuels. The Oil Drum. http://www.theoildrum.com/node/2976
Raposo, F., De la Rubia, M. A., Fernández-Cegrí, V. & Borja, R. (2012). Anaerobic digestion
of solid organic substrates in batch mode: An overview relating to methane yields and
experimental procedures. Renewable and Sustainable Energy Reviews, 16(1), pp. 861-
877. DOI: http://dx.doi.org/10.1016/j.rser.2011.09.008
Research, T.-M. (2012). Biogas Upgrading Market - Global Industry Size, Share, Trends,
Analysis And Forecasts 2012 - 2018.
Rother, M. & Metcalf, W. W. (2004). Anaerobic growth of Methanosarcina acetivorans C2A
on carbon monoxide: An unusual way of life for a methanogenic archaeon.
Proceedings of the National Academy of Sciences of the United States of America,
101(48), pp. 16929-16934. DOI: 10.1073/pnas.0407486101
Shih-Perng Tsai, R. D., Rahul Basu, Seong-Hoon Yoon (2009). Syngas conversion system
using asymmetric membrane and anaerobic microorganism.
Sutherland, K. (2007). Filters and Filtration Handbook (5th
Edition) Elsevier Ltd.
Thauer, R. K. (1998). Biochemistry of methanogenesis: a tribute to Marjory Stephenson.
Microbiology, 144, pp. 2377 - 2406.
Toasty Energy Content of Selected Fuels [2014 13 January]
Vega, J. L., Clausen, E. C. & Gaddy, J. L. (1990). Design of bioreactors for coal synthesis gas
fermentations. Resources, Conservation and Recycling, 3(2-3), pp. 149-160.
Widodo, S. (2008). Determination of Volatile Solids, Biogas and Methane Potentials from
Municipal Organic Waste and Mixed Materials as Basic for Designing a Biogas
Reactor. Diss. University College of Boras. Boras, Sweden.
59
Wikipedia (2013). Fischer-Tropsch process.
http://en.wikipedia.org/wiki/Fischer%E2%80%93Tropsch_process. [2014 25
February].
Wikipedia (2014a). https://en.wikipedia.org. [2014 28 December].
Wikipedia (2014b). Energy Content of Biofuels.
http://en.wikipedia.org/wiki/Energy_content_of_biofuel [2014 23 January].
Worden, R. M., Bredwell, M. D. & Grethlein, A. J. (1997). Engineering Issues in Synthesis-
Gas Fermentations. Fuels and Chemicals from Biomass. American Chemical Society,
pp. 320-335.
Worden, R. M., Grethlein, A. J., Jain, M. K. & Datta, R. (1991). Production of butanol and
ethanol from synthesis gas via fermentation. Fuel, 70(5), pp. 615-619.
Wuang, H. Z. (2013). Understand the Basics of Membrane Filtration. American School of
Chemical Engineers.
Youngsukkasem, S., Akinbomi, J., Rakshit, S. K. & Taherzadeh, M. J. (2013). Biogas
production by encased bacteria in synthetic membranes: Protective effects in toxic
media and high loading rates.
Youngsukkasem S., Barghi H., Rakshit S. K., Taherzadeh M. J. (2013). Rapid Biogas
Production by Compact Multi-Layer Membrane Bioreactor: Efficiency of Synthetic
Polymeric Membranes. Energies, 6(4), pp. 6211-622. DOI: doi:10.3390/en6126211
Youngsukkasem S., R. K., Mohammad J. Taherzadeh M. J. (2012). Biogas Production by
Encapsulated Methane-producing Bacteria. BioResources, 7(1).
Youngsukkasem S., Chandolias. K., Taherzadeh M. J. (2014a). Rapid Bio-methanation of
Syngas in a Reverse Membrane Bioreactor: Membrane encased Microorganisms.
Bioresource Technology.
Youngsukkasem S., Chandolias. K., Taherzadeh M. J. (2014b). Syngas Bio-methanation in a
Reverse Membrane Bioreactor. Efficiency of Moving-membrane-sachets (MMS) in a
Continuous Fermentation Process. Membranes.
Zeng, J., Zheng, Y., Yu, X., Yu, L., Gao, D. & Chen, S. (2013). Lignocellulosic biomass as a
carbohydrate source for lipid production by Mortierella isabellina. Bioresource
Technology, 128(0), pp. 385-391.


