Research Skills Seminar Series 2018 Research Education Program Rapid Critical Appraisal of Scientific Literature Presenter: Assoc. Professor Sue Skull Head, Research Education Program Deputy Director, Department of Child Health Research 4 May 2018 RESEARCH SKILLS SEMINAR SERIES 2018 Part of the Research Education Program Department of Child Health Research Princess Margaret Hospital for Children ResearchEducationProgram.org [email protected]
Transcript
Research Skills Seminar Series 2018Research Education Program
Rapid Critical Appraisal of Scientific LiteraturePresenter: Assoc. Professor Sue Skull
Head, Research Education ProgramDeputy Director, Department of Child Health Research
4 May 2018
RESEARCH SKILLS SEMINAR SERIES 2018 Part of the Research Education Program
Department of Child Health ResearchPrincess Margaret Hospital for Children
Copyright to this material produced by the Research Education Program, Department of Child Health Research, Princess Margaret Hospital, Western Australia, under the provisions of the Copyright Act 1968 (C’wth Australia). Apart from any fair dealing for personal, academic, research or non‐commercial use, no part may be reproduced without written permission. The Department of Child Health Research is under no obligation to grant this permission. Please acknowledge the Research Education Program, Department of Child Health Research, Princess Margaret Hospital when reproducing or quoting material from this source.
1/05/2018
1
1
If today’s practitioners are to retain their professionalism, clinicians’ information and research appraisal skills need to be improved urgently. Otherwise they risk being rapidly overtaken by administrators and patients who may not be able to use a stethoscope but are comfortable using Google, Wikipedia, and the internet
Glasziou, Burls and Gilbert. BMJ 2008:337:704‐705
ResearchEducationProgram.org
RESEARCH SKILLS SEMINAR SERIES 2018Research Education Program
Rapid Critical Appraisal of Scientific Literature
A/Prof Sue SkullHead, Research Education Program
Deputy Director, Department of Child Health Research
RESEARCH SKILLS SEMINAR SERIES 2018Part of the Research Education Program
Department of Child Health ResearchPrincess Margaret Hospital for Children
4 May
3
Overview
What is Evidence‐Based Clinical Practice
Critical Appraisal and why we need it
General critical appraisal strategies
Examining validity
Interpreting results
Application of results
Evidence-based Clinical Practice
4
“The integration of best research evidence with clinical expertise and patient values” (David Sackett, 1996)
• Formulate an answerable question (PICOT)
• Find the best evidence
• Critically appraise that evidence
• Integrate with clinical expertise and patient values
• Evaluate our effectiveness and efficiency
1/05/2018
2
5
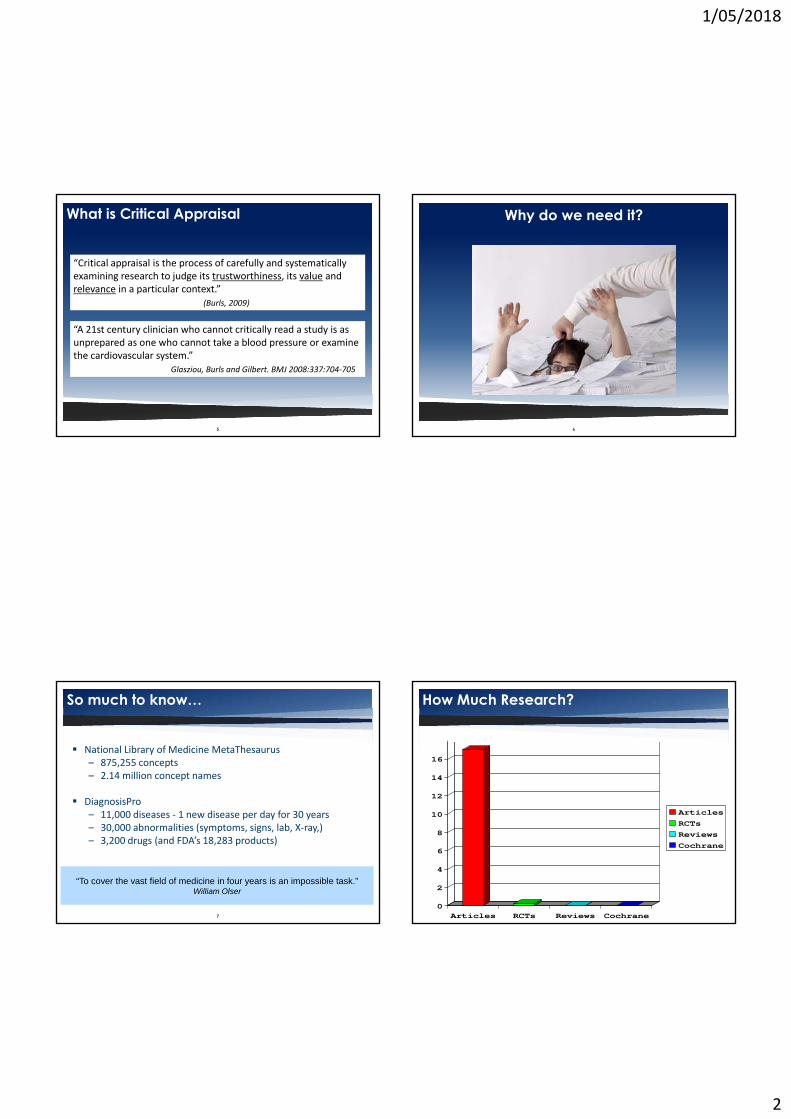
What is Critical Appraisal
“A 21st century clinician who cannot critically read a study is as unprepared as one who cannot take a blood pressure or examine the cardiovascular system.”
Glasziou, Burls and Gilbert. BMJ 2008:337:704‐705
“Critical appraisal is the process of carefully and systematically examining research to judge its trustworthiness, its value and relevance in a particular context.”
(Burls, 2009)
6
Why do we need it?
7
So much to know…
National Library of Medicine MetaThesaurus– 875,255 concepts– 2.14 million concept names
DiagnosisPro– 11,000 diseases ‐ 1 new disease per day for 30 years– 30,000 abnormalities (symptoms, signs, lab, X‐ray,)– 3,200 drugs (and FDA’s 18,283 products)
“To cover the vast field of medicine in four years is an impossible task.” William Olser
How Much Research?
8
0
2
4
6
8
10
12
14
16
Articles RCTs Reviews Cochrane
Articles
RCTs
Reviews
Cochrane
1/05/2018
3
How Much Research?
9
Source: Carl Heneghan
How Much Research?
10
“Just in case” learning
Traditionally “Just in case” / “Push” learning
Alerts to new information e.g. Journal articles, books etc.
Too much to possibly keep up AND 50% out of date in 5y
Meat in clinical journals?
12
Not all research is useful!
Ioannidis JPA (2016) Why Most Clinical Research Is Not Useful. PLoS Med 13(6): e1002049. https://doi.org/10.1371/journal.pmed.1002049
• Many studies fail to be useful because of their design
• Consider problem , context, information gain, pragmatism, patient centeredness, value for money, feasibility, and transparency
1/05/2018
4
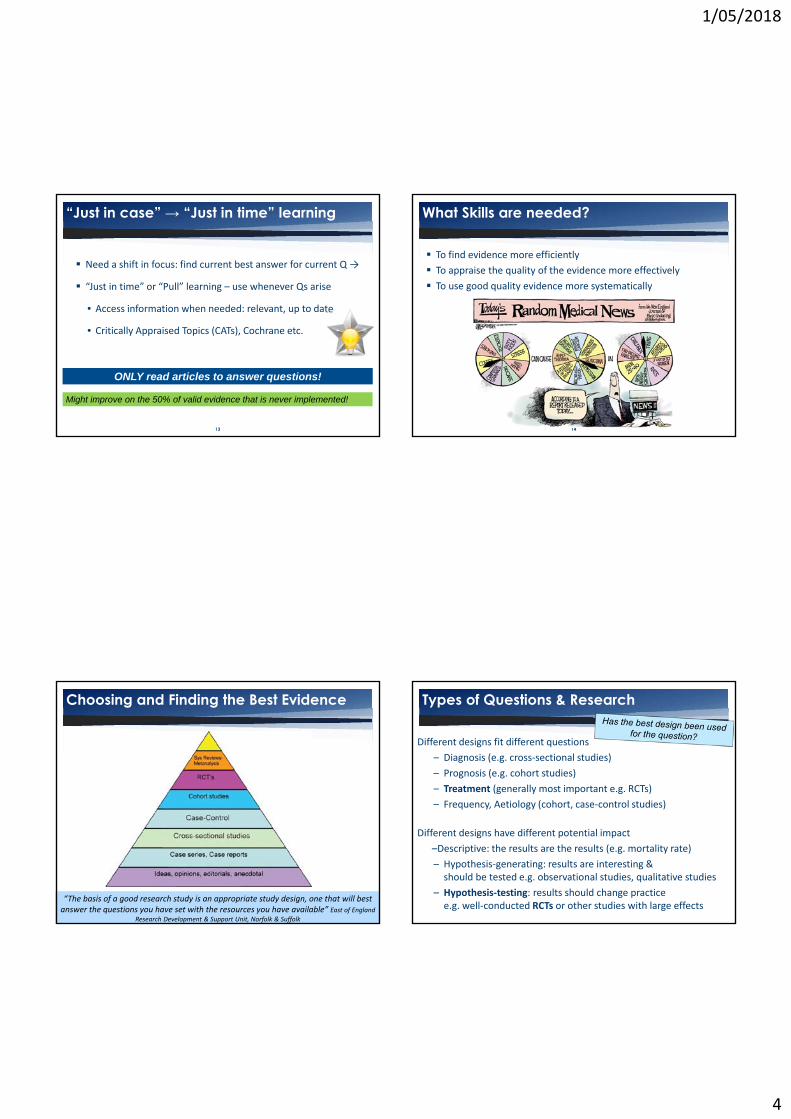
Need a shift in focus: find current best answer for current Q →
“Just in time” or “Pull” learning – use whenever Qs arise
• Access information when needed: relevant, up to date
• Critically Appraised Topics (CATs), Cochrane etc.
“Just in case” → “Just in time” learning
13
ONLY read articles to answer questions!
Might improve on the 50% of valid evidence that is never implemented!
What Skills are needed?
14
To find evidence more efficiently
To appraise the quality of the evidence more effectively
To use good quality evidence more systematically
Choosing and Finding the Best Evidence
15 5/1/2018Research Skills Seminar Series
“The basis of a good research study is an appropriate study design, one that will best answer the questions you have set with the resources you have available” East of England
Research Development & Support Unit, Norfolk & Suffolk
Stratification: produce groups within which the confounder does not vary – works best if only one or two strata,eg: analysis within “male” v “female” or “old” v “young”if not possible
• Analyse participants in the groups to which they were randomised
• Even if they:
– Discontinue,
– Never get the intervention (forget, refuse, too sick, die), or
– Cross over to another group
• Why????
Intention to Treat Analysis
32
• Preserves randomisation
• Therefore any effect we see is due to the assigned treatment
1/05/2018
9
33
Interpreting the Results Interpreting Results…
34
In 2013 Sutherland et al published a list (in Nature) to :
“help non-scientists interrogate advisers and grasp the limitations of evidence.”
Interpreting the Results
35
And the big ticket items are……
• Common sense
• Size of the effect
• Precision
• Applicability
36
Common Sense
1/05/2018
10
37
Common Sense II: Bradford Hill Criteria
• Strength of association
• Consistency
• Specificity
• Temporal relationship
• Biological gradient
• Biological plausibility
• Coherence
• (*Relevance)
An “aid to thought”: Austin Bradford Hill, Proc R Soc Med 1965
SirAustinBradfordHill1897‐1991
Don’t be distracted by statistics!
38 5/1/2018Research Skills Seminar Series
Cannot remove all bias even with fancy adjustments
Every test or formula has it own assumptions
Statistics describe the impact of chance
• They cannot assess importance or exclude bias
Judgement is required
• Check for
• 1o and 2o outcomes, subgroups
• Adverse outcomes/side effects.
• Make sure CIs are used
• Extract the numbers e.g. exclusions, loss to follow‐up, drop outs etc.
• Basic checks: sample size, normal distribution, multiple testing etc.
And check author interpretation
39 5/1/2018
• Overstatement of the results
• Selective statement of the results
• Misinterpretation
Beware dodgy or selective reporting!
40
Size of the Effect
1/05/2018
11
Big Effects are Hard to Ignore!
41
"My basic rule is if the relative risk isn’t at least 3 or 4 [a 200 percent or 300 percent increased risk], forget it.“Robert Temple, CDER, FDA
"As a general rule of thumb, we are looking for a relative risk of 3 or more (> 200 percent increased risk) [before accepting a paper for publication]." Marcia Angell, fmr Editor, NEJM
"No single epidemiological study is persuasive by itself unless the lower limit of its 95 percent confidence level falls above a threefold (200 percent) increased risk." Sir Richard Doll
Why Such a “Big” Difference?
42
• Always potential for confounders
• Measures of effect (eg RR) are only estimates
• Bias may be inherent in the method of measurement used
• Statistical manipulations and assumptions
• Publication bias
*We are talking about asking questions to
potentially change practice
Summary Measures of Effect
43
• Categorical variables
– Prevalence
– Incidence
– Relative risk, RR (or Odds ratio, OR)
– Risk difference (RD) or absolute risk reduction (ARR)
– Relative risk reduction (RRR)
– Number needed to treat/harm (NNT/NNH)
• Continuous variables
– Mean difference (difference in means)
– Standardised mean difference (/pooled SD)
Measure of Effect
44
Prevalence: no. of events / no. people who could have it
no time component, not a rate (eg survey)
Incidence: no. new events / population at risk in a time period
Not those who already have the event at the start
RR: prevalence in group 1 / prevalence in group 2
RD: prevalence in group 1 ‐ prevalence in group 2
RRR: (1‐RR) x 100%
NNT: 1/RD
1/05/2018
12
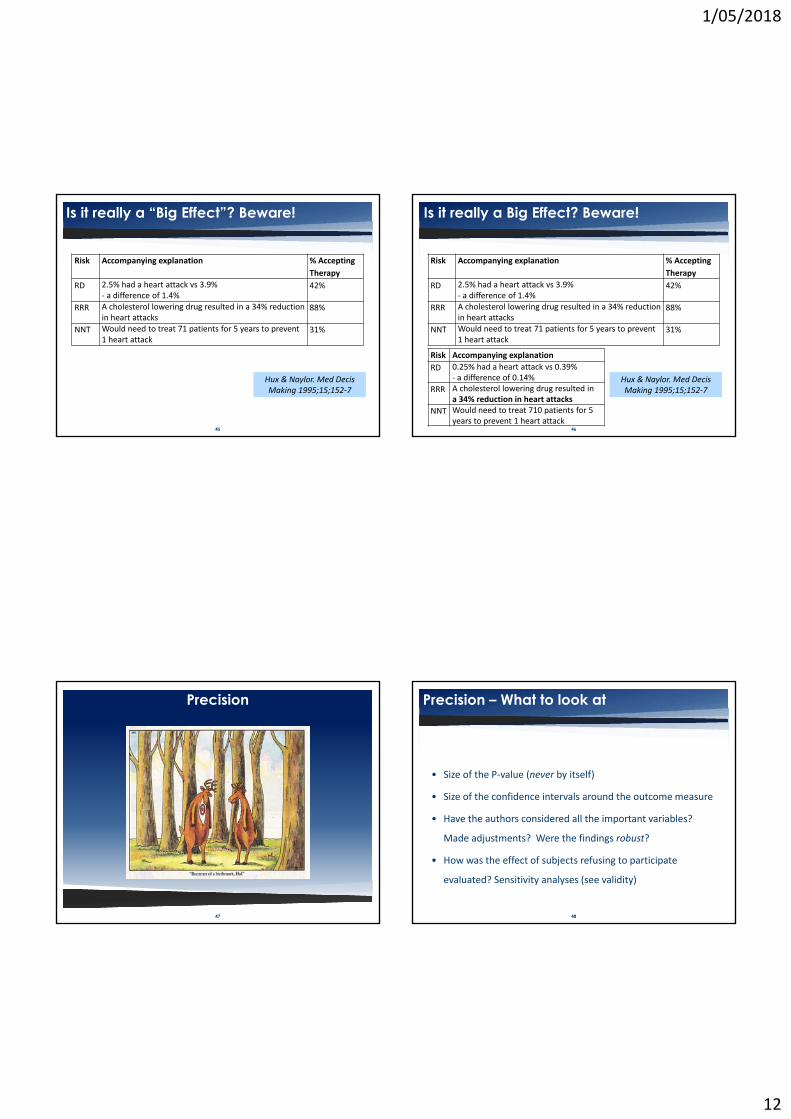
Is it really a “Big Effect”? Beware!
45
Risk Accompanying explanation % Accepting
Therapy
RD 2.5% had a heart attack vs 3.9% ‐ a difference of 1.4%
42%
RRR A cholesterol lowering drug resulted in a 34% reduction in heart attacks
88%
NNT Would need to treat 71 patients for 5 years to prevent 1 heart attack
31%
Hux & Naylor. Med DecisMaking 1995;15;152‐7
46
Risk Accompanying explanation % Accepting
Therapy
RD 2.5% had a heart attack vs 3.9% ‐ a difference of 1.4%
42%
RRR A cholesterol lowering drug resulted in a 34% reduction in heart attacks
88%
NNT Would need to treat 71 patients for 5 years to prevent 1 heart attack
31%
Hux & Naylor. Med DecisMaking 1995;15;152‐7
Risk Accompanying explanation
RD 0.25% had a heart attack vs 0.39% ‐ a difference of 0.14%
RRR A cholesterol lowering drug resulted in a 34% reduction in heart attacks
NNT Would need to treat 710 patients for 5 years to prevent 1 heart attack
Is it really a Big Effect? Beware!
47
Precision
48
Precision – What to look at
• Size of the P‐value (never by itself)
• Size of the confidence intervals around the outcome measure
• Have the authors considered all the important variables?
Made adjustments? Were the findings robust?
• How was the effect of subjects refusing to participate
evaluated? Sensitivity analyses (see validity)
1/05/2018
13
P-values
49 5/1/2018
• Hypothesis‐testing
• Tell us NOTHING on their own about precision or sample size
• Arbitrarily set value to examine the possibility that the result could have occurred by chance
• If p<0.05 this doesn’t make the result “true”
• So don’t use/accept a p‐value on its own
*p values/CIs covered in Introductory Biostatistics seminar
Available on REP website
Confidence Intervals: Measure of Precision
50
• A range of values around the estimated effect that has a high probability of containing the “true” value
• Also arbitrarily set (95%)
• If the range includes 1 (e.g. RR, OR) then potentially NO difference between groups
• Bigger sample size smaller confidence intervals
= greater precision around the estimate
• *Overlapping CIs when making comparisons b/w groups
Formulae for different CIs – means, proportions, differences in means/proportions etc
Copyright to this material produced by the Research Education Program, Department of ChildHealth Research, Princess Margaret Hospital, Western Australia, under the provisions of theCopyright Act 1968 (C’wth Australia). Apart from any fair dealing for personal, academic, researchor non-commercial use, no part may be reproduced without written permission. The Department ofChild Health Research is under no obligation to grant this permission. Please acknowledge theResearch Education Program, Department of Child Health Research, Princess Margaret Hospitalwhen reproducing or quoting material from this source.
60
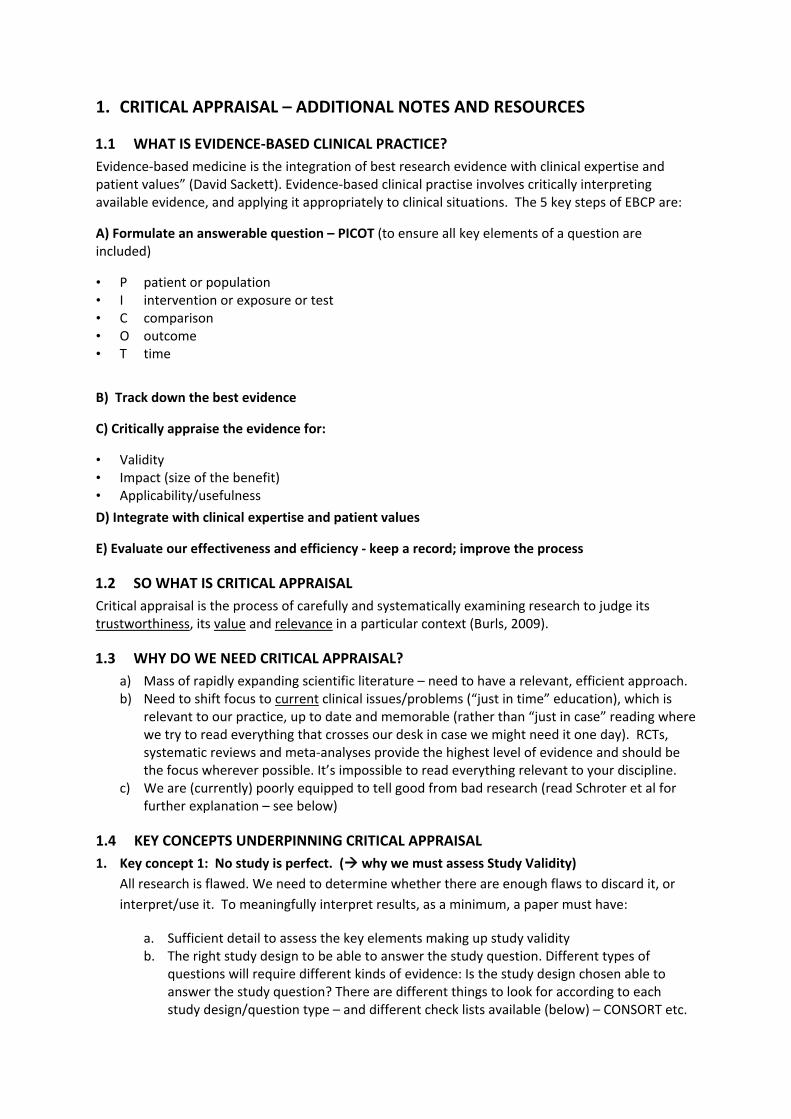
1. CRITICAL APPRAISAL – ADDITIONAL NOTES AND RESOURCES
1.1 WHAT IS EVIDENCE‐BASED CLINICAL PRACTICE?
Evidence‐based medicine is the integration of best research evidence with clinical expertise and patient values” (David Sackett). Evidence‐based clinical practise involves critically interpreting available evidence, and applying it appropriately to clinical situations. The 5 key steps of EBCP are:
A) Formulate an answerable question – PICOT (to ensure all key elements of a question are included)
• P patient or population • I intervention or exposure or test • C comparison • O outcome • T time
B) Track down the best evidence
C) Critically appraise the evidence for:
• Validity • Impact (size of the benefit) • Applicability/usefulness
D) Integrate with clinical expertise and patient values
E) Evaluate our effectiveness and efficiency ‐ keep a record; improve the process
1.2 SO WHAT IS CRITICAL APPRAISAL
Critical appraisal is the process of carefully and systematically examining research to judge its trustworthiness, its value and relevance in a particular context (Burls, 2009).
1.3 WHY DO WE NEED CRITICAL APPRAISAL?
a) Mass of rapidly expanding scientific literature – need to have a relevant, efficient approach. b) Need to shift focus to current clinical issues/problems (“just in time” education), which is
relevant to our practice, up to date and memorable (rather than “just in case” reading where we try to read everything that crosses our desk in case we might need it one day). RCTs, systematic reviews and meta‐analyses provide the highest level of evidence and should be the focus wherever possible. It’s impossible to read everything relevant to your discipline.
c) We are (currently) poorly equipped to tell good from bad research (read Schroter et al for further explanation – see below)
1.4 KEY CONCEPTS UNDERPINNING CRITICAL APPRAISAL
1. Key concept 1: No study is perfect. ( why we must assess Study Validity)
All research is flawed. We need to determine whether there are enough flaws to discard it, or
interpret/use it. To meaningfully interpret results, as a minimum, a paper must have:
a. Sufficient detail to assess the key elements making up study validity b. The right study design to be able to answer the study question. Different types of
questions will require different kinds of evidence: Is the study design chosen able to answer the study question? There are different things to look for according to each study design/question type – and different check lists available (below) – CONSORT etc.
2. Key concept 2: There is more than one possible explanation for a reported “effect” found in a
study. The published result(s) may reflect:
• Truth: a real effect – what we hope from a “good” study • Chance: according to a p value pre‐determined by the researcher (eg p=0.05) . Any
statistical assessment is one of probability – ie the result occurred by chance • Error: an erroneous result due to problems with study design/ implementation/analysis/
interpretation
3. Key concept 3: Not all results can be applied in the setting in which you work.
Can we apply the results in our setting? – more detail below
4. Key concept 4: Don’t rely on one study (unless there really is only one!) to change practice.
Studies on the same topic will always have different estimates of effect and often different
conclusions. This is why well‐conducted systematic reviews/meta‐analyses provide stronger
evidence than a single trial.
1.5 ARE THE RESULTS VALID? (STUDY QUALITY)
Internal validity. Is the study design, conduct, and analysis such that the study results are likely to reflect a true answer to the study question? To examine this, we must rule out the influences of bias and confounding that might be contributing to observed differences in outcomes between the treatment/exposure groups, or the measure of effect attributable to the study.
There are different check lists for internal validity according to the type of study: look at CEBM website (https://www.cebm.net/2014/06/critical‐appraisal/) and at the end of these notes.
Internal validity will depend on how the study was:
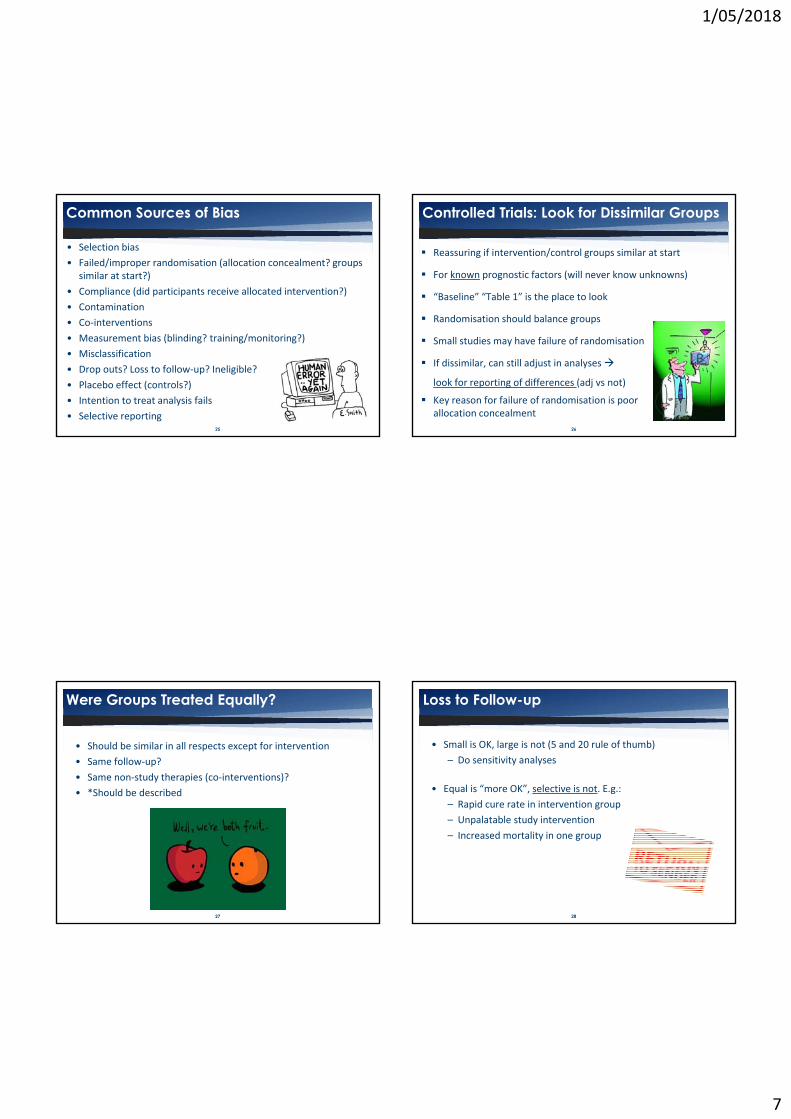
• designed • conducted • analysed • interpreted and reported Important concepts: • Bias or “systematic error” Occurs when measurements deviate systematically from the true
state of the attribute (eg sick people more likely to remember an exposure than well people) • Noise or “Random error” Occurs when repeated measurements of the same attribute do not
agree, but there is no systematic deviation from the true state of the attribute (eg measuring head circumference three times)
• Confounding: a confounder is a baseline variable or intervention that is extraneous to the study question, but potentially related to the outcome and is differentially applied to the intervention and control groups. Or: Were there alternative factors which differed between the compared groups that could have accounted for the outcome?
• Study design features can minimise bias and confounding. But bias cannot be “fixed” once it has occurred; only described as a study weakness to allow appropriate interpretation of results.
1.6 WHAT ARE THE RESULTS? (STUDY EFFECT SIZE AND INTEPRETATION INCLUDING PRECISION)
3 big things to consider:
1) Common sense, including clinical relevance (eg 1mmHg difference in BP) – Bradford Hill criteria,
interpretation
2) Size of the effect (RR, OR, NNT, RD, ARR, etc) – big is relevant
3) Precision (was it measured appropriately, was the effect precise)
Summary measures of effect (measures of “occurrence”) – (using CIs wherever possible – see below)
• Categorical variables: • Prevalence • Incidence/absolute risk • Relative risk, Odds ratio • Absolute risk reduction or risk difference • Relative risk reduction, • Number needed to treat/harm
• Continuous variables: • Mean difference in final outcome measure (eg difference in means) (eg on average
participants receiving an intervention scored 10 points lower than the control group) • Standardised mean difference (difference in means/pooled standard deviation of both
groups – need SD and size of each group).
Prevalence = counts of events at one point in time / total number of people who could have had the event (the population at risk). It is not a rate as there is no time component.
Incidence = count of new events / population at risk over a given time period (a true rate described per unit of time). Those who already have the event at the start of the time period are excluded because they are not part of the population at risk.
Relative risk (RR)= prevalence in group 1/prevalence in group 2
Risk difference (RD) = prevalence in group 1‐ prevalence in group 2 = same thing as absolute risk reduction (absolute difference between two rates)
Relative risk reduction (RRR) = (1‐RR) x 100% (proportional difference between two rates)
Number needed to treat (NNT) = 1/RD
Patient and clinican acceptance DOES vary according to which results are presented. Read: Hux & Naylor Med Decis Making 1995;15;152‐7. http://www.ncbi.nlm.nih.gov/pubmed/7783576
Because measures of relative risk are relative to the comparator group, they can seem big or important. Very important to remember that the risk benefit ratio depends on the ABSOLUTE (baseline) risk.
Note that for Diagnostic‐type Questions, other measures of effect are generally used:
• Sensitivity, specificity • Positive predictive value • Negative predictive value • Likelihood ratio positive • Likelihood ratio negative
Please see the CEBM website for formulae etc –Specific diagnostic study materials are listed below.
Precision
How precise is the estimate of risk? Consider:
• Size of the P‐value (never by itself) • Size of the confidence intervals • Have all the important variables been considered? Adjustments made? Were results robust? • Was the effect of subjects refusing to participate evaluated? Sensitivity analyses? (see validity)
1.7 CAN WE APPLY THE RESULTS IN OUR SETTING?
• Consider external validity (generalizability), applicability, and individual preference (when considering patients or clients)
IMPORTANT QUESTIONS TO ASK
• What if I do nothing? • What other options do I have? • What are the benefits and harms of all the options? • Do I have enough information to make a decision?
SUMMARY OF CONSIDERATIONS IN CRITICIAL APPRAISAL
• Overall validity and quality • Consistency with other studies/evidence, Bradford‐Hill criteria • Interpretation of results • Relevance to your patient • Practical issues (e.g. local costs, feasibility)
EXAMPLE CHECK LISTS TO HELP WITH APPRAISING EVIDENCE (SEE SOME EXAMPLES BELOW) Useful sties for Appraisal checklists:
• STROBE observational studies in epidemiology e.g. for case‐control studies: https://www.strobe‐statement.org/fileadmin/Strobe/uploads/checklists/STROBE_ checklist_v4_case‐control.pdf
• PRISMA systematic reviews and meta‐analyses http://prisma‐statement.org/prismastatement/Checklist.aspx
1.8 KEY RESOURCES
Sackett DL, Rosenberg WMC, Gray JAM, Haynes RB, Richardson WS: Evidence based medicine: what it is and what it isn’t. BMJ 1996;312:71‐2. http://www.bmj.com/content/312/7023/71
Centre for Evidence‐based Medicine. University of Oxford (including Critical Appraisal
Sheets) http://www.cebm.net/
Polythenia gravis: the downside of evidence based medicine. BMJ 1995;311:1666
http://www.bmj.com/content/311/7021/1666
What is critical appraisal. Amanda Burls. University of Oxford
Schroter S, Black N, Evans S, Godlee F, Osorio L, Smith R. What errors do peer reviewers detect, and does training improve their ability to detect them? J R Soc Med 2008; 101(10): 507–514 http://www.ncbi.nlm.nih.gov/pmc/articles/PMC2586872/
How to review the evidence: systematic identification and review of the scientific literature.
The Environment and Disease: Association or Causation? Sir Austin Bradford Hill, Professor Emeritus of Medical Statistics, University of London) http://www.ncbi.nlm.nih.gov/pmc/articles/PMC1898525/pdf/procrsmed00196‐0010.pdf
Hux JE, Naylor CD. Communicating the benefits of chronic preventive therapy: does the format of efficacy data determine patients' acceptance of treatment? Med Decis Making 1995;15;152‐7 http://www.ncbi.nlm.nih.gov/pubmed/7783576
Phillips RS, Glasziou P. What makes evidence‐based journal clubs succeed? Evid Based Med
2004;9:36‐37
http://ebm.bmj.com/content/9/2/36.full
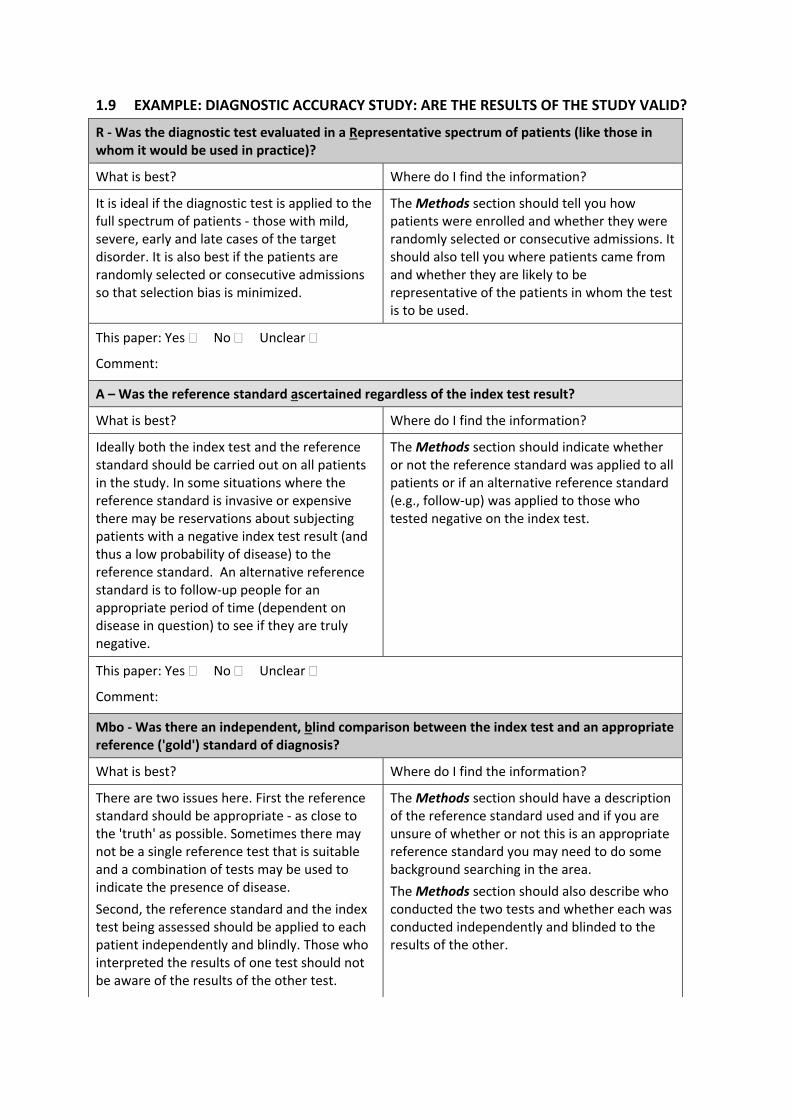
1.9 EXAMPLE: DIAGNOSTIC ACCURACY STUDY: ARE THE RESULTS OF THE STUDY VALID?
R ‐ Was the diagnostic test evaluated in a Representative spectrum of patients (like those in whom it would be used in practice)?
What is best? Where do I find the information?
It is ideal if the diagnostic test is applied to the full spectrum of patients ‐ those with mild, severe, early and late cases of the target disorder. It is also best if the patients are randomly selected or consecutive admissions so that selection bias is minimized.
The Methods section should tell you how patients were enrolled and whether they were randomly selected or consecutive admissions. It should also tell you where patients came from and whether they are likely to be representative of the patients in whom the test is to be used.
This paper: Yes No Unclear
Comment:
A – Was the reference standard ascertained regardless of the index test result?
What is best? Where do I find the information?
Ideally both the index test and the reference standard should be carried out on all patients in the study. In some situations where the reference standard is invasive or expensive there may be reservations about subjecting patients with a negative index test result (and thus a low probability of disease) to the reference standard. An alternative reference standard is to follow‐up people for an appropriate period of time (dependent on disease in question) to see if they are truly negative.
The Methods section should indicate whether or not the reference standard was applied to all patients or if an alternative reference standard (e.g., follow‐up) was applied to those who tested negative on the index test.
This paper: Yes No Unclear
Comment:
Mbo ‐ Was there an independent, blind comparison between the index test and an appropriate reference ('gold') standard of diagnosis?
What is best? Where do I find the information?
There are two issues here. First the reference standard should be appropriate ‐ as close to the 'truth' as possible. Sometimes there may not be a single reference test that is suitable and a combination of tests may be used to indicate the presence of disease.
Second, the reference standard and the index test being assessed should be applied to each patient independently and blindly. Those who interpreted the results of one test should not be aware of the results of the other test.
The Methods section should have a description of the reference standard used and if you are unsure of whether or not this is an appropriate reference standard you may need to do some background searching in the area.
The Methods section should also describe who conducted the two tests and whether each was conducted independently and blinded to the results of the other.
This paper: Yes No Unclear
Comment:
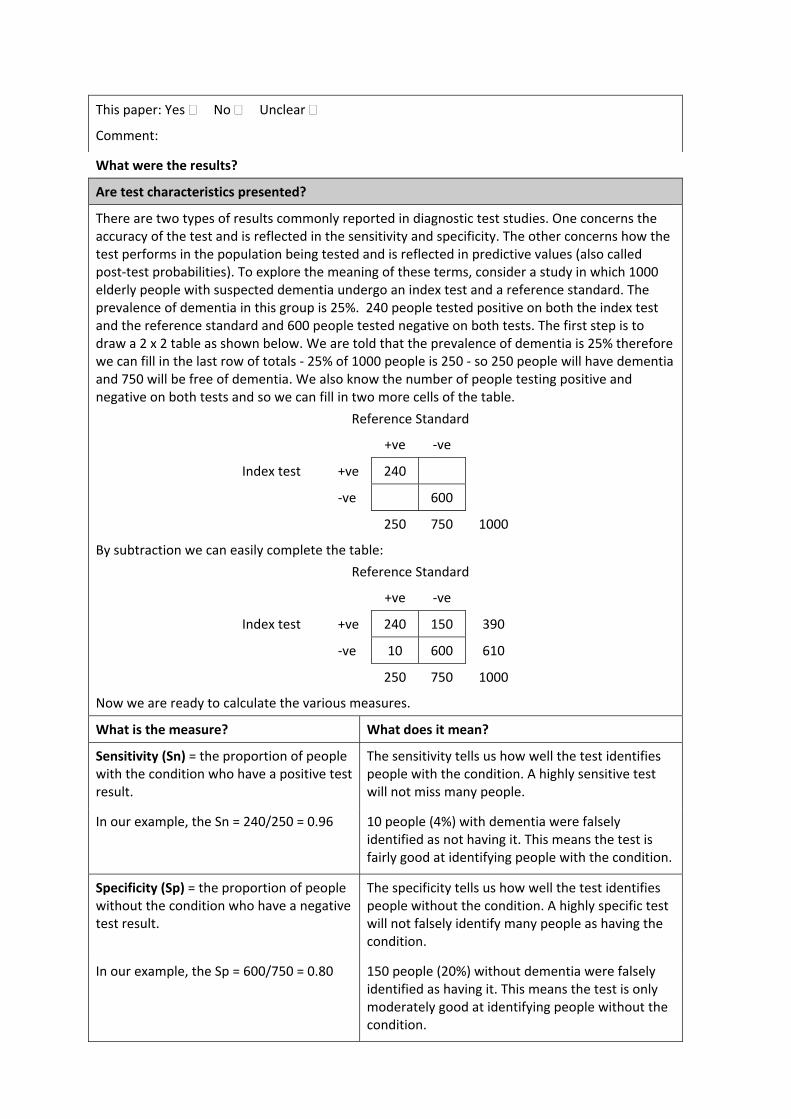
What were the results?
Are test characteristics presented?
There are two types of results commonly reported in diagnostic test studies. One concerns the accuracy of the test and is reflected in the sensitivity and specificity. The other concerns how the test performs in the population being tested and is reflected in predictive values (also called post‐test probabilities). To explore the meaning of these terms, consider a study in which 1000 elderly people with suspected dementia undergo an index test and a reference standard. The prevalence of dementia in this group is 25%. 240 people tested positive on both the index test and the reference standard and 600 people tested negative on both tests. The first step is to draw a 2 x 2 table as shown below. We are told that the prevalence of dementia is 25% therefore we can fill in the last row of totals ‐ 25% of 1000 people is 250 ‐ so 250 people will have dementia and 750 will be free of dementia. We also know the number of people testing positive and negative on both tests and so we can fill in two more cells of the table.
Reference Standard
+ve ‐ve
Index test +ve 240
‐ve 600
250 750 1000
By subtraction we can easily complete the table:
Reference Standard
+ve ‐ve
Index test +ve 240 150 390
‐ve 10 600 610
250 750 1000
Now we are ready to calculate the various measures.
What is the measure? What does it mean?
Sensitivity (Sn) = the proportion of people with the condition who have a positive test result.
The sensitivity tells us how well the test identifies people with the condition. A highly sensitive test will not miss many people.
In our example, the Sn = 240/250 = 0.96 10 people (4%) with dementia were falsely identified as not having it. This means the test is fairly good at identifying people with the condition.
Specificity (Sp) = the proportion of people without the condition who have a negative test result.
The specificity tells us how well the test identifies people without the condition. A highly specific test will not falsely identify many people as having the condition.
In our example, the Sp = 600/750 = 0.80 150 people (20%) without dementia were falsely identified as having it. This means the test is only moderately good at identifying people without the condition.
Positive Predictive Value (PPV) = the proportion of people with a positive test who have the condition.
This measure tells us how well the test performs in this population. It is dependent on the accuracy of the test (primarily specificity) and the prevalence of the condition.
In our example, the PPV = 240/390 = 0.62 Of the 390 people who had a positive test result, 62% will actually have dementia.
Negative Predictive Value (NPV) = the proportion of people with a negative test who do not have the condition.
This measure tells us how well the test performs in this population. It is dependent on the accuracy of the test and the prevalence of the condition.
In our example, the NPV = 600/610 = 0.98 Of the 610 people with a ‐ve test , 98% will not have dementia.
Application
1. Were the methods for performing the test described in sufficient detail to permit replication?
What is best? Where do I find the information?
The article should have sufficient description of the test to allow its replication and also interpretation of the results.
The Methods section should describe the test in detail.
This paper: Yes No Unclear
Comment:
1.10 EXAMPLE: THERAPY STUDY: ARE THE RESULTS OF THE TRIAL VALID? (INTERNAL VALIDITY)
What question did the study ask?
Patients –
Intervention ‐
Comparison ‐
Outcome(s) –
1a. R‐ Was the assignment of patients to treatments randomised?
What is best? Where do I find the information?
Centralised computer randomisation is ideal and often used in multi‐centred trials. Smaller trials may use an independent person (e.g, the hospital pharmacy) to “police” the randomization.
The Methods should tell you how patients were allocated to groups and whether or not randomisation was concealed.
This paper: Yes No Unclear
Comment:
1b. R‐ Were the groups similar at the start of the trial?
What is best? Where do I find the information?
If the randomisation process worked (that is, achieved comparable groups) the groups should be similar. The more similar the groups the better it is.
There should be some indication of whether differences between groups are statistically significant (ie. p values).
The Results should have a table of "Baseline Characteristics" comparing the randomized groups on a number of variables that could affect the outcome (ie. age, risk factors etc). If not, there may be a description of group similarity in the first paragraphs of the Results section.
This paper: Yes No Unclear
Comment:
2a. A – Aside from the allocated treatment, were groups treated equally?
What is best? Where do I find the information?
Apart from the intervention the patients in the different groups should be treated the same, eg., additional treatments or tests.
Look in the Methods section for the follow‐up schedule, and permitted additional treatments, etc and in Results for actual use.
This paper: Yes No Unclear
Comment:
2b. A – Were all patients who entered the trial accounted for? – and were they analysed in the groups to which they were randomised?
What is best? Where do I find the information?
Losses to follow‐up should be minimal – preferably less than 20%. However, if few patients have the outcome of interest, then even small losses to follow‐up can bias the results. Patients should also be analysed in the groups to which they were randomised – ‘intention‐to‐treat analysis’.
The Results section should say how many patients were 24randomised (eg., Baseline Characteristics table) and how many patients were actually included in the analysis. You will need to read the results section to clarify the number and reason for losses to follow‐up.
This paper: Yes No Unclear
Comment:
3. M ‐ Were measures objective or were the patients and clinicians kept “blind” to which treatment was being received?
What is best? Where do I find the information?
It is ideal if the study is ‘double‐blinded’ – that is, both patients and investigators are unaware of treatment allocation. If the outcome is objective (eg., death) then blinding is less critical. If the outcome is subjective (eg., symptoms or function) then blinding of the outcome assessor is critical.
First, look in the Methods section to see if there is some mention of masking of treatments, eg., placebos with the same appearance or sham therapy. Second, the Methods section should describe how the outcome was assessed and whether the assessor/s were aware of the patients' treatment.
This paper: Yes No Unclear
Comment:
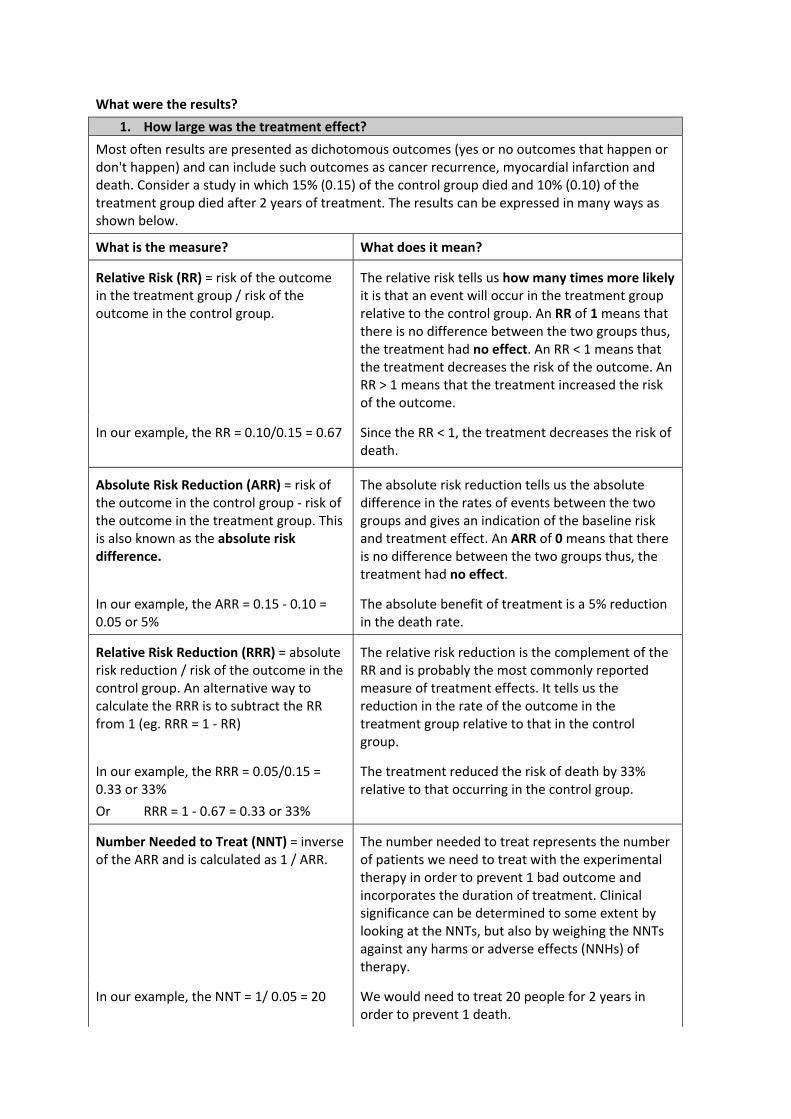
What were the results?
1. How large was the treatment effect?
Most often results are presented as dichotomous outcomes (yes or no outcomes that happen or don't happen) and can include such outcomes as cancer recurrence, myocardial infarction and death. Consider a study in which 15% (0.15) of the control group died and 10% (0.10) of the treatment group died after 2 years of treatment. The results can be expressed in many ways as shown below.
What is the measure? What does it mean?
Relative Risk (RR) = risk of the outcome in the treatment group / risk of the outcome in the control group.
The relative risk tells us how many times more likely it is that an event will occur in the treatment group relative to the control group. An RR of 1 means that there is no difference between the two groups thus, the treatment had no effect. An RR < 1 means that the treatment decreases the risk of the outcome. An RR > 1 means that the treatment increased the risk of the outcome.
In our example, the RR = 0.10/0.15 = 0.67 Since the RR < 1, the treatment decreases the risk of death.
Absolute Risk Reduction (ARR) = risk of the outcome in the control group ‐ risk of the outcome in the treatment group. This is also known as the absolute risk difference.
The absolute risk reduction tells us the absolute difference in the rates of events between the two groups and gives an indication of the baseline risk and treatment effect. An ARR of 0 means that there is no difference between the two groups thus, the treatment had no effect.
In our example, the ARR = 0.15 ‐ 0.10 = 0.05 or 5%
The absolute benefit of treatment is a 5% reduction in the death rate.
Relative Risk Reduction (RRR) = absolute risk reduction / risk of the outcome in the control group. An alternative way to calculate the RRR is to subtract the RR from 1 (eg. RRR = 1 ‐ RR)
The relative risk reduction is the complement of the RR and is probably the most commonly reported measure of treatment effects. It tells us the reduction in the rate of the outcome in the treatment group relative to that in the control group.
In our example, the RRR = 0.05/0.15 = 0.33 or 33%
Or RRR = 1 ‐ 0.67 = 0.33 or 33%
The treatment reduced the risk of death by 33% relative to that occurring in the control group.
Number Needed to Treat (NNT) = inverse of the ARR and is calculated as 1 / ARR.
The number needed to treat represents the number of patients we need to treat with the experimental therapy in order to prevent 1 bad outcome and incorporates the duration of treatment. Clinical significance can be determined to some extent by looking at the NNTs, but also by weighing the NNTs against any harms or adverse effects (NNHs) of therapy.
In our example, the NNT = 1/ 0.05 = 20 We would need to treat 20 people for 2 years in order to prevent 1 death.
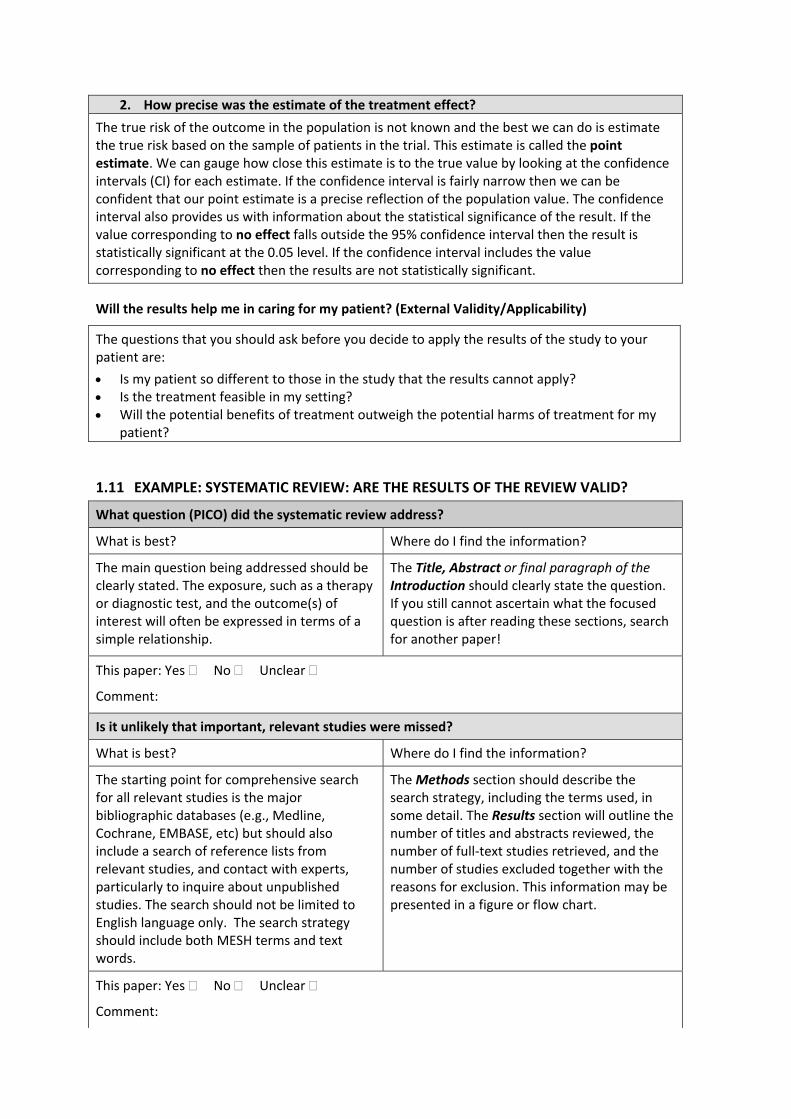
2. How precise was the estimate of the treatment effect?
The true risk of the outcome in the population is not known and the best we can do is estimate the true risk based on the sample of patients in the trial. This estimate is called the point estimate. We can gauge how close this estimate is to the true value by looking at the confidence intervals (CI) for each estimate. If the confidence interval is fairly narrow then we can be confident that our point estimate is a precise reflection of the population value. The confidence interval also provides us with information about the statistical significance of the result. If the value corresponding to no effect falls outside the 95% confidence interval then the result is statistically significant at the 0.05 level. If the confidence interval includes the value corresponding to no effect then the results are not statistically significant.
Will the results help me in caring for my patient? (External Validity/Applicability)
The questions that you should ask before you decide to apply the results of the study to your patient are:
Is my patient so different to those in the study that the results cannot apply? Is the treatment feasible in my setting? Will the potential benefits of treatment outweigh the potential harms of treatment for my
patient?
1.11 EXAMPLE: SYSTEMATIC REVIEW: ARE THE RESULTS OF THE REVIEW VALID?
What question (PICO) did the systematic review address?
What is best? Where do I find the information?
The main question being addressed should be clearly stated. The exposure, such as a therapy or diagnostic test, and the outcome(s) of interest will often be expressed in terms of a simple relationship.
The Title, Abstract or final paragraph of the Introduction should clearly state the question. If you still cannot ascertain what the focused question is after reading these sections, search for another paper!
This paper: Yes No Unclear
Comment:
Is it unlikely that important, relevant studies were missed?
What is best? Where do I find the information?
The starting point for comprehensive search for all relevant studies is the major bibliographic databases (e.g., Medline, Cochrane, EMBASE, etc) but should also include a search of reference lists from relevant studies, and contact with experts, particularly to inquire about unpublished studies. The search should not be limited to English language only. The search strategy should include both MESH terms and text words.
The Methods section should describe the search strategy, including the terms used, in some detail. The Results section will outline the number of titles and abstracts reviewed, the number of full‐text studies retrieved, and the number of studies excluded together with the reasons for exclusion. This information may be presented in a figure or flow chart.
This paper: Yes No Unclear
Comment:
Were the criteria used to select articles for inclusion appropriate?
What is best? Where do I find the information?
The inclusion or exclusion of studies in a systematic review should be clearly defined a priori. The eligibility criteria used should specify the patients, interventions or exposures and outcomes of interest. In many cases the type of study design will also be a key component of the eligibility criteria.
The Methods section should describe in detail the inclusion and exclusion criteria. Normally, this will include the study design.
This paper: Yes No Unclear
Comment:
Were the included studies sufficiently valid for the type of question asked?
What is best? Where do I find the information?
The article should describe how the quality of each study was assessed using predetermined quality criteria appropriate to the type of clinical question (e.g., randomization, blinding and completeness of follow‐up)
The Methods section should describe the assessment of quality and the criteria used. The Results section should provide information on the quality of the individual studies.
This paper: Yes No Unclear
Comment:
Were the results similar from study to study?
What is best? Where do I find the information?
Ideally, the results of the different studies should be similar or homogeneous. If heterogeneity exists the authors may estimate whether the differences are significant (chi‐square test). Possible reasons for the heterogeneity should be explored.
The Results section should state whether the results are heterogeneous and discuss possible reasons. The forest plot should show the results of the chi‐square test for heterogeneity and if discuss reasons for heterogeneity, if present.
This paper: Yes No Unclear
Comment:
What were the results?
How are the results presented?
A systematic review provides a summary of the data from the results of a number of individual studies. If the results of the individual studies are similar, a statistical method (called meta‐analysis) is used to combine the results from the individual studies and an overall summary estimate is calculated. The meta‐analysis gives weighted values to each of the individual studies according to their size. The individual results of the studies need to be expressed in a standard way, such as relative risk, odds ratio or mean difference between the groups. Results are traditionally displayed in a figure, like the one below, called a forest plot.
The forest plot depicted above represents a meta‐analysis of 5 trials that assessed the effects of a hypothetical treatment on mortality. Individual studies are represented by a black square and a horizontal line, which corresponds to the point estimate and 95% confidence interval of the odds ratio. The size of the black square reflects the weight of the study in the meta‐analysis. The solid vertical line corresponds to ‘no effect’ of treatment ‐ an odds ratio of 1.0. When the confidence interval includes 1 it indicates that the result is not significant at conventional levels (P>0.05).
The diamond at the bottom represents the combined or pooled odds ratio of all 5 trials with its 95% confidence interval. In this case, it shows that the treatment reduces mortality by 34% (OR 0.66 95% CI 0.56 to 0.78). Notice that the diamond does not overlap the ‘no effect’ line (the confidence interval doesn’t include 1) so we can be assured that the pooled OR is statistically significant. The test for overall effect also indicates statistical significance (p<0.0001).
Exploring heterogeneity
Heterogeneity can be assessed using the “eyeball” test or more formally with statistical tests, such as the Cochran Q test. With the “eyeball” test one looks for overlap of the confidence intervals of the trials with the summary estimate. In the example above note that the dotted line running vertically through the combined odds ratio crosses the horizontal lines of all the individual studies indicating that the studies are homogenous. Heterogeneity can also be assessed using the Cochran chi‐square (Cochran Q). If Cochran Q is statistically significant there is definite heterogeneity. If Cochran Q is not statistically significant but the ratio of Cochran Q and the degrees of freedom (Q/df) is > 1 there is possible heterogeneity. If Cochran Q is not statistically significant and Q/df is < 1 then heterogeneity is very unlikely. In the example above Q/df is <1 (0.92/4= 0.23) and the p‐value is not significant (0.92) indicating no heterogeneity.
Note: The level of significance for Cochran Q is often set at 0.1 due to the low power of the test to detect heterogeneity.
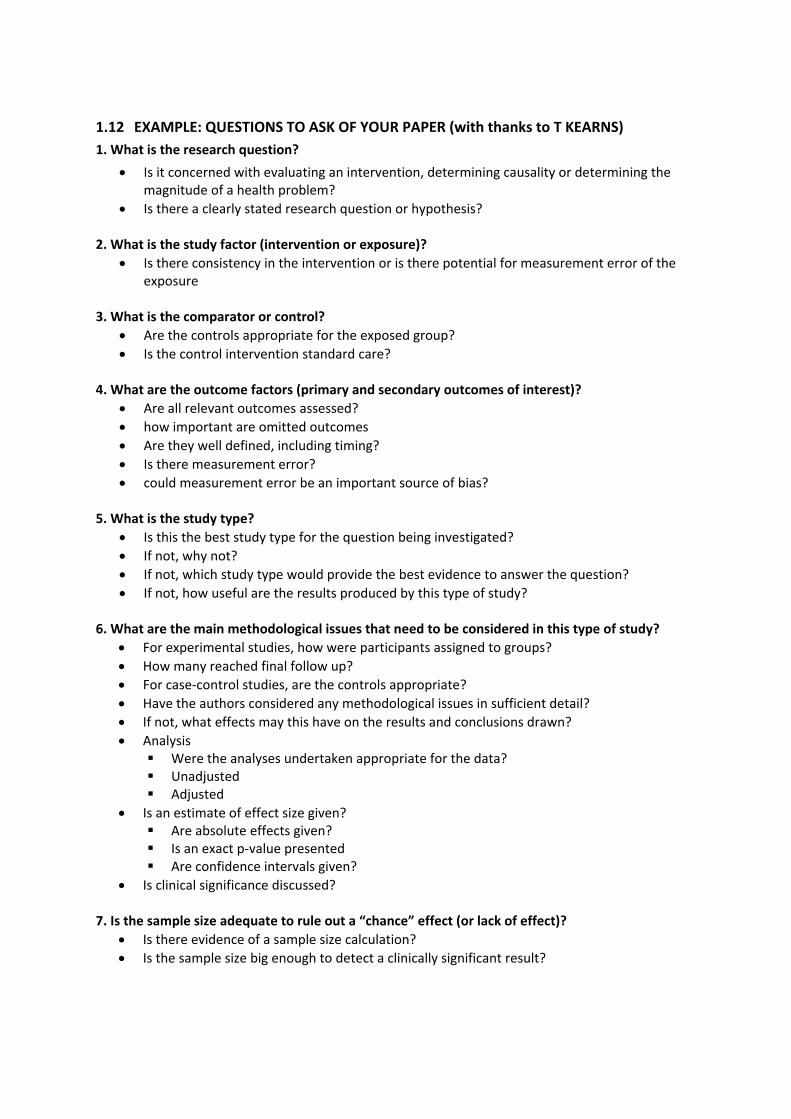
1.12 EXAMPLE: QUESTIONS TO ASK OF YOUR PAPER (with thanks to T KEARNS)
1. What is the research question?
Is it concerned with evaluating an intervention, determining causality or determining the magnitude of a health problem?
Is there a clearly stated research question or hypothesis? 2. What is the study factor (intervention or exposure)?
Is there consistency in the intervention or is there potential for measurement error of the exposure
3. What is the comparator or control?
Are the controls appropriate for the exposed group?
Is the control intervention standard care?
4. What are the outcome factors (primary and secondary outcomes of interest)?
Are all relevant outcomes assessed?
how important are omitted outcomes
Are they well defined, including timing?
Is there measurement error?
could measurement error be an important source of bias?
5. What is the study type?
Is this the best study type for the question being investigated?
If not, why not?
If not, which study type would provide the best evidence to answer the question?
If not, how useful are the results produced by this type of study?
6. What are the main methodological issues that need to be considered in this type of study?
For experimental studies, how were participants assigned to groups?
How many reached final follow up?
For case‐control studies, are the controls appropriate?
Have the authors considered any methodological issues in sufficient detail?
If not, what effects may this have on the results and conclusions drawn?
Analysis Were the analyses undertaken appropriate for the data? Unadjusted Adjusted
Is an estimate of effect size given? Are absolute effects given? Is an exact p‐value presented Are confidence intervals given?
Is clinical significance discussed? 7. Is the sample size adequate to rule out a “chance” effect (or lack of effect)?
Is there evidence of a sample size calculation?
Is the sample size big enough to detect a clinically significant result?
8. Is there any potential for bias (consider selection bias and measurement bias)?
If yes, what are these?
If yes, have the authors dealt with them adequately?
If there is bias, how could that affect the result and conclusions, and the external validity of the study?
9. Is there any potential for confounding?
If yes, detail what those confounders might be
If yes, have the authors adequately dealt with these (i.e. examined and controlled for)
10. What is/are the main finding(s) of the research?
Do you believe the authors’ conclusions? Are they valid?
If you don’t believe them, why not?
If you don’t believe them, what should you do next to find “the truth”?
If you do believe them, are the results generalisable to the wider population (that is, outside the people who participated in this study?)
Do they answer the original research question? Are the results of this aetiology (risk factor) study valid?
Did the study address a clearly focused issue?
A question can be focused in terms of:
the population studied
the risk factors studied
whether the study tried to detect a beneficial or harmful effect?
Did the authors use an appropriate method to answer their question?
Consider:
is the study method an appropriate way of answering the question under the circumstances? (is the outcome rare or harmful?)
did it address the study question?
Were the cases recruited in an acceptable way?
HINT: We are looking for selection bias which might compromise the validity of the findings:
Are the cases defined precisely?
Were the cases representative of a defined population (geographically and/or temporally)?
Was there an established reliable system for selecting all the cases?
Are they incident or prevalent?
Is there something special about the cases?
Is the time frame of the study relevant to the disease/exposure?
Was there a sufficient number of cases selected?
Was there a power calculation?
Were the controls selected in an acceptable way?
HINT: We are looking for selection bias which might compromise the generalisability of the findings:
Were the controls representative of a defined population (geographically and/or temporally)?
Was there something special about the controls?
Was the non‐response high? Could non‐ respondents be different in any way?
Are they matched, population based or randomly selected?
Was there a sufficient number of controls selected?
Was the exposure accurately measured to minimise bias?
HINT: We are looking for measurement, recall or classification bias:
Was the exposure clearly defined and accurately measured?
Did the authors use subjective or objective measurements?
Do the measures truly reflect what they are supposed to measure? (have they been validated?)
Were the measurement methods similar in cases and controls?
Did the study incorporate blinding where feasible?
Is the temporal relation correct? (does the exposure of interest precede the outcome?)
What confounding factors have the authors accounted for?
Hint: List the other ones you think might be important, that the authors missed (genetic, environmental and socio‐economic)
Have the authors taken account of the potential confounding factors in the design and/or in their analysis?
HINT: Look for restriction in design, and techniques, e.g. modelling, stratified‐, regression‐, or sensitivity analysis to correct, control or adjust for confounding factors.
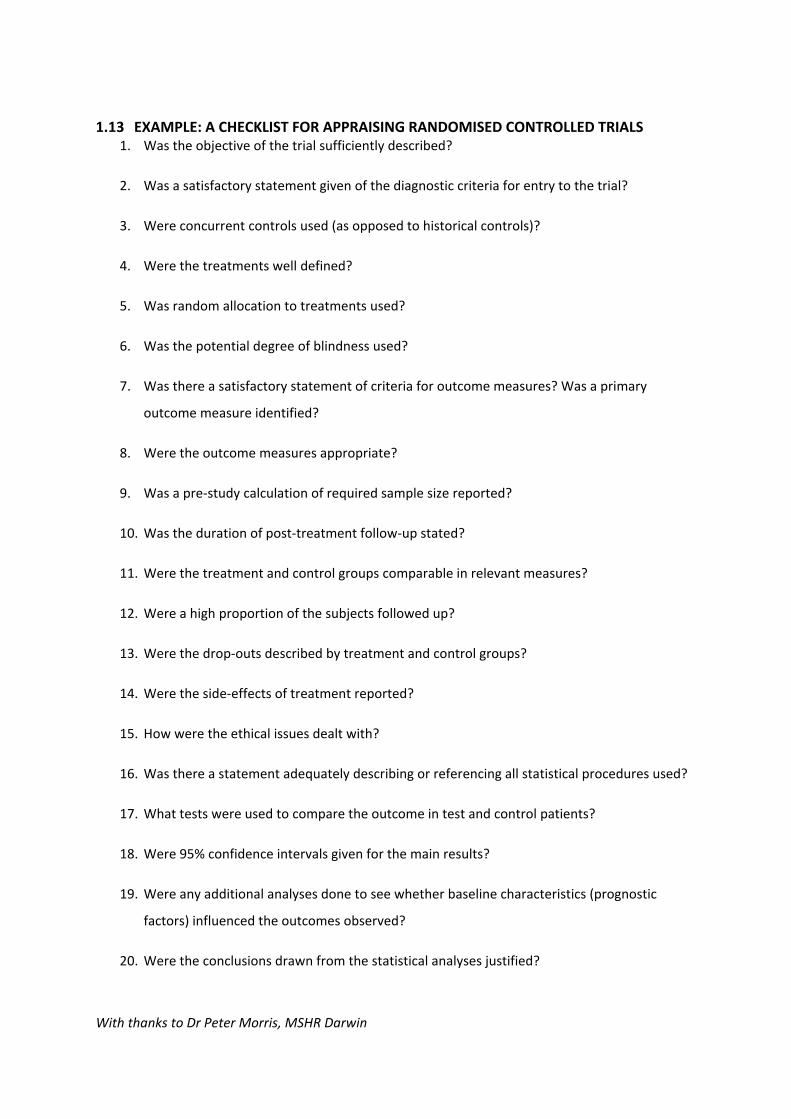
1.13 EXAMPLE: A CHECKLIST FOR APPRAISING RANDOMISED CONTROLLED TRIALS 1. Was the objective of the trial sufficiently described?
2. Was a satisfactory statement given of the diagnostic criteria for entry to the trial?
3. Were concurrent controls used (as opposed to historical controls)?
4. Were the treatments well defined?
5. Was random allocation to treatments used?
6. Was the potential degree of blindness used?
7. Was there a satisfactory statement of criteria for outcome measures? Was a primary
outcome measure identified?
8. Were the outcome measures appropriate?
9. Was a pre‐study calculation of required sample size reported?
10. Was the duration of post‐treatment follow‐up stated?
11. Were the treatment and control groups comparable in relevant measures?
12. Were a high proportion of the subjects followed up?
13. Were the drop‐outs described by treatment and control groups?
14. Were the side‐effects of treatment reported?
15. How were the ethical issues dealt with?
16. Was there a statement adequately describing or referencing all statistical procedures used?
17. What tests were used to compare the outcome in test and control patients?
18. Were 95% confidence intervals given for the main results?
19. Were any additional analyses done to see whether baseline characteristics (prognostic
factors) influenced the outcomes observed?
20. Were the conclusions drawn from the statistical analyses justified?
With thanks to Dr Peter Morris, MSHR Darwin
Research Skills Seminar Series 2018Research Education Program
Consumer and CommunityInvolvement in ResearchFriday, 18 May 12:30 – 1:30PM
Every researcher should be actively involving consumer or community members to improve quality and increase impact of their research.
Community involvement is increasingly a requirement for funding agencies. This seminar provides a practical introduction and will cover basic principles of community and consumer involvement, the benefits and barriers, and what to put in place to get started.
Princess Margaret HospitalMacdonald Lecture Theatre
Admin Building
*Online VC via Scopia App
*Hosted VC Sites Include:Armadale Hospital
Bunbury Hospital
Curtin University
Fiona Stanley Hospital
Joondalup Health Campus
King Edward Memorial Hospital
Midland Community Health Centre
Royal Perth Hospital
Sir Charles Gairdner Hospital
For more locations, visit:ResearchEducationProgram.org
ResearchEducationProgram.orgThe Research Skills Seminar Series is part of the Research Education Program, Dept. of Child Health Research, Princess Margaret
Hospital, WA Department of Health. Seminars are hosted by WA Department of Health.
Register OnlineResearchEducationProgram
.eventbrite.com
McKenzie AM is the Head of the Consumer and Community Health Research Network which is an enabling platform of the WA Health Translation Network. Anne is a senior consumer representative for state and national health committees and former Chair of the Health Consumers Council WA. In 2004 Anne established the inaugural role of the Parent Advocate at PMH and has a long history of consumer advocacy with WA health services.
Research Skills Seminar Series 2018Research Education Program
Survey Design & TechniquesStrategies for developing and delivering successful surveys
Friday, 25 May 12:30 – 1:30PM
Surveys, including clinical audits, are one of the most commonly conducted clinical research projects. There is a lot more to doing these well than meets the eye.
This seminar provides practical help for planning and conducting surveys. It includes good survey design, approval pathways, sampling and administration methods, writing high quality questionnaires & data collection instruments, maximising response rates and reducing data errors.
Princess Margaret HospitalMacdonald Lecture Theatre
Admin Building*Location may change due to PCH Transition
*Online VC via Scopia App
*Hosted VC Sites Include:Armadale Hospital
Bunbury Hospital
Curtin University
Fiona Stanley Hospital
Joondalup Health Campus
King Edward Memorial Hospital
Midland Community Health Centre
Royal Perth Hospital
Sir Charles Gairdner Hospital
For more locations, visit:ResearchEducationProgram.org
ResearchEducationProgram.orgThe Research Skills Seminar Series is part of the Research Education Program, Dept. of Child Health Research, Princess Margaret
Hospital, WA Department of Health. Seminars are hosted by WA Department of Health.
Register OnlineResearchEducationProgram
.eventbrite.com
A/Prof Sue Skull is a paediatrician, epidemiologist, public health physician and researcher. She is an experienced teacher of research methods and enjoys helping others improve and enjoy their research experience.
All sessions held Fridays 12:30 – 1:30 PM Macdonald Lecture Theatre, Princess Margaret Hospital for Children
Date Topic (abbreviated)
Presenter
1 Feb 9 Research Fundamentals – Question and Protocol Development Sue Skull
2 Feb 23 Introductory Biostatistics – Understanding and reporting research results including P‐values and Confidence intervals
Julie Marsh
3 Mar 9 Introduction into Good Clinical Practice Natalie Barber
4 Mar 23 Scientific Writing Sue Skull
5 Apr 6 Ethics for Research ‐ Practical Ethical Considerations: Obstacle or Powerful Tool?
Nik Zeps
6 May 4 Rapid Critical Appraisal of Scientific Literature Sue Skull
7 May 18 Consumer and Community Involvement in Research Anne McKenzie
8 May 25 Survey Design & Techniques Sue Skull
9 Jun 22 Getting the most out of Research Supervision – Tips for Students and Supervisors
Jonathan Carapetis
10 Jul 20 Knowledge Translation Fenella Gill/ Anthony Kicic
11 Aug 3 Ethics Processes within Health Research Sue Skull
12 Aug 10 Conducting Systematic Reviews Sonya Girdler
13 Aug 24 Media and Communication in Research – How to refine and pitch your message for maximum impact
Liz Chester
14 Sep 7 Sample Size Calculations Julie Marsh
15 Sep 14 Data Collection and Management
Sue Skull
16 Oct 19 Conducting Research with the Indigenous Community Michael Wright/ Sue Skull
17 Oct 26 Statistical Tips for Interpreting Scientific Claims Julie Marsh
18 Nov 2 Oral Presentation of Research Results Sue Skull
19 Nov 16 Research Governance TBC
20 Nov 30 Grant Applications and Finding Funding Sue Skull
21 Dec 7 Qualitative Research Methods *NEW* Dianne Wynaden
*Topics may move or change; email notice will be provided *All seminars and corresponding handouts are regularly revised and updated *Attendance Certificates are available upon request *Location may change upon move to Perth Children’s Hospital *For hosted videoconference sites, go to ResearchEducationProgram.org
Research Skills Seminar Series 2018Research Education Program
Copyright to this material produced by the ResearchEducation Program, Department of Child Health Research,Princess Margaret Hospital, Western Australia, under theprovisions of the Copyright Act 1968 (C’wth Australia). Apartfrom any fair dealing for personal, academic, research or non-commercial use, no part may be reproduced without writtenpermission. The Department of Child Health Research is underno obligation to grant this permission. Please acknowledge theResearch Education Program, Department of Child HealthResearch, Princess Margaret Hospital when reproducing orquoting material from this source.
RESEARCH SKILLS SEMINAR SERIES 2018 Part of the Research Education Program
Department of Child Health ResearchPrincess Margaret Hospital for Children
The Research Skills Seminar Series is part of the Research Education Program, Dept. of Child Health Research, Princess Margaret Hospital, WA Department of Health.
Seminars are hosted by WA Department of Health.
RESEARCH SKILLS SEMINAR SERIES 2018SEMINAR FEEDBACK FORM
INSTRUCTIONS: - Please rate the following statements
- Use a pen to mark circles
- One response per item
- Please return to coordinator
SEMINAR:
DATE:
LECTURER/S:
1. How did you attend the seminar?
Not Applicable
Strongly Disagree
Disagree Neither Agree nor Disagree
Agree Strongly Agree
2. The aim and learning objectives were clear.(I felt well informed about scope and content)
O O O O O O
3. The learning materials were helpful.(handouts, slides, lecture notes supported learning)
O O O O O O
4. The session content was well structured. O O O O O O
5. The material was presented in a way which maintained my interest. O O O O O O
6. The material challenged me to think more critically about the subject.(covered at the right level)
O O O O O O
7. The lecturer/s communicated clearly.(lecture presentation, clear instructions)
O O O O O O
8. The material presented extended my knowledge in this area. O O O O O O
9. What were the best aspects?
10. What changes would you suggest?
11. How did you hear about the seminar?You may select multiple responses
O Email Invitation from Research Skills Seminar Series
O “Health Happenings” E-News O “What’s Happening at CAHS” E-News
O Healthpoint Intranet
O Displayed Poster/Flyer
O Other (please specify):
e.g. Curtin email, CACH, colleague, supervisor etc.
THANK YOU - your comments will be provided to the presenter and inform other education activities.