RESEARCH PAPER Rapid detection of bacterial infection and viability assessment with high specificity and sensitivity using Raman microspectroscopy Srividya Kumar 1 & Renu Gopinathan 2 & Goutam Kumar Chandra 1,3 & Siva Umapathy 1,4 & Deepak Kumar Saini 2,5,6 Received: 14 November 2019 /Revised: 5 January 2020 /Accepted: 30 January 2020 # Springer-Verlag GmbH Germany, part of Springer Nature 2020 Abstract Infectious diseases caused by bacteria still pose major diagnostic challenges in spite of the availability of various molecular approaches. Irrespective of the type of infection, rapid identification of the causative pathogen with a high degree of sensitivity and specificity is essential for initiating appropriate treatment. While existing methods like PCR possess high sensitivity, they are incapable of identifying the viability status of the pathogen and those which can, like culturing, are inherently slow. To overcome these limitations, we developed a diagnostic platform based on Raman microspectroscopy, capable of detecting biochemical signatures from a single bacterium for identification as well as viability assessment. The study also establishes a decontamination protocol for handling live pathogenic bacteria which does not affect identification and viability testing, showing applicability in the analysis of sputum samples containing pathogenic mycobacterial strains. The minimal sample processing along with mul- tivariate analysis of spectroscopic signatures provides an interface for automatic classification, allowing the prediction of unknown samples by mapping signatures onto available datasets. Also, the novelty of the current work is the demonstration of simultaneous identification and viability assessment at a single bacterial level for pathogenic bacteria. Keywords Mycobacterium tuberculosis . Diagnosis . Raman spectroscopy . Viability assessment Introduction Rapid and accurate diagnosis of the causative organism plays a vital role in infectious disease epidemiology [1]; however, one of the fundamental challenges in this area lies in the ac- curate identification of the causative agent. The need is to have a method that not only identifies pathogen signatures accurate- ly but also provides the viability status of the pathogen, which is imperative for understanding the pathogen’ s response to therapy and for deciding on a future therapeutic regimen. Conventional diagnostic techniques like microbial staining or culturing of the pathogen from clinical samples remain the gold standard for detection of many pathogens including Mycobacterium tuberculosis, the causative organism of tuber- culosis (TB). Although these approaches are relatively inex- pensive and simple, the major disadvantage is that they are contingent on the bacterial load in the sample and the time taken for identification may vary from days to weeks depend- ing on the bacteria. For example, smear culturing requires at least 10 4 bacilli per milliliter of sputum sample [ 2 ]. Furthermore, only live culturable bacteria can be detected using standard growth-based techniques. Viable but non- culturable bacteria (VBNCs) which are metabolically viable Electronic supplementary material The online version of this article (https://doi.org/10.1007/s00216-020-02474-2) contains supplementary material, which is available to authorized users. * Siva Umapathy [email protected]* Deepak Kumar Saini [email protected]1 Department of Inorganic and Physical Chemistry, Indian Institute of Science, Bangalore 560012, India 2 Department of Molecular Reproduction, Development and Genetics, Indian Institute of Science, Bangalore 560012, India 3 Department of Physics, NIT Calicut, Calicut, Kerala 673601, India 4 Department of Instrumentation and Applied Physics, Indian Institute of Science, Bangalore 560012, India 5 Centre for Biosystems Science and Engineering, Indian Institute of Science, Bangalore 560012, India 6 Centre for Infectious Diseases Research, Indian Institute of Science, Bangalore 560012, India Analytical and Bioanalytical Chemistry https://doi.org/10.1007/s00216-020-02474-2
Transcript
RESEARCH PAPER
Rapid detection of bacterial infection and viability assessmentwith high specificity and sensitivity using Raman microspectroscopy
Received: 14 November 2019 /Revised: 5 January 2020 /Accepted: 30 January 2020# Springer-Verlag GmbH Germany, part of Springer Nature 2020
AbstractInfectious diseases caused by bacteria still pose major diagnostic challenges in spite of the availability of various molecularapproaches. Irrespective of the type of infection, rapid identification of the causative pathogen with a high degree of sensitivityand specificity is essential for initiating appropriate treatment. While existing methods like PCR possess high sensitivity, they areincapable of identifying the viability status of the pathogen and those which can, like culturing, are inherently slow. To overcomethese limitations, we developed a diagnostic platform based on Raman microspectroscopy, capable of detecting biochemicalsignatures from a single bacterium for identification as well as viability assessment. The study also establishes a decontaminationprotocol for handling live pathogenic bacteria which does not affect identification and viability testing, showing applicability inthe analysis of sputum samples containing pathogenic mycobacterial strains. The minimal sample processing along with mul-tivariate analysis of spectroscopic signatures provides an interface for automatic classification, allowing the prediction ofunknown samples by mapping signatures onto available datasets. Also, the novelty of the current work is the demonstrationof simultaneous identification and viability assessment at a single bacterial level for pathogenic bacteria.
Rapid and accurate diagnosis of the causative organism playsa vital role in infectious disease epidemiology [1]; however,one of the fundamental challenges in this area lies in the ac-curate identification of the causative agent. The need is to havea method that not only identifies pathogen signatures accurate-ly but also provides the viability status of the pathogen, whichis imperative for understanding the pathogen’s response totherapy and for deciding on a future therapeutic regimen.
Conventional diagnostic techniques like microbial stainingor culturing of the pathogen from clinical samples remain thegold standard for detection of many pathogens includingMycobacterium tuberculosis, the causative organism of tuber-culosis (TB). Although these approaches are relatively inex-pensive and simple, the major disadvantage is that they arecontingent on the bacterial load in the sample and the timetaken for identification may vary from days to weeks depend-ing on the bacteria. For example, smear culturing requires atleast 104 bacilli per milliliter of sputum sample [2].Furthermore, only live culturable bacteria can be detectedusing standard growth-based techniques. Viable but non-culturable bacteria (VBNCs) which are metabolically viable
Electronic supplementary material The online version of this article(https://doi.org/10.1007/s00216-020-02474-2) contains supplementarymaterial, which is available to authorized users.
but not culturable due to the lack of knowledge of their pre-ferred growth conditions or due to dormancy successfullyelude culturing tests, thereby resulting in false negatives andmaking these techniques non-adaptable for point-of-care di-agnostics. Recent advances in molecular biology have facili-tated the development of polymerase chain reaction (PCR) [3,4] and other nucleic acid-based amplification techniques suchas line amplification assay [5] and serology-based assays asmethods of choice for accurate and rapid prognosis withoutthe need for cultivation of the pathogen [6]. However, they arefraught with either low sensitivity due to a paucity of organ-isms in the sample or they provide false-positive results due tocontamination of the sample with environmental bacteria [2].A further complication is introduced by the fact that DNA canbe isolated from both live and dead organisms and thus cannotconfirm the presence of live pathogens. Moreover, assayswhich rely on detecting circulating antibodies against patho-gen antigens have the major limitation of cross reactivity ofantibodies to antigens from closely related bacterial specieswhich can generate false-positive results [3]. Furthermore,these assays do not provide information regarding the resis-tance to the antimicrobial agents unless they have standardmutations [7–9]. Skill intensiveness and multistep sample pro-cessing designs of existing diagnostic technologies also re-quire trained manpower, which may be a limitation at thepoint of care in low-income countries.
Therefore, a technique which can specifically analyze bio-chemical signatures of bacteria and distinguish live from deadpopulations can aid in addressing these requirements. One ofthe ways to fingerprint the complete biochemical compositionof an organism is to use vibrational microspectroscopic tech-niques, namely infrared and Raman spectroscopy [10–14].These techniques can capture bond-specific vibrations frombiochemical constituents of the cell. They can also achievespatial resolution for single bacterial or single colony bio-chemical fingerprinting using a microscope along with a spec-trograph. Infrared and Raman microspectroscopy along withmultivariate analysis has been employed previously in strain-specific identification of bulk bacterial samples [15–17]. Dueto the challenges of infrared optics, analysis of a single bacte-rium is arduous. In contrast, Raman microspectroscopy whichprimarily operates in the visible spectrum can attain high spa-tial resolution with the use of high magnification and highnumerical aperture (NA) objectives.
In this study, we have demonstrated simultaneous identifi-cation and viability assessment of bacteria using tuberculosis(TB)-causing bacteria, Mycobacterium tuberculosis, as themodel system. Towards this, primarily, a background-freesubstrate is developed for Raman analysis of a single bacteri-um. Secondly, an appropriate fixative agent suitable forRaman analysis of bacteria, which makes them non-viablewithout affecting their biochemical signatures, is described.Further, viability assessment was demonstrated for bacteria
spiked in artificial sputum. Finally, a proof of concept show-ing a concurrent methodology for species identification andviability assessment using Raman microspectroscopy is pre-sented. Though there are reports on single bacterial identifica-tion of tuberculosis, the novelty of the work is the concurrentapproach for viability assessment for the pathogenic bacteria.Furthermore, the method can be scaled to any number andtype of bacteria.
Materials and methods
Description of protocols regarding bacterial strains and cul-ture, fixation, drug and artificial sputum treatment of bacteria,and their biological viability assessment are given in theElectronic Supplementary Material (ESM).
Substrate fabrication Fig. S1 (see ESM) depicts briefly theprotocol utilized for fabricating the substrate. 100 p-type sili-con (Si) wafer was cleaned to remove any oxides or ions usingthe standard RCA cleaning procedure, followed by depositionof a layer of 200 nm aluminum using either thermal evapora-tion or by sputter coating. The deposited aluminum wasannealed at 400 °C in a N2 atmosphere for 15 min. Thesesubstrates were stored inside a desiccator until use. The bac-teria were dry-casted on the substrate. Further, the substratewas mounted on an aluminum holder which facilitates mount-ing to the microscope stage.
Processing of bacterial samples for Raman spectroscopy Thecells were pelleted and washed with 1 ml of deionized water.Washing was repeated twice for cultured bacteria and 5 timesfor cells obtained from the sputum. After the last wash, thepellet was resuspended in MilliQ water and from that1.5 Microlitre was cast on the fabricated Raman substrate anddried at room temperature before spectroscopic measurements.
Raman microspectroscopy analysis Raman measurementswere performed using a Renishaw InVia Ramanmicrospectroscope. Initial experiments on quartz substratewere performed using 514 nm laser whose results are shownin Fig. S2 (see ESM). Further experiments were performedusing the 633 nm on an upright microscope with a laser powerof ~ 10 mW. The Raman spectra of individual bacteria werecollected using a ×100 dry objective (0.8 NA). The sameobjective was used to collect the backscattered light from thesample. The scattered radiation was passed through a notchfilter, focused onto a monochromator with 1200 lines/mmgrating, and detected using a Peltier cooled CCD camera(256 × 1048 pixels sensor). For spectroscopic evaluation ofthe lower wavenumber region (500–1900 cm−1), the bacteriawere exposed for 15 s and the spectra were accumulated 5times to get a good SNR. For the higher region (2800–
Kumar S. et al.
3000 cm−1), 10 s exposure and 3 accumulations were done.Each experiment has three biological replicates, and each bi-ological replicate had a minimum of two technical replicates.A minimum of fifty bacteria were sampled from each biolog-ical replicate. In total, more than 2500 spectra were used forsimultaneous identification and viability assessment. Further,for imaging experiments, more than a thousand spectra werecollected which depends on the size of the imaging area. Afterdata collection, the spectra were subjected to pre-processingincluding cosmic ray removal, multipoint base line correction,Savitzky-Golay smoothing, and vector normalization usingRenishaw wire 4.2, OriginPro 8.5 and Unscrambler 10 soft-ware. Unlike univariate analysis where few wavenumbers arepicked for analysis, all the wavenumbers of a spectrum areemployed for the analysis. IBM SPSS 17.0 for canonical dis-criminant analysis (CDA) and Unscrambler 10 was employedfor principal component-linear discriminant analysis (PC-LDA) in which predictions of unknown samples were per-formed. The CDA uses the leave-one-out-cross validation(LOOCV) method to validate the model. In this method, onesample is kept out as test data and the rest of the sample isemployed to build the training dataset. Then the test data is fedto check whether it is being correctly identified in their respec-tive class/cluster/group. Likewise, each sample is kept out ofthe training set and evaluated. The outcome of these iterativeprocesses is a measure called accuracy which tells the robust-ness of the model built. Accuracy is directly dependent on thecorrect clustering of the test data to its appropriate group.
Results
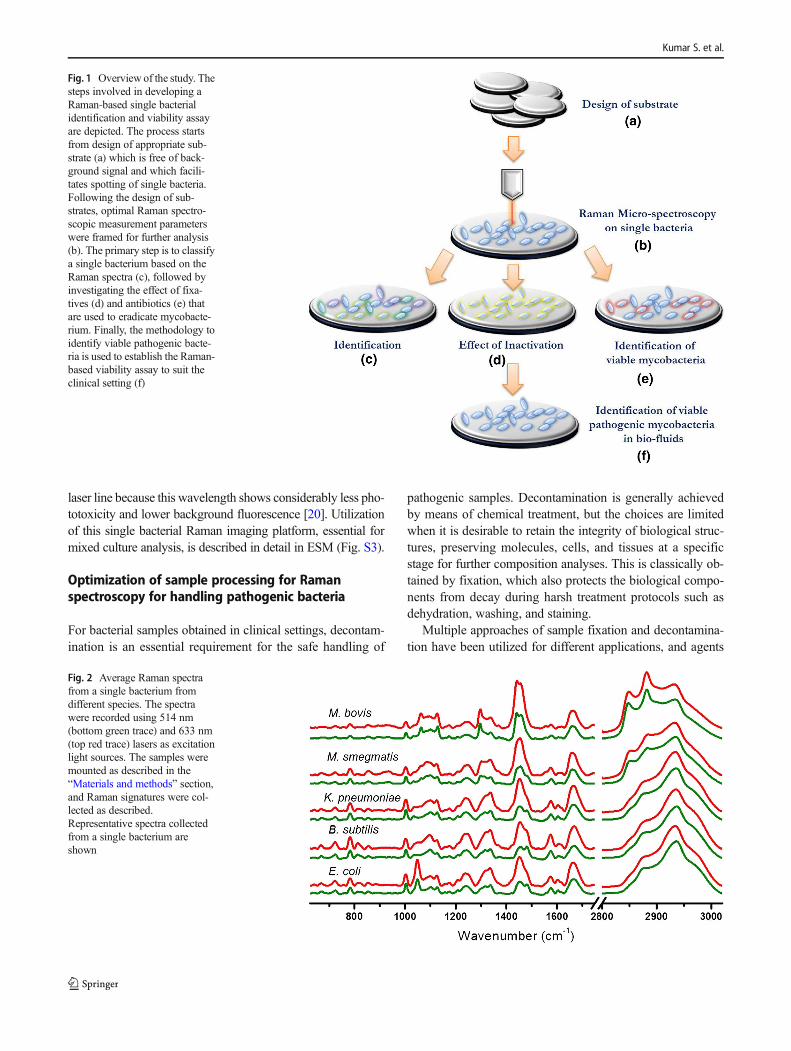
Towards developing a rapid non-invasive diagnostic tool forthe identification of bacterial infections, we focused on diag-nosing tuberculosis through Raman signatures. Tuberculosis(TB) was taken as the case study to demonstrate the identifi-cation potential, effect of decontamination, and viability as-sessment using Ramanmicrospectroscopy. This was primarilybecause TB accounts for the maximum number of deathscaused by a single infectious agent and the high mortality isdue mainly to improper diagnosis, long therapeutic regimens,and poor patient compliance. As Raman scattering is a weakprocess, to achieve a good signal-to-noise ratio (SNR) from asingle bacterium, we first developed a background-free sub-strate (Fig. 1a). Further, we deduced appropriate Raman mea-surement parameters to record spectra from single bacteriarapidly with high SNR (Fig. 1b). We typed severalMycobacterium species belonging to theM. tuberculosis com-plex (MTC) and non-tuberculousMycobacteria (NTM) groupalongside many common bacteria like Escherichia coli,Bacillus subtilis, Klebsiella pneumoniae, etc. to build a spec-troscopic database based on Raman spectral signatures (Fig.1c). To extend the protocol to pathogenic bacteria, we
identified suitable chemical inactivation methods forMycobacteria which would have a minimal consequence onRaman spectra (Fig. 1d). In addition, we were also able togenerate spectral signatures which can differentiate dead bac-teria from live, by generating spectra from mycobacteria cellstreated with first-line drugs as against untreated live cells (Fig.1e), thereby addressing one of the long-standing needs of clin-ical microbiology, i.e., to discriminate between live and deadbacteria in a clinical-like sample (Fig. 1f). Overall, our studyreports a reliable, rapid, and non-invasive diagnostic tool thatcan be adapted as a point-of-care diagnostic testing in clinics,especially for tuberculosis. Our approach is amenable to theidentification of live and dead bacteria, and to the best of ourknowledge, this is the only technique which can rapidly iden-tify bacteria and assess their viability status as well.
Identification of appropriate substrate and laserwavelength for Raman analysis of bacterialpopulations
Substrate and choice of wavelength play a major role forRaman scattering-based analysis of biological specimens asthey affect the signal-to-noise ratio. Quartz substrates arewidely employed in Raman spectroscopy but have a strongbackground contribution in the fingerprint region (800 to1800 cm−1) as shown in Fig. S2a (see ESM). Kerr et al. haveprovided a detailed account of these issues and have identifiedsubstrates which suit mammalian cells [18]. Severalbackground-free substrates like CaF2, MgF2, etc. are widelyused in Raman spectroscopy of biological samples like mam-malian cells, tissue, and bulk bacteria. However, these sub-strates do add background while employing for single bacte-rial analysis as the volume that we are measuring is very smallcompared to other biological samples mentioned before. So,we developed a substrate for Raman imaging of a single bac-terium. A detailed account of the steps we have taken to de-velop a substrate is given in the ESM (Fig. S1). This substratewas similar to aluminum-coated slides used previously foridentification of environmental bacteria [19].
Raman spectra from five different species of bacteria, name-ly E. coli, B. subtilis, K. pneumoniae, Mycobacteriumsmegmatis, andMycobacterium bovis, were recorded after dropcasting on the in-house fabricated substrate with both 514 nmand 633 nm excitation light sources as shown in Fig. 2. Thesensitivity obtained from PC-LDA of Raman spectra with514 nm and 633 nm was 100% and 99.63% respectively.Both excitation sources provided high accuracy on predictionusing PC-LDAwhich is seen in the confusion matrix given inTable S1 (see ESM). The confusionmatrix is a way to representthe reliability of an experiment, wherein inaccurate or less spe-cific readouts will result in higher values in wrongly classifiedcolumns. Though both wavelength sources provided high ac-curacy, further experiments were performed with a 633-nm
Rapid detection of bacterial infection and viability assessment with high specificity and sensitivity using...
laser line because this wavelength shows considerably less pho-totoxicity and lower background fluorescence [20]. Utilizationof this single bacterial Raman imaging platform, essential formixed culture analysis, is described in detail in ESM (Fig. S3).
Optimization of sample processing for Ramanspectroscopy for handling pathogenic bacteria
For bacterial samples obtained in clinical settings, decontam-ination is an essential requirement for the safe handling of
pathogenic samples. Decontamination is generally achievedby means of chemical treatment, but the choices are limitedwhen it is desirable to retain the integrity of biological struc-tures, preserving molecules, cells, and tissues at a specificstage for further composition analyses. This is classically ob-tained by fixation, which also protects the biological compo-nents from decay during harsh treatment protocols such asdehydration, washing, and staining.
Multiple approaches of sample fixation and decontamina-tion have been utilized for different applications, and agents
Fig. 2 Average Raman spectrafrom a single bacterium fromdifferent species. The spectrawere recorded using 514 nm(bottom green trace) and 633 nm(top red trace) lasers as excitationlight sources. The samples weremounted as described in the“Materials and methods” section,and Raman signatures were col-lected as described.Representative spectra collectedfrom a single bacterium areshown
Fig. 1 Overview of the study. Thesteps involved in developing aRaman-based single bacterialidentification and viability assayare depicted. The process startsfrom design of appropriate sub-strate (a) which is free of back-ground signal and which facili-tates spotting of single bacteria.Following the design of sub-strates, optimal Raman spectro-scopic measurement parameterswere framed for further analysis(b). The primary step is to classifya single bacterium based on theRaman spectra (c), followed byinvestigating the effect of fixa-tives (d) and antibiotics (e) thatare used to eradicate mycobacte-rium. Finally, the methodology toidentify viable pathogenic bacte-ria is used to establish the Raman-based viability assay to suit theclinical setting (f)
Kumar S. et al.
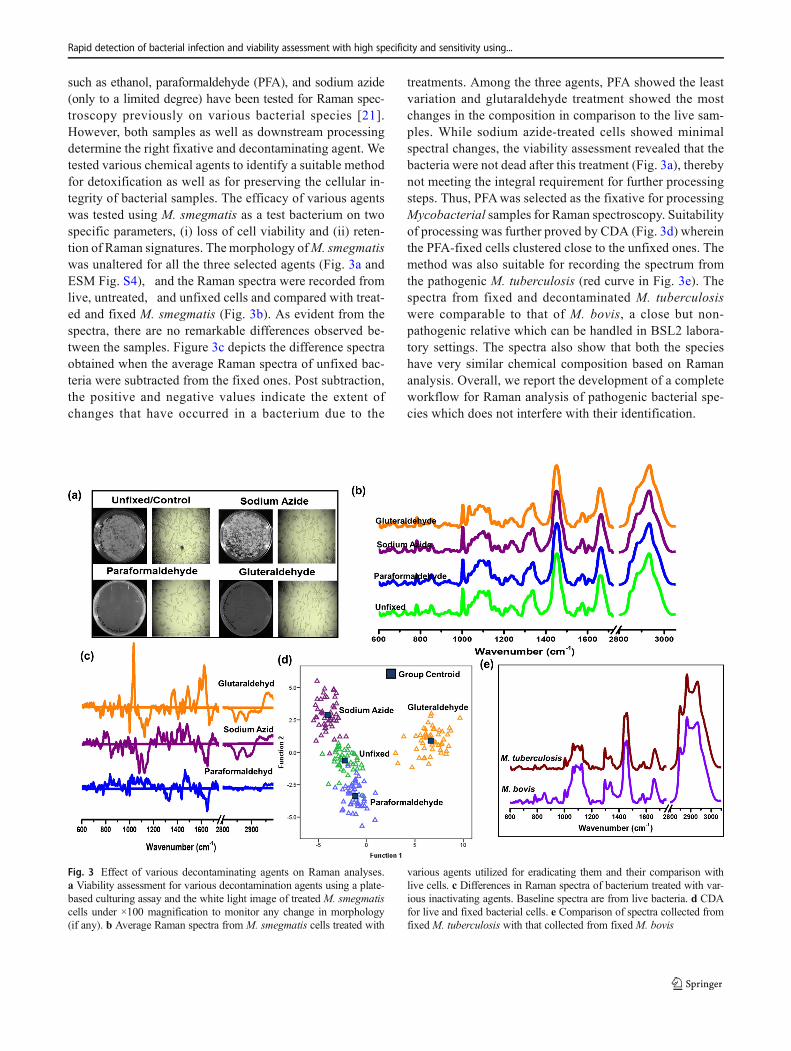
such as ethanol, paraformaldehyde (PFA), and sodium azide(only to a limited degree) have been tested for Raman spec-troscopy previously on various bacterial species [21].However, both samples as well as downstream processingdetermine the right fixative and decontaminating agent. Wetested various chemical agents to identify a suitable methodfor detoxification as well as for preserving the cellular in-tegrity of bacterial samples. The efficacy of various agentswas tested using M. smegmatis as a test bacterium on twospecific parameters, (i) loss of cell viability and (ii) reten-tion of Raman signatures. The morphology ofM. smegmatiswas unaltered for all the three selected agents (Fig. 3a andESM Fig. S4), and the Raman spectra were recorded fromlive, untreated, and unfixed cells and compared with treat-ed and fixed M. smegmatis (Fig. 3b). As evident from thespectra, there are no remarkable differences observed be-tween the samples. Figure 3c depicts the difference spectraobtained when the average Raman spectra of unfixed bac-teria were subtracted from the fixed ones. Post subtraction,the positive and negative values indicate the extent ofchanges that have occurred in a bacterium due to the
treatments. Among the three agents, PFA showed the leastvariation and glutaraldehyde treatment showed the mostchanges in the composition in comparison to the live sam-ples. While sodium azide-treated cells showed minimalspectral changes, the viability assessment revealed that thebacteria were not dead after this treatment (Fig. 3a), therebynot meeting the integral requirement for further processingsteps. Thus, PFAwas selected as the fixative for processingMycobacterial samples for Raman spectroscopy. Suitabilityof processing was further proved by CDA (Fig. 3d) whereinthe PFA-fixed cells clustered close to the unfixed ones. Themethod was also suitable for recording the spectrum fromthe pathogenic M. tuberculosis (red curve in Fig. 3e). Thespectra from fixed and decontaminated M. tuberculosiswere comparable to that of M. bovis, a close but non-pathogenic relative which can be handled in BSL2 labora-tory settings. The spectra also show that both the specieshave very similar chemical composition based on Ramananalysis. Overall, we report the development of a completeworkflow for Raman analysis of pathogenic bacterial spe-cies which does not interfere with their identification.
Fig. 3 Effect of various decontaminating agents on Raman analyses.a Viability assessment for various decontamination agents using a plate-based culturing assay and the white light image of treated M. smegmatiscells under ×100 magnification to monitor any change in morphology(if any). b Average Raman spectra from M. smegmatis cells treated with
various agents utilized for eradicating them and their comparison withlive cells. c Differences in Raman spectra of bacterium treated with var-ious inactivating agents. Baseline spectra are from live bacteria. d CDAfor live and fixed bacterial cells. e Comparison of spectra collected fromfixed M. tuberculosis with that collected from fixed M. bovis
Rapid detection of bacterial infection and viability assessment with high specificity and sensitivity using...
Development of a Raman-based viability assessmenttool for bacterial cells
One of the main limitations of most microbial diagnostic toolssuch as PCR, ELISA, and so on is their inability to provideinformation about the viability of the sample. Culturing tech-niques, which can distinguish live from dead bacteria, aregenerally very slow and limit handling of biological samplesto only approved laboratories (BSL2 and above). Towardsinvestigating the applicability of Raman spectroscopy forovercoming these limitations, we approached the problem intwo steps. First, to evaluate if the signatures of viability areretained even after fixation and, second, if Ramanmicrospectroscopy can distinguish between live and dead bac-terial cells (discussed in the next section).
Towards the first step,M. smegmatis cells were cultured inthe presence or absence of various antibiotics, typically usedfor treating tuberculosis, viz. streptomycin, rifampicin, etham-butol, and isoniazid. The cells were treated either with eachdrug independently or with all together as done in the standardtreatment course. The bacterial cells were treated with indicat-ed doses for 24 h before Raman analysis, where effects onM. smegmatis are recorded.
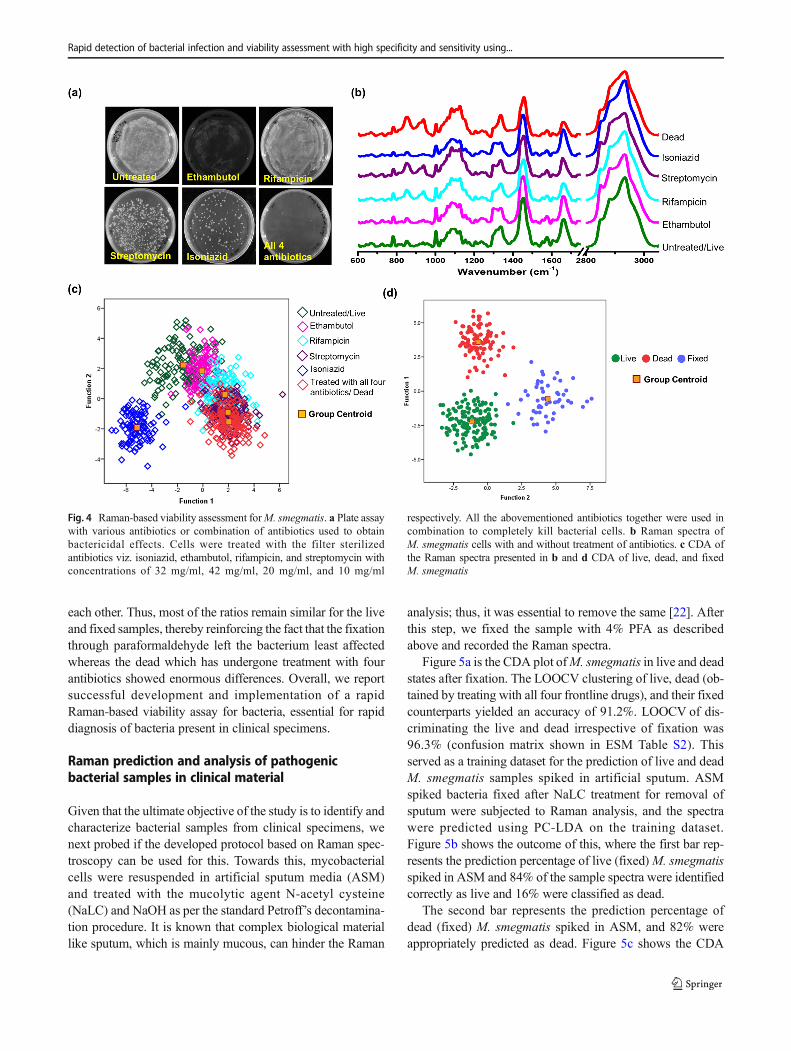
As anticipated, in our experiments, we recorded completecell death when all the four antibiotics were utilized together,but variable killing was recorded with individual antibioticsby culturing of the treated bacterial cells (Fig. 4a). Figure 4bshows average Raman spectra collected from treated and un-treated M. smegmatis. Since each antibiotic targets differentbiological pathways, the average Raman spectra show chang-es in peak intensities, shape, and bandwidth for various spec-tra.While we did not characterize the specific chemical chang-es because of each antibiotic treatment, we focused on differ-ences in signature to distinguish the live and the dead bacteria(obtained by four antibiotic treatments).
Viability analysis clearly showed that only the bacteriatreated with the combination of the selected four antibioticswere completely killed. We tested our ability to discriminatelive vs dead bacteria using CDA as shown in Fig. 4c. TheLOOCV accuracy was 83.4%. Low sensitivity of viabilityassessment arises due to absence of segregation of clusters.At the level of single bacterial analysis, it is difficult to be surethat the sampled bacteria are affected by the antibiotic treat-ment. Many bacteria in the culture may be resistant to antibi-otics or may grow with a low rate. For example, the signatureof ethambutol-treated cells showed only an increase in carot-enoid peaks and was similar for the most part to untreated orlive cells. Moreover, only the combinatorial therapy whichsucceeded in killing all the cells clustered away from the liveones. In addition, the streptomycin-treated cells cluster withthe dead bacteria and the centroids of both the cluster arelocated close to each other. Further, the Raman spectra of thestreptomycin-treated cells alone and the combined treatment
of four antibiotics showed more comparable signatures. Asevident from the plate growth effect, streptomycin was thestrongest antibiotic, but by itself, it did not eradicate all thebacteria. Concomitant to this, Raman spectral analysis re-vealed that the bactericidal effect of streptomycin is highercompared to that of the other antibiotics and the treated bac-teria grouped closer with the dead ones. The rifampicin-treated cells clustered between the live and the dead cells,and the centroid was closer to the dead cell cluster. Theisoniazid-treated cells formed a completely different clusterequidistant to both live and dead clusters, perhaps on accountof its completely different mechanism of action which needsactivation by bacterial catalase and by itself can be used fortreating latent bacteria. These findings provide a unique plat-form to typing bacterial cells from patients and identify whichantibiotics they are responding to. This can be one experimen-tal strategy which can be employed to identify drug resistancein bacterial cells.
Finally, while comparing the live, dead, and fixed bacteria,the CDA gave us a cross validation accuracy of 98% (Fig. 4d)and the three groups clustered separately. Although both fix-ation and killing of bacteria by antibiotics lead to loss of via-bility, the modes of action are different resulting in two differ-ent clusters, evident in Fig. 4d. Technically, fixed cells aredead, evident from the plate assay. Interestingly, paraformal-dehyde treatment-mediated fixation allows retention of thebiochemical signatures in the cells even though they differfrom the live and the dead groups. If we consider fixed asdead, then Raman is able to identify different deactivatingprocedures. While fixation leads to immediate arrest of cellu-lar processes by cross linking the cellular ingredients, thedrug-induced killing is a slow process, in which cellular path-ways are blocked and thus leading to degradation of intracel-lular macromolecules, followed by death, which is reflected intheir biochemical signatures and composition. Further, weperformed ratiometric analysis of few peaks to appreciate thedifferences between live, dead, and fixedM. smegmatis (ESMFig. S5) [12]. The ratios 811/825 corresponding to RNA/protein and 2853/2932 corresponding to CH stretching vibra-tions did not show any significant changes while comparingthe live, dead, and fixed M. smegmatis. The ratios 782/1003(DNA/protein), 851/938 (protein/glycogen), 918/938 (bothpeaks correspond to glycogen), 1283/1258 (peaks under theamide III region), and 1519/1575 (carotenoids/DNA) showedminimum or non-significant differences while comparing thelive and fixed M. smegmatis (compare green and blue bars).Conversely, only the ratio 1083/1125 corresponding to phos-phates and glycogen showed significant differences betweenthe live and fixed samples. However, while comparing the liveand fixed with the dead, we could observe mostly significantdifferences (compare the green and blue bar with the red).Further, the ratio 1450/1659 corresponding to lipid/proteinhad significant difference while comparing the three against
Kumar S. et al.
each other. Thus, most of the ratios remain similar for the liveand fixed samples, thereby reinforcing the fact that the fixationthrough paraformaldehyde left the bacterium least affectedwhereas the dead which has undergone treatment with fourantibiotics showed enormous differences. Overall, we reportsuccessful development and implementation of a rapidRaman-based viability assay for bacteria, essential for rapiddiagnosis of bacteria present in clinical specimens.
Raman prediction and analysis of pathogenicbacterial samples in clinical material
Given that the ultimate objective of the study is to identify andcharacterize bacterial samples from clinical specimens, wenext probed if the developed protocol based on Raman spec-troscopy can be used for this. Towards this, mycobacterialcells were resuspended in artificial sputum media (ASM)and treated with the mucolytic agent N-acetyl cysteine(NaLC) and NaOH as per the standard Petroff’s decontamina-tion procedure. It is known that complex biological materiallike sputum, which is mainly mucous, can hinder the Raman
analysis; thus, it was essential to remove the same [22]. Afterthis step, we fixed the sample with 4% PFA as describedabove and recorded the Raman spectra.
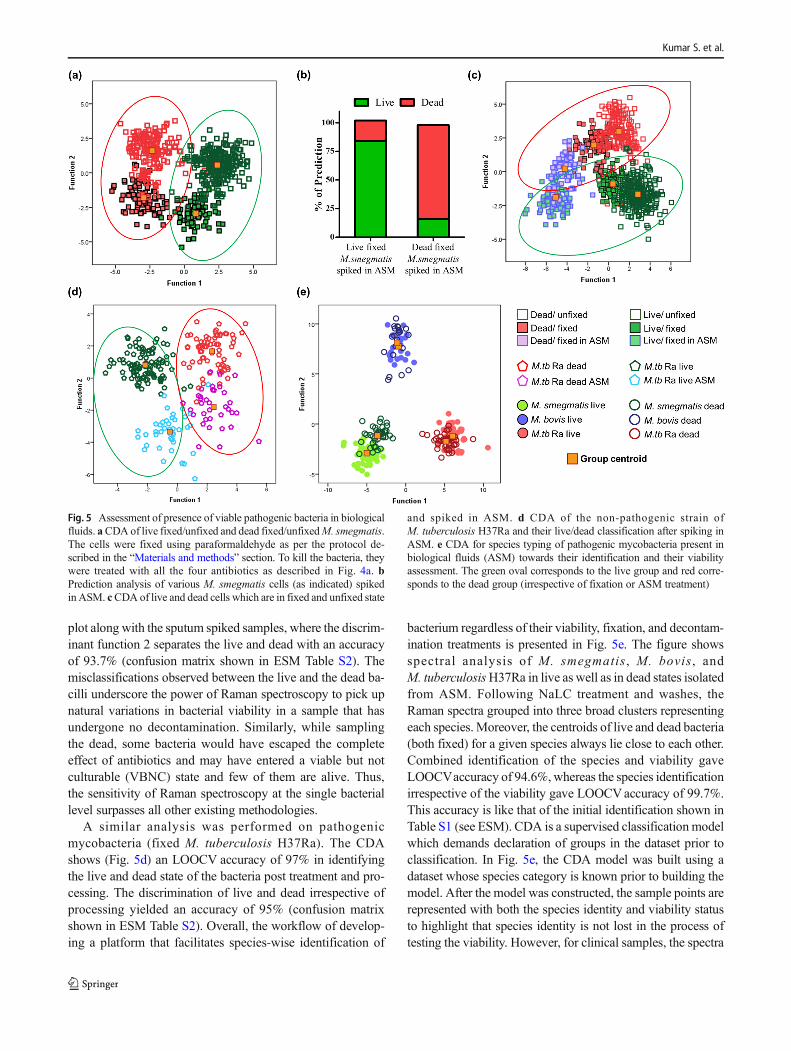
Figure 5a is the CDA plot ofM. smegmatis in live and deadstates after fixation. The LOOCV clustering of live, dead (ob-tained by treating with all four frontline drugs), and their fixedcounterparts yielded an accuracy of 91.2%. LOOCV of dis-criminating the live and dead irrespective of fixation was96.3% (confusion matrix shown in ESM Table S2). Thisserved as a training dataset for the prediction of live and deadM. smegmatis samples spiked in artificial sputum. ASMspiked bacteria fixed after NaLC treatment for removal ofsputum were subjected to Raman analysis, and the spectrawere predicted using PC-LDA on the training dataset.Figure 5b shows the outcome of this, where the first bar rep-resents the prediction percentage of live (fixed)M. smegmatisspiked in ASM and 84% of the sample spectra were identifiedcorrectly as live and 16% were classified as dead.
The second bar represents the prediction percentage ofdead (fixed) M. smegmatis spiked in ASM, and 82% wereappropriately predicted as dead. Figure 5c shows the CDA
Fig. 4 Raman-based viability assessment forM. smegmatis. a Plate assaywith various antibiotics or combination of antibiotics used to obtainbactericidal effects. Cells were treated with the filter sterilizedantibiotics viz. isoniazid, ethambutol, rifampicin, and streptomycin withconcentrations of 32 mg/ml, 42 mg/ml, 20 mg/ml, and 10 mg/ml
respectively. All the abovementioned antibiotics together were used incombination to completely kill bacterial cells. b Raman spectra ofM. smegmatis cells with and without treatment of antibiotics. c CDA ofthe Raman spectra presented in b and d CDA of live, dead, and fixedM. smegmatis
Rapid detection of bacterial infection and viability assessment with high specificity and sensitivity using...
plot along with the sputum spiked samples, where the discrim-inant function 2 separates the live and dead with an accuracyof 93.7% (confusion matrix shown in ESM Table S2). Themisclassifications observed between the live and the dead ba-cilli underscore the power of Raman spectroscopy to pick upnatural variations in bacterial viability in a sample that hasundergone no decontamination. Similarly, while samplingthe dead, some bacteria would have escaped the completeeffect of antibiotics and may have entered a viable but notculturable (VBNC) state and few of them are alive. Thus,the sensitivity of Raman spectroscopy at the single bacteriallevel surpasses all other existing methodologies.
A similar analysis was performed on pathogenicmycobacteria (fixed M. tuberculosis H37Ra). The CDAshows (Fig. 5d) an LOOCV accuracy of 97% in identifyingthe live and dead state of the bacteria post treatment and pro-cessing. The discrimination of live and dead irrespective ofprocessing yielded an accuracy of 95% (confusion matrixshown in ESM Table S2). Overall, the workflow of develop-ing a platform that facilitates species-wise identification of
bacterium regardless of their viability, fixation, and decontam-ination treatments is presented in Fig. 5e. The figure showsspectral analysis of M. smegmatis , M. bovis , andM. tuberculosisH37Ra in live as well as in dead states isolatedfrom ASM. Following NaLC treatment and washes, theRaman spectra grouped into three broad clusters representingeach species.Moreover, the centroids of live and dead bacteria(both fixed) for a given species always lie close to each other.Combined identification of the species and viability gaveLOOCVaccuracy of 94.6%,whereas the species identificationirrespective of the viability gave LOOCVaccuracy of 99.7%.This accuracy is like that of the initial identification shown inTable S1 (see ESM). CDA is a supervised classification modelwhich demands declaration of groups in the dataset prior toclassification. In Fig. 5e, the CDA model was built using adataset whose species category is known prior to building themodel. After the model was constructed, the sample points arerepresented with both the species identity and viability statusto highlight that species identity is not lost in the process oftesting the viability. However, for clinical samples, the spectra
Fig. 5 Assessment of presence of viable pathogenic bacteria in biologicalfluids. aCDA of live fixed/unfixed and dead fixed/unfixedM. smegmatis.The cells were fixed using paraformaldehyde as per the protocol de-scribed in the “Materials and methods” section. To kill the bacteria, theywere treated with all the four antibiotics as described in Fig. 4a. bPrediction analysis of various M. smegmatis cells (as indicated) spikedin ASM. cCDA of live and dead cells which are in fixed and unfixed state
and spiked in ASM. d CDA of the non-pathogenic strain ofM. tuberculosis H37Ra and their live/dead classification after spiking inASM. e CDA for species typing of pathogenic mycobacteria present inbiological fluids (ASM) towards their identification and their viabilityassessment. The green oval corresponds to the live group and red corre-sponds to the dead group (irrespective of fixation or ASM treatment)
Kumar S. et al.
were first processed through a model containing the speciesidentity. Secondly, when viability is tested, it has the dataset ofthe particular species containing only its viability information.Thus, we present a method for bacterial species identificationusing Ramanmicrospectroscopy wherein no effect of fixation,sputum components, and antibiotic treatment on the basicdataset is observed, but high sensitivity and specificity in sam-ple identification are obtained.
Discussion
Raman-based bacterial identification has been reported previ-ously, and the approach has also been used to identify and typemycobacterial strains in bulk [23–25]. Until 2003, identifica-tion of bacteria employed using Raman spectroscopy wasmostly performed on bulk systems [26, 27]. From 2004, withthe advent of confocal microscopy, high-magnification objec-tives and availability of highly sensitivity detectors, singlebacterial identification and imaging through Raman have beenexplored [28, 29]. Studies have reported single bacterial iden-tification for medically and environmentally relevant bacterialike anthrax [30], in urinary tract infection [31], in water path-ogens [32, 33], in meat-associated pathogens [34], and inmany other samples [16, 35–37] using multivariate analysistechniques. Raman spectroscopy along with supervised mul-tivariate analysis techniques like support vector machine(SVM) has also been employed to identify TB pathogens,but no studies has reported use of Raman for identificationand viability assessment [38]. In our study, in addition to the
identification ofM. tuberculosis, we have studied the fixationeffects as well as assessed the viability status of the microor-ganism. Further, the effect of antibiotics on bacteria, quanti-fying the MIC and the effect of different growth conditionshave also been investigated [11, 39–43]. Apart from normalRaman studies, surface-enhanced Raman spectroscopy(SERS) which has enhanced sensitivity has also beenemployed for the identification of bulk and single bacteriaincluding mycobacterial species and mycolates [44–49].Investigations into antibiotic effects and the identificationof antibiotic-resistant bacterial species have also been probedby SERS [50, 51]. Similarly, intracellular mycobacterial andstaphylococcus species were identified and imaged inside thehost cell using Raman microscopy [52, 53]. Fluorescence andSERS have been employed to test the viability of Bacillus andE. coli respectively [54, 55]. The effects of several fixationmethods have been investigated on various bacterial speciesusing Raman spectroscopy [21, 25, 56]. Overall, it is evidentthat the responses of bacteria to different treatments vary andconsequently Raman spectra also vary. However, a unifiedapproach for detection, inactivation, and viability assessmentfor a specific species of bacteria is yet to be explored as aprotocol which, in future, can be applied to all bacterial species.
The current study presents a comprehensive and robust workflow for a Raman spectroscopy-based platform for bacterialidentification and viability assessment at the single-cell level,which does not involve extensive sample processing. The studypresents a design which overcomes the sensitivity and specific-ity limitations of microbiological procedures which are current-ly employed for strain identification and typing. Given that it is
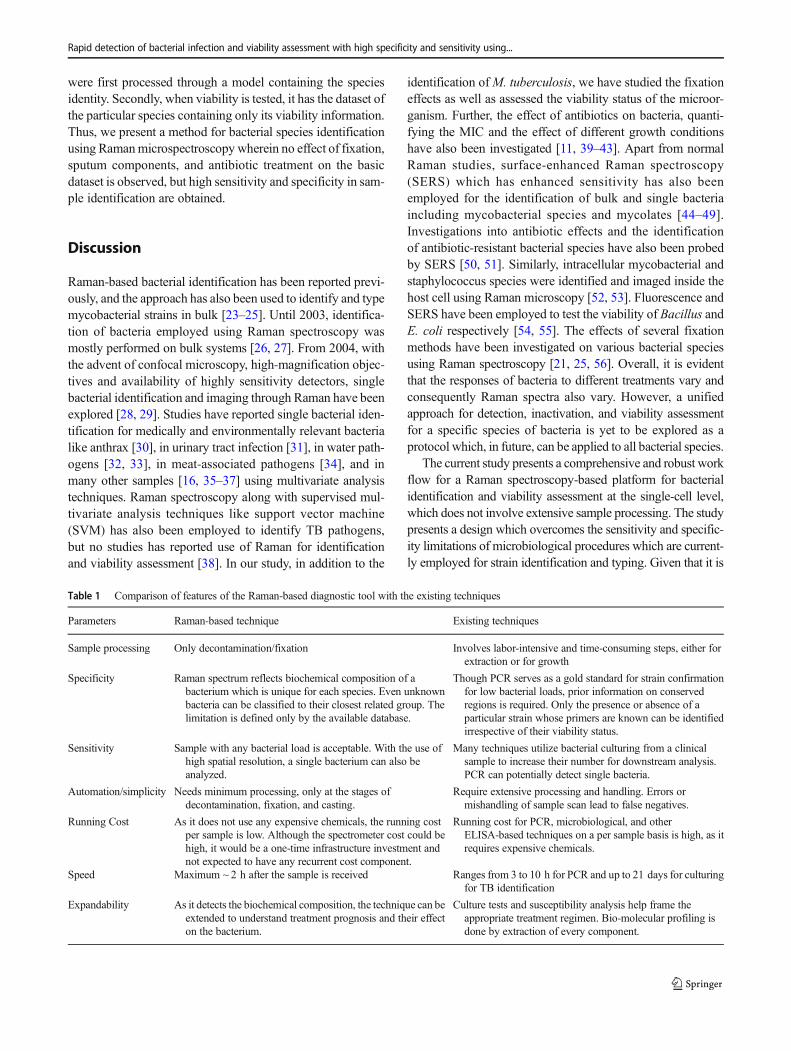
Table 1 Comparison of features of the Raman-based diagnostic tool with the existing techniques
Sample processing Only decontamination/fixation Involves labor-intensive and time-consuming steps, either forextraction or for growth
Specificity Raman spectrum reflects biochemical composition of abacterium which is unique for each species. Even unknownbacteria can be classified to their closest related group. Thelimitation is defined only by the available database.
Though PCR serves as a gold standard for strain confirmationfor low bacterial loads, prior information on conservedregions is required. Only the presence or absence of aparticular strain whose primers are known can be identifiedirrespective of their viability status.
Sensitivity Sample with any bacterial load is acceptable. With the use ofhigh spatial resolution, a single bacterium can also beanalyzed.
Many techniques utilize bacterial culturing from a clinicalsample to increase their number for downstream analysis.PCR can potentially detect single bacteria.
Automation/simplicity Needs minimum processing, only at the stages ofdecontamination, fixation, and casting.
Require extensive processing and handling. Errors ormishandling of sample scan lead to false negatives.
Running Cost As it does not use any expensive chemicals, the running costper sample is low. Although the spectrometer cost could behigh, it would be a one-time infrastructure investment andnot expected to have any recurrent cost component.
Running cost for PCR, microbiological, and otherELISA-based techniques on a per sample basis is high, as itrequires expensive chemicals.
Speed Maximum ~ 2 h after the sample is received Ranges from 3 to 10 h for PCR and up to 21 days for culturingfor TB identification
Expandability As it detects the biochemical composition, the technique can beextended to understand treatment prognosis and their effecton the bacterium.
Culture tests and susceptibility analysis help frame theappropriate treatment regimen. Bio-molecular profiling isdone by extraction of every component.
Rapid detection of bacterial infection and viability assessment with high specificity and sensitivity using...
critical to know the viability status of the bacterial cells whichare found in the biological samples, primarily to formulate ap-propriate therapy, the technique of choice for this purpose is stillculturing, either in liquid in the form of growth indicator tubesor on solid medium; it can be a limitation in a sample wherebacteria are viable but not culturable (VBNCs), a major imped-iment in microbiological assessment platforms worldwide [57].This issue has been very difficult to surmount, and we presenthere an approach that can do so.
To summarize, we have (i) established Ramanmicrospectroscopy as a sensitive and specific technique forthe identification of various bacteria of MTC and NTMclades, (ii) demonstrated the ease of handling and processingof patient samples without changing any existing microbialtyping protocols, (iii) demonstrated the ability of this tech-nique to identify mycobacterial and other strains in artificialsputum, (iv) optimized the sample processing protocol forhandling pathogenic bacteria, (v) proven the suitability of as-sessment of bacterial viability status at the single-cell level,and (vi) presented a facile platform for POC diagnostics.
With our protocol, we were able to successfully differenti-ate dead cells from the viable ones with a sensitivity of 98%,and even there we speculate the reduction in sensitivity couldbe due to the presence of VBNCs which otherwise are classi-fied as dead, but Raman spectroscopy can potentially identifythem. This finding is open to additional investigation andneeds further characterization for various types of VBNCs,an area where conventional characterization tools have failed.
Finally, we present a feature comparison table for a Raman-based diagnostic tool for infectious diseases vis-à-vis the tech-niques currently in use like staining, culturing, and moleculartools (Table 1). While Raman spectroscopy is still in its infan-cy, we believe that it has the potential to develop into a one-step diagnostic tool capable of performing multiple analysesfrom a single sample, enabling early point-of-care diagnosisand prognosis tool of the disease followed by suitable antimi-crobial therapy.
Acknowledgments S. Kumar acknowledges DST for INSPIRE fellow-ship. S. Umapathy acknowledges the Department of Science andTechnology (DST Grant No. SR/S2/JCB-52/2009) and the Departmentof Biotechnology (Grant No. BT/01/CEIB/09/IV/05), Government ofIndia, for financial support. S. Umapathy is a J. C. Bose Fellow of theDepartment of Science and Technology. D.K. Saini acknowledges theDepartment of Biotechnology (DBT Grant No. BT/PR3260/BRB/10/967/ 2011; BT/PR17357/MED/29/1019/ 2016), Government of India;DST-FIST [SR/FST/LS11-036/2014(C)], UGC-SAP [F.4.13/2018/DRS-III (SAP-II)], and DBT-IISc Partnership Program Phase-II (BT/PR27952-INF/22/212/2018) for infrastructure and financial support and InfosysFoundation for financial support.
Compliance with ethical standards
Conflict of interest The authors declare that they have no conflicts ofinterest.
References
1. Walzl G, McNerney R, du Plessis N, Bates M, McHugh TD,Chegou NN, et al. Tuberculosis: advances and challenges in devel-opment of new diagnostics and biomarkers. Lancet Infect Dis.2018;18(7):e199–210.
2. Tiwari RP, Hattikudur NS, Bharmal RN, Kartikeyan S, DeshmukhNM, Bisen PS. Modern approaches to a rapid diagnosis of tubercu-losis: promises and challenges ahead. Tuberculosis (Edinb).2007;87(3):193–201.
3. Mothershed EA, Whitney AM. Nucleic acid-based methods forthe detection of bacterial pathogens: present and future consider-ations for the clinical laboratory. ClinChimActa. 2006;363(1–2):206–20.
4. Wood RC, Luabeya AK, Weigel KM, Wilbur AK, Jones-Engel L,Hatherill M, et al. Detection of Mycobacterium tuberculosis DNAon the oral mucosa of tuberculosis patients. Sci Rep. 2015;5:8668.
5. Parida M, Sannarangaiah S, Dash PK, Rao PV, Morita K. Loopmediated isothermal amplification (LAMP): a new generation ofinnovative gene amplification technique; perspectives in clinicaldiagnosis of infectious diseases. Rev Med Virol. 2008;18(6):407–21.
6. Li Y, Cu YT, Luo D.Multiplexed detection of patho-gen DNAwithDNA-based fluorescence nanobarcodes. Nat Biotechnol.2005;23(7):885–9.
8. Morgan M, Kalantri S, Flores L, Pai M. A commercial line probeassay for the rapid detection of rifampicin resistance inMycobacterium tuberculosis: a systematic review and meta-analy-sis. BMC Infect Dis. 2005;5:62.
9. De Beenhouwer H, Lhiang Z, Jannes G, Mijs W, Machtelinckx L,Rossau R, et al. Rapid detec-tion of rifampicin resistance in sputumand biopsy specimens from tuberculosis patients by PCR and lineprobe assay. Tuber Lung Dis. 1995;76(5):425–30.
10. Gautam R, Samuel A, Sil S, Chaturvedi D, Dutta A, Ariese F,Umapathy S. Raman and mid-infrared spectroscopic imaging: ap-plications and advancements. 2015; 108:341–356.
11. Kumar S, Matange N, Umapathy S, Visweswariah SS. Linkingcarbon metabolism to carotenoid production in mycobacteria usingRaman spectroscopy. FEMS Microbiol Lett. 2015;362(3):1–6.
12. Kumar S, Verma T, Mukherjee R, Ariese F, Somasundaram K,Umapathy S. Raman and infra-red microspectroscopy: towardsquantitative evaluation for clinical research by ratiometric analysis.Chem Soc Rev. 2016;45(7):1879–900.
13. Singh B, GautamR, Kumar S, Kumar BNV, NongthombaU, NandiD, et al. Application of vibrational microspectroscopy to biologyand medicine. Curr Sci India. 2012;102(2):232–44.
14. Wang K, Pu H, Sun DW. Emerging spectroscopic and spectralimaging techniques for the rapid detection of microorganisms: anoverview. Compr Rev Food Sci Food Saf. 2018;17(2):256–73.
15. Gautam R, Vanga S, Ariese F, Umapathy S. Review of multidimen-sional data processing approaches for Raman and infrared spectros-copy. EPJ Tech Instrum. 2015;2(1):8.
16. Lorenz B, Wichmann C, Stöckel S, Rösch P, Popp J. Cultivation-free Raman spectroscopic investigations of bacteria. TrendsMicrobiol. 2017;25(5):413–24.
17. Butler HJ, Ashton L, Bird B, Cinque G, Curtis K, Dorney J, et al.Using Raman spectroscopy to characterize biological materials. NatProtoc. 2016;11:664.
18. Kerr LT, Byrne HJ, Hennelly BM. Optimal choice of sample sub-strate and laser wavelength for Raman spectroscopic analysis ofbiological specimen. Anal Methods. 2015;7(12):5041–52.
Kumar S. et al.
19. Eichorst SA, Stasser F, Woyke T, Schintlmeister A, Wagner M,Woebken D. Advancements in the application of NanoSIMSand Raman microspectroscopy to investigate the activity ofmicrobial cells in soils. FEMS Microbiol Ecol. 2015;91(10):1–14.
20. McCreery RL. Raman spectroscopy for chemical analysis. USA:Wiley-Interscience Publication; 2001.
21. Read DS, Whiteley AS. Chemical fixation methods for Ramanspectroscopy-based analysis of bacteria. J Microbiol Methods.2015;109:79–83.
22. Kloß S, Lorenz B, Dees S, Labugger I, Rösch P, Popp J.Destruction-free procedure for the isolation of bacteria from spu-tum samples for Raman spectroscopic analysis. Anal BioanalChem. 2015;407(27):8333–41.
23. Lu X, Al-Qadiri HM, Lin M, Rasco BA. Application of mid-infrared and Raman spectroscopy to the study of bacteria. FoodBioprocess Technol. 2011;4(6):919–35.
24. TangM,McEwen GD,WuY,Miller CD, Zhou A. Characterizationand analysis of mycobacteria and Gram-negative bacteria and co-culture mixtures by Raman microspectroscopy, FTIR, and atomicforce microscopy. Anal Bioanal Chem. 2013;405(5):1577–91.
25. Buijtels PC, Willemse-Erix HF, Petit PL, Endtz HP, Puppels GJ,Verbrugh HA, et al. Rapid identification of mycobacteria byRaman spectroscopy. J Clin Microbiol. 2008;46(3):961–5.
26. Maquelin K, Kirschner C, Choo-Smith LP, Ngo-Thi NA, vanVreeswijk T, Stammler M, et al. Prospective study of the perfor-mance of vibrational spectroscopies for rapid identification of bac-terial and fungal pathogens recovered from blood cultures. J ClinMicrobiol. 2003;41(1):324–9.
27. Choo-Smith LP, Maquelin K, van Vreeswijk T, Bruining HA,Puppels GJ, Ngo Thi NA, et al. Investigating microbial(micro)colony heterogeneity by vibrational spectroscopy. ApplEnviron Microbiol. 2001;67(4):1461–9.
28. Rosch P, Harz M, Schmitt M, Peschke KD, Ronneberger O,Burkhardt H, et al. Chemotaxonomic identification of single bacte-ria by micro-Raman spectroscopy: application to clean-room-relevant biological contaminations. Appl Environ Microbiol.2005;71(3):1626–37.
29. Huang WE, Griffiths RI, Thompson IP, Bailey MJ, Whiteley AS.Raman microscopic analysis of single microbial cells. Anal Chem.2004;76(15):4452–8.
30. Stockel S, Meisel S, Elschner M, Rosch P, Popp J. Identification ofBacillus anthracis via Raman spectroscopy and chemometric ap-proaches. Anal Chem. 2012;84(22):9873–80.
31. Kloss S, Kampe B, Sachse S, Rosch P, Straube E, Pfister W, et al.Culture independent Raman spectroscopic identification of urinarytract infection pathogens: a proof of principle study. Anal Chem.2013;85(20):9610–6.
32. Kusic D, Kampe B, Rosch P, Popp J. Identification of waterpathogens by Raman microspectroscopy. Water Res. 2014;48:179–89.
33. Silge A, Schumacher W, Rosch P, Da Costa Filho PA, Gerard C,Popp J. Identification of water-conditioned Pseudo-monasaeruginosa by Raman microspectroscopy on a single cell level.Syst Appl Microbiol. 2014;37(5):360–7.
34. Meisel S, Stockel S, Rosch P, Popp J. Identification of meat-associated pathogens via Raman microspectroscopy. FoodMicrobiol. 2014;38:36–43.
35. Strola SA, Baritaux JC, Schultz E, Simon AC, Al-lier C, EspagnonI, et al. Single bacteria identification by Raman spectroscopy. JBiomed Opt. 2014;19(11):111610.
36. Stöckel S, Kirchhoff J, Neugebauer U, Rösch P, Popp J. Theapplication of Raman spectroscopy for the detection and iden-tification of microorganisms. J Raman Spectrosc. 2015;47(1):89–109.
37. Baritaux JC, Simon AC, Schultz E, Emain C, Lau-rent P, DintenJM. A study on identification of bacteria in environmental sam-ples using single-cell Raman spectroscopy: feasibility and ref-erence libraries. Environ Sci Pollut Res Int. 2016;23(9):8184–91.
39. Munchberg U, Rosch P, Bauer M, Popp J. Raman spectroscopicidentification of single bacterial cells under antibiotic influence.Anal Bioanal Chem. 2014;406(13):3041–50.
40. Hlaing MM, Wood BR, McNaughton D, Rood JI, Fox EM,Augustin MA. Vibrational spectroscopy combined withtranscriptomic analysis for investigation of bacterial responsestowards acid stress. Appl Microbiol Biotechnol. 2018;102(1):333–43.
41. Neugebauer U, Rosch P, Popp J. Raman spectroscopy towards clin-ical application: drug monitoring and pathogen identification. Int JAntimicrob Agents. 2015;46(Suppl 1):S35–9.
42. Teng L,WangX,Wang X, Gou H, Ren L,Wang T, et al. Label-free,rapid and quantitative phenotyping of stress response in E. coli viaramanome. Sci Rep. 2016;6:34359.
43. Kirchhoff J, Glaser U, Bohnert JA, Pletz MW, Popp J, NeugebauerU. Simple ciprofloxacin resistance test and determination of mini-mal inhibitory concentration within 2 h using Raman spectroscopy.Anal Chem. 2018;90(3):1811–8.
44. Yang D, Zhou H, Haisch C, Niessner R, Ying Y. ReproducibleE. coli detection based on label-free SERS and mapping. Talanta.2016;146:457–63.
46. Mosier-Boss PA. Review on SERS of bacteria. Biosen-sors (Basel).2017, 7(4).
47. Muhlig A, Bocklitz T, Labugger I, Dees S, Henk S, Richter E, et al.LOC-SERS: a promising closed system for the identification ofmycobacteria. Anal Chem. 2016;88(16):7998–8004.
48. Rivera-Betancourt OE, Karls R, Grosse-Siestrup B, Helms S,Quinn F, Dluhy RA. Identification of mycobacteria based on spec-troscopic analyses of mycolic acid profiles. Analyst. 2013;138(22):6774–85.
49. Walter A,Marz A, SchumacherW, Rosch P, Popp J. Towards a fast,high specific and reliable discrimination of bacteria on strain levelby means of SERS in a microfluidic device. Lab Chip. 2011;11(6):1013–21.
50. Liu T-T, Lin Y-H, Hung C-S, Liu T-J, Chen Y, Huang Y-C, et al. Ahigh speed detection platform based on surface-enhanced Ramanscattering for monitoring antibiotic-induced chemical changes inbacteria cell wall. PLoS One. 2009;4(5):e5470.
51. Galvan DD, Yu Q. Surface-enhanced Raman scattering for rapiddetection and characterization of antibiotic-resistant bacteria. AdvHealthc Mater. 2018.
52. Grosse C, Bergner N, Dellith J, Heller R, Bauer M, Mellmann A,et al. Label-free imaging and spectroscopic analysis of intracellularbacterial infections. Anal Chem. 2015;87(4):2137–42.
53. Silge A, Abdou E, Schneider K, Meisel S, Bocklitz T, Lu-Walther HW, et al. Shedding light on host niches: label-free insitu detection of Mycobacterium gordonae via carotenoids inmacrophages by Raman microspectroscopy. Cell Microbiol.2015;17(6):832–42.
54. Li R, Goswami U, King M, Chen J, Cesario TC, Rentzepis PM. Insitu detection of live-to-dead bacteria ratio after inactivation bymeans of synchronous fluorescence and PCA. Proc Natl Acad SciU S A. 2018;115(4):668–73.
Rapid detection of bacterial infection and viability assessment with high specificity and sensitivity using...
55. Liu Y, Zhou H, Hu Z, Yu G, Yang D, Zhao J. Label and label-freebased surface-enhanced Raman scattering for pathogen bacteriadetection: a review. Biosens Bioelectron. 2017;94:131–40.
56. Stockel S, SchumacherW,Meisel S, ElschnerM,RoschP, Popp J.Raman spectroscopy-compatible inactivation method for patho-genic endospores. Appl Environ Microbiol. 2010;76(9):2895–907.
57. Ramamurthy T, Ghosh A, Pazhani GP, Shinoda S. Current perspec-tives on viable but non-culturable (VBNC) pathogenic bacteria.Front Public Health. 2014;2:103.
Publisher’s note Springer Nature remains neutral with regard to jurisdic-tional claims in published maps and institutional affiliations.


![1.1.1. bacterial infection of skin [compatibility mode]](https://static.documents.pub/doc/80x56/5549bc44b4c905e5048b4efe/111-bacterial-infection-of-skin-compatibility-mode.jpg)


