112
Rapid Environmental Assessment of The Urban Community of Al-Fayha’, Lebanon

Rapid Environmental Assessment of The Urban Community of Al-Fayha’, Lebanon

ii
Rapid Environmental Assessment of The Urban Community of Al-Fayha’, Lebanon
December 2009

iii
Disclaimers
The contents and views expressed in this publication do not necessarily reflect the views or policies of the agencies cooperating in this project. The opinions, figures and estimates set forth in this publication should not necessarily be considered as reflecting the view or carrying the endorsement of UNEP or cooperating agencies. The designations employed and the presentation of material in this publication do not imply the expression of any opinion whatsoever on the part of UNEP or cooperating agencies concerning the legal status of any country, territory or city or area of its authorities, or the delineation of its frontiers and boundaries. Mention of a commercial company or product in this publication does not imply the endorsement of the United Nation Environment Programme or cooperating agencies. The use of information from this publication concerning proprietary products for publicity or advertising in not permitted. Trademark names and symbols are used in an editorial fashion with no intention of infringement on trademark or copyright laws. We regret any errors or omissions that may have been unwittingly made.
iv
Acknowledgments The author acknowledges the contributions made by many individuals and institutions that have contributed to “Rapid Environmental Assessment of the Urban Community of Al-Fayha’, Lebanon”. Our special thanks go to the encouragement and support provided by Mr. AbdelKader Alameddine, Mayor of Al Mina Municipality, Mr. Rachid El-Jamali, Mayor of Tripoli and Chairperson of Al Fayha’ Union of Municipalities and Mr. Majed Ghomraoui, Mayor of Beddawi Municipality. We are also thankful for the coordination and support provided by Mr. Abdallah Abdulwahab, Director of the Urban Community Al Fayha’. Special thanks extended to: Lead Author: Ahmed O. El-Kholei UNEP Coordination: Adel Abdel-Kader UNEP Supporting Team Yasmina Adra, Hiba Sadaka Institutions Visited Al Mina Municipality BATCO Beddawi Municipality Center of Restoration and Conservation of Monuments. Dar Al Handasah-Nazih Taleb & Partners Deir Amar Power Plant Environmental Protection Committee (EPC) Health department, Governorate (Mohafaza) of North Lebanon LAVAJET Marine Research Center Ministry of Environment Port of Tripoli, Ministry of Public Works and Transport TEDO, Urban Community Al Fayha’ Tripoli Landfill Tripoli Municipality Tripoli Waste water Treatment Plant Urban Community Al Fayha’ Water Establishment in North Lebanon List of Interviewees Nisrin Abdalla, Bilal Abdulhai, Abdallah Abdulwahab, Abdelkader Alameddine, Mahmoud Al-Asaad, Hoda Al-Rifai, Rabii Asayran, Samira Baghdadi, Edward Bahout, Teddy Barhoum, Tony Boulos, Doha El-Beny, Fadi El-Hassan, Mervat El-Hoz, Rachid El-Jamali, Mahmoud El-Rashidi, Rola El-Sheikh,George Fadlallah, Azza Fatfat, Joseph Germanos, Majed Ghomraoui, Mohammad Ghomrawi, Amer Haddad, Fawaz Hamdi, Dima Homsi, Maha Kayyal, Gaby Khalaf, Rawia Majzoub, Karim Mikati, Marlene Najjar, Gaby Nasr, Alain Pouliquen, Mosbah Rajab, Rami Samaan, Ahmed Tamer

v
List of Reviewers Abdallah Abdulwahab, Doha El Beny, Dima Homsi, Marlene Najjar, Mosbah Rajab, Amal Soufi Participants of the Consultation Meeting on the Rapid Environmental Assessment of The Urban Community of Al-Fayha’, Lebanon report Nisrin Abdalla, Bilal Abdelhai, Abdallah Abdelwahab, Mustafa Adib, Mustafa Agha, Elias Akel, Abdelkader Alameddine, Jamil Alameddine, Lama Alameddine, Riad Alameddine, Mahmoud Al-Assaad, Bassam Al-Ayoubi, Khawla Al-Barazi, Muna Al-Chami, Majid Al-Hachem, Rana Al-Jamal, Oussama Al-Kallab, Hind Al-Khatib, Nuha Al-Molla, Abdelrahman Al-Mouwass, Haissam Al-Mubayed, Mahmoud Al-Rashidi, Fayiza Al-Sankari, Antonios Al-Souri, Nizar Amin, Abdelrahman Annous, Rabii Asayran, Atef Atiyeh, Fatima Badawi, Muna Baderghanem, Samira Baghdadi, Edward Bahout, Tony Boulos, Giselle Chammas, Bilal Chhitah, Lina Daboussi, Toufic Daboussi, Michel Dib, Joseph El-Aam, Doha El-Beny, Nazih El-Hajj, Akram El-Hajj Hussein, Nada El-Helou, Mervat El-Hoz, Rachid El-Jamali, Rola El-Sheikh, Francis Estphan, Georges Fadelallah, Mohammad Faitrouni, Lina Fares, Muna Fares, Azza Fatfat, Sami Feghali, Majed Ghomrawi, Mohammad Ghomrawi, Amer Haddad, Zeina Haddad, Jalal Halawani, Zuhair Hallis, Fawaz Hamdi, Goreng Hamwi, Diran Harmendian, Rabii Harrouq, Dima Homsi, Mustafa Houalla, Hazem Iich, Johnny Ibrahim, Nazih Ibrahim, Georges Ida, Mohammad Awni Issa, Rock Jabbour, Omayma Chafic Jadaa, Ghassan Jaradi, Joseph Jirmanos, Abdallah Kabbara, Mohammad Kabbara, Yasmin Kabbara, Samar Karam, Zeina Karami, Mohammad Kassha, Maha Kayyal, Gaby Khalaf, Delvin Kompmen, Jamal Krayem, Anwar Kubaitri, Olivier Lavinal, Catherine Le Tuma, Saiid Maaliqi, Munib Maarabani, Riad Madani, Lina Majzoub, Rawia Majzoub, Muqbel Malak, Samir Massaad, Fadi Matar, Ghassan Abdelkader Merhebi, AbdulElah Mikati, Karim Mikati , Rabii Mohsen, Nabil Mouawad, Pierre Mouawad, Fahed Moukadem, Chafouq Murad, Manal Nader, Fawaz Nahass, Marlene Najjar, Gaby Nasr, Ghassan Nour-Elddine, Racha Osmani, Alain Pouliquen, Dania Raad, Grace Rachid, Mosbah Rajab, Dania Rifaii, Huda Rifaii, Ramzi Saadeh, Mahmoud Salhab, Rami Samaan, Rawia Sankari, Christine Sayegh, Bilal Shihayta, Sana Sirwan, Jumana Siyadi, Amal Soufi, Ahmad Tamer, Muna Qoozi, Viviane Zouroub
vi
Table of Contents
Acknowledgments ..................................................................................................................... iv
List of Figures ............................................................................................................................. ix
List of Tables ............................................................................................................................. xii
Abbreviations .......................................................................................................................... xiii
Main Messages ......................................................................................................................... xv
Chapter 1 Introduction .............................................................................................................. 1
1.1 GEO Methodology and IEA .............................................................................................. 1
1.1.1 Focus of the analysis ................................................................................................. 2
1.1.2 Analytical framework: DPSIR matrix ......................................................................... 3
1.2 Key physical characteristics ............................................................................................. 6
1.2.1 Location .................................................................................................................... 6
1.2.2 Geography and topography...................................................................................... 7
1.2.3 Geology ..................................................................................................................... 8
1.2.4 Climate ...................................................................................................................... 9
Chapter 2 Social, economic and political contexts .................................................................. 13
2.1. Historic evolution of urbanization ................................................................................ 13
2.1.1 Territorial occupation and land use over time ....................................................... 13
2.1.2 Distribution of economic activities ......................................................................... 18
2.1.3 Growth and distribution of the population ............................................................ 22
2.1.4 Infrastructures ........................................................................................................ 26
2.1.5 Social services ......................................................................................................... 27
2.2. Description of the local political-administrative structure .......................................... 29
2.3. Socio-economic context ............................................................................................... 32
2.3.1 Dynamics of demographics .................................................................................... 32
2.3.2 Dynamics of Economics .......................................................................................... 32
2.3.3 Territorial occupation ............................................................................................. 33
2.3.4 Poverty and social inequity .................................................................................... 34
2.3.5 Patterns of consumption and production .............................................................. 35
Chapter 3 State of the Environment ....................................................................................... 50
3.1. Local ecosystems .......................................................................................................... 50
3.2. Analysis of ecosystem resources .................................................................................. 50
3.2.1 Air ........................................................................................................................... 50

vii
3.2.2 Water ...................................................................................................................... 51
3.2.3 Land ........................................................................................................................ 52
3.2.4 Biodiversity ............................................................................................................. 53
3.2.7 Marine Environment and Coastal Zone Management ........................................... 61
3.2.8 Mountains .............................................................................................................. 61
3.2.9 Forests .................................................................................................................... 62
3.3. Issues related to environmental management ............................................................ 62
3.3.1. Institutional setup ................................................................................................. 62
3.3.2 Solid waste management ....................................................................................... 63
3.2.3 Loss of cultural identity .......................................................................................... 64
3.4 Summary of the state of the local environment ........................................................... 64
Chapter 4 Impact of the state of the environment ................................................................. 66
4.1. Impact on ecosystems .................................................................................................. 67
4.2. Impact on quality of life and human health ................................................................. 68
4.3. Impact on the urban economy ..................................................................................... 70
4.4. Impact on the built environment ................................................................................. 71
4.5. Climate Change and Vulnerability to natural and technological disasters .................. 71
4.6 Impact at the policy-institutional level .......................................................................... 74
Chapter 5 Policy interventions and instruments ..................................................................... 75
5.1. Urban environmental management structures and functioning ................................. 75
5.2. Implementation of environmental policies and instruments ...................................... 77
5.2.1 Policy –administrative ............................................................................................ 77
5.2.2 Economic ................................................................................................................ 78
5.2.3 Physical intervention .............................................................................................. 78
5.2.4 Socio-cultural, educational and public communication ......................................... 80
5.2.5 Institutional Transformations for Sustainable Future ............................................ 82
Chapter 6 Future Perspectives ................................................................................................ 83
6.1. Market Forces ............................................................................................................... 83
6.2 Policy Reform ................................................................................................................. 84
6.3 Fortress World ............................................................................................................... 85
6.4 Great Transition: Towards Sustainability ...................................................................... 86
Chapter 7 Policy Options ......................................................................................................... 88
References ............................................................................................................................... 92

viii
Annexes ................................................................................................................................... 94
Annex 1 Consultant’s Itinerary ............................................................................................ 94
ix
List of Figures Figure 1 GEO conceptual framework ........................................................................................ 2
Figure 2 Interaction of DSPIR Matrix urban/environmental components ................................ 5
Figure 3 Location of Tripoli within Lebanon .............................................................................. 6
Figure 4 Al-Fayha’: Tripoli, El Mina and El Beddawi .................................................................. 7
Figure 5 Simplified geological map of Lebanon ......................................................................... 9
Figure 6 Simplified structural map of Lebanon ......................................................................... 9
Figure 7 Al Fayha’, Temperature, 2008, (°C) ........................................................................... 10
Figure 8 Al Fayha’, Humidity, 2008, (°C) .................................................................................. 10
Figure 9 Al Fayha’, Rain, 2008, (mm) ....................................................................................... 11
Figure 10 Al Fayha’, Wind direction ........................................................................................ 11
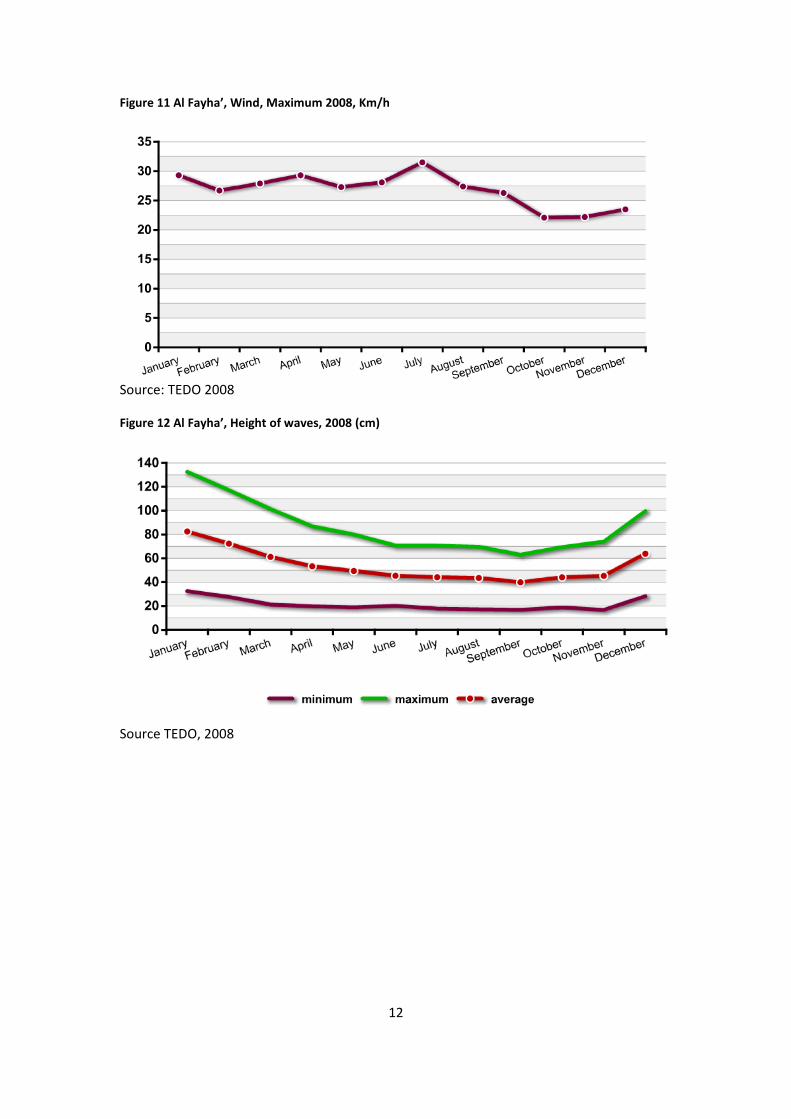
Figure 11 Al Fayha’, Wind, Maximum 2008, Km/h .................................................................. 12
Figure 12 Al Fayha’, Height of waves, 2008 (cm) .................................................................... 12
Figure 13 Mosque within the old quarters of Tripoli .............................................................. 13
Figure 14 Al Fayha’ Proposed master plan .............................................................................. 14
Figure 16 Khan Al Tamathiyli, El Mina ..................................................................................... 15
Figure 17 Sunday market (suq Al Ahad) and modern developments around the old quarters ................................................................................................................................................. 15
Figure 15 The Citadel of Tripoli ............................................................................................... 15
Figure 18 Old quarters of Al Fayha' ......................................................................................... 16
Figure 19 Green areas as percentage of total area of city, 2008 ............................................ 17
Figure 20 Per capita share of green areas (m2), 2008 ............................................................ 18
Figure 21 King Fahd Park, Tripoli ............................................................................................. 18
Figure 22 Value added as percent of GDP, 2002-2007 ........................................................... 19
Figure 23 Lebanon, GDP ($) and GDP growth rate (%), 2000-2007 ........................................ 19
Figure 24 Rate of real growth of GDP (%) and per capita share ($), 1996-2006 ..................... 20
Figure 25 Lebanon, Imports and export as percent of GDP, 2000-2006 ................................. 20
x
Figure 26 Share of shipments through Port of Tripoli versus other ports of Lebanon, (%) .... 21
Figure 27 Registered and unregistered economic establishments in Al Fayha’, 2008 ............ 22
Figure 28 Populations of the Governorates of Lebanon, 2007 ............................................... 23
Figure 29 North Lebanon, population growth, 2000-2007 ..................................................... 23
Figure 30 North Lebanon population histogram 1997 (right) and 2002 (left) ........................ 25
Figure 31 Population with health insurance ........................................................................... 27
Figure 32 Health Insurance stratified by sponsor ................................................................... 27
Figure 33 North Lebanon, Public and Private (free and for fees) Schools, 2003-2007 ........... 29
Figure 34 Collected fees for issuing building permits, 2000-2007 (thousand LBP) ................. 31
Figure 35 Lebanon, consumption of oil products, 1971-2006 ................................................ 35
Figure 36 Electricity generation by fuel, 1971-2006 ............................................................... 36
Figure 37 Lebanon, Energy production, 1971-2006 ................................................................ 36
Figure 38 Share of total primary energy supply in 2006, (%) .................................................. 37
Figure 39 Lebanon, total primary energy supply, 1971-2006 ................................................. 37
Figure 40 Location of wells within Al Fayha’ ........................................................................... 39
Figure 41 Tunnel for collecting wastewater under construction ............................................ 40
Figure 42 Location of landfill (left) and wastewater treatment plant (right) .......................... 41
Figure 43 Height of solid wastes in the land fill (m), 2000-2007 ............................................. 41
Figure 44 Amount of wastes dumped in the landfill (kg), 2000-2006 ..................................... 42
Figure 45 Daily generation of solid wastes by type of waste (ton), 2000-2007 ...................... 43
Figure 46 Al Fayha', Location of containers for MSW collection ............................................. 44
Figure 47 Map 1: Sampling sites for particulate matters in Urban Community Al Fayha’ ...... 45
Figure 48 TSP Concentration (µg/m3) May 2008 (Tripoli downtown) .................................... 46
Figure 49 TSP Concentration (µg/m3), June 2008 (Tripoli downtown) ................................... 46
Figure 50 PM10 Concentration (µg/m3), May 2008 (Tripoli downtown) ............................... 47
Figure 51 PM10 Concentration (µg/m3), June 2008 (Tripoli downtown) ............................... 47
Figure 52 PM 2.5 Concentration (µg/m3), May 2008 (Tripoli downtown) ............................. 48
xi
Figure 53 PM2.5 Concentration (µg/m3) May 2008 (Tripoli port area) .................................. 48
Figure 54 The banks of Abu Ali River ....................................................................................... 52
Figure 55 Birds of Palm Island ................................................................................................. 55
Figure 56 Other birds of Palm Island ....................................................................................... 56
Figure 57 Plants at Palm Island ................................................................................................ 57
Figure 58 Other plants at Palm Island ..................................................................................... 58
Figure 59 Palm Islands, mammals, turtles and fish ................................................................. 59
Figure 60 Palm Islands, other mammals and fish .................................................................... 60
Figure 61 Ehden forrests ......................................................................................................... 62
Figure 62 Solid wastes in the old quarters .............................................................................. 63
Figure 63 Old Tripoli overlooking Abu Ali River in the past ..................................................... 64
Figure 64 Assessment of marine litter off the coasts of Tripoli and El-Mina, Lebanon (%) .... 68
Figure 65 Tripoli County (including Al Fayha’), Water-borne diseases, 1998-2008 ................ 70
Figure 66 Problem tree ............................................................................................................ 91

xii
List of Tables Table 1 Labor force stratified by economic sector, 1997-2004, percent ................................ 21
Table 2 Al Fayha’ Area, Population and Densities, 2007-2009 ................................................ 24
Table 3 Lebanon and North Lebanon Dependent population, 2004 ...................................... 25
Table 4 Population of capital cities and selected urban agglomerations with 750 000 inhabitants in 2000 (thousands) .............................................................................................. 26
Table 5 Average annual rate of change of capital cities and selected urban agglomerations with 750 000 inhabitants or more in 2000 (%) ........................................................................ 26
Table 6 Reported cases (TRIPOLI casa), 1998-2008 ................................................................ 28
Table 7 Housing stock and vacant residences in Al Fayha’ ..................................................... 33
Table 8 Selected 2006 Indicators for Lebanon ........................................................................ 38
Table 9 Municipal solid waste generation rate ....................................................................... 43
Table 10 Lebanon and Northern Coastal Zone Cost of Environmental Degradation Comparison ............................................................................................................................. 66
Table 11 Northern Lebanon Coastal Environmental Valuation by Category in US$ million, 2005 ......................................................................................................................................... 67
Table 12 Lebanon, selected indicators for public health ........................................................ 70
Table 13 Findings of World Bank and ISDR Climate Resilient Cities Primer applied to Al Fayha’ ................................................................................................................................................. 73
Table 14 Lebanon: Top 5 Natural Disaster reported ............................................................... 73
Table 15 Lebanon: Human Exposure ....................................................................................... 74

xiii
Abbreviations B.C. Before Christ BATCO Badawi Azour Trading & Contracting Co. BAU Business As Usual CDR Council for Development and Reconstruction CDS City Development Strategy CM cubic meter cm2 square centimeter CO Carbon monoxide CO2 Carbon dioxide CSOs Civil Society Organizations CSR Corporate Social Responsibility DALYs Disability adjusted life years DPSIR Driving forces and Pressures, State, Impact and Response EIA Environmental Impact Assessment EIB European Investment Bank EPC Environmental Protection Committee EU European Union GDP Gross Domestic Product GDP Gross Domestic Product GEO Global Environmental Outlook GTZ Deutsche Gesellschaft für Technische Zusammenarbeit (German Corporation
for Technical Cooperation) ha Hectare IAURIF Institut D’Amenagement et D’Urbanisme – La Region Ile-de-France Ibid. ibidem, a Latin word meaning “in the same place.” ICJ International Code of Justice ICT Information and Communication Technology ICZM Integrated Coastal Zone Management IDAL Investment Development Authority of Lebanon IEA Integrate Environmental Assessment IEA International Energy Agency IUCN International Union for Conservation of Nature km2 square kilometer kWh Kilo Watt Hour LAVAJET a company belonging to Badawi Azour Trading & Contracting Co. m2 square meter MAP Mediterranean Action Plan MEDPOL Assessment and Control of Pollution in the Mediterranean region MENA Middle East and North Africa METAP Mediterranean European Technical Assistance Programme MoA Ministry of Agriculture MoE Ministry of Environment MoI Ministry of Industry MoPWT Ministry of Public Works and Transport ( MoT Ministry of Tourism Mt Metric Tons NICs Newly Industrialized Countries NOx Nitrogen Oxides
xiv
PM Particulate Matter SMAP Sustainable Mediterranean Action Plan SMEs Small and Micro Enterprises SMOG Smoke and Fog SOx Sulphur Oxides TDS Total Dissolved Salts TEDO Tripoli Environment and Development Observatory TLV Threshold Limit Values TOC Total Organic Carbon toe tone of oil equivalent TPES Total Primary Energy Supply TWh TeraWatt Hour U5MR Under-5 years old Mortality Rate UNCBD United Nations Convention on Biological Diversity UNCCD United Nations Convention to Combat Desertification UNEP United Nations Environment Programme UNFCCC United Nations Framework Convention on Climate Change USAID United States Agency VOCs Volatile Organic Compounds WB World Bank WHO World Health Organization WRI World Resources Institute

xv
Main Messages • Al Fayha’ is located within the Governorate of North Lebanon on the eastern shore of the
Mediterranean Sea. A major feature of North Lebanese topography is the alternation of lowland and highland that runs generally parallel with a north-to-south orientation. The extremely narrow coastal strip stretches along the shore of the eastern Mediterranean. Al Fayha’ enjoys a typical Mediterranean climate. Earthquakes constitute a major hazard.
• Al Fayha’ developed as the transshipping point and a refining center for crude petroleum brought by pipeline from Iraq. Small manufacturing plants produce foods, building materials, and simple consumer goods.
• Al Fayha’ is witnessing extreme slow population growth. The total population of Al-Fayha’ in 2001 was 300,488, and then grew to be 329,862 in 2007. The population growth in the coming decade will be only around one percent per annum. Migration is the major determinant for population growth. Population densities reached 114 persons per ha in 2009.
• The Lebanese urban system suffers from urban primacy and regional disparities, where Beirut is a primate city. Often urban primacy and regional disparities associate with social and economic problems, such as unemployment, poverty, and excessive influx of rural-urban migrants, including denying marginalized sub-populations’ access to power and wealth. Poverty is a serious issue in Al Fayha’.
• Al Fayha’ consists of a number of heterogeneous districts representing the time of their development. The city has an old historic quarter with irregular narrow streets, and modern districts, where streets are wide appropriate for motor traffic. In between these two extremes there are the transitional districts. Green areas do not represent a major component of the land uses in Al Fayha’.
• The economy of the Governorate of North Lebanon, including that of Al Fayha’, depends on manufacturing, construction, and services and trade. The port of Tripoli is ranked third in terms of shipments. This situation is expected to change once the new extensions to the port are developed.
• The Tripoli County has about 15 thousand economic establishments. Most of them are within Al Fayha’. An estimated 98 percent of these establishments are individually or family owned and operated. Most of these establishments are SMEs, about 90 percent. Only three thousand establishments are registered; while the majority are not registered, approximately 76 percent.
• Infrastructures in Al Fayha’ needs special attention. Despite official assurance that the quality of drinking water is acceptable and the available quantities are sufficient, the affluent population still depends on bottled water, and many buildings secure drinking water through private wells. There is a wastewater treatment plant, but the network to collect the wastewater is not complete. Many households depend on septic tanks, which constitutes a hazard and threatens the quality of groundwater. Electric power supply is
xvi
often interrupted, and the public depends on private power generators using oil as fuel. Dependence on private car and lacking decent mass transit system within Al Fayha’ and connecting the metropolis to other areas in Lebanon is another serious matter that affects the quality of air. There is a system for collecting and disposing municipal solid wastes to a dump site, which was neither designed to be a sanitary landfill nor its capacity can serve Al Fayha’ the coming decades.
• Al Fayha’ has educational and health services. The curricula for basic, secondary and vocational education are all adequate. The challenges that confront the educational system are trained cadres and proper facilities. Private schooling provides good education, unlike the formal, publicly run facilities. Dropouts from the educational system are observable in the form of child labor; even kids in the fourth grade in these areas have difficulty in reading and writing. Besides lacking medical insurance, the quality of provided health services needs further investigation. The available data shed light on the quantitative side of the issue, not the qualitative one. Attempting to draw links between diseases and state of the environment is not easy given the quality of the available information. Food poisoning could be a result of interrupted electric power supply, where the refrigeration of food is not properly maintained, and can easily spoil causing cases of food poisoning.
• Beside stressed land and water resources, the analysis shows the likelihood of SMOG episodes, given the monitored emission and the climatic conditions. The analysis also suggests that fragile ecosystems, such as the coastal zone, Palm Islands and surrounding forests and mountains are subject to stresses resulting from anthropogenic activities. The cultural heritage of the metropolis is also threatened because of inefficient management of the environment. Furthermore, the metropolis is subject to climate change, as an extended risks, and lack proper schemes for preventing and responding to natural and man-made disasters.
• The institutional setup in Lebanon is complex and is blamed to be among the causes for many problems. The division of the society along sectarian divisions is a serious issue in Lebanon. The centralized system is also a reason for delayed decisions. Local administrators lack autonomy. The planning and decision-making in Lebanon is based on sectoral approach that often results in weak inter- and intra-organizational interactions and coordination necessary for effective policy formulation and implementation. Without a proper framework to coordinate and prioritize environmental concerns and limited access to timely and accurate environmental information, environmental decision making to a large extent is reactive rather than proactive.
• The impacts of environmental degradation are of several folds. Adopting the Business As Usual (BAS) scenario will lead to deterioration of the ecosystems that will fail to provide their services, such as the decline in fish catchment. Some economic sectors, such as tourism, will lose their raision d’etre upon which they depend in case of environmental losses. Environmental degradation will cause further economic losses and social aggravation. Health indicators will show signs of a sick, ill society that requires additional

xvii
funds for treatment. The overall impact on the urban economy will be devastating. The problem with the ecosystems within and around of Al Fayha’ that they are fragile. In other words, the ecosystems within and around Al Fayha’ have extreme limited capacities to regenerate themselves. If lost, it is not easy to regenerate and restore them to their original conditions.
• CDR put together a master plan within the framework of the development programme 2006-2009. The Plan recommends giving priority to the social and economic development of Tripoli, due to its role in the development of the whole of north Lebanon. CDR plans several interventions in the sphere of urban planning. These interventions extend to specific physical interventions, such as investing in improvements in the provision of an integrated water and wastewater management schemes; solid waste facilities including a new sanitary landfill, transit station, etc. rehabilitant and preserving coastal zones, and developing a natural national part in the North of Lebanon.
• The measures of this plan are not enough. The competitiveness of Al Fayha’ requires massive investments in the infrastructures. SMEs need special attention, where the municipalities can assist them in marketing their products, providing them with patients for products marketable on a global scale through special agreements with international companies. The municipalities can organize caravans to market these products, and use the Rachid Karami Exhibit to invite leaders of manufacturing in the Arab world and the Mediterranean to sign contracts and protocols for association. The municipalities can also assist SMEs to access available credit to finance their operations and extensions by establishing a revolving fund to finance this imitative. Taxes and fees need to be considered and reviewed to encourage production rather than speculation particularly in real estate. The municipalities of Al Fayha’ need to change their image of a conservative city that lacks fun into a safe city for families and those interested in culture and history in addition to those who appreciate aesthetic scenes.
• Programmes for investing in the place only does not guarantee economic growth and sustain it. There is a need to invest in the human resources and transform them into human capital. Training and capacity building and development are necessary in country that lacks natural resources. Human capital can make up for lack of natural resources.
• Finally, there is a need for institutional transformation that assures the sustainability of the development of Al Fayha’ and Lebanon at large. This transformation rests on a departure from the current sectoral planning approach to a multi-stakeholder participatory decision-making that is conducive to building partnerships and enables the Lebanese to control their destiny and that of their future generations. Adopting the principles of good governance and rooting plans in the foundations of basic human rights is a sine quo non for this institutional transformation. Chapter 8 of Agenda 21 outlines specific interventions in this sphere. Institutional transformations are about reform to assure that current problems do not emerge once more.

1
Chapter 1 Introduction The Urban Community of Al-Fayha’ is a union of the three municipalities of Tripoli, El-Mina and El Beddawi. The metropolitan area consisting of the three cities is situated north of Batroun and the cape of Lithoprosopon,1 Tripoli is the capital of the North Governorate and the Tripoli District.2 The city is located 85 km north of the capital Beirut, and can be described as the easternmost port of Lebanon.3
In ancient times, it was the center of a Phoenician confederation which included Tyre, Sidon and Arados, hence the name Tripoli, meaning "triple city" in Greek. Later, the Assyrian Empire, Persian Empire, Roman Empire, the Caliphate, the Seljuk Empire, Crusader States, the Mamluks, and the Ottoman Empire successively controlled Tripoli and its environ. In the twelfth century, the Crusaders established the County of Tripoli.
4
Today, Tripoli, and the other two cities, is the second-largest metropolis in Lebanon, and the second-largest port in the country, with approximately 500 thousand inhabitants, overwhelmingly Sunni Muslims (approximately 80 per cent), along with small communities of Christians and Alawite.
56
This introductory section of the report aims to first introduce the methodology applied in preparing the report. UNEP developed and elaborated the GEO methodology and Integrated Environmental Assessment (IEA) tools, and applied them at global, continental, national and city levels. Following the brief presentation of the applied methodology, this introductory section then attempts to capture the key physical attributes of the metropolis. It addresses its location, geography and topography, and climate.
1.1 GEO Methodology and IEA The GEO assessment uses the drivers-pressures-state-impacts-responses (DPSIR) framework in analyzing the interaction between environmental changes. The concepts of human well-being and ecosystem services are central to the analysis. However, the report broadens its assessment from focusing exclusively on ecosystems to cover the entire environment and the interaction with society. The framework attempts to reflect the key components of the complex and multidimensional, spatial and temporal chain of cause-and-effect that characterizes the interactions between society and the environment. The GEO framework is generic and flexible, and recognizes that a specific thematic and geographic focus may require a specific and customized framework.
1 Theoprosopon is the Greek name of Lithoprosopon, a cape in north Lebanon, also known today by the name of Râs ach-Chaq’a’. The cape is a situated between the ancient cities of Batroun and Tripoli. 2 In Lebanon the districts are subunits of governorates 3 Wikipedia, Tripoli, Lebanon, http://en.wikipedia.org/wiki/Tripoli,_Lebanon (accessed 25 June 2009, 20:05) 4 Ibid. 5 A religious/ethnic group, a prominent minority in Syria, that describe themselves as a sect of Shī‘ah Islam 6 Ibid.

2
Therefore, the GEO conceptual framework contributes to society’s enhanced understanding of the links between the environment and development, human wellbeing and vulnerability to environmental change, Figure 1. The framework places, together with the environment, the social issues and economic sectors in the ‘impacts’ category rather than just exclusively in the ‘drivers’ or ‘pressures’ categories.
Figure 1 GEO conceptual framework
Source: UNEP, The fourth Global Environment Outlook: environment for development (GEO-4), 2008 http://www.unep.org/geo/geo4/media/ (accessed Sunday, 29 June 2008)
1.1.1 Focus of the analysis This report focuses on the interaction between urban development and the environment, assessing it using the Driving force,7 Pressure,8 State,9 Impact10 and Response11
7 What has resulted in the pressures, should be presented, highlighting the origin of such forces
(DPSIR)
8 Pressures are underlying economic and social forces such as population growth, consumption or poverty. 9 It is the condition of the environment resulting from pressure 10 It is the effect produced by the state of the environmental on aspects such as quality of life and human health, on the environment itself, on the built-up environment and on the local urban economy. 11 Response is the component relating to collective or individual actions that lessen or prevent negative environmental impacts, correct damage caused to the environment, conserve natural resources or contribute to improving the quality of life of the local population. Responses include activities for monitoring the system and information generation and dissemination for proper

3
matrix. The analysis focuses on driving forces and on the pressures of urban development on one hand, and the resulting impact on the environment and the services it provides on the other. In elaborating this report, it is important to consider the following:
• The main economic activities of Al Fayha’ cities,
• The social structure and equity of the three cities of Al Fayha’
• The main occupations in al Fayha’, and
• The local institutional structure; the consultant paid special attention to public bodies that protect the environment, and to the degree the residents are involved in the formulation of public policies, among others.
The report attempts to assess the impact of urbanization on the environment, especially on natural resources and local ecosystems. The report tries to present clearly the state of the environment and the impact it has on the quality of life in Al Fayha’. Considering that environmental degradation is an obstacle to development, the consultant proposes the use of the responses for the municipalities of Al Fayha’, the central government of Lebanon, and generally the society.
1.1.2 Analytical framework: DPSIR matrix DPSIR is a general framework for organizing information about the state of the environment. It tries to define and relate the group of factors that determine the characteristics influencing the environment at any territorial level (local, regional, national, global). The DPSIR matrix seeks to establish a logical link between its components to direct the assessment of the state and trend of the environment, from the factors that exert pressure on natural resources (and which may be understood as the “causes” of its present state), to responses of Al Fayha’ and Lebanon as to how to deal with its own environmental problems.
The framework assumes cause - effect relationships between interacting components of social, economic, and environmental systems, which are
• Driving forces of environmental change (e.g. industrial production);
• Pressures on the environment (e.g. discharges of waste water);
• State of the environment (e.g. water quality in rivers and lakes);
• Impacts on population, economy, ecosystems (e.g. water unsuitable for drinking); and
• Response of the society (e.g. watershed protection)12
The components of the DPSIR matrix express forms of urban-environmental relationships and environmental attributes, as well as the quality of local life. These components aim to answer the following fundamental questions:
1. What is happening to the environment and why? (driving force, state, pressure) 2. What are the consequences for the environment and humanity? (impact) 3. What is being done and how effective is it? (response)
decision-making, interventions in the form of preventive and corrective measures, and finally, supportive measures, such as capacity building, legislation, raising awareness, etc. 12 Cities Environment Reports on the Internet (CEROI) Programme, Urban Environment Gateway, “DPSIR Framework“ UNEP, GRID Arendal, http://ceroi.net/reports/arendal/dpsir.htm (accessed 29 June 2009 18:04)

4
4. Where are we heading? (future outlook) 5. What actions could be taken for more sustainable future? (policy options)
The components of the DPSIR matrix that correspond to the questions are: 1. Driving forces are human activities, processes and patterns that impact on
sustainable development. In human settlements, there are three main driving forces:
2. Pressure refers to underlying economic and social forces, such as population growth, consumption and poverty. From the policy point of view, pressure is the starting point from which to confront environmental problems. Information on pressure tends to be more easily available because it comes from socio-economic databases. Awareness of pressure factors seeks to respond to the question:
population dynamics, economic activities and territorial basis.
3. State refers to the condition of the environment, resulting from pressure; for example, the level of atmospheric pollution, soil erosion or deforestation. The information on the state of the environment responds to the question:
Why is it happening?
4. Impact refers to the effect produced by the state of the environmental on aspects such as quality of life and human health, on the environment itself, on the built-up environment and on the local urban economy. For example, an increase in soil erosion will produce one or several consequences: reduced food production, increased food imports, increased use of fertilizers and malnutrition.
What is happening to the environment?
5. Response relates to collective or individual actions that lessen or prevent negative environmental impacts, correct damage caused to the environment, conserve natural resources or contribute to improving the quality of life of the local population. Responses may include activities on regulation, environmental or research costs, public opinion and consumer preferences, changes in administrative strategies and providing information about the environment. Measuring how society responds requires more work on analysis and interpretation. The instruments included in this category of the matrix attempt to answer the question: Responses to the question:
What are we doing? What will happen if we do not act now?
Figure 2 shows the principal elements of each of the categories of the DPSIR matrix and the relationship between them. The matrix seeks to define possible relationship patterns between different human activities and the environment, in this specific case applied to urban-environmental relations. The simple PSR framework (Figure 2) merely states that human activities exert pressures (such as pollution emissions or land use changes) on the environment, which can induce changes in the state of the environment (for example,
aim to direct the analysis of future outlooks on the local environment by assessing its present state. The underlying logic of the DPSIR matrix allows links to be established to project/forecast future manifestations/implications of present environmental conditions, encouraging analyses to be made of the possible consequences of present actions. This raises the possibility of strategic action being taken to change the direction of environmental problems of Al Fayha’.

5
changes in ambient pollutant levels, habitat diversity, water flows, etc.). Society then responds to changes in pressures or state with environmental and economic policies and programs intended to prevent, reduce or mitigate pressures and/or environmental damage.13
Figure 2 Interaction of DSPIR Matrix urban/environmental components
"Driving force," as indicated in Figure 2, is a concept added to the above framework to accommodate more accurately the addition of social, economic, and institutional indicators. Furthermore, the use of the term "driving force" allows that the impact on sustainable development may be both positive and negative as it is often the case for social, economic, and institutional indicators. The DPSIR framework is actually a matrix that incorporates three types of indicators horizontally and the different dimensions of sustainable development vertically, namely social, economic, environmental, and institutional. 14
The use of the state of the environment indicators in the DPSIR framework can bring scientific findings from the field and lab to the public and decision-makers. As a rule, for indicators to steer action they should have an explicit target group in the city, country or region. A set of indicators should not only give information on the development in specific
13 National Strategies for Sustainable Development (NSSD), “Pressure State Response Frameworks,” www.nssd.net/references/SDInd/PSR.html (accessed on 29 June 2009 18:04) 14 National Strategies for Sustainable Development (NSSD), (Ref. Op. Cit.)

6
environmental problem areas, but also give a general impression of the state of the environment. Ideally, a set of indicators is a means devised to reduce a large quantity of data to a simpler form, while retaining essential meaning for the questions that are being asked of the data.
1.2 Key physical characteristics
1.2.1 Location Al Fayha’ is located within the Governorate of North Lebanon on the eastern shore of the Mediterranean Sea, as indicated in Figure 3. Tripoli is located at latitude 34 45 North and longitude 35 80 East, and altitude of 19 feet (5-6 meters) above sea level.15
Figure 3 Location of Tripoli within Lebanon
Each governorate is divided into counties known as Qadda’. The Tripoli county is bordered by the Mediterranean to the West, by Akkar to the North, Minyeh-Danniye and Zgharta to the East, and Koura to the South. Batroun county is located to the south but does not have direct borders with Tripoli county and Al Fayha’ as well, Figure 4.
Source: Lebanon, Wikipedia, the free encyclopedia, http://en.wikipedia.org/wiki/Lebanon (accessed 29 June 2009 13:37)
15 Climate Zone.Com, http://www.climate-zone.com/climate/lebanon/celsius/tripoli.htm (accessed 29 June 2009 14:10)

7
Figure 4 Al-Fayha’: Tripoli, El Mina and El Beddawi
Source: Harmandayan, Diran and others, Preliminary Brief for the Preparation of a Sustainable Development Strategy for the Al-Fayha’ Union of Municipalities Tripoli, El Mina & Beddawi
1.2.2 Geography and topography
, December 2006
Natural systems that extend outside the country influence the physical geography of Al Fayha’ and Lebanon at large. Like any mountainous region, North Lebanon's physical geography is complex. Landforms, climate, soils, and vegetation differ markedly within short distances. There are also sharp changes in other elements of the environment, from good to poor soils, moving through the mountains.
A major feature of North Lebanese topography is the alternation of lowland and highland that runs generally parallel with a north-to-south orientation. The extremely narrow coastal strip stretches along the shore of the eastern Mediterranean. Hemmed in between sea and mountain, the coast (sahil) is widest in the north near Tripoli, where it is only 6.5 kilometers wide. For the most part, the coast is abrupt and rocky. The shoreline is regular with no deep estuary, gulf, or natural harbor. The maritime plain is especially productive of fruits and vegetables.16
Al Fayha’ is blessed with two major waterways: Abu Ali river, which is polluted and does not provide the city with fresh water, and Naba Hab, which is a major source for fresh water, plus a number of springs and wells that provide the inhabitants with fresh water. The
16 Thomas Collelo, ed. Lebanon: A Country Study. Washington: GPO for the Library of Congress, 1987. http://countrystudies.us/lebanon/30.htm (accessed 26 June 2009, 23:26)
8
metropolis is suited along an extended coastal area with a distinctive front on the Mediterranean.
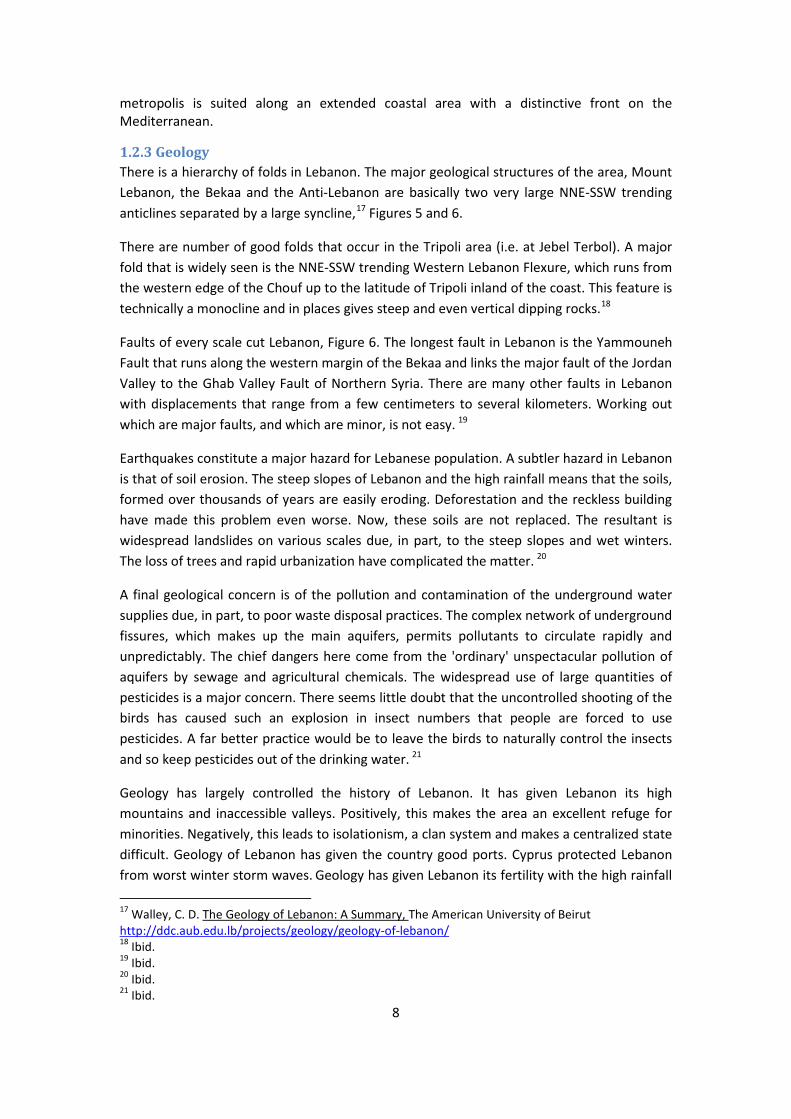
1.2.3 Geology There is a hierarchy of folds in Lebanon. The major geological structures of the area, Mount Lebanon, the Bekaa and the Anti-Lebanon are basically two very large NNE-SSW trending anticlines separated by a large syncline,17
There are number of good folds that occur in the Tripoli area (i.e. at Jebel Terbol). A major fold that is widely seen is the NNE-SSW trending Western Lebanon Flexure, which runs from the western edge of the Chouf up to the latitude of Tripoli inland of the coast. This feature is technically a monocline and in places gives steep and even vertical dipping rocks.
Figures 5 and 6.
18
Faults of every scale cut Lebanon, Figure 6. The longest fault in Lebanon is the Yammouneh Fault that runs along the western margin of the Bekaa and links the major fault of the Jordan Valley to the Ghab Valley Fault of Northern Syria. There are many other faults in Lebanon with displacements that range from a few centimeters to several kilometers. Working out which are major faults, and which are minor, is not easy.
19
Earthquakes constitute a major hazard for Lebanese population. A subtler hazard in Lebanon is that of soil erosion. The steep slopes of Lebanon and the high rainfall means that the soils, formed over thousands of years are easily eroding. Deforestation and the reckless building have made this problem even worse. Now, these soils are not replaced. The resultant is widespread landslides on various scales due, in part, to the steep slopes and wet winters. The loss of trees and rapid urbanization have complicated the matter.
20
A final geological concern is of the pollution and contamination of the underground water supplies due, in part, to poor waste disposal practices. The complex network of underground fissures, which makes up the main aquifers, permits pollutants to circulate rapidly and unpredictably. The chief dangers here come from the 'ordinary' unspectacular pollution of aquifers by sewage and agricultural chemicals. The widespread use of large quantities of pesticides is a major concern. There seems little doubt that the uncontrolled shooting of the birds has caused such an explosion in insect numbers that people are forced to use pesticides. A far better practice would be to leave the birds to naturally control the insects and so keep pesticides out of the drinking water.
21
Geology has largely controlled the history of Lebanon. It has given Lebanon its high mountains and inaccessible valleys. Positively, this makes the area an excellent refuge for minorities. Negatively, this leads to isolationism, a clan system and makes a centralized state difficult. Geology of Lebanon has given the country good ports. Cyprus protected Lebanon from worst winter storm waves. Geology has given Lebanon its fertility with the high rainfall
17 Walley, C. D. The Geology of Lebanon: A Summary, The American University of Beirut http://ddc.aub.edu.lb/projects/geology/geology-of-lebanon/ 18 Ibid. 19 Ibid. 20 Ibid. 21 Ibid.

9
and excellent springs. However, this is localized, demands hard work to farm due to the steep slopes and is easily destroyed. As a result, wealth based on agriculture has not proved easy; and many Lebanese have traditionally migrated or gone into commerce. This has been encouraged by the lack of mineral wealth. 22
Figure 5 Simplified geological map of Lebanon
Source: American University of Beirut http://ddc.aub.edu.lb/projects/geology/geology-of-lebanon/fig1.html
Figure 6 Simplified structural map of Lebanon
Source: American University of Beirut http://ddc.aub.edu.lb/projects/geology/geology-of-lebanon/fig2.html
1.2.4 Climate Al Fayha’ enjoys a typical Mediterranean climate, where the winter is cool with few showers and rain, and the summer is hot and humid. To the contrary, in elevated areas at the Eastern boarder of Al Fayha’, temperatures usually drop below freezing during the winter with frequent, sometimes heavy snow; summers are warm and dry. These areas are the origins of for fresh water.
Following Spring, temperature increases into the Summer. The maximum degrees of temperature are during mid-June, July and August. Starting mid-September, temperature tend to decline, Figure 7. The lowest temperature are during the winter season, starting December into January and February. According to Figure 8, average levels of humidity seem to be constant, while maximum levels decline in August, unlike the minimum levels that tend to increase during that month. Following months, maximum humidity increases, while minimum humidity starts to decline.
22 Ibid.

10
Figure 7 Al Fayha’, Temperature, 2008, (°C)
Source TEDO 2008
Figure 8 Al Fayha’, Humidity, 2008, (°C)
Source: TEDO 2008
Rain fall is the highest during the winter season. While during the summer season, Al Fayha’ is a dry bone, Figure 9. According to the Central Administration for Statistics, in 2007, Tripoli witnessed 71 days of rain, and the sea was calm for 101 days during that year. 23
Prevailing wind is from the southern and eastern directions, Figure 10. Average wind speed is depicted in Figure 11. It seems that wind speed associates with sea waves, Figure 12, which reaches the highest levels during the winter season.
23 Central Administration for Statistics, the Republic of Lebanon, Statistical Year Book 2007, Beirut, Lebanon, 2007

11
Figure 9 Al Fayha’, Rain, 2008, (mm)
Source: TEDO 2008
Figure 10 Al Fayha’, Wind direction
Source TEDO 2008
12
Figure 11 Al Fayha’, Wind, Maximum 2008, Km/h
Source: TEDO 2008
Figure 12 Al Fayha’, Height of waves, 2008 (cm)
Source TEDO, 2008

13
Chapter 2 Social, economic and political contexts Having examined the key physical characteristics in the former introductory section of the report, next section addresses the historic evolution of the metropolis by examining its territorial occupation and land uses, distribution of economic activities, population growth and distribution, and structure of systems for supplying services and infrastructures.
2.1. Historic evolution of urbanization Al Fayha’ Union (Etihad) of the municipalities of the cities: Tripoli, El-Mina and El Beddawi. It developed as a port on the Mediterranean Sea. In the past, Al Fayha’ developed as the transshipping point and a refining center for crude petroleum brought by pipeline from Iraq. Small manufacturing plants produce foods, building materials and simple consumer goods.
2.1.1 Territorial occupation and land use over time
Development of Al Fayha’
Tripoli was founded about 800 B.C. as the administrative center for three federated Phoenician cities: Tyre, Sidon, and Aradus. After coming under the rule of various empires, including the Seleucid, Roman, and Byzantine, it fell in 638 A.D. to Muslim Arabs. In 1109, after a five-year siege, during which its famed Islamic library was destroyed, the Crusaders captured Tripoli, a flourishing city at that time. The city served as the capital of a Crusader state until 1289, when the Mameluke sultan of Egypt captured and sacked. In the 1500's, the Ottoman Turks conquered the Mamelukes and ruled Tripoli almost continuously until after World War I. The city became part of a French-mandated territory in 1920 and part of independent Lebanon after World War II.24
Impact of topography and physical ecology
The topography and physical ecology are among the major determinants of Al Fayha’. Fragile zones, such as the coast and valleys are geographic determinants that dictate the structure, patterns and directions of urban development, and above all the image of the metropolis. They provide it with open areas for recreational activities and potential tourism developments. They also serve as buffer zones between the various subdivisions of the metropolis. Due, in part, to its physical ecology and extended history, Al Fayha’ demonstrates a rich blend of monuments and cultural heritage, and natural aesthetic values resulting from the rural, coastal and mountainous ecosystems. The resultant is a number of
24 Geography of Tripoli, How Stuff Works, http://geography.howstuffworks.com/middle-east/geography-of-tripoli-lebanon.htm (accessed 29 June 2009 14:39)
Figure 13 Mosque within the old quarters of Tripoli
Photo by A El-Kholei Photo by A. El-Kholei

14
subdivisions that are homogeneous from within, yet distinctive and different. Well-defined districts through edges, paths, nodes, and landmarks contribute to a clear definition and determination of the image of Tripoli and Al Fayha’ at large. In 2002, Harmadian adequately capitalized on these assets in elaborating a master plan for the metropolis, Figure 14.
Figure 14 Al Fayha’ Proposed master plan
Source: Harmadian, D. Proposed Master Plan
Reasons for existence
, 2002
Al Fayha’ symbolizes the blend of many cultures. It had shown notable resiliency to transform. Trade is the major reason for the location of Al Fayha’. Coastal cities, such as Al Fayha’, and in-land cities, such as Aleppo, are the outcome of complex trade networks, and served as nodes of these networks. It was, and still is connected to the global economy as a major port on the Mediterranean connected to the Arab communities beyond the nationally defined boundaries of Lebanon.
Districts of Al Fayha’
Al Fayha’ is an example of many human settlements of the Arab region. It has an extended history. Tripoli existed for millennia. The old, historic district of Tripoli is a prototype of many Middle Eastern cities, such as Cairo, Aleppo and Rabat.
Old quarters of Al Fayha’ is a compact mass of residences with open courtyard houses that result in a cellular urban pattern. The old quarters includes a permanent central market (suq), which consists of small, contiguous stalls located in numerous irregular covered
15
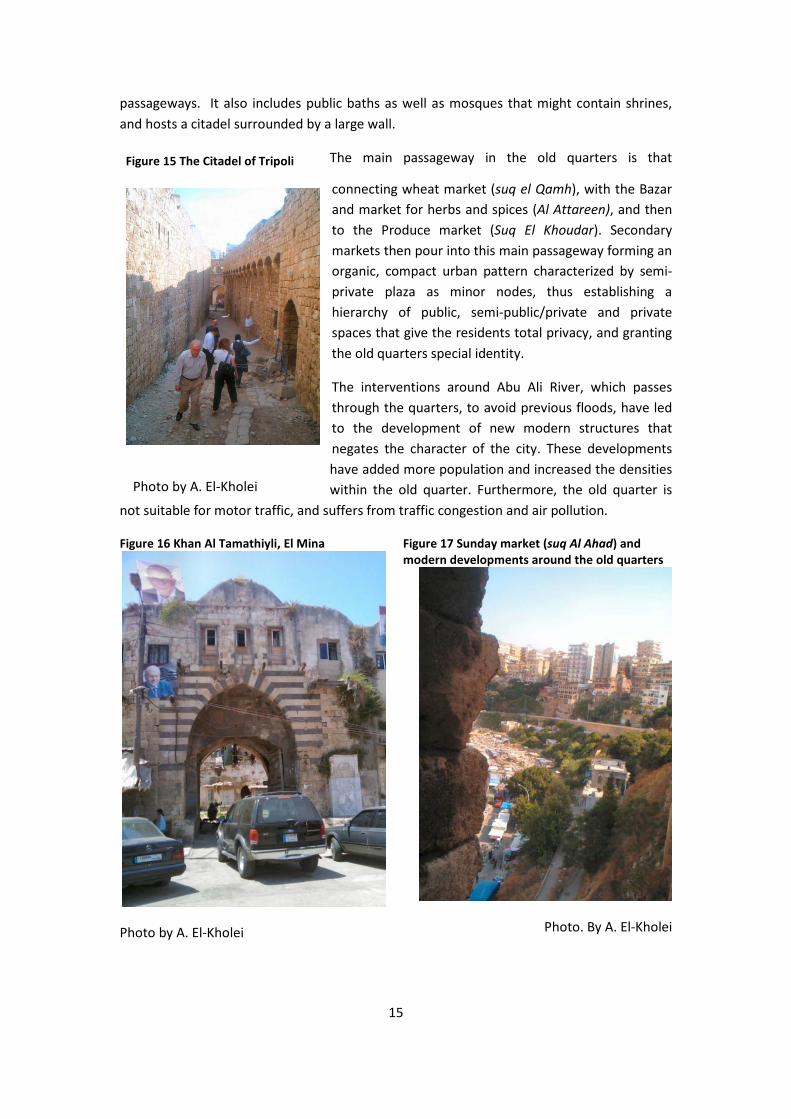
passageways. It also includes public baths as well as mosques that might contain shrines, and hosts a citadel surrounded by a large wall.
The main passageway in the old quarters is that
connecting wheat market (suq el Qamh), with the Bazar and market for herbs and spices (Al Attareen), and then to the Produce market (Suq El Khoudar). Secondary markets then pour into this main passageway forming an organic, compact urban pattern characterized by semi-private plaza as minor nodes, thus establishing a hierarchy of public, semi-public/private and private spaces that give the residents total privacy, and granting the old quarters special identity.
The interventions around Abu Ali River, which passes through the quarters, to avoid previous floods, have led to the development of new modern structures that negates the character of the city. These developments have added more population and increased the densities within the old quarter. Furthermore, the old quarter is
not suitable for motor traffic, and suffers from traffic congestion and air pollution.
Figure 16 Khan Al Tamathiyli, El Mina
Photo by A. El-Kholei
Figure 17 Sunday market (suq Al Ahad) and modern developments around the old quarters
Photo. By A. El-Kholei
Figure 15 The Citadel of Tripoli
Photo by A. El-Kholei

16
The old quarters include the old El Mina, the old quarters of Tripoli, and the old town of El Beddawi that developed around the fountain, and is divided by the Tripoli-Abboudiya road. The old quarters of Al Fayha’ is the central zone of the metropolis.
Figure 18 Old quarters of Al Fayha'
Source: TEDO 2008
The second group of distinct zones of Al Fayha’ is the transitional ones that constitute a belt around the old quarters. They are the location of relatively modern new commercial-businesses. The roads are wide enough, and adapt to the topography and natural determinants forming major squares and plazas at major intersections, especially Al Tal area that suffer from economic recession and degradation because of car parking and public transit terminal. These zones developed early the twentieth century. These zones provide the connection between the delicate urban fabric of the old quarters and the bold, gross-grain fabric of the modern quarters of Al Fayha’.
The third set of zones that constitute Al Fayha’ is the modern areas. The major attribute of these areas is the development of relatively high-rise apartment buildings, such as the area of Al-Ma’rid (the Exhibition). In El Mina, these modern developments are to the south and around Port Said Street.
17
Modern development zones within Al Fayha’ are favorable investment opportunities. However, they constitute a violation to the codes of the master plan laid in 1971.25
Al Fayha’ consists of other zones, such as areas for future urban sprawl around Tripoli in the direction of Ras Misqa and El Beddawi. The prices of land in these areas are lower than that of modern zones. Most of the developments in this area are in the form of residential compounds at the expense of agricultural land and other rare ecosystems. Outside the administrative boundaries of Al Fayha’, there are rural communities that are not part of the metropolis; yet they are organically and functionally related to Al Fayha’. In addition, a Palestinian refugee camp constitutes an independent, comprehensive residential compound. Finally, Al Fayha’ has zones of specific functions, such as the coastal area, the port, the industrial park for small and micro enterprises, and the IPC refinery.
Roads in this zone represent about 25-34 percent of the urban mass, which indicates wider roads and streets to accommodate motor traffic. These areas lack green and open areas. These zones are boring, and residences lack privacy and respect for pedestrians.
Green areas
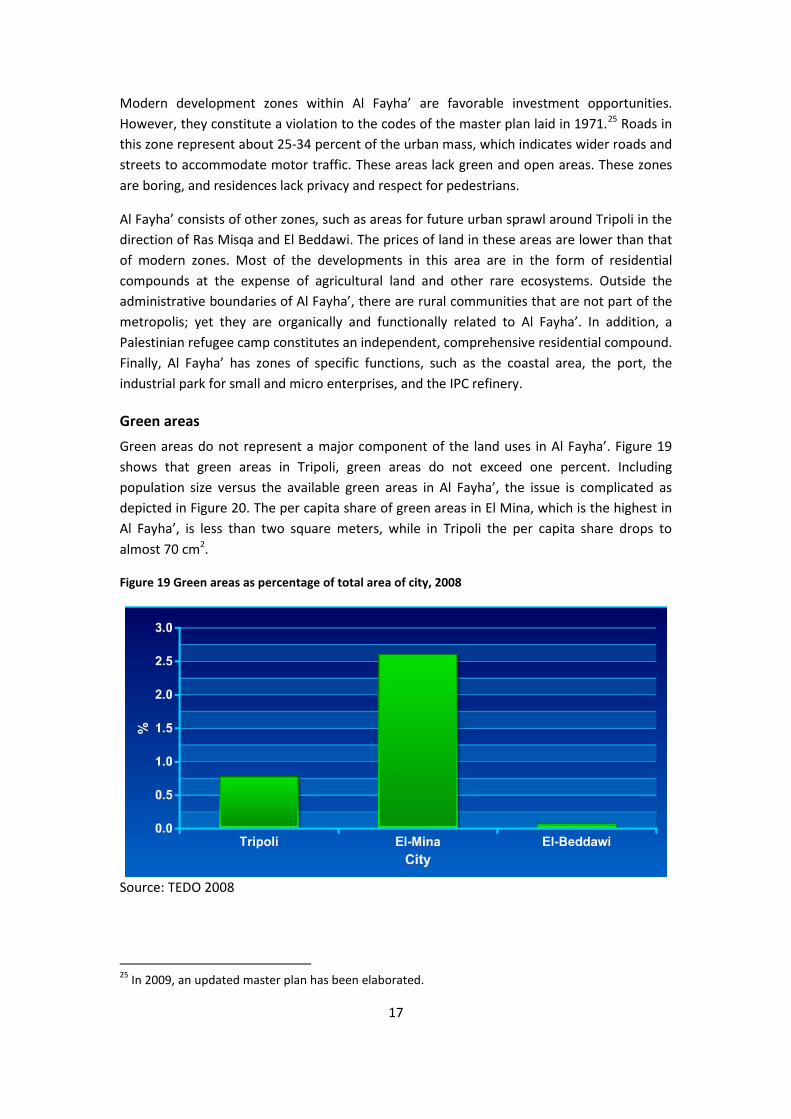
Green areas do not represent a major component of the land uses in Al Fayha’. Figure 19 shows that green areas in Tripoli, green areas do not exceed one percent. Including population size versus the available green areas in Al Fayha’, the issue is complicated as depicted in Figure 20. The per capita share of green areas in El Mina, which is the highest in Al Fayha’, is less than two square meters, while in Tripoli the per capita share drops to almost 70 cm2.
Figure 19 Green areas as percentage of total area of city, 2008
Source: TEDO 2008
25 In 2009, an updated master plan has been elaborated.
18
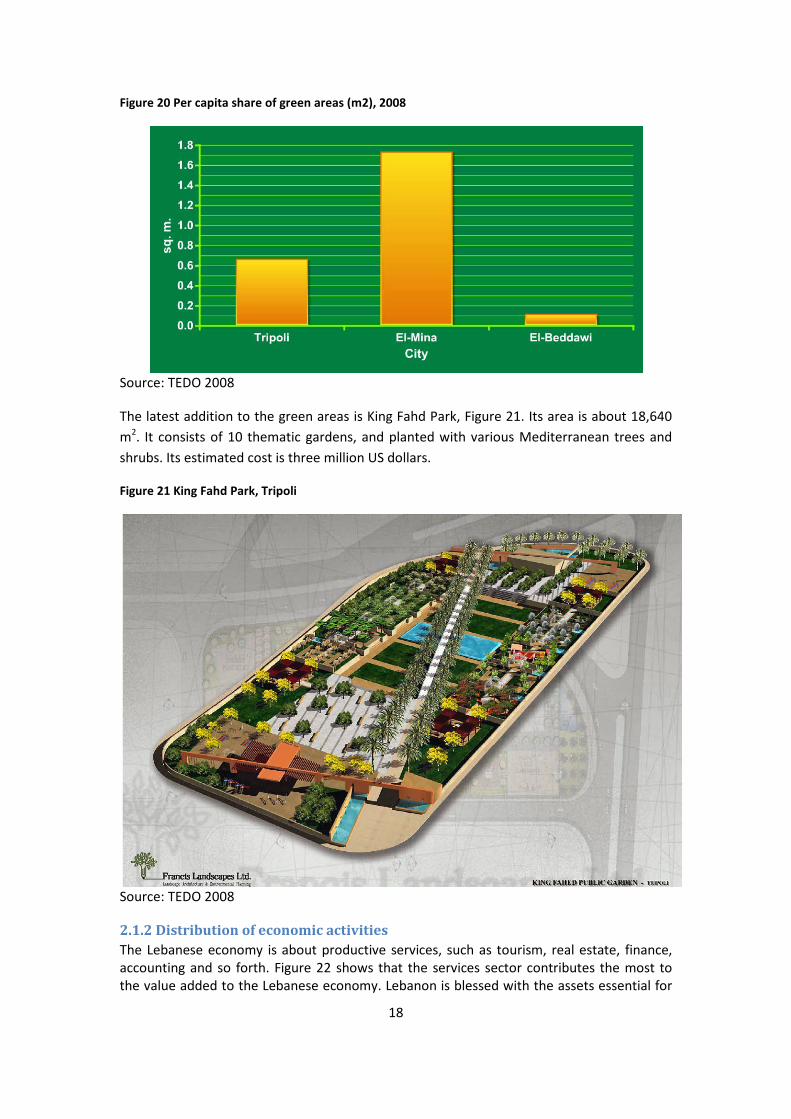
Figure 20 Per capita share of green areas (m2), 2008
Source: TEDO 2008
The latest addition to the green areas is King Fahd Park, Figure 21. Its area is about 18,640 m2. It consists of 10 thematic gardens, and planted with various Mediterranean trees and shrubs. Its estimated cost is three million US dollars.
Figure 21 King Fahd Park, Tripoli
Source: TEDO 2008
2.1.2 Distribution of economic activities The Lebanese economy is about productive services, such as tourism, real estate, finance, accounting and so forth. Figure 22 shows that the services sector contributes the most to the value added to the Lebanese economy. Lebanon is blessed with the assets essential for

19
these productive services to bloom and grow, i.e., natural aesthetics and adequate human resources. Productive service sector are delicate and susceptible to instabilities, particularly armed conflicts and global transformations.
Figure 22 Value added as percent of GDP, 2002-2007
Source: World Bank, World Development Indicators, 2008
During 2002 to 2007, the growth of the Lebanese economy fluctuated between 3.5 to 4.1 percent, as presented in Figure 23. Lebanon needs to diversify the economic base more, and seek means to protect the economic sectors, such as tourism, from shocks that could have negative impacts.
Figure 23 Lebanon, GDP ($) and GDP growth rate (%), 2000-2007
Source: World Bank, World Development Indicators, 2008
The rate of growth of GDP increased in real terms during 1996-2006. However, the per capita share of GDP in US dollars has declined, as Figure 24 suggests.

20
Figure 24 Rate of real growth of GDP (%) and per capita share ($), 1996-2006
Source: TEDO 2008
Lately, Lebanon started to import goods and services more than exported goods and services. This indicates a trade deficit that could easily affect inflation rates and exchange rates thus affecting people’s ability to afford and demand goods and services, Figure 25.
Figure 25 Lebanon, Imports and export as percent of GDP, 2000-2006
Source: World Bank, World Development Indicators, 2008
The economy of the Governorate of North Lebanon, including that of Al Fayha’, depends on manufacturing, construction, and services and trade. Using data presented in records for North Lebanon and Lebanon, the location quotient was calculated to determine the economic base of the Governorate of the North, Table 1. The table clearly shows that manufacturing, construction, and trade and services are the basic economic sectors, i.e., economic sectors whose output are traded with other areas within Lebanon and abroad. The investment and attention paid to these sectors can give the local economy the needed momentum to initiate growth and jump start the local economy from the current recession, given that most of the employment is in the private sector. According to TEDO report in
21
2008, employment in the private sector in North Lebanon was 80.3, 78.4 and 83.1 percent for the years of 1997, 2001 and 2004, respectively.
Table 1 Labor force stratified by economic sector, 1997-2004, percent
Economic Sector Agriculture
and Fishing Manufacture Construction Trade and
Services
1997
2001
2004
19
97
2001
2004
19
97
2001
2004
19
97
2001
2004
North Lebanon
14.9
0
9.80
12.3
0 14
.90
14.0
0
14.2
0 10
.60
10.1
0
10.5
0 59
.60
66.2
0
63.0
0
Lebanon
20.7
0
17.8
0
20.2
0 12
.50
10.7
0
12.0
0 9.
70
9.40
7.70
57
.10
62.2
0
60.1
0
Location Quotient 0.
72
0.55
0.61
1.
19
1.31
1.18
1.
09
1.07
1.36
1.
04
1.06
1.05
Source: TEDO 2008
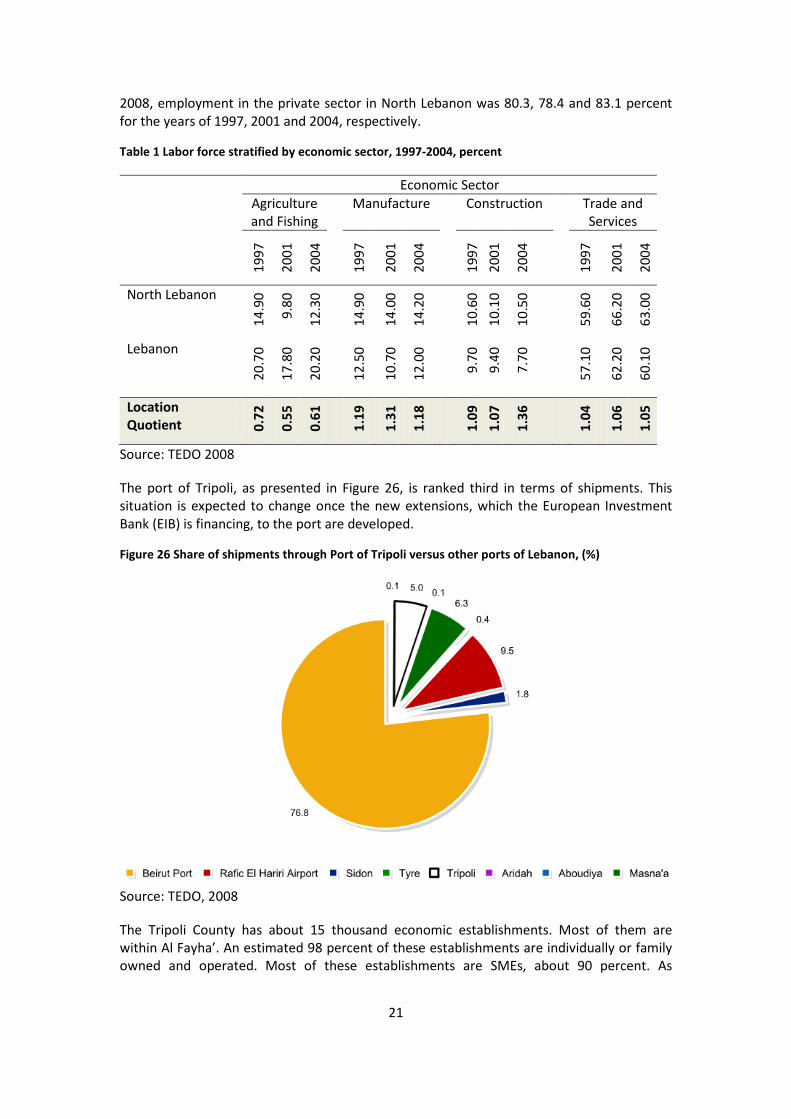
The port of Tripoli, as presented in Figure 26, is ranked third in terms of shipments. This situation is expected to change once the new extensions, which the European Investment Bank (EIB) is financing, to the port are developed.
Figure 26 Share of shipments through Port of Tripoli versus other ports of Lebanon, (%)
Source: TEDO, 2008
The Tripoli County has about 15 thousand economic establishments. Most of them are within Al Fayha’. An estimated 98 percent of these establishments are individually or family owned and operated. Most of these establishments are SMEs, about 90 percent. As

22
indicated in Figure 27, only three thousand establishments in the Tripoli County are registered, i.e., 24 percent; while the majority are not registered, approximately 76 percent.
Figure 27 Registered and unregistered economic establishments in Al Fayha’, 2008
Most of these establishments are within Al Fayha’ proper. The old quarters have many small workshops, such as the goldsmith for example; while the transitional and modern zones have the tourism and financial establishments. The waterfront in El Mina has specialized businesses that depend on the port and the fishermen community. This mixed land uses has serious implications on the images of Al Fayha’ and efficiency of the environmental management of the metropolis.
2.1.3 Growth and distribution of the population The population of Lebanon increased from 1,443 thousand in 1950 to 3,614 thousand in 2002, and will grow to reach 4,581 by 2025, where the
overall population growth rate is about one percent.26 However, the official sources of information show some differences. In 1996, according to the Lebanese Ministry of Social Affairs, the population of Lebanon was 3,111,828; while the Central Administration for Statistics reported that in 1997, the population of Lebanon was 4,005,025 then declined to 3,755,034 in 2004.27 The statistical Year Book reported that in 2007, the population of Lebanon was 3,759,137 of whom 50.6 percent are females; and a total population density of 360 residents per km2 distributed among the five governorates,28
According to Earthtrends, the annual population growth rate of Lebanon is about one percent, which is less than that of the Middle East and North Africa (MENA) region. However, the annual population growth of Lebanese urban areas is a round two percent; while rural populations decline as a 3.7 percent, which indicates migration to urban areas and abroad.
Figure 28. The inconsistency in data hampers proper decision-making –an issue that requires due attention.
29
26 Earthtrend Population, Health and Human Well-Being—Lebanon, 2003 http://earthtrends.wri.org 27 TEDO 28 Central Administration for Statistics, the Republic of Lebanon, Statistical Year Book 2007, Beirut, Lebanon, 2007 29 According to an interviewee, the population of Lebanon is about four million, but there are 12 million Lebanese abroad. An average Lebanese acquires two foreign languages and another nationality. The remittance of Lebanese working abroad is one of the major sources of income.
Source: TEDO 2008

23
Figure 28 Populations of the Governorates of Lebanon, 2007
Source: Central Administration for Statistics, the Republic of Lebanon, Statistical Year Book 2007
Armed confrontations, such as the Civil war, the 2006 war, Palestinian conflicts such Al Nahr Al Bard, all have negatively affected the local economy and of course the population of North Lebanon, as Figure 29 suggests.
, Beirut, Lebanon, 2007
Figure 29 North Lebanon, population growth, 2000-2007
Note: Only the first six months of 2007
Source: TEDO 2008
24
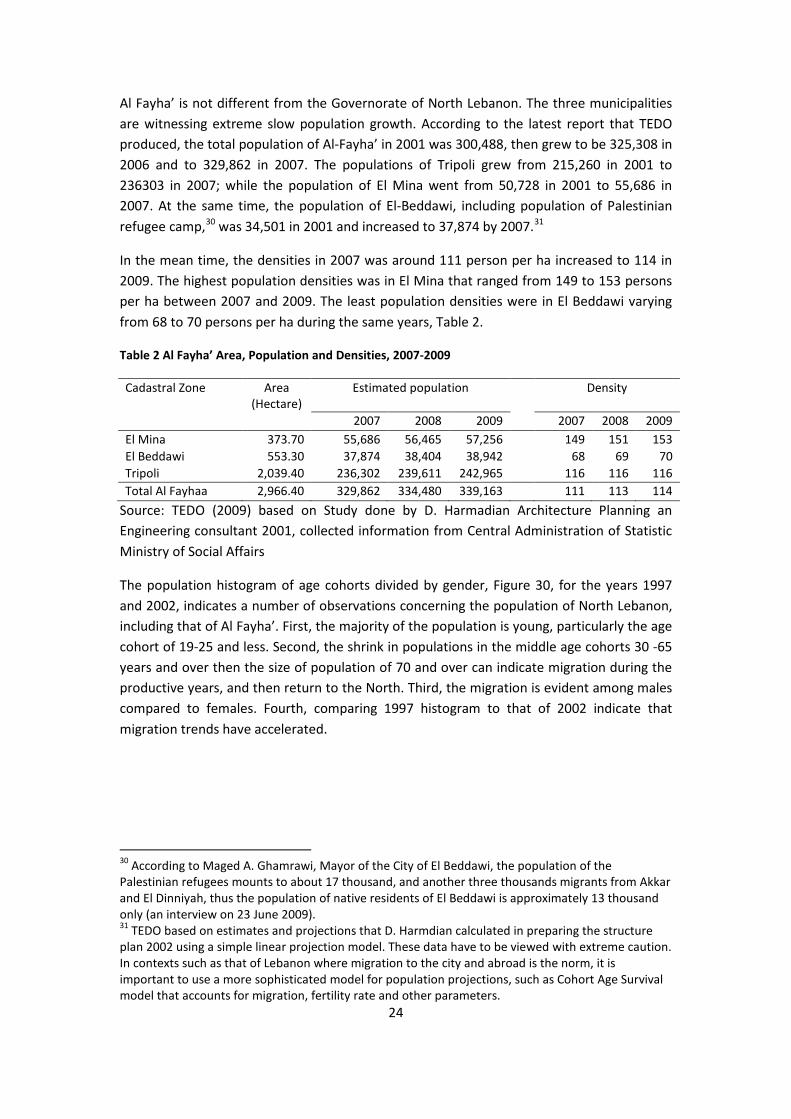
Al Fayha’ is not different from the Governorate of North Lebanon. The three municipalities are witnessing extreme slow population growth. According to the latest report that TEDO produced, the total population of Al-Fayha’ in 2001 was 300,488, then grew to be 325,308 in 2006 and to 329,862 in 2007. The populations of Tripoli grew from 215,260 in 2001 to 236303 in 2007; while the population of El Mina went from 50,728 in 2001 to 55,686 in 2007. At the same time, the population of El-Beddawi, including population of Palestinian refugee camp,30 was 34,501 in 2001 and increased to 37,874 by 2007.31
In the mean time, the densities in 2007 was around 111 person per ha increased to 114 in 2009. The highest population densities was in El Mina that ranged from 149 to 153 persons per ha between 2007 and 2009. The least population densities were in El Beddawi varying from 68 to 70 persons per ha during the same years, Table 2.
Table 2 Al Fayha’ Area, Population and Densities, 2007-2009
Cadastral Zone Area (Hectare)
Estimated population Density
2007 2008 2009 2007 2008 2009 El Mina 373.70 55,686 56,465 57,256 149 151 153 El Beddawi 553.30 37,874 38,404 38,942 68 69 70 Tripoli 2,039.40 236,302 239,611 242,965 116 116 116 Total Al Fayhaa 2,966.40 329,862 334,480 339,163 111 113 114
Source: TEDO (2009) based on Study done by D. Harmadian Architecture Planning an Engineering consultant 2001, collected information from Central Administration of Statistic Ministry of Social Affairs
The population histogram of age cohorts divided by gender, Figure 30, for the years 1997 and 2002, indicates a number of observations concerning the population of North Lebanon, including that of Al Fayha’. First, the majority of the population is young, particularly the age cohort of 19-25 and less. Second, the shrink in populations in the middle age cohorts 30 -65 years and over then the size of population of 70 and over can indicate migration during the productive years, and then return to the North. Third, the migration is evident among males compared to females. Fourth, comparing 1997 histogram to that of 2002 indicate that migration trends have accelerated.
30 According to Maged A. Ghamrawi, Mayor of the City of El Beddawi, the population of the Palestinian refugees mounts to about 17 thousand, and another three thousands migrants from Akkar and El Dinniyah, thus the population of native residents of El Beddawi is approximately 13 thousand only (an interview on 23 June 2009). 31 TEDO based on estimates and projections that D. Harmdian calculated in preparing the structure plan 2002 using a simple linear projection model. These data have to be viewed with extreme caution. In contexts such as that of Lebanon where migration to the city and abroad is the norm, it is important to use a more sophisticated model for population projections, such as Cohort Age Survival model that accounts for migration, fertility rate and other parameters.

25
Figure 30 North Lebanon population histogram 1997 (right) and 2002 (left)
Source: TEDO 2008
The fact that the majority of the population is young in addition to a growing elderly population as presented above suggests that the dependency ratio will be significantly high. Table 3 compares the information concerning the Governorate of North of Lebanon to the country at large, and indicates that the dependency at the North is higher than the national levels, which is complicated giving the migratory trends that are accelerating thus resulting a context that is conducive to the wide spread of poverty. This calls for measures to invest in the place and people as means towards poverty alleviation.
Table 3 Lebanon and North Lebanon Dependent population, 2004
Age group Dependent population
Supporting population
Dependency ratio
North Lebanon 297,282 471,427 63.1 Lebanon 1,305,113 2,449,920 53.3 Source: TEDO based on Central Administration for Statistics, Ministry of Social Affairs, National Study on households’ living conditions
The UN World Urbanization Prospects, 2003, published estimates for populations of major world cities including Beirut and Tripoli, Tables 4 and 5. The data presented in the tables reveal a number of facts. First, the civil war 1975-1990 has affected the growth rates of Beirut that started to pick up to reach 4.43 percent during 1995-2000. To the contrary, the growth rates of the population of Tripoli were almost stationary, and showed little response to the civil war, and then started to decline this decade as a result of slow economic growth. The population of Tripoli will continue to decline in the coming two decades if current economic stagnation continues. Second, the data show that the Lebanese urban system suffers from urban primacy i.e., the urban population is not distributed equitably among the cities that constitute the Lebanese national urban system, thus negatively affecting the distribution of resources and investments. The existence of primate cities, that is Beirut, reflects wide regional disparities. Often urban primacy and regional disparities associate with social and economic problems, such as unemployment, poverty, and excessive influx of
, 2004, Beirut, Lebanon, 2005

26
rural-urban migrants, including denying marginalized sub-populations’ access to power and wealth.32
Table 4 Population of capital cities and selected urban agglomerations with 750 000 inhabitants in 2000 (thousands)
Country City 1960 1970 1980 1990 2000 2005 2010 2015 Lebanon Beirut 556 921 1 623 1 153 1 639 1 875 2 047 2 174 Tripoli 101 127 149 176 207 212 218 228
Source: Data compiled from World Urbanization Prospects, 2003, http://esa.un.org/unup/index.asp?panel=1
Table 5 Average annual rate of change of capital cities and selected urban agglomerations with 750 000 inhabitants or more in 2000 (%) Country City 1970-
75 1975-80
1980-85
1985-90
1990-95
1995-00
2000-05
2005-10
2010-15
Lebanon Beirut 9.75 1.58 -2.17 -4.67 2.61 4.43 2.69 1.76 1.20 Tripoli 1.68 1.63 1.63 1.63 1.63 1.63 0.51 0.57 0.92
Source: Data compiled from World Urbanization Prospects, 2003, http://esa.un.org/unup/index.asp?panel=1
2.1.4 Infrastructures Within the Ministry of Energy and Water, there are number of agencies responsible for the provision of these two essential commodities. According to the Central Administration for Statistics, the North Lebanon Water and Wastewater Establishment is responsible for drinking water, and wastewater collection and treatment. Many buildings have their own solution to dispose wastewater, such as septic tanks, since the network in the city does not collect from all buildings. Also, many buildings have their own wells to secure supply of fresh water. Most of the affluent depend on bottled water for drinking and cooking, which affects the budget of the household.
The responsibility of energy supply and provision in Al Fayha’ is divided among various bodies. For example, Deir Amar electricity generating power plant supplies the energy, and another body is responsible for distribution. Almost all residential and non-residential buildings contain an electricity power generator to augment for interrupted power supply. Electricity is generated using fuel, which negatively affects the air quality.
As for solid waste management, LAVAJET, a private company, is responsible for municipal waste collection and street cleansing. BATCO, a private company that CDR contracted on behalf of Al Fayha’ municipalities, is managing the landfill.33
32 Abu-Lughod, Janet and Richard Hay Jr. Third World Urbanization, Methuen and Co. Ltd., London 1977. 33 There is a different modality for collecting and disposing wastes generated that medical care establishments generate.
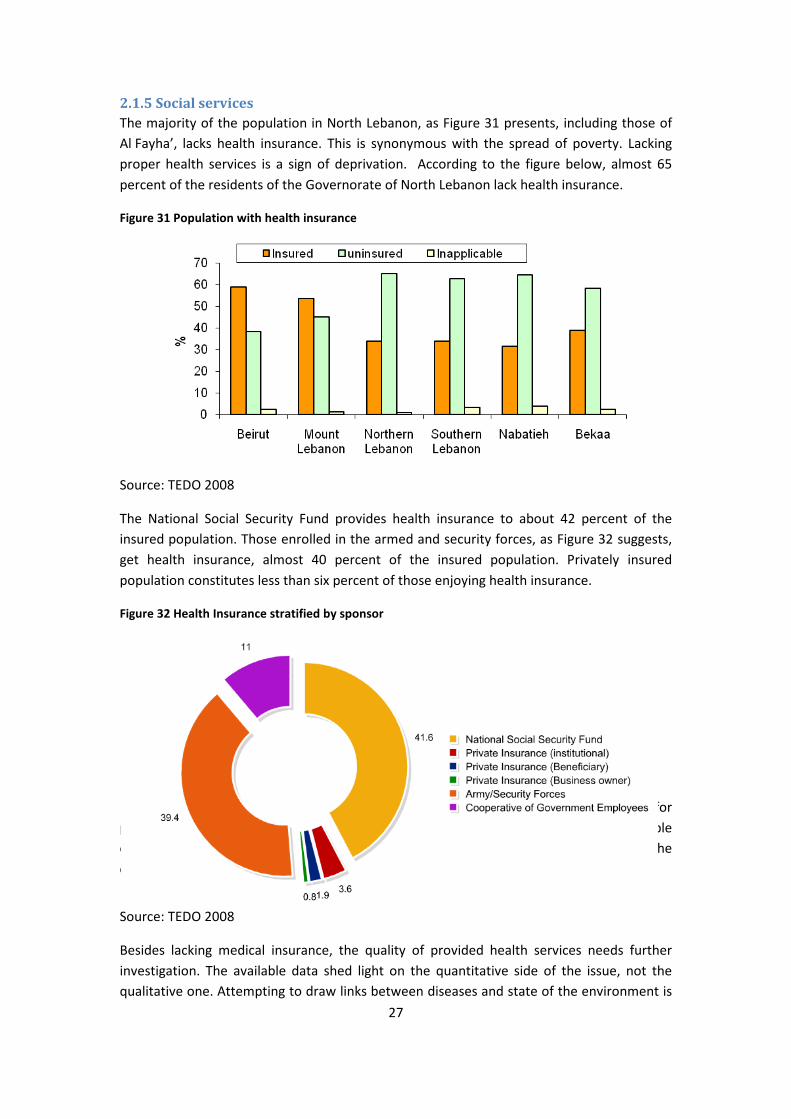
27
2.1.5 Social services
There is no clear system for public transport. The available sorts of public transport is mini-van and buses that people own and operate within Al Fayha’ and connecting the three cities to other parts of the country. Almost all residents depend on private vehicles in their transportation.
The majority of the population in North Lebanon, as Figure 31 presents, including those of Al Fayha’, lacks health insurance. This is synonymous with the spread of poverty. Lacking proper health services is a sign of deprivation. According to the figure below, almost 65 percent of the residents of the Governorate of North Lebanon lack health insurance.
Figure 31 Population with health insurance
Source: TEDO 2008
The National Social Security Fund provides health insurance to about 42 percent of the insured population. Those enrolled in the armed and security forces, as Figure 32 suggests, get health insurance, almost 40 percent of the insured population. Privately insured population constitutes less than six percent of those enjoying health insurance.
Figure 32 Health Insurance stratified by sponsor
Source: TEDO 2008
Besides lacking medical insurance, the quality of provided health services needs further investigation. The available data shed light on the quantitative side of the issue, not the qualitative one. Attempting to draw links between diseases and state of the environment is

28
not easy given the quality of the available information. Table 6 shows the cases stratified by diseases. Viral hepatitis B, typhoid fever, food poisoning and measles are significantly present in Tripoli casa during 1998-2008. Food poisoning could be a result of interrupted electric power supply, where the refrigeration of food is not properly maintained, and can easily spoil causing cases of food poisoning.
Table 6 Reported cases (TRIPOLI casa), 1998-2008
Reported cases Year
1998 1999 2000 2001 2002 2003 2004 2005 2006 2007 2008
Viral Hepatitis B 55 65 112 61 63 106 46 45 25 53 136
Dysentery 10 14 17 1626 13 15 1 12 3 13
Typhoid Fever 171 365 229 256 148 208 61 70 41 32 24
Parasitic Worms 1 1 1
Meningitis 4 1 1 17 12 13 21 10 11 12 10
Food Poisoning 72 34 16 6 5 2 11 13 11 24
Acute Flaccid Paralysis 2 1 2 2 4 1 2 1 6 2
Measles 303 1 1 37 20 79 72 115 2
Rubella 1
Brucellosis 30 31 27 14 11 12 11 9 3
tuberculosis 14 7 0
Hydatic Cyst 1 0 0
Typhus 1 1 0 1 1
Tetanus 2 1
Mumps 3 10 33 2 1 1 43 3 1
Pertussis 1 2 5 2 3 10 5 4 8
Gonorrhea 1 0 0
Malaria 3 1 1 2 5 3 2 1
Leprosy 1
Syphilis 2
Total 621 480 428 2006 320 406 167 259 229 265 214
Source: TEDO 2008
Public schooling, which provides educational service for free, prevails over private schools, Figures 33. However, the figure does not indicate the quality of education services. The curricula for basic, secondary and vocational education are all adequate. The challenges that confront the educational system are trained cadres and proper facilities. Private schooling provides good education, unlike the formal, publicly run facilities, particularly those in poor areas, such as El-Tibbanna, dropouts from the educational system is observable in the form of child labor; even kids in the fourth grade in these areas have difficulty in reading and writing - - a sign of degraded education quality.34
34 Interview with Dr. Samira Baghdady, Member of Tripoli Municipal Council on 24 June 2009.

29
Figure 33 North Lebanon, Public and Private (free and for fees) Schools, 2003-2007
Source: TEDO 2008
2.2. Description of the local political-administrative structure The economic, social and environmental problems and challenges towards localizing sustainable development in Lebanon stem from its political setup. The population of Lebanon consists of approximately 17 religious sects of Muslims 59.7 percent (Shia, Sunni, Druze, Isma'ilite, Alawite or Nusayri), Christian 39 percent (Maronite Catholic, Greek Orthodox, Melkite Catholic, Armenian Orthodox, Syrian Catholic, Armenian Catholic, Syrian Orthodox, Roman Catholic, Chaldean, Assyrian, Copt, or Protestant), and other 1.3 percent. The nation gained independence in 1943. A lengthy civil war (1975-1990) devastated the country because of sectarian differences and rights, but Lebanon has since made progress toward rebuilding its political institutions. Al Ta'if Accord served as a blueprint for national reconciliation. Since the end of the war, Lebanon has conducted several successful elections. In May-June 2005, Lebanon held its first legislative elections since the end of the civil war free of foreign interference. In July 2006, Hizballah engaged in a 34-day conflict with Israel. During this conflict, approximately 1,200 Lebanese civilians were killed. In May-September 2007, the Lebanese Armed Forces battled Sunni extremist group Fatah al-Islam in the Nahr al-Barid Palestinian refugee camp, winning a decisive victory, but destroying the camp and displacing 30 thousands Palestinian residents.35
As mentioned earlier, Lebanon consists of six governorates. The governance system consists of three branches:
35 Central Intelligence Agency, “Lebanon,” The World Fact Book, https://www.cia.gov/library/publications/the-world-factbook/geos/LE.html
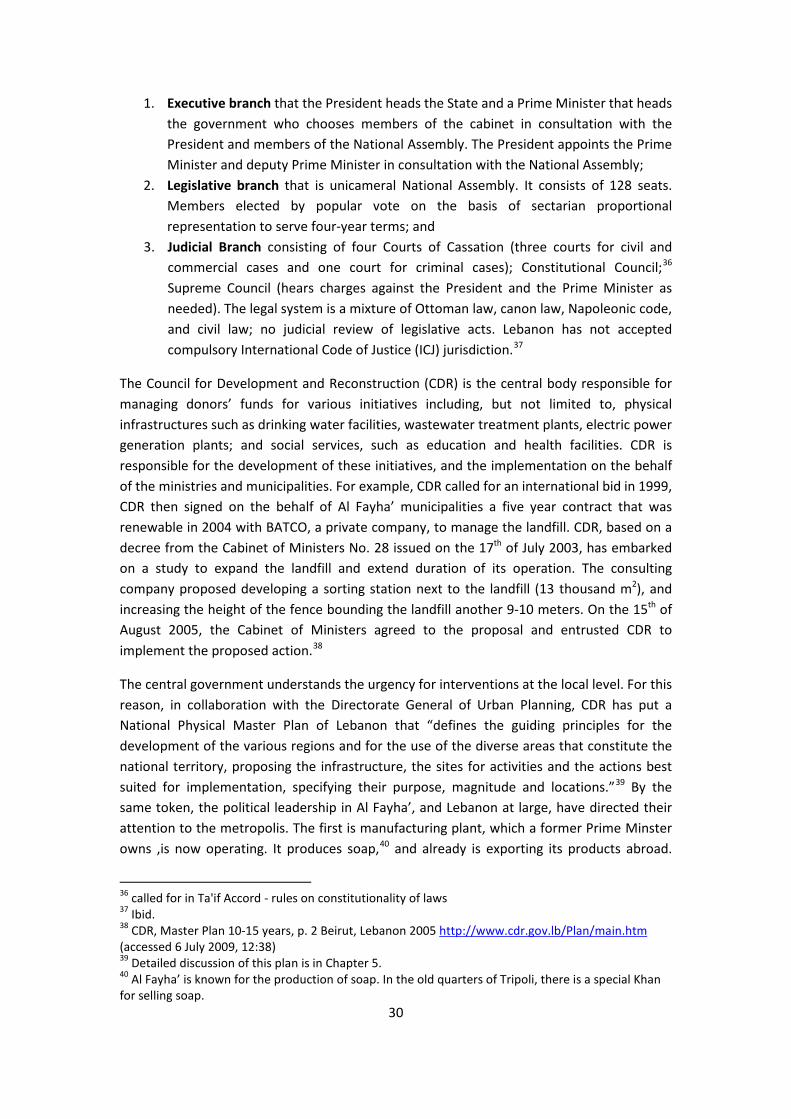
30
1. Executive branch that the President heads the State and a Prime Minister that heads the government who chooses members of the cabinet in consultation with the President and members of the National Assembly. The President appoints the Prime Minister and deputy Prime Minister in consultation with the National Assembly;
2. Legislative branch that is unicameral National Assembly. It consists of 128 seats. Members elected by popular vote on the basis of sectarian proportional representation to serve four-year terms; and
3. Judicial Branch consisting of four Courts of Cassation (three courts for civil and commercial cases and one court for criminal cases); Constitutional Council;36
Supreme Council (hears charges against the President and the Prime Minister as needed). The legal system is a mixture of Ottoman law, canon law, Napoleonic code, and civil law; no judicial review of legislative acts. Lebanon has not accepted compulsory International Code of Justice (ICJ) jurisdiction.37
The Council for Development and Reconstruction (CDR) is the central body responsible for managing donors’ funds for various initiatives including, but not limited to, physical infrastructures such as drinking water facilities, wastewater treatment plants, electric power generation plants; and social services, such as education and health facilities. CDR is responsible for the development of these initiatives, and the implementation on the behalf of the ministries and municipalities. For example, CDR called for an international bid in 1999, CDR then signed on the behalf of Al Fayha’ municipalities a five year contract that was renewable in 2004 with BATCO, a private company, to manage the landfill. CDR, based on a decree from the Cabinet of Ministers No. 28 issued on the 17th of July 2003, has embarked on a study to expand the landfill and extend duration of its operation. The consulting company proposed developing a sorting station next to the landfill (13 thousand m2), and increasing the height of the fence bounding the landfill another 9-10 meters. On the 15th of August 2005, the Cabinet of Ministers agreed to the proposal and entrusted CDR to implement the proposed action.
38
The central government understands the urgency for interventions at the local level. For this reason, in collaboration with the Directorate General of Urban Planning, CDR has put a National Physical Master Plan of Lebanon that “defines the guiding principles for the development of the various regions and for the use of the diverse areas that constitute the national territory, proposing the infrastructure, the sites for activities and the actions best suited for implementation, specifying their purpose, magnitude and locations.”
39 By the same token, the political leadership in Al Fayha’, and Lebanon at large, have directed their attention to the metropolis. The first is manufacturing plant, which a former Prime Minster owns ,is now operating. It produces soap,40
36 called for in Ta'if Accord - rules on constitutionality of laws
and already is exporting its products abroad.
37 Ibid. 38 CDR, Master Plan 10-15 years, p. 2 Beirut, Lebanon 2005 http://www.cdr.gov.lb/Plan/main.htm (accessed 6 July 2009, 12:38) 39 Detailed discussion of this plan is in Chapter 5. 40 Al Fayha’ is known for the production of soap. In the old quarters of Tripoli, there is a special Khan for selling soap.

31
Sa’ad Al Hariri, the present Prime Minister, financed the development of King Fahd Park, and currently financing the development of three schools to serve approximately five thousand student.41
The Ministry of Interior and Municipalities consists of seven agencies (muduriyat). One of these agencies is responsible for municipalities and local councils. The Governor is appointed as a public official. At the municipal level, members of the local councils are elected, and they elect among themselves the City Chief (Mayor). For each municipality there is an observer, who reviews and approves the decisions of the local council. The law that governs the operations of the municipalities was drafted along the French law in 1977, but during the period of 1977-2009, several amendments were introduced to the law. In 2002, the Government started collecting added value tax instead of the fees on infrastructures and services that the municipalities used to gather, thus sources of revenues to the local administration are directed to the national treasury. The revenues of local administration were reduced. Figure 34 shows fluctuations in the fees collected to issue building permits in Al Fayha’ during 2000 and 2007. The figure affirms the findings of Harmadian presented earlier– most of the regulated developments are in and around Tripoli.
Figure 34 Collected fees for issuing building permits, 2000-2007 (thousand LBP)
Source: TEDO 2008
The municipalities of Al Fayha’ provide a wide range of services and physical interventions. These services include, but not limited to, licensing businesses, cultural and educational services, medical care, etc. The physical interventions include, but not limited to, paving roads, developing sidewalks, planting green areas, etc. However, municipalities lack autonomy in many areas. For example, they cannot issue a decree to collect fines penalizing polluters.
41 Interview with Rachid El Jamali, Mayor of Tripoli and Chairperson of Al Fayha’ Union of Urban Municipalities on 23 June 2009.
32
The discussion cannot be complete without examining the conditions of the civil society, including the private sector companies, labour unions, professional syndicates, NGOs and so forth. As in other aspects of the Lebanese reality, the civil society is completely politicized. For example, most syndicates are often in service of the political cause not to serve their members. NGOs are free, and operate in almost all spheres as a “social/commercial” activity with mega-signs and labels, but unfortunately, little on the ground. Private sector companies lack the complete understanding of the concept of Corporate Social Responsibility (CSR).42
2.3. Socio-economic context
2.3.1 Dynamics of demographics Natural population growth is not the major determinant for population growth in urban Lebanon, as presented earlier. The major determinant is migration from rural areas to urban centers, where 70 percent of more live; migration from small towns to major metropolitan areas, such as Beirut; and migration to other countries, such as the Gulf States.
An average Lebanese seeks to acquire two other languages besides the Arabic to be able to work abroad. S/He will also seek another nationality in addition to her/his Lebanese nationality. Although there is no empirical evidence but based on casual observation and discussions with interviewees it seems that workers’ remittances represent a significant source of income for many households in Lebanon and Al Fayha’.
The population of Lebanon and Al Fayha’ seems to be young, and will require special attention to initiate both economic growth and social development, given the limited natural resources available at the moment. Then, investing in human resources transforming them into human capital is a must.
The growth of Al Fayha’ metropolitan in the coming decade is limited to around one percent per annum. If the current conditions continue into the future, the new developments will take place within and around Al Fayha’. Currently the metropolitan area is divided according to income classes and sectarian groups. It is expected this will continue into the future if no action is taken, and the Business As Usual (BAU) scenario prevails. It means that sectarian frictions will continue confirming the negative economic image of the metropolis.
2.3.2 Dynamics of Economics Al Fayha’ has number of economic development opportunities. First, there are number of projects to expand the port by increasing the depth of the port, adding a new platform and a developing an economic zone. The fact that EIB is financing these initiatives means that a serious, credible feasibility and impact assessments were properly prepared before availing the funds and starting execution. Also, the location of Al Fayha’ and its connection to other parts of Lebanon and the Arab world via road and railway is another opportunity for regaining the glory of the past.
Lacking security, as a result of armed conflicts, and the stigma of conservatism and fundamentalism associated with the metropolis represent a major hurdle towards attracting
42 Interview with Dr. Samira Baghdady, member of the Municipal Council, 24 June 2009.
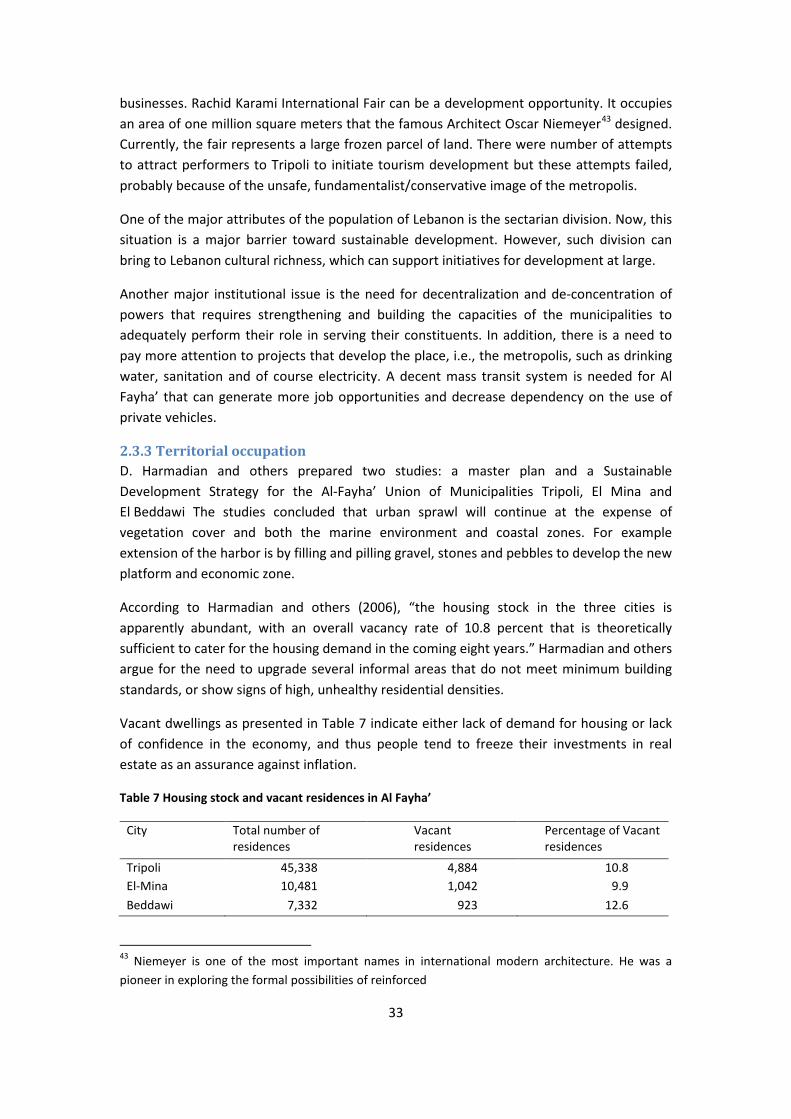
33
businesses. Rachid Karami International Fair can be a development opportunity. It occupies an area of one million square meters that the famous Architect Oscar Niemeyer43
One of the major attributes of the population of Lebanon is the sectarian division. Now, this situation is a major barrier toward sustainable development. However, such division can bring to Lebanon cultural richness, which can support initiatives for development at large.
designed. Currently, the fair represents a large frozen parcel of land. There were number of attempts to attract performers to Tripoli to initiate tourism development but these attempts failed, probably because of the unsafe, fundamentalist/conservative image of the metropolis.
Another major institutional issue is the need for decentralization and de-concentration of powers that requires strengthening and building the capacities of the municipalities to adequately perform their role in serving their constituents. In addition, there is a need to pay more attention to projects that develop the place, i.e., the metropolis, such as drinking water, sanitation and of course electricity. A decent mass transit system is needed for Al Fayha’ that can generate more job opportunities and decrease dependency on the use of private vehicles.
2.3.3 Territorial occupation D. Harmadian and others prepared two studies: a master plan and a Sustainable Development Strategy for the Al-Fayha’ Union of Municipalities Tripoli, El Mina and El Beddawi The studies concluded that urban sprawl will continue at the expense of vegetation cover and both the marine environment and coastal zones. For example extension of the harbor is by filling and pilling gravel, stones and pebbles to develop the new platform and economic zone.
According to Harmadian and others (2006), “the housing stock in the three cities is apparently abundant, with an overall vacancy rate of 10.8 percent that is theoretically sufficient to cater for the housing demand in the coming eight years.” Harmadian and others argue for the need to upgrade several informal areas that do not meet minimum building standards, or show signs of high, unhealthy residential densities.
Vacant dwellings as presented in Table 7 indicate either lack of demand for housing or lack of confidence in the economy, and thus people tend to freeze their investments in real estate as an assurance against inflation.
Table 7 Housing stock and vacant residences in Al Fayha’
City Total number of residences
Vacant residences
Percentage of Vacant residences
Tripoli 45,338 4,884 10.8 El-Mina 10,481 1,042 9.9
Beddawi 7,332 923 12.6
43 Niemeyer is one of the most important names in international modern architecture. He was a pioneer in exploring the formal possibilities of reinforced
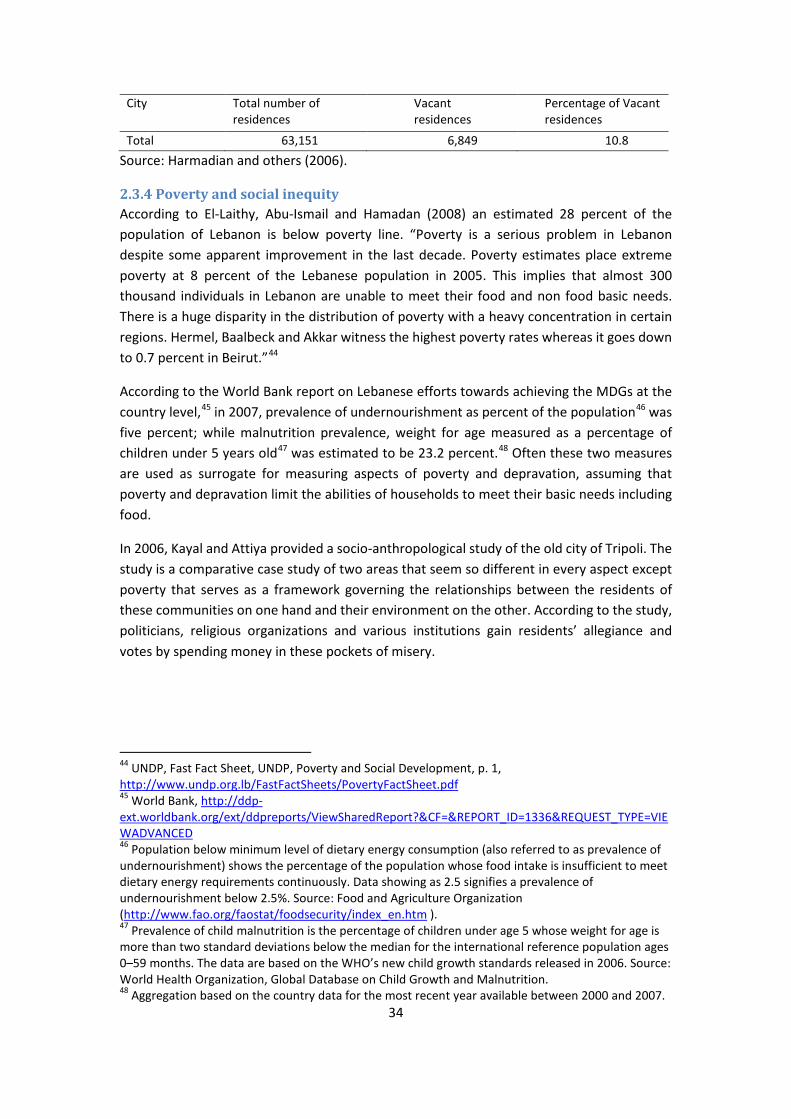
34
City Total number of residences
Vacant residences
Percentage of Vacant residences
Total 63,151 6,849 10.8
Source: Harmadian and others (2006).
2.3.4 Poverty and social inequity According to El-Laithy, Abu-Ismail and Hamadan (2008) an estimated 28 percent of the population of Lebanon is below poverty line. “Poverty is a serious problem in Lebanon despite some apparent improvement in the last decade. Poverty estimates place extreme poverty at 8 percent of the Lebanese population in 2005. This implies that almost 300 thousand individuals in Lebanon are unable to meet their food and non food basic needs. There is a huge disparity in the distribution of poverty with a heavy concentration in certain regions. Hermel, Baalbeck and Akkar witness the highest poverty rates whereas it goes down to 0.7 percent in Beirut.”44
According to the World Bank report on Lebanese efforts towards achieving the MDGs at the country level,
45 in 2007, prevalence of undernourishment as percent of the population46 was five percent; while malnutrition prevalence, weight for age measured as a percentage of children under 5 years old47 was estimated to be 23.2 percent.48
In 2006, Kayal and Attiya provided a socio-anthropological study of the old city of Tripoli. The study is a comparative case study of two areas that seem so different in every aspect except poverty that serves as a framework governing the relationships between the residents of these communities on one hand and their environment on the other. According to the study, politicians, religious organizations and various institutions gain residents’ allegiance and votes by spending money in these pockets of misery.
Often these two measures are used as surrogate for measuring aspects of poverty and depravation, assuming that poverty and depravation limit the abilities of households to meet their basic needs including food.
44 UNDP, Fast Fact Sheet, UNDP, Poverty and Social Development, p. 1, http://www.undp.org.lb/FastFactSheets/PovertyFactSheet.pdf 45 World Bank, http://ddp-ext.worldbank.org/ext/ddpreports/ViewSharedReport?&CF=&REPORT_ID=1336&REQUEST_TYPE=VIEWADVANCED 46 Population below minimum level of dietary energy consumption (also referred to as prevalence of undernourishment) shows the percentage of the population whose food intake is insufficient to meet dietary energy requirements continuously. Data showing as 2.5 signifies a prevalence of undernourishment below 2.5%. Source: Food and Agriculture Organization (http://www.fao.org/faostat/foodsecurity/index_en.htm ). 47 Prevalence of child malnutrition is the percentage of children under age 5 whose weight for age is more than two standard deviations below the median for the international reference population ages 0–59 months. The data are based on the WHO’s new child growth standards released in 2006. Source: World Health Organization, Global Database on Child Growth and Malnutrition. 48 Aggregation based on the country data for the most recent year available between 2000 and 2007.
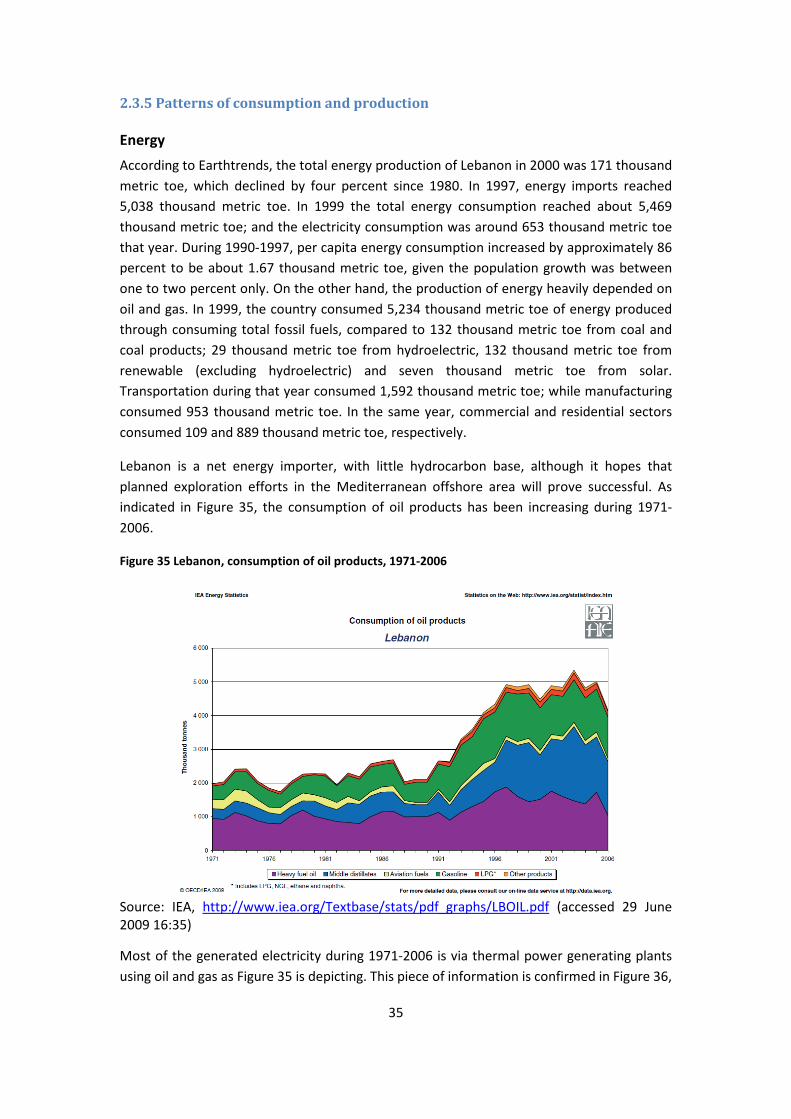
35
2.3.5 Patterns of consumption and production
Energy
According to Earthtrends, the total energy production of Lebanon in 2000 was 171 thousand metric toe, which declined by four percent since 1980. In 1997, energy imports reached 5,038 thousand metric toe. In 1999 the total energy consumption reached about 5,469 thousand metric toe; and the electricity consumption was around 653 thousand metric toe that year. During 1990-1997, per capita energy consumption increased by approximately 86 percent to be about 1.67 thousand metric toe, given the population growth was between one to two percent only. On the other hand, the production of energy heavily depended on oil and gas. In 1999, the country consumed 5,234 thousand metric toe of energy produced through consuming total fossil fuels, compared to 132 thousand metric toe from coal and coal products; 29 thousand metric toe from hydroelectric, 132 thousand metric toe from renewable (excluding hydroelectric) and seven thousand metric toe from solar. Transportation during that year consumed 1,592 thousand metric toe; while manufacturing consumed 953 thousand metric toe. In the same year, commercial and residential sectors consumed 109 and 889 thousand metric toe, respectively.
Lebanon is a net energy importer, with little hydrocarbon base, although it hopes that planned exploration efforts in the Mediterranean offshore area will prove successful. As indicated in Figure 35, the consumption of oil products has been increasing during 1971-2006.
Figure 35 Lebanon, consumption of oil products, 1971-2006
Source: IEA, http://www.iea.org/Textbase/stats/pdf_graphs/LBOIL.pdf (accessed 29 June 2009 16:35)
Most of the generated electricity during 1971-2006 is via thermal power generating plants using oil and gas as Figure 35 is depicting. This piece of information is confirmed in Figure 36,

36
during the same period of time, most of the produced energy in Lebanon is through using oil and gas. Information in Figure 37 shows that oil has the highest share of Total Primary Energy Supply (TPSE) in 2006. The share of oil in TPSE in 2006 reached almost 93 percent. This is a trend that continued since 1971, as exhibited in Figure 38. Without proper precautions, this activity can contribute to degrading the air quality in Lebanese urban areas.
Figure 36 Electricity generation by fuel, 1971-2006
Source: IEA, http://www.iea.org/Textbase/stats/pdf_graphs/LBOIL.pdf (accessed 29 June 2009 16:35)
Figure 37 Lebanon, Energy production, 1971-2006
Source: IEA, http://www.iea.org/Textbase/stats/pdf_graphs/LBOIL.pdf (accessed 29 June 2009 16:35)

37
Figure 38 Share of total primary energy supply in 2006, (%)
Source: IEA, http://www.iea.org/Textbase/stats/pdf_graphs/LBOIL.pdf (accessed 29 June 2009 16:35)
Figure 39 Lebanon, total primary energy supply, 1971-2006
Source: IEA, http://www.iea.org/Textbase/stats/pdf_graphs/LBOIL.pdf (accessed 29 June 2009 16:35)
Reviewing the data available at IEA and presented in Table 8 indicate several serious issues. The column to the left presents key indicators, such as population, income, etc. while the column to the right shows compound indicators, such as TPES per population, TPES per GDP, and so forth. Knowing that the basic economic sectors are productive services, such as tourism, and knowing that the growth has been stagnant, while the consumption of energy is increasing, where transportation, residential and commercial sectors seem to be the major

38
consumers of energy, then Lebanon is consuming energy and producing carbon dioxide for little units of production. In other words, these levels of energy consumption and carbon dioxide production, although modest, but are not the result of expanding, active commodity productive economic sectors, such as manufacturing and agriculture.
Table 8 Selected 2006 Indicators for Lebanon
Key Indicators Compound Indicators Population (million) 4.06 TPES49 1.17 /Population (toe/capita) GDP (billion 2000 US$) 20.50 TPES/GDP (toe/thousand 2000 US$) 0.23 GDP (PPP) (billion 2000 US$) 19.77 TPES/GDP (PPP) (toe/thousand 2000
US$ PPP) 0.24
Energy Production (Mtoe) 0.19 Electricity Consumption / Population (kWh/capita)
2,142.00
Net Imports (Mtoe) 4.58 CO2/TPES (t CO2/toe) 2.80 TPES (Mtoe) 4.76 CO2/Population (t CO2/capita) 3.29 Electricity Consumption* (TWh) 8.68 CO2/GDP (kg CO2/2000US$) 0.65 CO2 Emissions **(Mt of CO2) 13.33 CO2/GDP (PPP) (kg CO2/2000 US$
PPP) 0.65
*Gross production + imports - exports - transmission/distribution losses **CO2 Emissions from fuel combustion only. Emissions are calculated using IEA's energy balances and the Revised 1996 IPCC Guidelines. Source: IEA, http://www.iea.org/textbase/stats/indicators.asp?COUNTRY_CODE=LB
Water
In 2007, the total number of sources in North Lebanon was 64 sources (rivers, springs and wells) securing about 387,478 CM on average cubic each day. The total area of irrigated agricultural land was about 76,315 dounams50. Tap water daily consumption during this year was approximately 193,230 CM.51
According to Gabi Nasr,
52
the Tripoli country suffers from quantitative water problem. He acknowledges some pollution to the groundwater because of olive oil production processes that contaminate groundwater. Currently GTZ is supporting the Lebanese government in preparing a water balance for El Mina. Meanwhile, El-Beddawi is installing a water delivery network with Kuwaiti finance. The average daily consumption of water in Tripoli, according to Eng. Nasr, is around 120 to 150 liters/capita/day depending on the season.
49 Total primary energy domestic supply (sometimes referred to as energy use) is calculated by the International Energy Agency as production of fuels + inputs from other sources + imports - exports - international marine bunkers + stock changes. It includes coal, crude oil, natural gas liquids, refinery feedstocks, additives, petroleum products, gases, combustible renewables and waste, electricity and heat. Domestic supply differs from final consumption in that it does not take account of distribution losses. The supply and use of energy commodities are converted to Kg. oil equivalent using standard coefficients for each energy source. 50 About 1000 sq. m.. 51 Central Administration for Statistics, 2007 Yearbook, Beirut, Lebanon 52 Interview on 25 June 2009

39
Figure 40 Location of wells within Al Fayha’
Source: TEDO 2007
Wastewater
Currently, Al Fayha’ does not have an integrated system for wastewater management. During the season of olive oil production in the rural areas beyond the administrative boundaries of the municipalities of Al Fayha’, suspended matter and greasy effluents contaminate the groundwater. Casual observations confirm pollution of groundwater due, in part, to lacking an integrated system for wastewater collection and treatment. Rural areas around Al Fayha’ lack proper collection and treatment of domestic liquid wastes. Septic tanks are seldom evacuated.

40
Figure 41 Tunnel for collecting wastewater under construction
Al Fahya’ is developing a network for wastewater collection. The tunnel for collecting these wastewaters, Figure 41, is under construction, but faces a number of challenges that are delaying progress, but eventually will be completed soon. Today Al Fayha’ is having a modern wastewater treatment plant, Figure 42, which should be operational once the network for collecting the wastewater is completed. The mean daily flow of the wastewater treatment plant is 135 km3/j and its maximum hourly flow
is 9,263 m3/j to serve one million inhabitants. Its estimated cost is € 77.5 million split into € 44.5 for design and equipment, € 28 million for civil works and installation, and five million Euros for provisional sums. It provides biological treatment and removing sludge via gravity. The digesters, which operate on six engines, three of them operate on fuel and another three operate on biogas collected from the sludge itself. These engines require 1.3 megawatt, where the biogas provides 50 percent of the needed energy to operate the digesters. The wastewater treatment plant includes also precautions for controlling emissions that might degrade air quality. The treated effluent is then released into the Mediterranean.
Solid wastes
The landfill of Al Fayha’ is at the estuary of Abu Ali River at the Mediterranean nest to the wastewater treatment plant, Figure 42. The area of the landfill is about 60 thousand square meters. The landfill cannot be considered a sanitary landfill since the location was not properly planned or constructed to receive municipal solid wastes because its bottom is not properly insulated to protect groundwater and lacks a system to collect the effluents and control emissions. A private company runs and manages the landfill on the behalf of the three municipalities, and there are certain measures applied to control the landfill.
Two decades ago, the landfill was just a mere dumpsite that caused number of nuisance and number of hazards because of uncontrolled emissions of harmful gases and spontaneous fires. In 1999 Al Fahya’ municipalities decided to implement a project to improve the conditions of that landfill by constructing a ditch surrounding the landfill to collect the leachate, installing a system for controlling emitted gases, and developing a fence around the landfill for more volume. BATCO, the private company, measures the emitted gases and manages the leachate. BATCO burns the emitted gas based on the amount of emitted methane.
Photo by Eng. Joseph El Aam
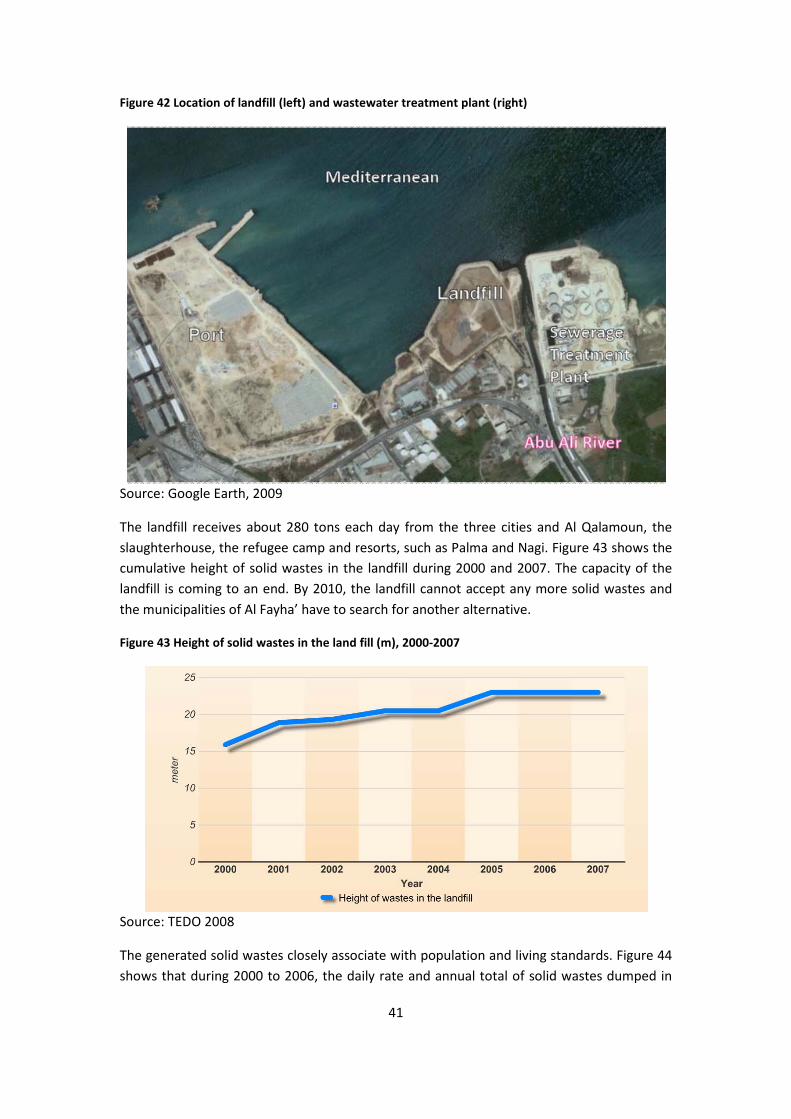
41
Figure 42 Location of landfill (left) and wastewater treatment plant (right)
Source: Google Earth, 2009
The landfill receives about 280 tons each day from the three cities and Al Qalamoun, the slaughterhouse, the refugee camp and resorts, such as Palma and Nagi. Figure 43 shows the cumulative height of solid wastes in the landfill during 2000 and 2007. The capacity of the landfill is coming to an end. By 2010, the landfill cannot accept any more solid wastes and the municipalities of Al Fayha’ have to search for another alternative.
Figure 43 Height of solid wastes in the land fill (m), 2000-2007
Source: TEDO 2008
The generated solid wastes closely associate with population and living standards. Figure 44 shows that during 2000 to 2006, the daily rate and annual total of solid wastes dumped in

42
the landfill have been increasing. The graph shows incomplete series of data in the annual total, particularly in the years of 2003 and 2006. In 2003, the subcontractor running the landfill was substituted with BATCO in 2004, and thus the information was not properly conveyed to TEDO. In 2006, Israeli aggressively attacked southern Lebanon, and many displaced population moved towards the north, particularly Al Fayha’. It is worth noticing that in the interviews, the subject of informal scavengers was indicated and raised, and that these estimates are based on the amount of solid wastes dumped in the landfill not generated solid wastes.
Figure 44 Amount of wastes dumped in the landfill (kg), 2000-2006
Note: There are no data during February 2003 because the contract with Liban Consult was terminated, and Dar al Handasah was awarded a new contract; and there are no data for July 2006 because of Israeli aggression, which will affect the annual total amount of solid waste disposed at the dump site. Source: TEDO (2009) based on monthly reports prepared by Liban Consult and Dar al Handasah Nazih Taleb and Partners
According to sources of information available to TEDO, assuming that all generated solid wastes are collected and transferred to the landfill, then the average daily rate of generating municipal solid waste would be around 0.8 kg per capita, Table 9. This average is suitable for an economically depressed metropolis.
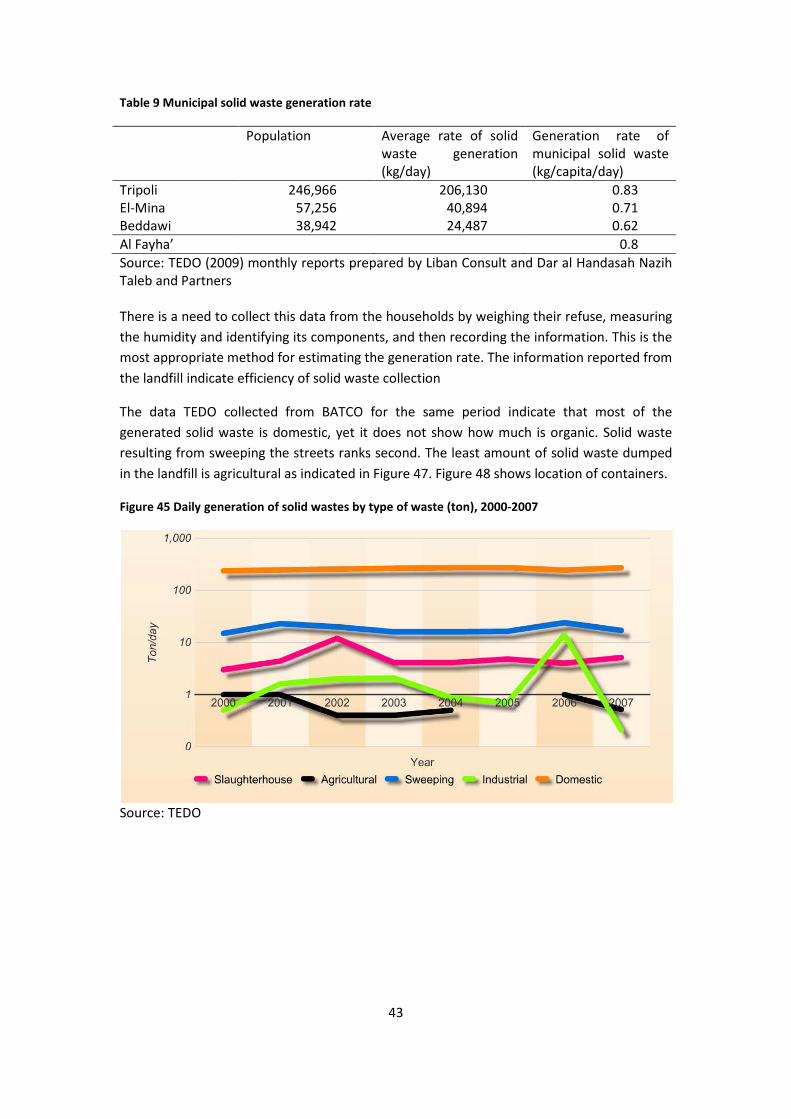
43
Table 9 Municipal solid waste generation rate
Population Average rate of solid waste generation (kg/day)
Generation rate of municipal solid waste (kg/capita/day)
Tripoli 246,966 206,130 0.83 El-Mina 57,256 40,894 0.71 Beddawi 38,942 24,487 0.62 Al Fayha’ 0.8 Source: TEDO (2009) monthly reports prepared by Liban Consult and Dar al Handasah Nazih Taleb and Partners There is a need to collect this data from the households by weighing their refuse, measuring the humidity and identifying its components, and then recording the information. This is the most appropriate method for estimating the generation rate. The information reported from the landfill indicate efficiency of solid waste collection
The data TEDO collected from BATCO for the same period indicate that most of the generated solid waste is domestic, yet it does not show how much is organic. Solid waste resulting from sweeping the streets ranks second. The least amount of solid waste dumped in the landfill is agricultural as indicated in Figure 47. Figure 48 shows location of containers.
Figure 45 Daily generation of solid wastes by type of waste (ton), 2000-2007
Source: TEDO
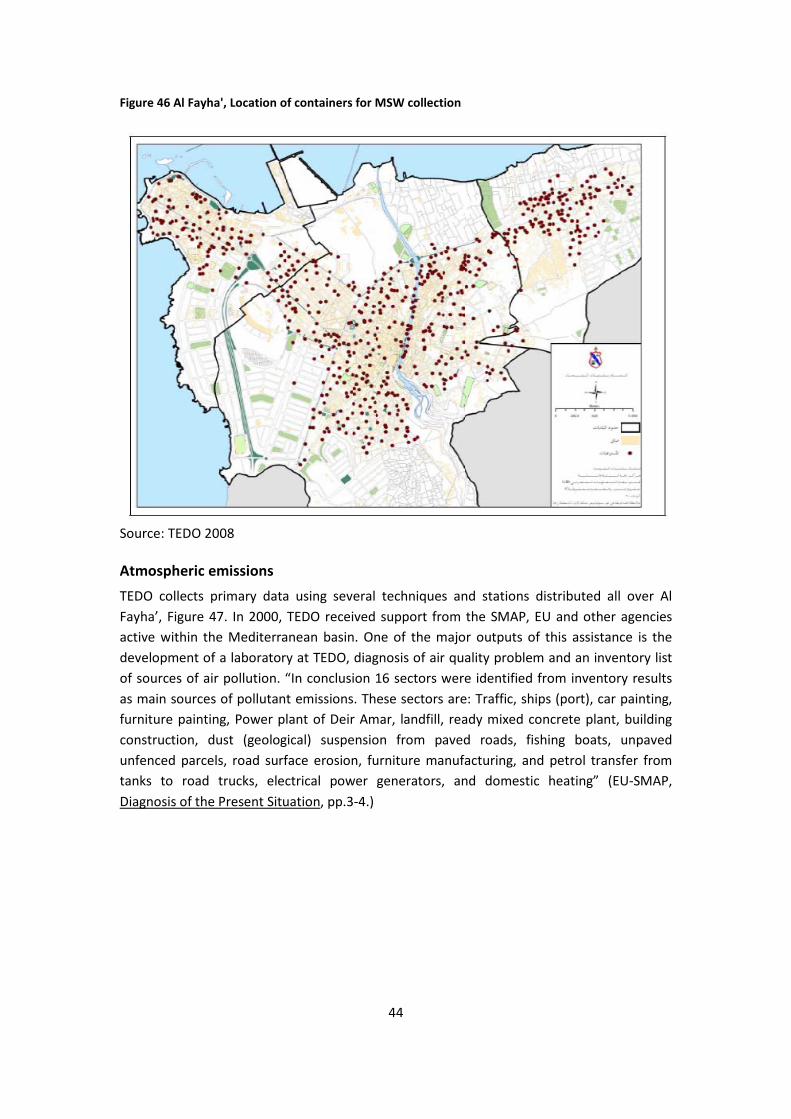
44
Figure 46 Al Fayha', Location of containers for MSW collection
Source: TEDO 2008
Atmospheric emissions
TEDO collects primary data using several techniques and stations distributed all over Al Fayha’, Figure 47. In 2000, TEDO received support from the SMAP, EU and other agencies active within the Mediterranean basin. One of the major outputs of this assistance is the development of a laboratory at TEDO, diagnosis of air quality problem and an inventory list of sources of air pollution. “In conclusion 16 sectors were identified from inventory results as main sources of pollutant emissions. These sectors are: Traffic, ships (port), car painting, furniture painting, Power plant of Deir Amar, landfill, ready mixed concrete plant, building construction, dust (geological) suspension from paved roads, fishing boats, unpaved unfenced parcels, road surface erosion, furniture manufacturing, and petrol transfer from tanks to road trucks, electrical power generators, and domestic heating” (EU-SMAP, Diagnosis of the Present Situation
, pp.3-4.)
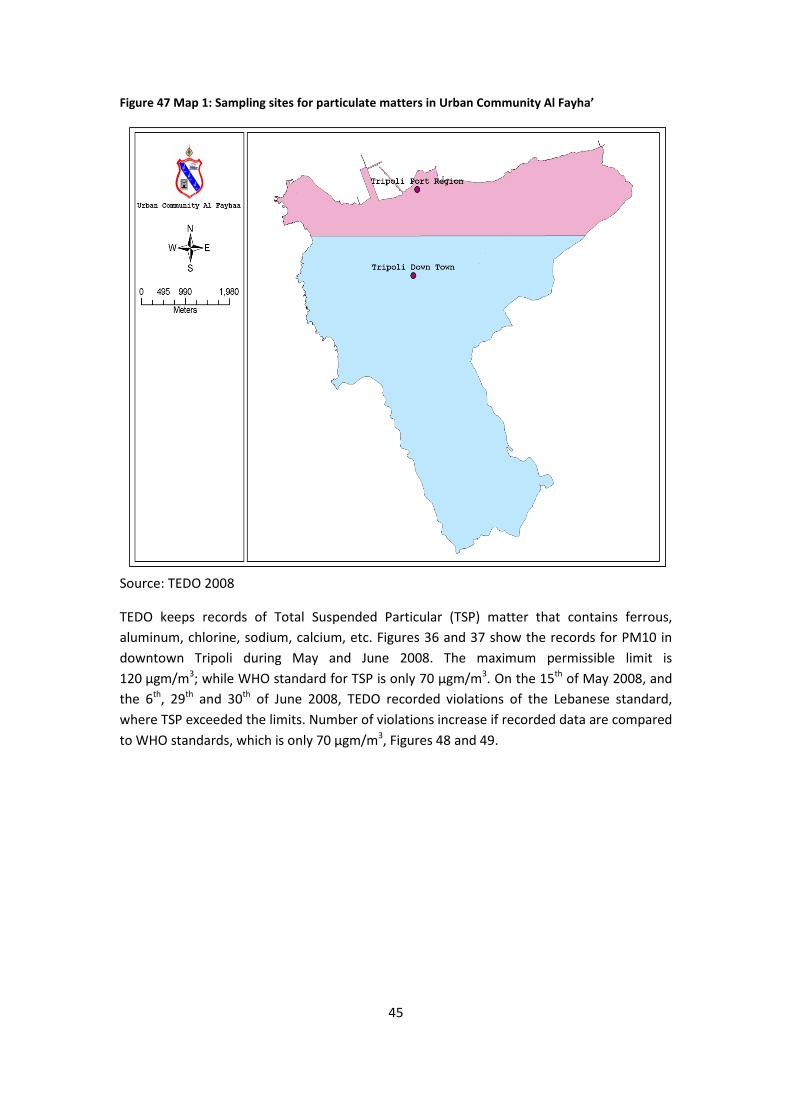
45
Figure 47 Map 1: Sampling sites for particulate matters in Urban Community Al Fayha’
Source: TEDO 2008
TEDO keeps records of Total Suspended Particular (TSP) matter that contains ferrous, aluminum, chlorine, sodium, calcium, etc. Figures 36 and 37 show the records for PM10 in downtown Tripoli during May and June 2008. The maximum permissible limit is 120 µgm/m3; while WHO standard for TSP is only 70 µgm/m3. On the 15th of May 2008, and the 6th, 29th and 30th of June 2008, TEDO recorded violations of the Lebanese standard, where TSP exceeded the limits. Number of violations increase if recorded data are compared to WHO standards, which is only 70 µgm/m3, Figures 48 and 49.
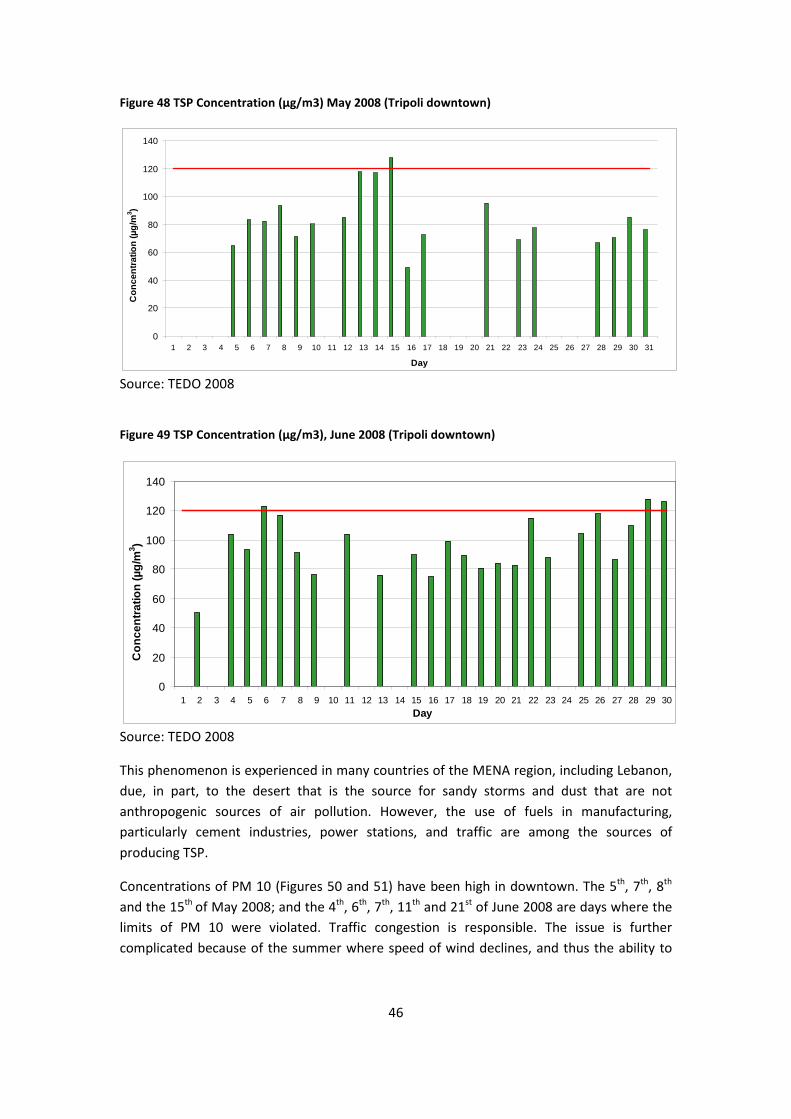
46
Figure 48 TSP Concentration (µg/m3) May 2008 (Tripoli downtown)
Source: TEDO 2008
Figure 49 TSP Concentration (µg/m3), June 2008 (Tripoli downtown)
Source: TEDO 2008
This phenomenon is experienced in many countries of the MENA region, including Lebanon, due, in part, to the desert that is the source for sandy storms and dust that are not anthropogenic sources of air pollution. However, the use of fuels in manufacturing, particularly cement industries, power stations, and traffic are among the sources of producing TSP.
Concentrations of PM 10 (Figures 50 and 51) have been high in downtown. The 5th, 7th, 8th and the 15th of May 2008; and the 4th, 6th, 7th, 11th and 21st of June 2008 are days where the limits of PM 10 were violated. Traffic congestion is responsible. The issue is further complicated because of the summer where speed of wind declines, and thus the ability to
0
20
40
60
80
100
120
140
1 2 3 4 5 6 7 8 9 10 11 12 13 14 15 16 17 18 19 20 21 22 23 24 25 26 27 28 29 30 31
Day
Con
cent
ratio
n (µ
g/m
3 )
0
20
40
60
80
100
120
140
1 2 3 4 5 6 7 8 9 10 11 12 13 14 15 16 17 18 19 20 21 22 23 24 25 26 27 28 29 30Day
Con
cent
ratio
n (µ
g/m
3 )
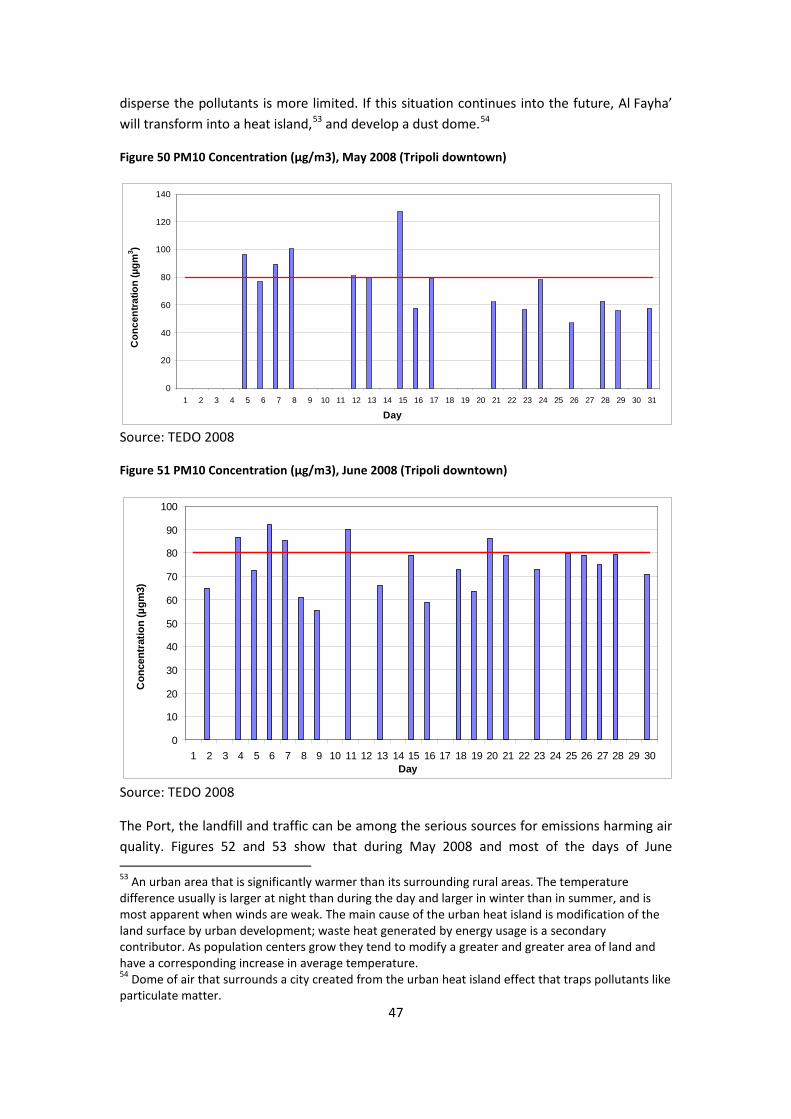
47
disperse the pollutants is more limited. If this situation continues into the future, Al Fayha’ will transform into a heat island,53 and develop a dust dome.54
Figure 50 PM10 Concentration (µg/m3), May 2008 (Tripoli downtown)
Source: TEDO 2008
Figure 51 PM10 Concentration (µg/m3), June 2008 (Tripoli downtown)
Source: TEDO 2008
The Port, the landfill and traffic can be among the serious sources for emissions harming air quality. Figures 52 and 53 show that during May 2008 and most of the days of June 53 An urban area that is significantly warmer than its surrounding rural areas. The temperature difference usually is larger at night than during the day and larger in winter than in summer, and is most apparent when winds are weak. The main cause of the urban heat island is modification of the land surface by urban development; waste heat generated by energy usage is a secondary contributor. As population centers grow they tend to modify a greater and greater area of land and have a corresponding increase in average temperature. 54 Dome of air that surrounds a city created from the urban heat island effect that traps pollutants like particulate matter.
0
20
40
60
80
100
120
140
1 2 3 4 5 6 7 8 9 10 11 12 13 14 15 16 17 18 19 20 21 22 23 24 25 26 27 28 29 30 31
Day
Con
cent
ratio
n (µ
gm3 )
0
10
20
30
40
50
60
70
80
90
100
1 2 3 4 5 6 7 8 9 10 11 12 13 14 15 16 17 18 19 20 21 22 23 24 25 26 27 28 29 30Day
Con
cent
ratio
n (µ
gm3)
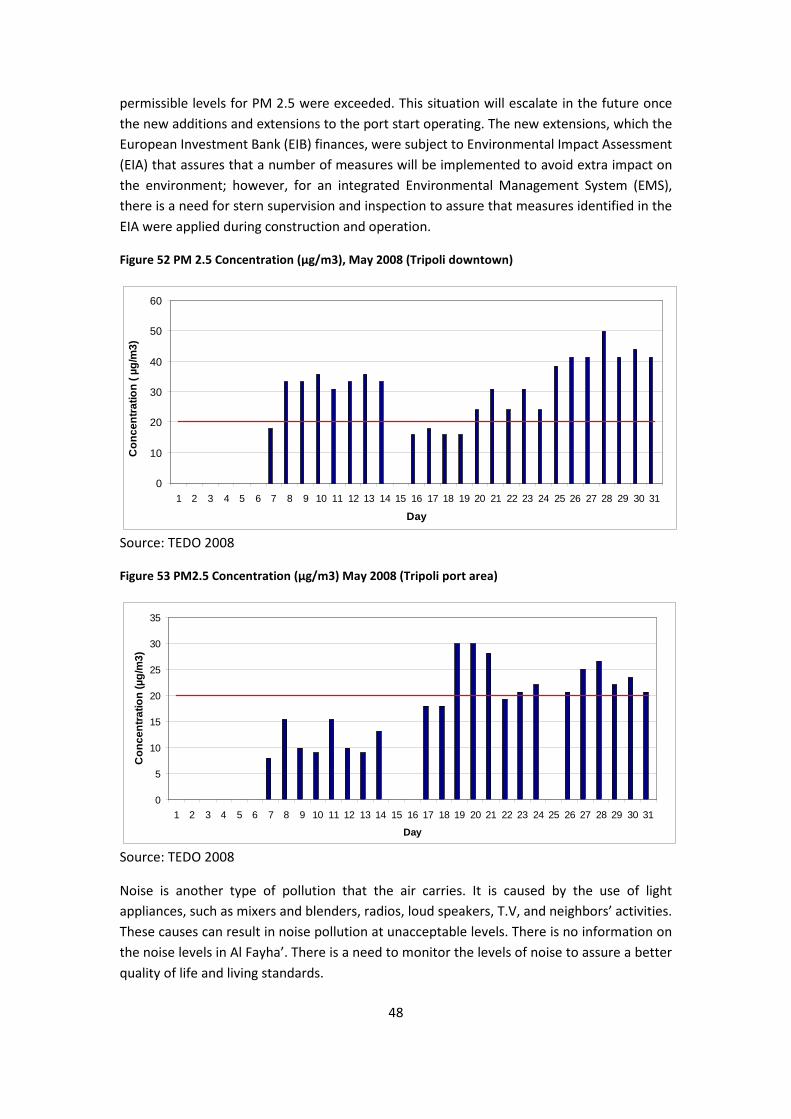
48
permissible levels for PM 2.5 were exceeded. This situation will escalate in the future once the new additions and extensions to the port start operating. The new extensions, which the European Investment Bank (EIB) finances, were subject to Environmental Impact Assessment (EIA) that assures that a number of measures will be implemented to avoid extra impact on the environment; however, for an integrated Environmental Management System (EMS), there is a need for stern supervision and inspection to assure that measures identified in the EIA were applied during construction and operation.
Figure 52 PM 2.5 Concentration (µg/m3), May 2008 (Tripoli downtown)
Source: TEDO 2008
Figure 53 PM2.5 Concentration (µg/m3) May 2008 (Tripoli port area)
Source: TEDO 2008
Noise is another type of pollution that the air carries. It is caused by the use of light appliances, such as mixers and blenders, radios, loud speakers, T.V, and neighbors’ activities. These causes can result in noise pollution at unacceptable levels. There is no information on the noise levels in Al Fayha’. There is a need to monitor the levels of noise to assure a better quality of life and living standards.
0
10
20
30
40
50
60
1 2 3 4 5 6 7 8 9 10 11 12 13 14 15 16 17 18 19 20 21 22 23 24 25 26 27 28 29 30 31
Day
Con
cent
ratio
n ( µ
g/m
3)
0
5
10
15
20
25
30
35
1 2 3 4 5 6 7 8 9 10 11 12 13 14 15 16 17 18 19 20 21 22 23 24 25 26 27 28 29 30 31
Day
Con
cent
ratio
n (µ
g/m
3)

49
TEDO is doing a good job in monitoring atmospheric pollution. However, TEDO needs to expand monitoring other parameters of air quality. There is a need to monitor CO, CO2, SOx, NOx, VOCs, ground-level ozone, etc. for a full picture on the quality of air Furthermore, TEDO needs to install more stations in the city and outside it for measuring the quality of ambient (background) levels of air pollution. TEDO also needs at least one mobile station to move it around to record parameters of air quality, particularly that Al Fayha’ is prone to experience severe air pollution episodes. The is sun shine and humidity and industries, port and traffic congestions thus the scene is ready for Smoke and Fog (SMOG) episodes, and the need for better monitoring air quality will prevail. Severe air pollution episodes are risks that can lead to serious disasters. SMOG episodes were responsible of the death of more than one thousand persons in London the early 1950s.55
55 London, England was the site of dense smog caused by heavy coal combustion during the winter of 1952, which killed approximately 12,000 people (Source: The Encyclopedia of Earth, http://www.eoearth.org/article/London_smog_disaster,_England ).

50
Chapter 3 State of the Environment
3.1. Local ecosystems The limits of the ecosystems of Al Fayha’ are beyond the administrative boundaries of the three municipalities. The first ecosystem, which is fragile and its ability to regenerate itself is extremely limited, is the marine environment and coastal areas. There are three islands, including Palm Island, declared as protectorates. These islands where subject of pollution resulting from oil spill in the summer of 2006. The coastal zone of Al Fayha’ is of limited capacity to regenerate itself. This area is subject to several pressures including the port and its new extensions and the new economic zone; tourism developments, discharge of untreated wastes both in liquid and solid states. The marine environment and coastal areas provide the fishing community essential services that support the livelihoods of fishermen. Al Fahya’ imports fish from Egypt and Turkey.
The second local ecosystem that is important for the sustainable development of Al Fayha’ is land, which is limited. The future urban sprawl will take place on the hinterland, while many parcels are vacant or unused within the metropolis. According to many interviewees, the nickname of Al Fayha’, i.e., Fragrance in English, was given to the metropolis because of vast areas cultivated with lime, lemon and other citrus trees. Today, most of these trees do not exist. The metropolis has a master plan since 2002, and currently has embarked on elaborating a City Development Strategy (CDS), to address the issues related to land. It is of utmost importance to increase the per capita share of green and open areas within the metropolis. Similarly, it is important to consider means of developing rural areas and agricultural land to minimize rural-urban migration. Another two important local ecosystems around Al Fayha’ closely related to land are the forests and mountains. They are opportunities for tourism development, and provide services to the global environment. It is important in the CDS to pay attention to the geological issues raised earlier in section 1.2.3 such as soil erosion, deforestation and pollution of aquifers.
In any form whether springs, rivers, or groundwater, fresh water resources are among the important ecological assets for the development of Al Fayha’. Fresh water resources within and around Al Fayha’ are subject to all sources of pollution. Untreated domestic liquid and solid wastes affect the quality of groundwater. Air pollution returns to the soil and both surface and groundwater.
North Lebanon is rich with biodiversity in terms of flora and fauna. The location, geology, topography, climate and soil are among the reasons for a rich biodiversity. Furthermore, Lebanon is on the route of many migratory birds.
3.2. Analysis of ecosystem resources
3.2.1 Air Prior assistance has put together an inventory list of sources of air pollution. This is a step into the right direction. However, many measures need attention to curb emissions released to the atmosphere. One of these measures is proper land use and management to control
51
traffic congestion, and major sources of emissions, such as landfill, the electricity power generating plant, and so forth.
There is a need for constant measure of background air quality plus the two monitoring stations at the port and downtown. There is also a need for mobile station to record measures in areas that experience episodes of severe air pollution.
Finally, there is a need to collect information on indoor air quality. Indoor air quality is important because people spend at least 40-50 percent of their time inside buildings. Young children and housewives spend more than 80 percent of their time homes Indoor pollution comes from smoking, fuel use, particularly kitchen and bathroom heaters in poorly ventilated houses, excessive use of domestic insecticides, and static sources, such as building materials including paints. The emissions resulting from industrial production processes that have concentrations exceeding the Threshold Limit Values (TLV) limits are source of air pollution inside the work environment. The inefficient use of air-pollution control equipment increases the pollution rates inside the work environment, and consequently, affects the health of the labor inside the place.
3.2.2 Water Integrated management of water resources is a major critical issue to be addressed in combating water stress in developing countries, such as Lebanon. At present, surface water is not properly used in Lebanon. This emphasizes the importance of assessing surface water quality as a projected means to increase water availability. Korfali and Jurdi, (2003) examined two different water bodies. The results of their study revealed significant differences in water quality. The differences could be attributed to the fact that one of them is receiving domestic waste discharges that lead to an increase in the CO2 content and a pH decrease, the other river is influenced by agricultural runoffs and industrial discharges that increase the pH values. Consequently, the water metal speciation of the two water bodies was different. The study indicated that the differential quality of the two water bodies could be attributed to the nature of the water resources and exposure to contaminants. This is crucial in recommending intervention studies to protect quality and promote the role of surface water use, as an integrated component of water management in Lebanon. 56
El-Hoz (undated) argued that water supply and sanitation sector has been experiencing remarkable progress; however, current water delivery systems do not meet the national demand. Tripoli, she warns, will face problems in the future due, in part, to increasing demand resulting from population growth, improved living standards and lack of integrated schemes for wastewater management. The results of her research indicate that industrial, agricultural and domestic wastewaters affect the quality of Tripoli water. “There is no well-developed sewage network, nor wastewater control, nor proper solid waste collection and/or disposal in upstream areas. The major problem is the seepage of pollutants,
56 Korfali, Samira Ibrahim and Jurdi, Mey, “Differential water quality in confined and free-flowing water bodies, Lebanon,” International Journal of Environment and Pollution, Volume 19, Number 3/2003: 271 - 291 http://inderscience.metapress.com/app/home/contribution.asp?referrer=parent&backto=issue,5,7;journal,51,83;linkingpublicationresults,1:110851,1

52
leachates and chemicals into the groundwater affecting its quality. It is difficult to accurately estimate the pollution loads into water bodies since data on effluent generation from industries are poorly monitored, and there is insufficient data on effluent routes, i.e., direct discharge on land or into nearby water courses and the Mediterranean” (El-Hoz, undated, p. 7-8).
Figure 54 The banks of Abu Ali River
Source: TEDO 2008
The available data that TEDO and the Water Authority in Tripoli provided is not sufficient for deciding on the quality of fresh water resources. The tests are not complete. They do include measurements of Total Organic Carbon (TOC), which is a major indicator for water pollution. The measures applied to produce drinking water falls short of treating organic contamination. The concentration of calcium and magnesium seem to be higher than normal as indicated in the Total Dissolved Salts (TDS) because of the nature of the mountains and soil of the environ of Al Fayha'. An estimated 37 percent of the samples on 30 April 2009 were in accordance with the specifications, particularly Sankari (1050 mg/l), where the limit is only 500 mg/l. In that area the CaCo3-Dureté was 320 mg/l and the Dureté (totale Cacique) was 500 mg/l, which means that calcium is responsible for the high concentration of TDS. Lime-soda process can be considered to decrease the concentration of these salts to the standard specifications.
3.2.3 Land Population and economic growth exert excessive pressures on land within and around Al Fayha’. The master plan developed in 2002 requires close monitoring and evaluation to assure that proposed sites are prepared to host economic and social activities for efficient and equitable metropolis, and over and above, to assure the environment sustainability. The fact that Lebanon has a special geology that affects history of the nation calls for special attention to avoid developing parcels of land that are nearby a geological hazard, such as faults.
The limited opportunities for agricultural development and lack of minerals limit opportunities for economic development to productive services, such as tourism and transportation, including the port, which will require the development of transportation facilities and roads that can negatively affect the environment. The extensions of the harbor and the development of the new economic zone, if precautions mentioned in the EIA are not

53
taken seriously, can lead to serious impacts. The environmental problems associated with marine and inland water transport emerge from land-based sources of pollution, such as industrial activities, or water-based sources of pollution, such as oil spills. The construction of ports and other berthing facilities have impact on the quality of water, and usually are the site of solid waste disposal. Unfortunately, if the planned expansions are not implemented abiding with environmental standards, the problems that associate with transport will intensify. There are plans for using railway road as an inexpensive transportation alternative. The negative impact of rail transport is noise and vibration around terminals and along railway lines. Abandoned lines, equipment and rolling stock are potentially major solid waste problems and an eye soar causing visual blight in human settlements. Close to urban settlements, railways can divide human settlements disrupting neighborhoods, local communication and commerce. Railway infrastructure can also have similar effects on wildlife, disturbing natural habitats and disrupting overland migration. Finally, road transport is one of the major sources of air pollution, especially, with respect to particulates, volatile organic compounds, nitrogen oxides and carbon monoxide. These air pollutants end up polluting both surface and ground water and soil as well. Death and injuries resulting from road accidents are major risks that associate with road transport.
3.2.4 Biodiversity The discussion in this subsection will concentrate on Palm Island as the most significant protectorate within the administrative limits of Al Fayha’. The Palm Islands Nature Reserve comprises a group of three flat, rocky islands of eroded limestone pavement, 5.5 km offshore and northwest of Tripoli, with the surrounding seas: Sanani (4 ha), Ramkine (1.6 ha) and Palm Island (20 ha). The three islands together with 500 m of their surrounding sea have been legally protected as Palm Islands Nature Reserve, which was established in 1992. From a terrestrial perspective, the Reserve has been designated a Specially Protected Area of the Mediterranean under the Barcelona Convention, an Important Bird Area by BirdLife International, as well as Wetland of Special International Importance.57 The name "Araneb" (rabbits) comes from the great numbers of rabbits that lived on the island during the time of the French mandate early 1900s. It is now a nature reserve for green turtles, rare birds and rabbits. This marine ecosystem is one of the few remaining breeding grounds for the endangered Loggerhead Turtle. The islands are also a resting place for 156 species of migratory birds. In Lebanon, these islands are the only place that has nesting sea birds. They are rich in beach flora and medicinal plants, and their coastal water shave an abundance of fish, sea sponges and other sea life. Parts of the reserve are open for swimming and snorkeling during the summer months, while the rest of the year the islands remain a quiet place for wildlife.58
During the July/August 2006 war, the Israelis attacked the oil depots at the Jiyyeh power plant leading to discharge of nearly 15 thousand tonnes of fuel oil into the sea severely
57 IUCN http://www.iucn.org/about/union/secretariat/offices/iucnmed/iucn_med_programme/marine_programme/marine_protected_areas/site_based_work/lebanon___palm_island/ 58 Lebanon Hotels, http://www.lebanon-hotels.com/tourism/PALMISLAND/

54
polluting the marine environment in many locations along the coast. Amongst the affected areas is Palm Island Nature Reserve (PINR) threatening its rich biodiversity. 59
Several threatened species are found in Palm Island Nature Reserve and may be susceptible to the oil. The critically endangered seal Monachus monachus was a regular visitor until the late 1960s. In 1997 and 2000 some individuals were recorded again. The plant species Euphorbia pithyusa and Cressa cretica are nationally endangered. Benthos fauna includes two nationally threatened gastropod species: Vermetus triquetrus and Dendropoma petraeum. There are two globally endangered fish species, namely Epinephelus marginatus and Mycteroperca rubra.
The Reserve Area Management Team confirmed that marine turtles (Chelonia mydas and Caretta caretta) have often been observed in the sea, and that loggerhead nesting has occurred. Recently, IUCN in collaboration with American University in Beirut and Ministry for Environment of Lebanon lunched a study to assess the effect of the oil spill on the marine biodiversity on Palm Islands Nature Reserve and to develop a monitoring program of the different marine habitats and species of the cost of Lebanon. The Spanish Agency for International Cooperation financed the project.60
59 IUCN http://www.iucn.org/about/union/secretariat/offices/iucnmed/iucn_med_programme/marine_programme/marine_protected_areas/site_based_work/lebanon___palm_island/ 60 Ibid.
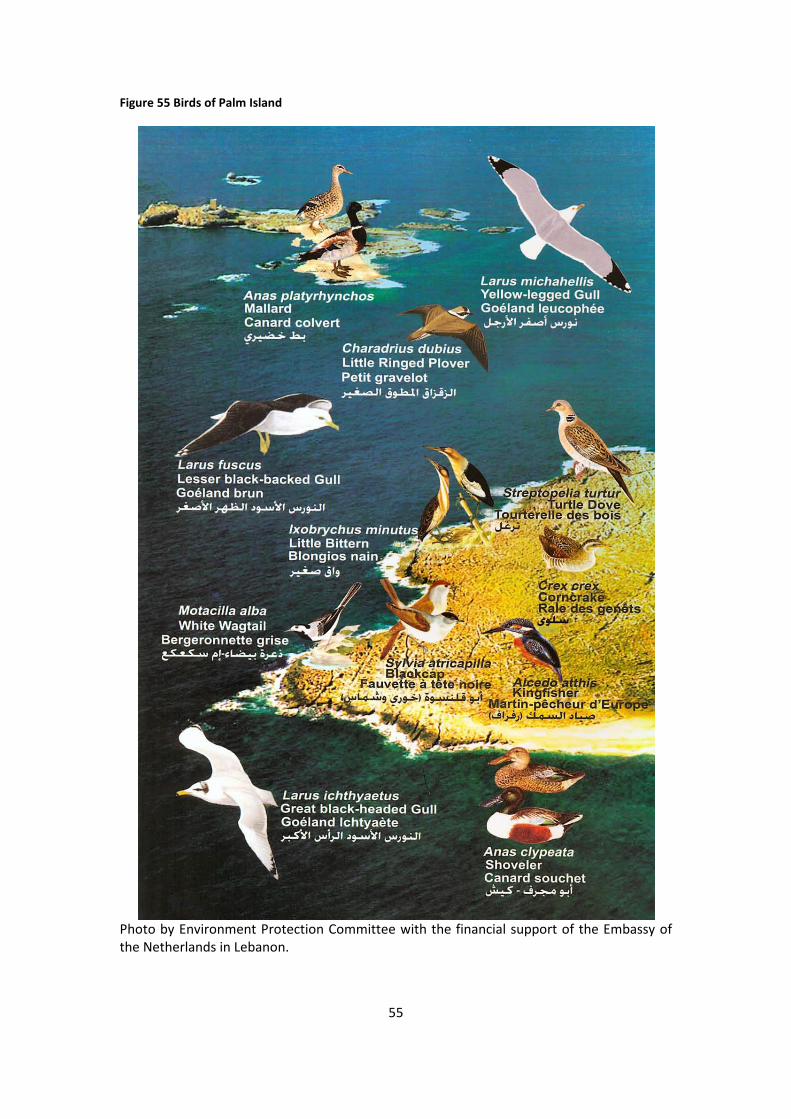
55
Figure 55 Birds of Palm Island
Photo by Environment Protection Committee with the financial support of the Embassy of the Netherlands in Lebanon.

56
Figure 56 Other birds of Palm Island
Photo by Environment Protection Committee with the financial support of the Embassy of the Netherlands in Lebanon.

57
Figure 57 Plants at Palm Island
Photo by Environment Protection Committee with the financial support of the Embassy of the Netherlands in Lebanon.

58
Figure 58 Other plants at Palm Island
Photo by Environment Protection Committee with the financial support of the Embassy of the Netherlands in Lebanon.
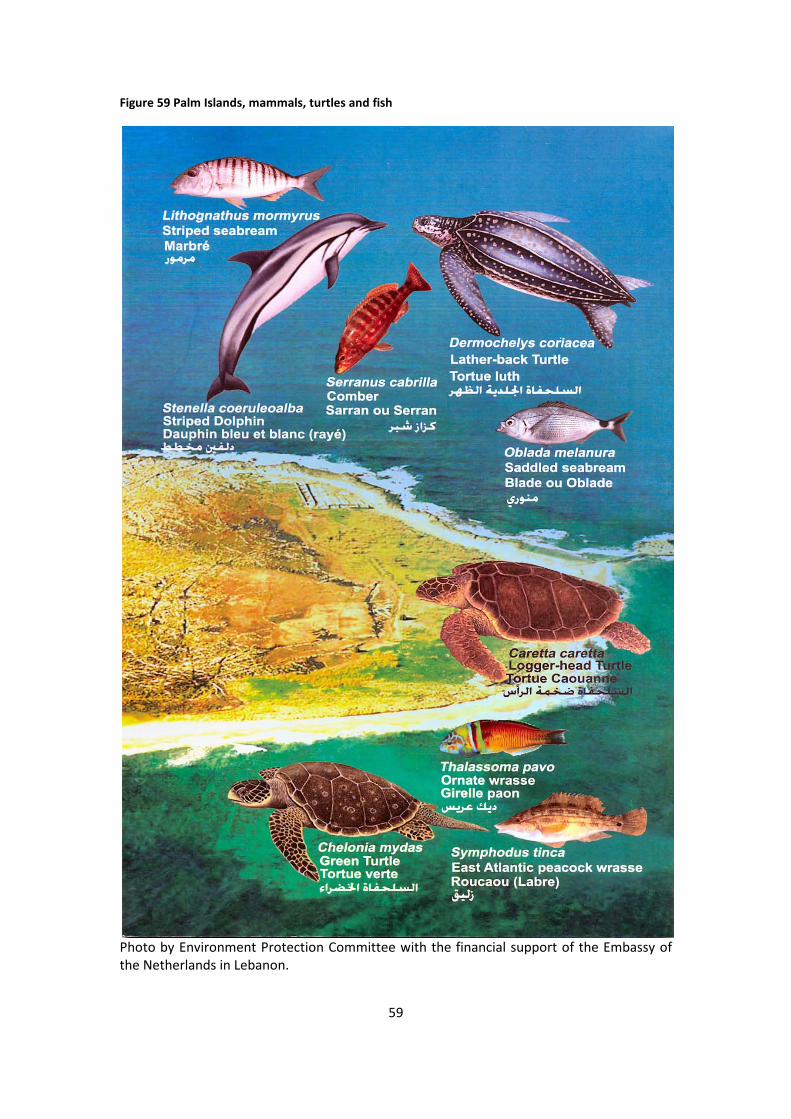
59
Figure 59 Palm Islands, mammals, turtles and fish
Photo by Environment Protection Committee with the financial support of the Embassy of the Netherlands in Lebanon.

60
Figure 60 Palm Islands, other mammals and fish
Photo by Environment Protection Committee with the financial support of the Embassy of the Netherlands in Lebanon.

61
3.2.7 Marine Environment and Coastal Zone Management The marine environment and adjacent coastal areas form an integrated ecosystem that provides local economies with amble development opportunities. They are positive assets that present chances for sustainable development. International law sets forth rights and obligations of UN member countries, including Lebanon, and provides the international basis upon which to pursue protecting and sustaining the development of the marine and coastal environment and its resources.61
The marine environment and coastal zones of Al Fayha’ are under severe development pressures. There are number of endangered marine animals that can be spotted at the Palm Island vicinity. For example, Green turtles and logger-head turtle are among the threatened species. Monk sea and stripped dolphins suffer also, particularly after the oil spill that resulted in the summer of 2006.
3.2.8 Mountains Mountains are an important source of water, energy and biological diversity. Furthermore, they are a source of such key resources as minerals, forest products and agricultural products and of recreation. Mountain environments are essential to the survival of the global ecosystem. Mountain ecosystems are susceptible to accelerated soil erosion, landslides and rapid loss of habitat and genetic diversity. Most of the mountain inhabitants are poor thus are experiencing environmental degradation.62
The chief natural resource is water. The mountains give a high rainfall (widely over a meter a year in Mount Lebanon), and the porous fractured limestone makes an excellent aquifer which are refilled over spring and early summer by the slow melting of snow. The resulting abundant springs and rivers, unique to the Arab world, gave the country its once abundant forests and legendary fertility. However due to the steep slopes and the stony, shallow soils this fertility has proved hard to harness for agriculture and the removal of the forests has tended to produce only short-lived farming land.
63
Under Law No.121 on March 9, 1992, the Horsh Ehden Nature Reserve was established. The Horsh Ehden Nature Reserve Committee under the supervision of the Ministry of Environment manages the reserve, 26 km away from the city of Zgharta. Located on the northwestern slopes of Mount Lebanon and blessed with mist and relatively high precipitation, a multitude of rare and endemic plants flourishes in that reserve. A mixed forest of juniper, fir, and the country's last protected community of wild apple trees surround the cedars. It is the habitat of endangered Imperial Eagle or Bonelli’s Eagle, wolves
61 Agenda 21, Section II, Chapter 17, Protection of the Oceans, all Kinds of Seas, Including Enclosed & Semi-enclosed Seas, & Coastal Areas & the Protection, Rational Use & Development of their Living Resources, http://www.un.org/esa/dsd/agenda21/res_agenda21_17.shtml (accessed on 29 June 2009, 19:06) 62 Agenda 21, Section II, Chapter 13, Managing Fragile Ecosystems: Sustainable Mountain Development, http://www.un.org/esa/dsd/agenda21/res_agenda21_13.shtml (accessed on 29 June 2009, 19:06) 63 Walley, C. D. The Geology of Lebanon: A Summary, The American University of Beirut http://ddc.aub.edu.lb/projects/geology/geology-of-lebanon/

62
and wildcats. The reserve is rich with aesthetic sceneries, such as valleys and wild orchids, brightly colored salamanders, mushrooms, and other flora and fauna.64
Figure 61 Ehden forrests
It represents an opportunity for ecotourism activities that can have positive impact on the local economies of both the Governorate and that of Al Fayha’.
Photo by Zeina Haddad, 2008.
3.2.9 Forests Increasing human needs pressure toward uncontrolled degradation and conversion of forests. The present situation calls for urgent and consistent action for conserving and sustaining forest resources. The greening of suitable areas, in all its component activities, is an effective way of increasing public awareness and participation in protecting and managing forest resources. It should include the consideration of land use and tenure patterns and local needs and should spell out and clarify the specific objectives of the different types of greening activities.
3.3. Issues related to environmental management
3.3.1. Institutional setup Policy making in Lebanon is largely based on a sectoral approach. The outcome of this approach is often disjointed policies in the spheres of economic, social and environmental management, where crosscutting issues, such as poverty, unemployment, health and environment, are addressed independently with little consideration to the interlinkages between the issues and their driving forces, pressures, impacts and responses.
64 Ministry of Tourism, Lebanon, http://www.destinationlebanon.gov.lb/SiteSeeing/NaturalReserve/Horsh_Ehden.aspx# (accessed 29 June 2009 19:08)
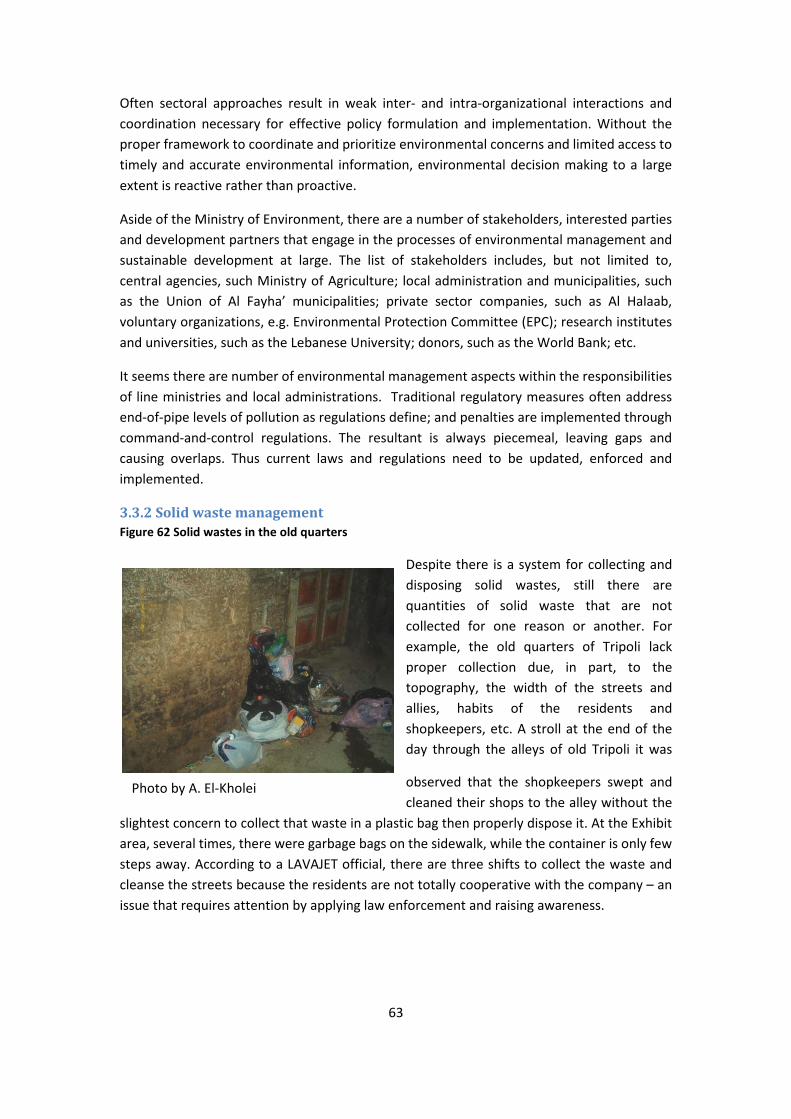
63
Often sectoral approaches result in weak inter- and intra-organizational interactions and coordination necessary for effective policy formulation and implementation. Without the proper framework to coordinate and prioritize environmental concerns and limited access to timely and accurate environmental information, environmental decision making to a large extent is reactive rather than proactive.
Aside of the Ministry of Environment, there are a number of stakeholders, interested parties and development partners that engage in the processes of environmental management and sustainable development at large. The list of stakeholders includes, but not limited to, central agencies, such Ministry of Agriculture; local administration and municipalities, such as the Union of Al Fayha’ municipalities; private sector companies, such as Al Halaab, voluntary organizations, e.g. Environmental Protection Committee (EPC); research institutes and universities, such as the Lebanese University; donors, such as the World Bank; etc.
It seems there are number of environmental management aspects within the responsibilities of line ministries and local administrations. Traditional regulatory measures often address end-of-pipe levels of pollution as regulations define; and penalties are implemented through command-and-control regulations. The resultant is always piecemeal, leaving gaps and causing overlaps. Thus current laws and regulations need to be updated, enforced and implemented.
3.3.2 Solid waste management Figure 62 Solid wastes in the old quarters
Despite there is a system for collecting and disposing solid wastes, still there are quantities of solid waste that are not collected for one reason or another. For example, the old quarters of Tripoli lack proper collection due, in part, to the topography, the width of the streets and allies, habits of the residents and shopkeepers, etc. A stroll at the end of the day through the alleys of old Tripoli it was
observed that the shopkeepers swept and cleaned their shops to the alley without the
slightest concern to collect that waste in a plastic bag then properly dispose it. At the Exhibit area, several times, there were garbage bags on the sidewalk, while the container is only few steps away. According to a LAVAJET official, there are three shifts to collect the waste and cleanse the streets because the residents are not totally cooperative with the company – an issue that requires attention by applying law enforcement and raising awareness.
Photo by A. El-Kholei

64
3.2.3 Loss of cultural identity The cultural heritage and built environment of Al Fayha’, particularly old Tripoli, has dilapidated over time. The metropolis lost most of its green areas, particularly the lime and lemon plantations that gave it the reputation of Al Fayha’.
Figure 63 Old Tripoli overlooking Abu Ali River in the past
Source: TEDO 2008
Urban planning and management in a capitalist society is often faced with property contradiction, i.e., the contradiction between the market value that the owner of a property sees and values versus the social property, i.e., the use value that the society cherishes. The second challenge that urban planners and managers face is the capitalist-democracy contradiction. On one hand, capitalists need a government to provide public goods, such as solid waste collection, clean air, etc. but warns that too much management and planning means to control the built environment that threatens the processes of capital formulation and accumulation. Thus, environmental management is needed for the productivity of the labor but should not be a hindrance for economic growth. The solution is to seek an institutional framework and setup that assures sustainability by carefully balancing between achieving economic growth in Al Fayha’ and transforming the society into a self-reliant community that respects diversity and heterogeneity while protecting natural assets and resources.
3.4 Summary of the state of the local environment The state of the local environment is not serious yet. However, if current conditions continue then the state of the local environment will get worse with serious implications that can possibly threaten the sustainability of Al Fayha'. Water resources are receiving loads of pollution. This situation will be resolved once the construction of the tunnel and the network is completed, and the wastewater treatment plant is operational.
Another issue is the need for an integrated solid waste management. Today the landfill is approaching its full capacity. Al Fayha' needs a sanitary landfill in the near future. There is a need for a transit station for sorting solid wastes and then reusing whatever solid wastes,
65
recovering energy of the collected wastes and recycling recyclables. Currently, there 10 thousand square meters devoted for developing a composting plant, and the EU is financing an initiative to develop a sorting plant. One of the means to finance the development of the composting plant is the carbon market, which will require proper positioning and marketing.
Monitoring air pollution needs more attention. The current situation of air quality requires full assessment, where the recorded data is not sufficient for a full picture of the air quality, given that in several cases TEDO was not able to collect the data for security reasons. The current use of fossil fuels in transportation, generating electricity, the harbor and manufacturing are major sources of air pollution that require attention to protect air quality from degradation that can have serious health impacts that in turn affect both the local economy and the society. TEDO needs assistance on improving its ability to collect data. The officials of TEDO concluded a framework with the local hospitals to provide them with continuous data on wastes, cases, etc. TEDO also needs assistance on how to transform the collected data into information and knowledge essential for intelligent decision-making. The production of information kits for entrepreneurs will attract investment and ease public decision, as well as assist local non-profit organizations, such as NGOs and research institutions to properly perform duties of environmental education, training and awareness.
Marine environment, coastal areas and biodiversity all require special attention given that Lebanon is a signatory to several international conventions. Future economic plans for boosting the local economy are pressures on these delicate ecosystems.
Land and the built environment are in need for proper management. The current environmental status indicates need for proper land use and management. The cultural heritage and monuments can be harmed as a result of polluting the environment. For example, a number of oxides65
released to the atmosphere can transform into acids once combined with water vapor. These acids will then affect the state of many monuments given that most of them are of limestone.
65 particularly SOx

66
Chapter 4 Impact of the state of the environment According to the Coastal Legal and Institutional Assessment and Cost of Coastal Zone Environmental Degradation in Northern Lebanon issued in March 2009, the environmental degradation stands at US$ 107 million, equivalent to 4.2 percent of the GDP of the northern coast in 2005 with a confidence interval ranging between 3.2 and 5.3 percent. The order of magnitude cost estimates are slightly greater than the ones derived from Lebanon’s Cost of Environmental Degradation (COED) in 2000 (3.9 percent). However, when global externalities are not included, the difference between both figures reaches 0.7 percent of GDP, Table 7. Within the environmental categories, the ranking remains the same except for Solid Waste that ranks 5th in 2005 --with a substantial relative increase due to improved data calculations-- and Global Environment that is relegated to the last rank --after using the most recent yearly mid-point costs associated with climate change effects over the century. Ranked by Casa, the Tripoli federation of municipalities (57 percent) bears the brunt of the coastal environmental degradation followed by Batroun (16 percent), Akkar (14 percent), Minieh-Dennieh (11 percent) and Koura (1 percent).
Table 10 Lebanon and Northern Coastal Zone Cost of Environmental Degradation Comparison Category COED (base year 2000) CCZED (base year 2005) Ranking US$
million % of GDP Ranking US$
million % of GDP
Water 1 175 1.07 1 38 1.50 Air 2 170 1.02 2 31 1.23 Coastal zones & cultural heritage
3 110 3 18 0.72
Soil and wildlife 4 100 0.60 4 12 0.49 Global environment 5 90 0.50 6 3 0.12 Solid waste 6 10 0.05 5 5 0.19 Total 655 3.92 107 4.24 Total without global environment
545 3.42 104 4.12
GDP 16,600 2,512 Source: METAP (2009)
The sub-categories were then re-aggregated by categories that better reflect the coastal zone scope. The aggregate total is still US$ 107 million with the following category breakdown: air, regional waters, land use, water resources and biodiversity. Moreover, the environmental health burden of disease is conservatively estimated at 3,464 DALY lost in 2005, with 71.4 percent and 28.6 percent stemming from air pollution and water-related shortcomings respectively. The GDP per DALY lost stands at US$ 725. Should the energy switch from oil to gas is implemented to supply the Deir Ammar power station, averted costs are negative and reach minus US$ 178 million (see below) and could efficiently avert up to US$ 81 million of yearly aggregated degradation equivalent to 76 percent of the northern coastal degradation. Nevertheless, these gains will still be subsidized (16 percent) unless the government starts improving some basic services by managing utilities in a sustainable manner and increasing tariffs to ensure cost recovery, Table 11.

67
Table 11 Northern Lebanon Coastal Environmental Valuation by Category in US$ million, 2005
Category Cost of Degradation Averted Cost (US$ million)
Remedial Cost (US$ million)
Subsidy (US$ million)
US$ million (Relative %)
(% of GDP)
DALY lost
Air 33.8 31,7 1.3 2,472 9.2 -139.1 0.1 Regional waters
7.9 7.4 0.3 8.4 7.2 7.2
Land use 23.0 21.6 0.9 Water resources
37.9 35.5 1.5 992 54.1 9.1 4.9
Biodiversity 4.0 3.7 0.2 0.0 0.0 0.0 Total 106.6 100.0 4.2 3,464 80.8 -117.5 13.3 Source: METAP (2009)
4.1. Impact on ecosystems Lacking proper integrated environmental management of Al Fayha' has serious implications on the local ecosystems. Indiscriminant dispose of solid wastes have negative impacts on the local ecosystems. Under the context of MAP/MEDPOL activities to protect the Mediterranean Sea, University of Balamand carried-out a pilot study to assess marine litter off the coasts of Tripoli and El-Mina, Lebanon. Marine litter was divided in six categories present in the waters of El-Mina/Tripoli in the following percentages: 1) Cloth: 1.74 percent; 2) Fishing material: 1.74 percent; 3) Glass: 1.16 percent; 4) Metal: 16.81 percent; 5) Paper: 0.87 percent; and 6) Plastic: 77.68 percent. Litter was mostly found in areas of high anthropological stress, mainly at the mouth of the Abou Ali River, the fishing and commercial ports, the conglomeration of rocks off the El-Mina headland and around the Palm Island Reserve. The results revealed the influence of anthropic activities and river inputs. Temporal trends indicated the presence of plastic and metal over the whole period of collection, while all other categories were collected sporadically. This passive method for monitoring marine litter at minimal costs has been validated and can be applied to other areas around the Mediterranean.

68
Figure 64 Assessment of marine litter off the coasts of Tripoli and El-Mina, Lebanon (%)
Source: SMAP. Balmound University
The use of fossil fuel in power generation, whether Dier Amar or private owned and operated generators, have serious impacts on the quality of air, which in turn pollutes surface water bodies, soil and groundwater as a result of the geology of the area, the marine environment and coastal zones. The resultant is compounding impacts of pollution that destroys natural habitat and affect the ability of the ecosystem to regenerate itself. Another example is the deforestation and loss of vegetation for construction of roads and new residential and tourist developments. The impacts of loss and degradation of forests are in the form of soil erosion; loss of biological diversity, damage to wildlife habitats and degradation of watershed areas, deterioration of the quality of life and reduction of the options for development.
4.2. Impact on quality of life and human health The available information does not indicate seriously degraded air quality. However, under the BAU scenario, Al Fayha’ cannot assure the sustainability of the development of the three municipalities. In several cases, records for PM went beyond permissible limits. Air-borne pollution particles may contain several toxic and carcinogenic chemicals. Combined with other pollutants, they can cause serious lung diseases:
• Carbon monoxide is among the major air pollutants. The most serious health effect of carbon monoxide is its ability to enter the blood stream by displacing oxygen carried to the cells. Carbon monoxide has an affinity for hemoglobin, being 200 times more likely than oxygen to combine with hemoglobin, forming carboxy-hemoglobin. Carbon monoxide-laden blood can weaken heart contractions thereby decreasing the volume of blood being pumped and significantly reducing the normal performance of an otherwise healthy person.
• Lead, another air pollutant, has received particular attention because of its health impacts, particularly on children. Exposure to lead in childhood associates with retarded central nervous system functioning, which persists into adulthood.

69
• VOCs, SOx and NOx are air pollutants associated with urban atmosphere. When sulphur dioxide reaches the atmosphere, it oxidizes into a sulphate ion. It then becomes sulphuric acid as it joins with hydrogen atoms in the air and falls back down to earth. Oxidation occurs often in clouds and especially in heavily polluted air where other compounds, such as ammonia and ozone, help to catalyze the reaction, converting more sulphur dioxide to sulphuric acid. However, not the entire sulphur dioxide is converted to sulphuric acid. In fact, a substantial amount can float up into the atmosphere, move over to another area and return to earth unconverted. The unconverted with Nitric acid and nitric dioxide will enhance the acid rain to do more damages to the environment.66
• NOx, is the generic term for a group of highly reactive gases, all of which contain nitrogen and oxygen in varying amounts. Many of the nitrogen oxides are colorless and odorless. However, one common pollutant, nitrogen dioxide (NO2) along with particles in the air can often be seen as a reddish-brown layer over many urban areas. Nitrogen oxides form when fuel is burned at high temperatures, as in a combustion process. The primary sources of NOx are motor vehicles, electric utilities, and other industrial, commercial, and residential sources that burn fuels. NOx is one of the main ingredients involved in the formation of ground-level ozone, which can trigger serious respiratory problems. It reacts to form nitrate particles, acid aerosols, as well as NO2, which also cause respiratory problems. NOx contributes to formation of acid rain; nutrient overload that deteriorates water quality; atmospheric particles, that cause visibility impairment most noticeable in national parks; to global warming; and reacts to form toxic chemicals. NOx and the pollutants formed from NOx can be transported over long distances, following the pattern of prevailing winds. This means that problems associated with NOx are not confined to areas where NOx are emitted. Therefore, controlling NOx is often most effective if done from a regional perspective, rather than focusing on sources in one local area.
67 NOx causes a wide variety of health and environmental impacts because of various compounds and derivatives in the family of nitrogen oxides, including nitrogen dioxide, nitric acid, nitrous oxide, nitrates, and nitric oxide.68
Selected health indicators, Table 12, show reasonable situation compared to peer countries within the same social and economic level of development of Lebanon. However, the data graphed in Figure 63 concerning water borne diseases for Tripoli country during 1998-2008 show overall decline of water-borne diseases, except during 2001. These data have to be reviewed with caution. There is not specific incidence of water pollution episode during that year. None of the interviewees mentioned any information concerning that year. Also, this could be a Type I error, i.e., data improperly recorded.
66 http://www.gp.com.my/what_is_so2.htm 67 Ibid. 68 http://www.epa.gov/air/urbanair/nox/hlth.html

70
Table 12 Lebanon, selected indicators for public health
Country Average annual reduction in under-5 mortality 1990-2005
AIDS/HIV: Percent of adults age 15-49 living with HIV 2005
Infant mortality rate
Government expenditure on health as a percent of total expenditure on health
Percentage of the total population burning solid fuels in their households, 2004
2000 2005 2000 2003
Lebanon 1.4 -- 28 27 28.5 29.3 < 5
Source: Complied from the Earthtrends Statistical database http://earthtrends.wri.org/ from 1) United Nations Children's Fund (UNICEF). 2006. The State of the World's Children 2007: The Double Dividend of Gender Equality. Table 10. New York: UNICEF. Available online at: http://www.unicef.org/sowc07/. 2) Joint United Nations Programme on HIV/AIDS (UNAIDS). 2006. Report on the global AIDS epidemic. Geneva: UNAIDS. Available online at http://www.unaids.org/en/HIV_data/2006GlobalReport/default.asp. 3) World Health Organization (WHO). 2006. World Health Report 2006: Annex Table 2. Geneva: WHO. Available online at: http://www.who.int/whr/2006/annex/en/index.html and in the WHO Statistical Information System (WHOSIS): Core Health Indicators. And 4) World Health Organization (WHO). 2006. Global Health Atlas: World Health Statistics. Geneva: WHO. Available on-line at: http://globalatlas.who.int/globalatlas/.
Figure 65 Tripoli County (including Al Fayha’), Water-borne diseases, 1998-2008
Source: TEDO 2008
4.3. Impact on the urban economy The basic economic sectors are productive services, such as tourism and transportation, including the port; construction and manufacturing, such as soap and food processing, including sweets. To be competitively in a global market, these economic sectors need to abide with regulations governing environmental management. Without acquiring accreditation certificates, such International Standard Organization (ISO) for example, the product and services these sector produce will face difficulties in competing in a global market.
Environmental degradation means that the assets upon which these economic sectors depend are questioned, and thus threatens the sustainability of these industries. Also
0
500
1000
1500
2000
2500
1998 1999 2000 2001 2002 2003 2004 2005 2006 2007 2008
Case
s
Year

71
environmental degradation affects the health of the working class, whose productivity declines and associates with economic losses as mentioned earlier.
Al Fayha’ is already having problems marketing available investment opportunities due, in part, to the overall slow national economic growth rates, coupled with a negative hostile image of insecurity and fundamentalism. If environmental degradation is factored in the equation, then the local economy of Al Fayha’ will experience further decline and recession.
4.4. Impact on the built environment Al Fayha’ possesses an extraordinary physical image and an amazing built environment that combines historic monuments with natural aesthetics. Increased levels of pollution will lead to negative impact on the built environment.
First, poverty pockets in the old quarters means inability of the residents to pay and/or afford the expenses to keep their built environment intact. Only the rich families have the mobility and can leave the old quarters to newer residential areas within Al Fayha’ or at the hinterlands of the metropolis, while keeping their businesses at the old quarters, such as the goldsmiths for example.
Air pollution once combined with water vapor transform into acids that react with monuments developed from limestone and marble (calcium carbonate). This reaction erodes the monument and threatens its existence, particularly if there are delicate elements such as wall paintings for example.
Lacking an integrated system for managing wastewater treatment affect the both groundwater quality and affect the foundations of the monumental buildings. An integrated scheme for wastewater treatment is badly needed to secure these monuments that represent the memories of Al Fayha’.
Improper collection and disposal of solid wastes have serious impact on the built environment. These accumulated wastes can be the habitat of rodents and harmful insects, such as mosquitoes. Prevention is often less expensive than treatment, and thus investing in developing a proper sanitary landfill is essential for both the built environment and the health of the residents as well.
4.5. Climate Change and Vulnerability to natural and technological disasters Natural disasters are happenings whose danger level is associated with natural causes, such as flooding, fire, earthquakes, tropical storms and volcanic eruptions. Among others, environmental problems are responsible for threats to human settlements. The impact of atmospheric pollution goes far beyond its immediate effect on the quality of city life and on citizens’ health. Climate change caused by rising temperatures indicates the importance of controlling its causes. Nevertheless, since such changes are accumulative and only become evident after many years, its effect on human health is even greater. Al Fayha’, as many Arab cities, will experience more heat waves and more problems due, in part, to air pollution especially dense, large cities that can negatively affect their local economies. Impact of

72
climate change on recreational tourism is of several folds. heat waves might discourage tourists and divert them to other destinations. Climate change will support an environment conducive to the widespread of diseases that were not known to Al Fayha’.
Vulnerability to environmental disasters is now associated with global climate change, with reflections on human society.69
Poverty increases vulnerability to natural disasters. Natural disasters usually inflict the poorest living in run-down housing. Since they are poor, they are pushed towards areas unsuited for occupation, economically marginalized, vulnerable and polluted, without proper infrastructure, and the most affected by flooding and landslides on hillsides caused by rain. Polluting or harming strategic natural systems that maintain urban environmental quality is human-induced disasters adds to the effects of natural events, thus reducing their resistance to disasters.
As the population of Al Fayha’ will increase, their vulnerability to natural disasters will also increase. The possible adverse impact of climate change on Al Fayha’ is among these threats and risks. Climate models can be used to determine the amount of climate change anticipated in the future. Rising sea levels due, in part, to global climate change may prove a disaster for Al Fayha’.
A World Bank and ISDR joint study “Pilot Application of East Asia’s Climate Resilient Cities Primer in Selected MENA Cities” selected Alexandria, Egypt; Sana’a, Yemen; Al Fyaha’, Lebanon; Amman, Jordon; and Damascus, Syria as cases to apply the Climate Resilient Cities Primer. It is a guide for local governments/administrations to better understand concepts and consequences of climate change; how climate change contributes to urban vulnerabilities; and what is being done in East Asia and the World. The aims of this approach include better understanding of issues and impacts of climate change at the city level; engaging stakeholders of the city in a participatory approach to establish vulnerabilities to potential climate change impacts; building resilience to future disasters into planning and design through no-regrets endeavors; and last but not least, engaging in partnerships and shared learning with other cities facing similar problems. The primer rests on early discussions, visiting cities, filling out the matrices; discussion with officials, and personal observations. The study concluded that Al Fayha’ is subject to storm surge, floods, and earthquakes. On an institutional side, Al Fayha’ lacks a Department for Disaster Risk Management (DRM). Al Fayha’ also lacks a Department for Environment Management and a Response system; however, there is an updated master plan. Then, according to the study, the level of compliance of Al Fayha’ to climate change and disaster risk reduction is medium. The findings of the study, Table 13, indicate that Al Fayha’ is a hot spot. Al Fayha’ has a dense population; informal settlements; lacks of comprehensive disaster response system; the cities of Al Fayha’ have both economic and political significance in regional or national context. Al Fayha’ is subject to moderate to high level of one or more natural hazard. Past disasters that Al Fayha’ experienced indicate either medium or high vulnerability; and moderate to high sectoral vulnerability to climate change.
69 Developing countries are particularly vulnerable as stipulated by the International Panel on Climate Change (IPCC) in its third report (IPCC, TAR – WG I, 2001), due to financial, human and technological limitations to prevent and recover from the consequences of climate change impacts.

73
Table 13 Findings of World Bank and ISDR Climate Resilient Cities Primer applied to Al Fayha’
Hot Spot Characteristics Al Fayha’
Moderate to high level of one or more natural hazard Yes
Medium or high observed vulnerability in past disasters Yes
Moderate to high sectoral vulnerability of climate change Yes
Absence of urban development plan or growth plan No
Poor compliance with urban development plan or growth l
No
Poor quality of building stock No
High population density Yes
Medium to large population or high decadal growth rate or hi h l i d i i f l l i
Yes
Medium or high slum density or large proportion of informal l i
No
Lack of comprehensive disaster response system Yes
Either or both economic and/or political significance in i l i l
Yes
Hot Spot Yes
Source: Tiwari, Asmita, “Pilot Application of East Asia’s Climate Resilient Cities Primer in Selected MENA Cities,” presentation made at the Regional Workshop on Urban Risk Reduction
, Damascus, Syria, 4 – 5 November 2009
Historically, Lebanon has been affected by medium-sized natural disasters such as wildfires and earthquakes, and large-scale manmade disasters such as internal and cross-border conflicts (Mouamar July 6, 2009, 13:09). Bekaa, Akkar, Bsharri, Beirut, and Marjayoun are the most vulnerable areas in Lebanon. During the past decade, storms and floods come at the top of the list of five national disasters, Table 10. However, the major natural disasters are drought, floods, landslides, earthquakes and tsunami, Table 14. “New research recently released by World Vision shows that despite being at risk of both manmade and natural disasters, Lebanon has done very little to minimize the human and economic costs of these disasters… Lebanon has not dedicated enough human and financial resources to disaster risk reduction, the country has inadequate disaster risk reduction infrastructure, and there is limited disaster risk reduction planning on both the national and local level the research revealed” (Mouamar July 6, 2009, 13:09).
Table 14 Lebanon: Top 5 Natural Disaster reported
Disaster Date Affected (no. of people) Storm 1992 104,075 Flood 2003 17,000 Flood 1987 1,500 Storm 2002 500 Wildfire 2007 50
Source: PreventionWeb, Lebanon, http://www.preventionweb.net/english/countries/asia/lbn/?x=7&y=5
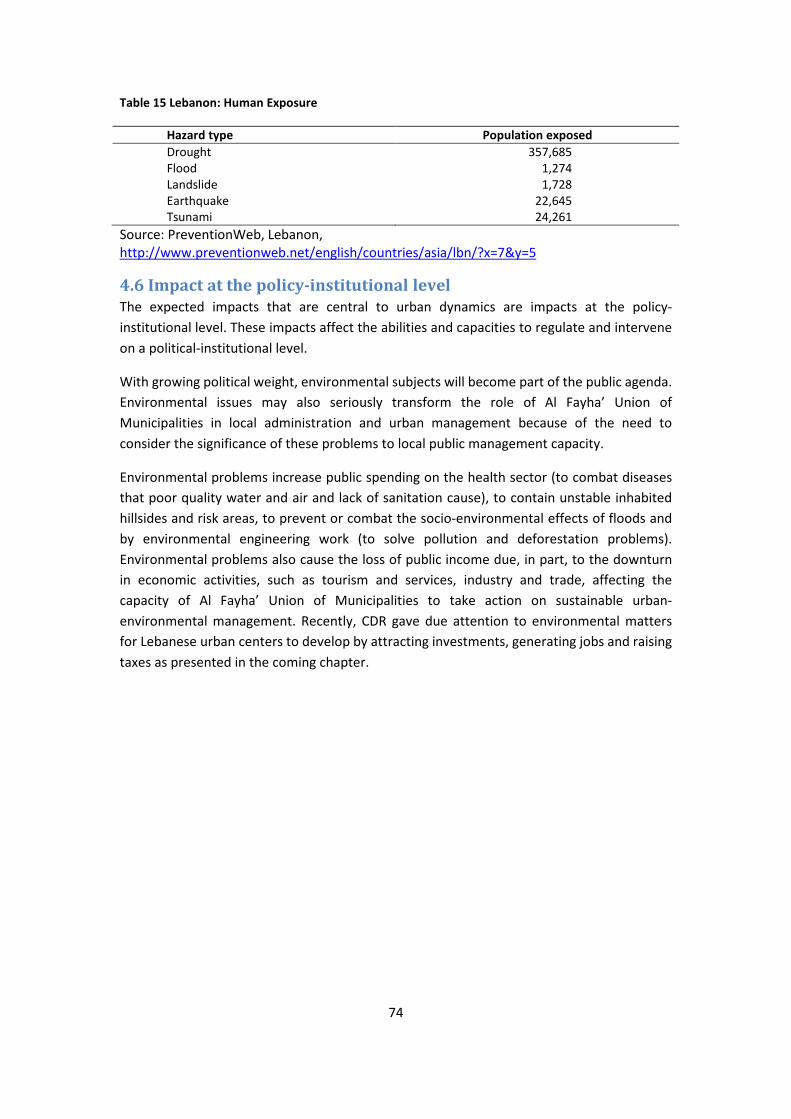
74
Table 15 Lebanon: Human Exposure
Hazard type Population exposed Drought 357,685 Flood 1,274 Landslide 1,728 Earthquake 22,645 Tsunami 24,261
Source: PreventionWeb, Lebanon, http://www.preventionweb.net/english/countries/asia/lbn/?x=7&y=5
4.6 Impact at the policy-institutional level The expected impacts that are central to urban dynamics are impacts at the policy-institutional level. These impacts affect the abilities and capacities to regulate and intervene on a political-institutional level.
With growing political weight, environmental subjects will become part of the public agenda. Environmental issues may also seriously transform the role of Al Fayha’ Union of Municipalities in local administration and urban management because of the need to consider the significance of these problems to local public management capacity.
Environmental problems increase public spending on the health sector (to combat diseases that poor quality water and air and lack of sanitation cause), to contain unstable inhabited hillsides and risk areas, to prevent or combat the socio-environmental effects of floods and by environmental engineering work (to solve pollution and deforestation problems). Environmental problems also cause the loss of public income due, in part, to the downturn in economic activities, such as tourism and services, industry and trade, affecting the capacity of Al Fayha’ Union of Municipalities to take action on sustainable urban-environmental management. Recently, CDR gave due attention to environmental matters for Lebanese urban centers to develop by attracting investments, generating jobs and raising taxes as presented in the coming chapter.

75
Chapter 5 Policy interventions and instruments
5.1. Urban environmental management structures and functioning Within the Coastal Legal and Institutional Assessment and Cost of Coastal Zone Environmental Degradation in Northern Lebanon, which METAP prepared in March 2009 included an institutional assessment that identified the main players involved specifically in coastal zone management, and environmental management at large. The study determined their main objectives, based on their institutional cross-communality and coordination or overlap by sector or themes. However, far from being comprehensive, the assessment underscored the importance of the intersection of the following six major actors in terms of central and local jurisdiction, funding, planning and implementation, safeguarding and water management:
The Ministry of Public Works and Transport (MoPWT) has jurisdiction over the maritime public domain and ports. This responsibility is shared with the Ministry of Agriculture (MoA) for fishing ports, the Ministry of Tourism (MoT) for recreational ports, the Ministry of Industry (MoI) for industrial ports and facilities, and the Ministry of Energy and Water for energy facilities, as existing oil and gas outlets and reservoirs along the shores are poorly regulated. The MoPWT is also responsible for urban development and, therefore, urban land use. With regard to the coastline setback, regulations were set as follows: MoPWT (11 meters for housing and 23 meters for commercial construction
from the summer low tide) MoT for construction along the shore MoE for coastal industrial location (1,000 meters when the industrial
process does not require a near shore location), MoE for quarry location (500 to 1,000 meters).
However, coastal setbacks are poorly enforced, which led to violations along the coastal zone, dating back to the civil war period, that remain unresolved.
Government tiers (Mohafaza/Casas/municipalities). Though the municipalities and federation of municipalities have jurisdiction over contiguous coastline land, the Government exercises both administrative and financial control over them, which gives the former very little power and leverage, particularly regarding their ability to increase or introduce fiscal instruments. The responsibility for solid waste management is still assumed by municipalities through outsourcing, but a new 2006 CDR-MoE plan aims to separate solid waste operations into collection and transport, which are entrusted to municipalities, and sorting, recycling, composting, and land filling, which are entrusted to the central government. Moreover, a cascading value-added remuneration incentive is envisaged at each solid waste transformation stage, which could be measured by subtracting inputs from outputs, to enhance the effectiveness of the process and reduce waste.
76
The Ministry of Finance can play a key role in achieving State objectives by ensuring the timely transfer of budgeted funds to line ministries, agencies, and government tiers. These transfers allow them to assert of their respective sovereign prerogatives (attribution) and execute their obligations (public services and utilities). The regularity of transfers has, however, been affected by the burden of increasing debt (the debt/GDP ratio exceeded 200 percent in 2008). Moreover, the Ministry is responsible for cadastre management, which puts all land transactions under its authority and responsibility.
The CDR has been the executing agency for most government development projects since 1977 and inherited the planning functions of the defunct Ministry of Planning, which led, eventually, to the production of the 2004 NPMPLT that was endorsed in early 2009.
The MoE has primary responsibility for safeguarding, which extends across line ministries, agencies, and government levels, but with restricted resources and enforcement powers that are often challenged.
The Water Authority was created in 2000 to address the organization of the water sector and the consolidation of water resource management to especially deal with the untreated wastewater discharge in the marine environment. Still, water resource management faces institutional, technical, and capacity-related challenges and despite the introduction of the new 2000 Water Law, there still exist difficulties related to the duplication of responsibilities and gaps within the various institutions and stakeholders in the water management sector. Moreover, regional water and wastewater establishments are based on jurisdictional boundaries rather than watersheds, which, consequently does not facilitate the implementation of integrated water resource management principles.
In addition, other actors play a smaller, but critical, role in improving the management of coastal zone conservation efforts. Such groups include the MoA, MoT, MoI, the very promising Tripoli Environment and Development Observatory (TEDO) set up by EC SMAP II and METAP, the prolific National Center of Scientific Research, civil society, and academia. In addition, new agencies such as the Investment Development Authority of Lebanon (IDAL) are overriding ministerial objectives in order to attract foreign investors or promote private ventures, including the acquisition of large coastal properties
Nevertheless, the fragmentation and overlap of institutional responsibilities in terms of objectives and obligations are not entirely responsible for the mismanagement of the maritime public domain and lack of enforcement of regulations, as the influence of special interest groups and political interference also come into play.
The complex, compounding pressures of human activities on the coastal zone call for reform of the institutional set up. This gives rise to a critical need for coherent, coordinated, and possibly integrated, planning, management, streamlining, safeguarding, enforcement, and monitoring functions. It has been suggested that responsibilities should intersect across line

77
ministries and authorities where clear objectives and prerogatives, complementary mandates, and responsibilities bound by clear principles of governance should be determined.
5.2. Implementation of environmental policies and instruments In December 2005, CDR, in collaboration with IAURIF and other consulting firms, put together a master plan titled Towards a Vision for Public Services And Facilities within 10-15 Years (in Arabic), within the framework of the development programme 2006-2009. In addition, CDR, in collaboration with the Directorate General of Urban Planning, put together a document titled National Physical Master Plan of Lebanon
5.2.1 Policy –administrative
(undated). This sub-section of the report outlines policy interventions that the Lebanese government executed and intends to implement in the future.
The National Physical Master Plan of Lebanon rests on two legal texts: 1. The Decree-law No.5/77 relative to CDR stipulates in its third article that the CDR
elaborates the National Physical Plan Project and submits it to the Council of Ministers for approval.
2. The Decree-law No. 69/83 relative to urban planning stipulates in its fourth article that the Urban Regulations and Master Plans of the cities and villages should be elaborated in line with the general orientations provided by the National Physical Master Plan.
Among the executed and planned programmes is strengthening the Capital of the North and the "Counter-magnet Cities,” as a solution for a more balanced national urban system. There are often number of solutions for closing the regional disparities and achive a balanced urban system. One of these solutions is to pay attention to secondary cities that have the potentials to serve as counter magnets.
The Plan recommends giving priority to the social and economic development of the three main peripheral poles: Tripoli first, due to its role in the development of the whole of north Lebanon; then Zahlé-Chtaura due to its strategic location in the hinterland; and finally Nabatiyé, which is the only large non-coastal community in the south of Lebanon.
CDR intends to strengthen the development of these three poles through: Developing three large zones for industrial activities and services at Beddawi, Rayak
and Zahrani; Regrouping of the faculties of the Lebanese University on four main campuses:
Hadath, Tripoli, Zahlé-Chtaura and Nabatiyé; Directing the maritime transit of goods mainly towards the Port of Tripoli, and
upgrading the port; Rehabilitating the railway between Tripoli and the northern frontier and between
Rayak and the eastern frontier for the transportation of goods; Extending the northern highway towards Halba and the Syrian border, constructing
the missing sections of the Beirut-Damascus highway and extending Nabatiyé

78
highway towards Marjayoun in view of its possible transformation into an international road via Qonaitra;
Strengthening the links between the three poles and their surrounding regions; expressways between Nabatiyé and Jezzine, and Sour and Bent Jbail, new interchange at Chtaura between the Damascus highway and Baalbek, and an expressway between Tripoli, Zgharta and Ehden;
Establishing in each metropolitan area of a "Development and Promotion Mission" responsible for improving their image and encouraging investments.
5.2.2 Economic The competitiveness of Al Fayha’ requires massive investments in the infrastructures, particularly energy production using cleaner mechanisms to fulfill current needs and encourage the public from the use of private electric generators. Al Fayha’ and its environ need to complete an integrated sewer network for comprehensive wastewater management once the treatment plant is operational. Furthermore, the metropolis needs extending means for providing safe drinking water with acceptable levels of TDS.
Al Fayha’ needs investments to boost competitiveness of the basic, export economic sectors, especially tourism, manufacturing and construction. In this respect, SMEs need special attention, where the municipalities can assist them in marketing their products, providing them with patients for products marketable on a global scale through special agreements with international companies, such as Microsoft that provide the youth with training and subcontract to them special services provision. The municipalities can organize caravans to market these products, and use the Rachid Karami Exhibit to invite leaders of manufacturing in the Arab world and the Mediterranean to sign contracts and protocols for association. The municipalities can also assist SMEs to access available credit to finance their operations and extensions by establishing a revolving fund to finance this imitative. Taxes and fees need to be considered and reviewed to encourage production rather than speculation particularly in real estate. The municipalities of Al Fayha’ need to change their image of a conservative city that lacks fun into a safe city for families and those interested in culture and history in addition to those who appreciate aesthetic scenes.
Investing in the place programmes only does not guarantee economic growth and sustain it. There is a need to invest in the human resources and transform them into human capital. Training and capacity building and development are necessary in country that lacks natural resources. Human capital can make up for lack of natural resources.
5.2.3 Physical intervention Al Fayha' can succeed in initiating economic growth by excelling in service provision, particularly productive services, such as transport and tourism. The current city and regional communication networks are performing at adequate levels; however, there is need for special attention to expand and improve these networks to avoid traffic congestion.
The social services available in Al Fayha' need also some attention. This includes adding more education facilities as well as improving the working conditions of the teachers and

79
providing incentives to minimize rates of dropouts, particularly in poor areas. Health services need more attention particularly in terms of trained cadres and specialized professionals.
Environment
Apart from the anticipated land use action plan, the National Physical Master Plan foresees the implantation of the following measures: Establishing a Natural National Park in the North. Encouraging the concerned municipalities to create a series of Regional Natural
Parks, with the main objective of combining the economic and social development of the cities and villages with the proper use and respect of their natural wealth.
Rehabilitation and preservation of more than 30 remarkable sites along the coastal front.
Dismantling the illegal installation on the public maritime domain and establishing free access to this public domain.
Reforestation of the "Cedar's Corridor" at elevations between 1600 and 1900 m. Carrying out a general inventory of the natural remarkable sites to be protected. Setting and adopting three regulatory laws: a seafront law, a mountain law (above
1000m elevation), and a law for the preservation systems (preserved areas, parks, protected areas).
Water, sewerage, electricity
Physical infrastructures in Al Fayha' need serious interventions. The metropolis needs an integrated scheme for wastewater collection, treatment and disposal. The construction of the wastewater plant is a step into that direction; however, the plant alone cannot solve the problem. There is need for completing the network for collection of wastewater. The supply of safe drinking water is another sphere of action that needs attention in AL Fayha'. The limited, interrupted supply of electricity needs attention to limit the dependency on private owned and operated electric generators. CDR plans emphasize the following: Constructing a gas conveyance pipeline from the Syrian source to the power plants,
starting with Deir-Amar in the North. Setting up a plan for the reduction of the number of power plants in an attempt to
reduce the production cost. Review the water supply strategy giving priority to rehabilitation of distribution
networks over the construction of dams and mobilization of new resources. Gradual discontinuation of the use of "building wells" with the progressive
improvement of the water supply service and rejecting construction permits on parcels not provided with water networks.
Implementation of planned irrigation schemes, particularly the Irrigation of South Lebanon, with concurrent cadastral mapping and amendment of urban regulations to preserve the concerned areas for agricultural development.
Construction of hilly lakes and dams commensurate with real deficits. Review of the strategy for the construction of sewage treatment plants, giving
priority to the protection of ground water resources.

80
Solid Waste
CDR plans include special schemes for solid waste management. The solution for problems of solid waste relies partially on recycling, but mainly on the selection of adequate landfill sites. This problem can only be resolved by incorporating a radical financial reform of the local authorities, in which disbursement from the central government to municipalities and/or union of municipalities will increase. The extra funds will be used as a tool to encourage the identification of adequate landfill sites and as a penalty in the opposite case.
Urban Planning
CDR plans several interventions in the sphere of urban planning. These interventions include, but not limited to: Adopting the National Physical Master Plan as a general guideline for the urban
planning policy in Lebanon and for setting future compatible urban planning regulations.
Reviewing the construction and land subdivision regulations for areas not covered by land use planning and local urban regulations.
Providing technical and financial support to the Directorate General for Urban Planning to assist it in performing its duties in planning and updating the relevant legislation.
Limiting, by all possible means, the dispersed urbanization within agricultural lands and within natural areas, due to its consequent elevated cost in terms of infrastructure and to its negative impacts on the natural resources.
Limiting, by all possible means, the linear urban expansion along the inter-urban roads due to its negative impacts on travel time and traffic security.
5.2.4 Socio-cultural, educational and public communication Environment is a major issue and a vital component in the structure of local society of
Al Fayha'. Environmental degradation impacts some social classes more directly than others, either because of the nature of environmental degradation or because of the attributes of the sub-population group such as age, gender and cultural aspects. The CDS to be elaborated has to focus on some of the most affected groups, particularly children, youth, women, elderly, physically disabled and marginalized people. Improving the environment of the most vulnerable groups includes: eliminating sources of pollution, complying with the laws for protecting the environment, and defending the social and cultural dimensions related to pollution. Any interventions will need to encompass the relationship between stakeholders and the Government, especially agencies responsible for community development and environmental affairs.
It is important to utilize sound means of raising children not only within the family and the associations they belong to, but starting from the environment they live in, teaching them how to act within its limits. A simple community awareness program, which the educational programs for children reinforce, can be easily implemented and duplicated to influence family practices.
81
The majority of population is young. Unemployment is a major challenge for most of this sub-population. Harsh economic conditions could force these unemployed youth to exploit the natural resources to support their living. The focus on youth is important as they are among the most willing group to learn, and will become the agents for social change. CDE has to include environmental training programs and generation of job opportunities in the field of environmental management that aim at getting the youth acquainted with essential information that will help reduce environmental problems and risks facing Al Fayha'.
Poverty in Al Fayha' and Lebanon is an observed phenomenon. Female headed household is often a significant group of poor households. Women, particularly in informal areas, are vulnerable to exploitation and have to live with a great deal of uncertainty. Their planning horizons are very short-term. They do not consider activities that may eventually affect their lives on the long-term. The short-termism means that poverty can lead to resource depleting behavior. Enabling women is a must. The CDS has to include programmes to enhance the chance of women to find employment opportunities linked to their local environments, which will help them feel socially secure.
The elderly is a growing sub population because of improved living standards. An elderly suffers from general deteriorating health conditions and decreasing levels of income followed by deterioration in the living standards especially in low-income groups. However, the elderly form an essential pool of knowledge and experience for the local community and as such can become a useful resource to any community-based environmental activities. There is a need to create an environment characterized by low rates of pollution and scenes of green areas to successfully integrate the elderly in the society. Coping in a clean environment would increase their productivity and limit their dependency. The CDS has to include programs and projects for integrating the elderly in the community by addressing their both physical and psychological needs.
Lebanon is country that suffered from several armed conflicts, such as the civil war 1975-1990, the 2006 Hizballa - Israel armed conflict and El-Nahr El-Bard conflict, which have generated number of physically-disabled people. Traffic accidents also are responsible for causalities. Environmental pollution is responsible for disabilities. Finally, certain cultural and religious beliefs lead to marriage within the clan or sect, which often leads to levels of physical disability. The CDS has to include programmes on how to integrate physically disabled population into the society as full productive, independent members of the community. Certain interventions can include developing ramps at the entrances of the buildings and equip these buildings with elevators. An environment conducive to the needs of the physically disabled should be a requirement before granting a license for construction and/or operation.
Marginalized population need to be enabled to get out of the cycle of misery. If they get no help and assistance, then they will continue to "dig" their environment, and the sustainability of Al Fayha' will be questioned. The CDS has to include progammes on how to empower this sub-population. One of the processes for enabling a marginalized population is to acknowledge their ownership of properties, whether land or a building that is classified

82
as informal. This step revives dead capital and puts credit in the hands of the poor. Formalization these properties can have positive impacts on the household that can access formal assistance and financial resources; and improve the revenues of the municipalities.
5.2.5 Institutional Transformations for Sustainable Future The centralized governance structure and sectarian system are among the prime reasons for the inefficient, unstable conditions in Lebanon and Al Fayha'. The solution is decentralization. Different types of decentralization should be distinguished because they have different characteristics, policy implications, and conditions for success. The recommended type of decentralization for Lebanon is administrative decentralization in the form of deconcentration of powers. Accordingly, it redistributes decision making authority and financial and management responsibilities among different levels of the central government. It can merely shift responsibilities from central government officials in the capital city to those working in regions, provinces or districts, or it can create strong field administration or local administrative capacity under the supervision of central government ministries. This step can include delegating authority and responsibilities to the municipalities to found special funds and participate in investment ventures to raise more money for their operations.
The CDS to be elaborated has to provide a road map for getting Al Fayha' from the economic depression. It needs to identify means for resource mobilization. One of the means is to elaborate a number of investment packages and a scheme for marketing these investment opportunities in Lebanon and abroad.

83
Chapter 6 Future Perspectives
6.1. Market Forces The basis of Market Forces scenario is the prevailing economic growth paradigms. The experience of European countries, America, Japan, the Asian tigers (Korea, Taiwan, Hong Kong Singapore and Malaysia) and latest generation of Newly Industrialized Countries (NICs), such as Turkey, Mexico and Brazil, suggest the appropriate way for development. Adam Smith’s invisible hands will bring the miracle of development and prosperity once the market is competitive, which requires number of conditions, such as a large number of buyers and sellers, perfect information, agents of the economy will assume rationale behavior, transferable commodity and identical production techniques. This means that the operation of market mechanisms means the economy is increasingly privatized and there is a gradual withdrawal of government as principal actor in the development process. Thus, in this scenario, the government provides the enabling environment for economic growth, while the private sector is the impetus for this growth. Consequently, market mechanisms define opportunities with no significant intervention from government. The private sector maximizes profits, always seeking out sub-regions with the cheapest labor to produce high-value or brand commodities and services. Increased acquisition is people’s means for satisfaction, and therefore consumerism becomes the socially defining value. The economic system responds by increasing production of goods and services with increased burdens placed on natural resources.
Under the Market Forces scenario, barriers to trade between Lebanon and other countries and regions continue to break down, especially as a result of globalization and because countries agree to unhindered flow of trade and resources, including financial resources. The economic environment becomes very conducive to research and development (R&D) initiatives, given the quality of human resources in Lebanon. Accordingly, as rationale agents, the Lebanese, including those in Al Fayha’, will do their best to maximize the benefits of economic freedom. Motivated by the benefits of economic freedom, the residents of Al Fayha’ will exercise their utmost efforts to maximize their profits. All these factors continue to stimulate economic growth through greater and more efficient use of available opportunities and resources. The operation of the principle of comparative advantage becomes important in the organization of economic activities between and within countries. The port is expanding and a new free economic zone is developing, in addition to number of developments within and around the metropolis, such as the sewer system, will all increase the carrying capacities of Al Fahya’, thus contributing positively to the competitiveness of the metropolis. As a result of the increasing trade between nations as well as the removal of obstacles to the flow of ideas, information, labor and capital within a context of the efficient use of resources, the need arises for the emergence of new institutions to manage the new economic order and the emerging political arrangement. New economic and political groupings can start the process of amalgamation of the sectarian Lebanese society into a new Lebanese society where the allegiance is not to the clan or the sect, rather to businesses. The new groupings share more characteristics, becoming economic and financial groupings in addition to being political associations. Democracy continues to become the

84
accepted form of governance and the involvement of civil society organizations (CSOs) and community groups in decision-making increases people’s participation. In this way, development process internalizes the dividends of democracy.
Within growing economic powers in the local community, and the diminishing powers of the central state from a regulator to mere facilitator for the processes of capital formation and accumulation, market failures and lack of competitiveness will emerge.69F
70 Lacking one of the conditions for perfect competition will lead to market imperfections, such as monopolies, and failures, such as lacking the provision of public good, such as clean air, for example. In this case, the gap between those who have and whose who do not will get wider, and a process of depravation and impoverishment gains momentum dividing the local community along income brackets and losing the middle income classes. This segregation will threaten the sustainable development of Al Fayha’.
6.2 Policy Reform The narrative of the Policy Reform scenario is in many ways similar to that of the Market Forces scenario. However, unlike the Market Forces scenario, there is the realization of the need to address the negative fallouts of the driving forces through concerted efforts by governments and civil society. Consequently, including programmes to mitigate the negative impacts of such development interfere with market mechanisms. The argument is that the socioeconomic and political considerations may make it expedient for governments to take actions that favor citizens, rather than wait for the operation of the market to correct these problems.
Under this scenario, policies address specific and anticipated problems that arise from the operations of the market. Currently, attempts to intervene through policy and planning development in the management of fragile coastal ecosystems of Al Fayha’ is an example of these policies that require adopting integrated coastal zone management (ICZM) programmes that directly affect the allocation of resources and the distribution of the benefits of growth.
Essentially, policy reforms focus on engineering development through positive and proactive interventions even on such issues as privatization. While accepting the desire for a gradual withdrawal of government as principal actor in the development process, government is not content with just providing the enabling environment for economic growth, and it puts in place a monitoring and evaluation system that ensures that these operators of the economy follow laid-down policies, which are beneficial to the people.
As in the case of the Market Forces scenario, barriers to trade break down under the Policy Reform scenario. This is the result not only of globalization and Information and Communication Technology (ICT) but also of the deliberate efforts of governments and regional groupings. The new economic order can lead to societal development that will lead
70 Regulation is not in the interest of capital, but the principle to be adopted in laissez faire, laissez passé

85
to the rise of a different social order that replaces the current sectarian social order. The development of new initiatives and ideas is greatly stimulated.
The pace of economic growth under this scenario might not as fast as that of Market Forces, and thus the current ills are cannot be resolved because the invisible hand is not free to operate the market forces and reap the miracles of capitalism. The Policy Reform does not seem to be promising to assure the sustainable development of Al Fahya’. It still has the limitations of both BAU and that of Market Forces.
6.3 Fortress World The Fortress World scenario emerges because of the struggle for power between two or more groups of people in a nation, identified here as the urban elites of Al Fayha’ and the masses. The elites have access to resources of economic growth and monopolize these resources for their own development; in the mean time, the masses have few resources and are left at the mercy of the elites. The masses depend on the leftovers from the elites and are often not in a position to decide their own destiny. The resultant is the need of urban elite to protect themselves and their investments, the urban elites of Al Fayha’ to organize themselves into enclaves, strongholds or garrisons. These enclaves connect with other similar enclaves within Lebanon and abroad through networks of economic interaction at both global and national levels via multinational companies, which operate in these enclaves.
A variant of the Fortress World scenario, with similar consequences, occurred in Lebanon. The civil war and domestic arm conflicts arise because of the sectarian division. Despite the call of both majority and opposition that Lebanon comes first, there is still mistrust and differences seem to be more than convergences. For this reason, there are certain clauses in the laws governing and regulating relationships within Lebanon have to be more alive to the issues, as they require economic restructuring and empowerment of the deprived class.
A variant of the Fortress World scenario, with similar consequences, occurred in Lebanon. The civil war and domestic arm conflicts arise because of the sectarian division. The remaining persons are pushed into enclaves that display different characters from those of the “protected areas.” Thus, while amenities and technological development could be at maximum development in the areas of the elite, the areas of the marginalized masses are often depressed, always lacking all amenities and are considered as the backwaters of development. Economic and social welfare are not directed at improving the general well-being of everybody, but at protecting the privileges of the rich and powerful elite. In this scenario, there is a growing divide between rich and poor people. This situation paves the way for increasing disputes between individuals, clans, sects, institutions and governments over resources for production, particularly land, and increases the likelihood of tensions over issues of wealth and its distribution. The continued play of these situations leads to establishing the fortress to avoid total breakdown of law and order.
86
6.4 Great Transition: Towards Sustainability The Great Transitions scenario seeks to adapt the good aspects of the other scenarios to strengthen the three pillars of sustainable development – environment, society and economy. This scenario views neither the Market Forces nor the Policy Reform as sufficient to address the ills that economic growth has placed on the environment, but sees the need for the evolution of a new development paradigm in which the sustainability of the environment is not compromised. It is envisaged that behavioral patterns that characterize modern societies, such as consumerism, give way and that instead people define a new level of satisfaction that is not materialistic. Furthermore, in this scenario it is envisaged that there will be a cultural renaissance that de-emphasizes the current “craze” for imports of food items, consumables and luxury goods.
The major paths through which the Great Transitions scenario for Al Fayha’ evolves to include a new set of strategies that differs from current strategies and approaches, and that approaches development at conceptual, methodological, institutional, operational and financial levels. The conceptual basis for this scenario rests on the following: Future development paths must be unlike conventional approaches, which are
developing in a progressive sequence usually from the primitive to the advanced and crisis-driven, dialectic and crisis-free;
Has a vision that is methodologically “surprise-rich, inductive and retroactive, as opposed to the conventional wisdom that is surprise-free, deductive and predictive”;
Is locally owned and initiated, and is supportive and nurturing of people of Al Fayha’ and promotes people-intensive development; in this respect it departs from the donor-fed and controlled development paths that are directive and capital-intensive visions; and
Development departs from the existing institutional set-up that is state-centered, concentrated and monopolistic to promote an approach that is “grassroots-oriented, multiple, dispersed and pluralizing.”
Central to the Great Transitions scenario is the general disillusionment with dominant societal values, such as consumerism, and the prioritization of the economy over the environment with its negative impacts on human well-being, development, and the environment itself. In this scenario, a new generation of thinkers – scientists, leaders, civil society organizations (CSOs) and activists – come together and shape local, national, regional and global dialogue and policy towards promoting the interlocked goals of environmental sustainability and development. The interviewees of Al Fahya show disenchantment with present values and see that the only development that is acceptable is sustainable development that respects the environment. Against this development, it assesses what remains of environmental resources and identifies the opportunities these present for development. By 2025 Lebanon can be booming, and resolved internal conflicts where the democratic leaders of the country are able to establish a status of unprecedented calm, and researchers offer salvation.
The attributes of the Great Transitions scenario are based on visions of a desirable and environmentally sustainable future. The feasibility of a Great Transitions scenario for Al
87
Fayha’ and Lebanon at large is supported by the body of ideas among great thinkers in Arab world, Mediterranean and beyond. Many events in Lebanon since the turn of the century have already set the stage for such a possibility. The renewed determination of the leaders of country to advance unity, and to reactivate and rejuvenate partnerships, including partnership between Lebanon and the global community, within the principles of Agenda 21 and the WSSD action plan, is historically very. The strategy that CDR formulated for achieving sustainable development in the 21st century by managing land uses goes beyond all previous initiatives. The CDR plan reviewed earlier postulates that a credible and appropriate development strategy for Lebanon must satisfy four basic principles: Self-reliance; Self-sustenance; The democratization of the development process; and An equitable and just distribution of the fruits of development through progressive
eradication of unemployment and mass poverty.
The Great Transitions scenario can extend to embrace the MDG, as a mechanism for turning around both strategy and methods of development. Using the MDG targets, the scenario aims to actively and consistently adopt the targets as the minimum conditions to be met by the year 2025 in the case of the sustainability of the environment and earlier in the case of others. Achieving these targets necessitates constant and extensive interactions between all stakeholders, a process that, though cumbersome, becomes beneficial as it is inclusive and democratic.

88
Chapter 7 Policy Options The analysis shows there are number of factors of urban pressure on the environmental resources. First of these factors is the population dynamics and composition. Al Fayha', as other urban areas in Lebanon, is gaining population due, in part, to rural-urban migration. It also loses population to Beirut and other countries. It seems that Al Fayha' serves as a transit station for rural migrants who are constantly searching for better opportunities.
The second factor is the economic depression that the metropolis experience. There are several reasons for this economic hardship. The civil war and other armed conflicts, in addition to being under Islamic fundamental influence have given the metropolis a negative image – an image of an unfriendly, unsafe city. This image is not conducive to an economy based on productive services, such as tourism. The civil war and other armed conflicts in the MENA region have negatively impacted the metropolis and its economy. The Iraqi Pipeline Company (IPC) is not operational, and there are other competitors within the Middle East for that line. The harbor is not properly positioned to receive loads of shipment, and thus the extension and new economic zone are steps in the right direction. The current economic hardship is among the prime reasons for lack of job opportunities, and thus losing the adequately trained cadres as migrants to Beirut and countries aboard. Only those who lack mobility are stuck in Al Fayha' – often, they are the poor who are immobile. Poverty often pressures the poor to "dig' their environment, thus threatening the likelihood for sustainable future.
The third factor exerting pressures on natural resources is lacking proper physical infrastructures. The metropolis is in need for a sanitary landfill; proper supply of electricity; means for provision of safer drinking water, and an integrated scheme for wastewater management. Last but not least, the current institutional setup is not conducive for proper environmental an urban management.
The fourth factor is the institutional setup that affects the above three factors, as presented in the problem tree, Figure 66. There is a need for institutional transformation that assures the sustainability of the development of Al Fayha’ and Lebanon at large. This transformation rests on a departure from the current sectoral planning approach to a multi-stakeholder participatory decision-making that is conducive to building partnerships and enables the Lebanese to control their destiny and that of their future generations. Adopting the principles of good governance and rooting plans in the foundations of basic human rights is a sine quo non for this institutional transformation. Chapter 8 of Agenda 21 outlines specific interventions in this sphere. Institutional transformations are about reform to assure that current problems do not emerge once more.
The overall effect of the aforementioned causes (factors) is that the sustainability of Al Fayha' is questioned and threatened. The impacts are of several folds. First, the local economy and the national economy are incurring economic losses in a number of ways. Depleting the available limited natural resources is a major economic loss for a country that depends on tourism as one of the major sources of income. Labor productivity declines as a result of morbidity due, in part, to environmental degradation, which is also responsible for

89
premature mortality that is another economic loss with serious implications on the social fabric when households loss their supporter.
Prior and on-going initiatives, such as assistance from EU-SMAP, for example, have provided Al Fayha' with opportunities for proper management and decision-making. The development of TEDO, for example, and elaborating an inventory list for sources of air pollution is an excellent step towards preparing local urban and environmental indicators. This step needs to be developed further from just collection of data and information into generating knowledge to support an intelligent process of decision-making.
Planned initiatives indicate the sincere intentions of the Government of Lebanon and the municipalities of Al Fayha' to address the factors contributing the degradation of the environment in the three cities: Tripoli, El Mina and El Beddawi. CDR elaborated two important documents. The first is about a vision for the coming 10-15 years; and the second is broad lines for a national land use plan and regulations for management. Having a plan in place is important, but equally important is to have an action plan that transforms these ideas and concepts into executed actions in reality where outputs have outcomes and results.
The CDS to be elaborated has to address issues pertaining to assure a market that is perfectly competitive. Environmental degradation in many cases is the resultant of lacking a perfectly competitive market. For example treating air quality as a free good does not encourage energy conservation, where minimizing gaseous emissions often associates with decline in recorded air pollutants. Hence, the use of economic incentives is essential, and has to be one of the tools for implementing the plans of CDR as well as the CDS itself.
By the same token, it is crucial to fill in the legal gaps and enforce laws and regulations. According to an interviewee, there are number of regulations and decrees that have been under consideration at the Cabinet of Ministers. A special decree that regulates the preparation of EIA has been under investigation at the Cabinet of Minister for the past five years, and has been draft in 13 different versions.
One of the issues that need to be clearly defined and addressed is the need for institutional transformation from which current agencies, authorities, corporations, NGOs and other bodies evolve and upgrade into institutions that come to adopt principles of good governance. It is of utmost importance to transform the current decision-making into one that is participatory and consultative that nurtures a peaceful democratic societal transformation departing away from the current sectarian society. This is possible if the Lebanese people view their country as a corporation where everyone has an equal share and interest, and also will have equal rewards and dividends.
Specifically, Al Fayha’ has to consider the following measures:
1. There is a need to support TEDO to continue collecting information and monitoring the state of the environment. In this respect, TEDO has to periodically produce the GEO Cities report for Al Fayha’ using the DPSIR methodology and IEA approach. The
90
report has to include long term risks, such as climate change. TEDO need to switch gears from just collecting data into analyzing data and generating information and knowledge. TEDO will have to collect other parameters of air quality and noise levels as well. The data collected will also include proper measurement of per capita generation of solid wastes. The data collection will expand to other suites of soild wastes, such as industrial, hospital, etc.
2. Given the current and planned initiatives to correct the status quo, and prevent further deterioration, Al Fayha’ has to follow up with CDR on the projects that aim towards physical interventions, such as establishing a national park, developing new green areas, and so forth. Throughout this document, there were number of proposed actions to improve the current condition and correct for the present situation. These proposed actions need to be considered within the overall framework of the CDS.
3. Last but not least, there are a number of initiatives that are supportive measures, such as capacity building, adopting the principles of good governance in decision-making, etc. These supportive measures are central to the success and the sustainability of proposed measures within the document.

Figure 66 Problem tree
The Environmental Sustainability of Al Fayha’ is at Risk and Questionable
Economic Depression and Loss of Opportunities for
Economic Growth
Threats to the Environment given the fragility of the eco-
systems in and around Al Fayha’
Communities Al Fayha’ lacks self reliance and
resilience
The need for institutional reform
Centralized governance
Lack of autonomy
Sectarian division
Closure of IPC
Informal economic establishments
Regional instability
Conservative image
Degraded water quality due to lacking an integrated scheme for
wastewater management
Need for an integrated solid waste management scheme
Need for efficient use of energy
Need to protect the cultural heritage and monuments within Al Fayha’
Need for ICZMNeed to protect biodiversity (Preserving Flora by expanding green areas and planting endangered trees and shrubs
Need to protect marine environment
Lack of CSR
Need to strengthen CVOs
Growing measures of depraviation
Inadequate social services
Degraded air quality
Increased DALYs
Economic and financial losses
Jeopardizing the environmental sustainability of Al Fayha’ Social tension and stresses
Increased use of energy units per unit of GDP
Increased public spending on health
services
Loss of ecosystems’ services
Increased rates of unemployment
Increased migration
No acknowledgment of urban-rural linkages
Pockets of poverty
Child labor
Population dynamics

References
Abu-Lughod, Janet and Richard Hay Jr. Third World Urbanization
CDR, Master Plan 10-15 years, Beirut, Lebanon 2005
, Methuen and Co. Ltd., London 1977
http://www.cdr.gov.lb/Plan/main.htm (accessed 6 July 2009, 12:38)
CDR, National Physical Master Plan of Lebanon
Central Administration for Statistics, the Republic of Lebanon,
(undated)
Statistical Year Book 2007
Central Intelligence Agency, “Lebanon,” The World Fact Book,
, Beirut, Lebanon, 2007
https://www.cia.gov/library/publications/the-world-factbook/geos/LE.html
Climate Zone.Com, http://www.climate-zone.com/climate/lebanon/celsius/tripoli.htm (accessed 29 June 2009 14:10)
Earthtrend Population, Health and Human Well-Being—Lebanon, 2003 http://earthtrends.wri.org
EU-SMAP, Diagnosis of the Present Situation, pp.3-4
Geography of Tripoli, How Stuff Works, http://geography.howstuffworks.com/middle-east/geography-of-tripoli-lebanon.htm (accessed 29 June 2009 14:39)
Harmandayan, Diran and others, Preliminary Brief for the Preparation of a Sustainable Development Strategy for the Al-Fayha’ Union of Municipalities Tripoli, El Mina & Beddawi
IEA,
, December 2006
http://www.iea.org/Textbase/stats/pdf_graphs/LBOIL.pdf
Korfali, Samira Ibrahim and Jurdi, Mey, “Differential water quality in confined and free-flowing water bodies, Lebanon,” International Journal of Environment and Pollution
Lebanon, Wikipedia, the free encyclopedia,
, Volume 19, Number 3/2003: 271 - 291
http://en.wikipedia.org/wiki/Lebanon (accessed 29 June 2009 13:37)
National Strategies for Sustainable Development (NSSD), “Pressure State Response Frameworks,” www.nssd.net/references/SDInd/PSR.html (accessed on 29 June 2009 18:04)
TEDO 2008
Thomas Collelo, ed. Lebanon: A Country Study. Washington: GPO for the Library of Congress, 1987. http://countrystudies.us/lebanon/30.htm (accessed 26 June 2009, 23:26)
UNDP, Fast Fact Sheet, UNDP, Poverty and Social Development, p. 1, http://www.undp.org.lb/FastFactSheets/PovertyFactSheet.pdf
UNEP, The fourth Global Environment Outlook: environment for development (GEO-4), 2008 http://www.unep.org/geo/geo4/media/ (accessed Sunday, 29 June 2008)
Wikipedia, Tripoli, Lebanon, http://en.wikipedia.org/wiki/Tripoli,_Lebanon (accessed 25 June 2009, 20:05)
World Bank, http://ddp-ext.worldbank.org/ext/ddpreports/ViewSharedReport?&CF=&REPORT_ID=1336&REQUEST_TYPE=VIEWADVANCED

93
World Bank, World Development Indicators
World Urbanization Prospects, 2003,
, 2008
http://esa.un.org/unup/index.asp?panel=1

94
Annexes
Annex 1 Consultant’s Itinerary Monday 22 June 2009 18h30 Depart Cairo International Airport by Egypt airways (MS 711) 19h55 Arrival to RAFIC HARIRI Airport Tuesday 23 June 2009 08h30-10h00 Meeting with TEDO Staffs (at Urban Community Al Fayhaa) 10h30-11h30 Meeting with Dr. Gaby Khalaf general director of Marine Search
Center, Batroun 12h00-13h00 Meeting with Mayor of Tripoli Mr. Rachid El Jamali 13h00-13h30 Meeting with Eng. Azza Fatfat head of section of studies in Tripoli
Municipality 13h30-14h00 Meeting with Mr. Mahmoud Al Asaad, Chef of finance section
in Tripoli Municipality 14h00-15h45 Meeting with Mayor of Beddawi Municipality Mr. Majed Ghomraoui 16h00-17h00 Meeting with Mayor of Al Mina Municipality Mr. Abdel Kader
Alameddine (at Urban Community Al Fayhaa) Wednesday 24/06/2009 8h30-9h15 Meeting with Dr. Samira Baghdadi, President of Social Committee at
Tripoli Municipality (at Urban Community Al Fayhaa) 9h30-10h30 Visit to Tripoli Port, meeting with Mr. George Fadlalla, Belal
Abdulhai and Ahmed Tamer 10h45-11h45 Visit to Waste water Treatment Plant, meeting with Project
Responsible Eng. Alain Pouliquen 12h00-14h00 Visit to Tripoli Landfill, meeting with project manager Eng. Joseph
Germanos and Eng Rabii Asayran from the consultant Company (Dar Al Handasah-Nazih Taleb & partners) and Mr. Tony Boulos (director of operation services at LAVAJET company)
16h00-17h00 Visit Environmental Protection Committee (EPC). Meeting with Eng . Amer Haddad, President of EPC
17h15-18h00 Meeting with Mr. Fawaz Hamdi, Local Expert in CDS project-Economy (at Urban Community Al Fayhaa).
Thursday 25 June2009 9h30-10h30 Meeting with Nisreen Abdulla, Eng. Nasr Gabi and Mahmoud El
Rashidi, General Director of Water Establishment in North Lebanon (at Water Department)
10h45-11h15 Meeting with head of health department Dr. Mohammad Ghomrawi (at North Lebanon Mohafaza)
12h00-12h30 Meeting with Dr. Maha Kayyal, anthropologist-Local Expert in CDS project-Poverty (at Urban Community Al Fayhaa)
12h45-13h45 visit to Deir Amar Power Plant, meeting with Eng. Karim Mikati 15h15-15h45 Meeting with Dr. Rawia Majzoub, General Director, Center of
Restoration and Conservation of Monuments Friday 26 June 2009 9h00-10h30 Meeting with Dr. Mervat El Hoz, member of Tripoli Municipality
council , Professor at Engineering Faculty, visit to Environmental laboratory
10h30-11:00 Meeting with TEDO staff members on air quality monitoring

95
11h15-12h45 Meeting with Eng. Joseph El Aam, (OPERE Company-Sewage Micro tunneling project)
Saturday 27 June 2009 9h00-10h30 Meeting with Miss Rola El Sheikh, the Environmental Impact
Assessment at Ministry of Environment (at Urban Community Al Fayhaa)
10h30-11h00 Meeting with Traffic expert Eng. Rami Samaan (at Urban Community Al Fayhaa)
11h00-13h30 Wrap up of the visit (Dr. Mosbah Rajab, Dr Marlene Najjar, Eng. Abdallah Abdul Wahab, Eng Doha El Beny, Mrs Hoda Rifaii).
15h45-16h00 Visit of the ancient city of Tripoli Sunday 28 June 2009 08h00 Depart of to Rafic Hariri Airport (Beirut)


