Rapid Oscillations in Cataclysmic Variables. XVI. DW Cancri Author(s): Joseph Patterson, John R. Thorstensen, Tonny Vanmunster, Robert E. Fried, Brian Martin, Tut Campbell, Jeff Robertson, Jonathan Kemp, David Messier, and Eve Armstrong Source: Publications of the Astronomical Society of the Pacific, Vol. 116, No. 820 (June 2004), pp. 516-526 Published by: The University of Chicago Press on behalf of the Astronomical Society of the Pacific Stable URL: http://www.jstor.org/stable/10.1086/421034 . Accessed: 26/05/2014 19:35 Your use of the JSTOR archive indicates your acceptance of the Terms & Conditions of Use, available at . http://www.jstor.org/page/info/about/policies/terms.jsp . JSTOR is a not-for-profit service that helps scholars, researchers, and students discover, use, and build upon a wide range of content in a trusted digital archive. We use information technology and tools to increase productivity and facilitate new forms of scholarship. For more information about JSTOR, please contact [email protected]. . The University of Chicago Press and Astronomical Society of the Pacific are collaborating with JSTOR to digitize, preserve and extend access to Publications of the Astronomical Society of the Pacific. http://www.jstor.org This content downloaded from 193.105.154.10 on Mon, 26 May 2014 19:35:24 PM All use subject to JSTOR Terms and Conditions
Transcript
Rapid Oscillations in Cataclysmic Variables. XVI. DW CancriAuthor(s): Joseph Patterson, John R. Thorstensen, Tonny Vanmunster, Robert E. Fried,Brian Martin, Tut Campbell, Jeff Robertson, Jonathan Kemp, David Messier, andEve ArmstrongSource: Publications of the Astronomical Society of the Pacific, Vol. 116, No. 820 (June 2004),pp. 516-526Published by: The University of Chicago Press on behalf of the Astronomical Society of the PacificStable URL: http://www.jstor.org/stable/10.1086/421034 .
Accessed: 26/05/2014 19:35
Your use of the JSTOR archive indicates your acceptance of the Terms & Conditions of Use, available at .http://www.jstor.org/page/info/about/policies/terms.jsp
.JSTOR is a not-for-profit service that helps scholars, researchers, and students discover, use, and build upon a wide range ofcontent in a trusted digital archive. We use information technology and tools to increase productivity and facilitate new formsof scholarship. For more information about JSTOR, please contact [email protected].
.
The University of Chicago Press and Astronomical Society of the Pacific are collaborating with JSTOR todigitize, preserve and extend access to Publications of the Astronomical Society of the Pacific.
http://www.jstor.org
This content downloaded from 193.105.154.10 on Mon, 26 May 2014 19:35:24 PMAll use subject to JSTOR Terms and Conditions
Publications of the Astronomical Society of the Pacific, 116:516–526, 2004 June� 2004. The Astronomical Society of the Pacific. All rights reserved. Printed in U.S.A.
Rapid Oscillations in Cataclysmic Variables. XVI. DW Cancri
Joseph Patterson,1 John R. Thorstensen,2 Tonny Vanmunster,3 Robert E. Fried,4 Brian Martin,5 Tut Campbell,6
Jeff Robertson,6 Jonathan Kemp,7,1 David Messier,8 and Eve Armstrong1
Received 2004 February 11; accepted 2004 March 7; published 2004 May 17
ABSTRACT. We report photometry and spectroscopy of the nova-like variable DW Cancri. The spectra showthe usual broad H and He emission lines, with an excitation and continuum slope characteristic of a moderatelyhigh accretion rate. A radial-velocity search yields strong detections at two periods, 86.1015(3) minutes and38.58377(6) minutes. We interpret these as respectively the orbital period of the binary, and the spin periodPorb
of a magnetic white dwarf. The light curve also shows the spin period, plus an additional strong signal atPspin
69.9133(10) minutes, which coincides with the difference frequency . These periods are stable over1/P � 1/Pspin orb
the 1 year baseline of measurement. This triply-periodic structure mimics the behavior of several well-credentialedmembers of the “DQ Herculis” (intermediate polar) class of cataclysmic variables. DQ Her membership is alsosuggested by the mysteriously strong sideband signal (at ), attesting to a strong pulsed flux at X-ray/n � nspin orb
EUV/UV wavelengths. DW Cnc is a new member of this class, and would be an excellent target for extendedobservation at these wavelengths.
1. INTRODUCTION
DW Cancri is a little-studied cataclysmic variable, discov-ered in the Byurakan blue-galaxy survey and identified as aCV from its Balmer emission lines (Stepanian 1982; Kopylovet al. 1988). Uemura et al. (2002) reported kilosecond quasi-periodic oscillations, centered on 37 and 73 minutes. Rodri-guez-Gil et al. (2004, hereafter RGAC) reported a radial-ve-locity period in the range 77–86 minutes, and suggestedphotometric periods near 38 and 77 minutes, although theirdata were severely plagued by aliases.
The curious light curves in the Uemura et al. study launchedDW Cnc as a high-priority target for our global network oftelescopes, the Center for Backyard Astrophysics (CBA; Skill-man & Patterson 1993). We invested many nights in 2002–2004, studying the star with CBA photometry, along with con-
2 Department of Physics and Astronomy, Dartmouth College, 6127 WilderLaboratory, Hanover, NH 03755; [email protected].
3 Center for Backyard Astrophysics (Belgium), Walhostraat 1A, B-3401Landen, Belgium; [email protected].
4 Center for Backyard Astrophysics (Flagstaff), Braeside Observatory, PostOffice Box 906, Flagstaff, AZ 86002; [email protected].
5 Department of Physics, King’s University College, 9125 50th Street, Ed-monton, AB T5H 2M1, Canada; [email protected].
6 Department of Physical Science, Arkansas Tech University, 1701 NorthBoulder Avenue, Russellville, AR 72801; [email protected], [email protected].
7 Joint Astronomy Centre, University Park, 660 North Ao`hoku Place, Hilo,HI 96720; [email protected].
8 Center for Backyard Astrophysics (Norwich), 35 Sergeants Way, Lisbon,CT 06351; [email protected].
temporaneous spectroscopy. In this paper we report the results,which certify DW Cnc as a new member of the DQ Herculis(intermediate polar) class of cataclysmic variables.
2. PHOTOMETRY
2.1. Campaign and Light Curves
We obtained time-series photometry of DW Cnc for a totalof 454 hr over 90 nights in 2002–2004. About half the datawere acquired through filters (U, V, I) on the MDM 1.3 mtelescope, and about half at several CBA observing stations(with the lion’s share from CBA–Belgium, CBA–Arkansas,CBA–Calgary, and Braeside Observatory). Some nights ofCBA observation used aV filter, but most were unfiltered (tomaximize signal-to-noise on this faint star). The primary com-parison stars used were 1�.9 east ( , ,V p 15.21 B�V p 0.68
) and 2�.5 west northwest ( ,V�R p 0.39 V p 12.70 B�V p, ; magnitudes from A. A. Henden 2004, pri-0.46 V�R p 0.30
vate communication) from DW Cnc. We found that aside fromsmall and measurable zero-point shifts, theV and unfilteredtime series were substantially the same, and could be splicedtogether for our main purpose, the study of periodic signals.The star also cooperated by remaining within∼0.1 mag of
throughout our observations. This appears to be theV p 14.8normal “bright state” of DW Cnc. The photometric observinglog is summarized in Table 1.
A typical night’s light curve is shown in the upper frame ofFigure 1. The light curve seems unremarkable for CVs, exceptthat the apparent flickering is of unusually large amplitude onboth long (∼1 hr) and short (seconds) timescales. Power spectraof individual nights show no stable features at high frequency
This content downloaded from 193.105.154.10 on Mon, 26 May 2014 19:35:24 PMAll use subject to JSTOR Terms and Conditions
RAPID OSCILLATIONS IN CATACLYSMIC VARIABLES. XVI. DW CANCRI 517
2004 PASP,116:516–526
TABLE 12002–2004Photometry
Telescope Observer Nights/hours
MDM 1.3 m . . . . . . . . . . . . . . . . . E. Armstrong, J. Kemp 32/167Braeside 0.4 m. . . . . . . . . . . . . . R. Fried 14/75CBA–Belgium 0.35 m . . . . . . T. Vanmunster 13/63CBA–Arkansas 0.4 m. . . . . . . T.Campbell, J. Robertson 11/49CBA–Norwich 0.25 m . . . . . . D.Messier 8/46CBA–Alberta 0.3 m . . . . . . . . . B. Martin 6/33Others . . . . . . . . . . . . . . . . . . . . . . . . 6/25
Fig. 1.—Top: Sample light curve of DW Cnc.Bottom: Nightly averagepower spectrum, the incoherent sum over the 10 longest nights.
Fig. 2.—Top: Power spectrum of a 23 night light curve in 2003, showingthree signals with their frequencies (�0.006 c/d) flagged by arrows.Bottom:Power spectrum of the residuals, after these signals are removed. Only apossible very weak signal near 16 c/d remains; the arrow points to the “orbital”frequency identified by spectroscopy.
(out to 0.2 Hz), but consistent peaks near 37 and 21 c/d.9 Infact, most of the variance at low frequency comes from thepresence of these signals, which turn out to be very stable. Themean nightly power spectrum—the incoherent sum over the10 longest and best nights—is shown in the lower frame ofFigure 1. The continuum power in this figure followsP(n) ∼
, a rather flat distribution for a CV (exponents of�1.5 to�1.1n
�2.2 are the rule).
2.2. Periodic Signals
Since the campaign is long and the data span a large rangein terrestrial longitude, we are able to detect periodic signalswith great sensitivity and (substantial) freedom from aliases.So we spliced the data in various convenient clusters, and an-alyzed them for periodic content by calculating the power spec-tra of these clusters. The interval of densest coverage was in2003 February (JD 671–693), and the power spectrum is shownin the upper frame of Figure 2. Very powerful signals are seenat 20.595 and 37.321(6) c/d, and another significant signal at12.993(7) c/d. Each signal is essentially sinusoidal to withinlimits of measurement, since no harmonics are detected; indeed,there are no other periodic signals at all (to a semiamplitudeupper limit ∼0.01 mag) out to 300 c/d. After “pre-whitening”the data by subtracting these three best-fitting sinusoids, wecalculated the power spectrum of the residual time series. Theresult, seen in the lower frame of Figure 2, shows only a weakand broad bump near 16 c/d.
We repeated this analysis for five other clusters, with basi-cally similar results. An example is the 2002 December cluster(JD 613–622), seen in Figure 3. After subtraction of the twoobvious signals, we obtained the power spectrum seen in thelower frame. In the latter case, however, we “cleaned” thepower spectrum by removing the alias pattern of the two can-didate signals, at 12.99 and 16.80(2) c/d. These signals are tooweak to be considered secure, but the one at the lower fre-quency acquires some extra credibility by its agreement withthe secure detection in Figure 2.
We calculated times of minimum light in each detected pe-
9 In this paper we use the old-style “c/d” notation as a shorthand for cyclesday�1. Likewise, we frequently use atruncated HJD date, namely HJDp
.HJD� 2,452,000
This content downloaded from 193.105.154.10 on Mon, 26 May 2014 19:35:24 PMAll use subject to JSTOR Terms and Conditions
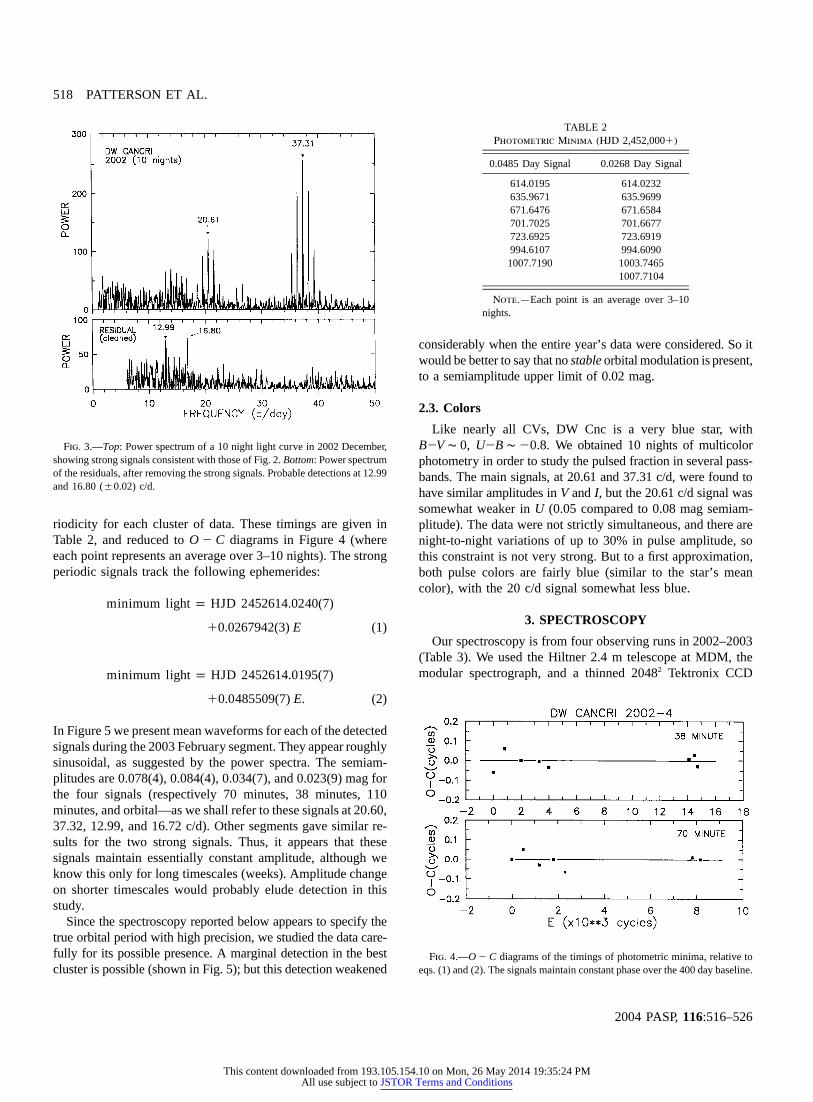
Fig. 3.—Top: Power spectrum of a 10 night light curve in 2002 December,showing strong signals consistent with those of Fig. 2.Bottom: Power spectrumof the residuals, after removing the strong signals. Probable detections at 12.99and 16.80 (�0.02) c/d.
Fig. 4.— diagrams of the timings of photometric minima, relative toO � Ceqs. (1) and (2). The signals maintain constant phase over the 400 day baseline.
riodicity for each cluster of data. These timings are given inTable 2, and reduced to diagrams in Figure 4 (whereO � Ceach point represents an average over 3–10 nights). The strongperiodic signals track the following ephemerides:
minimum lightp HJD 2452614.0240(7)
�0.0267942(3)E (1)
minimum lightp HJD 2452614.0195(7)
�0.0485509(7)E. (2)
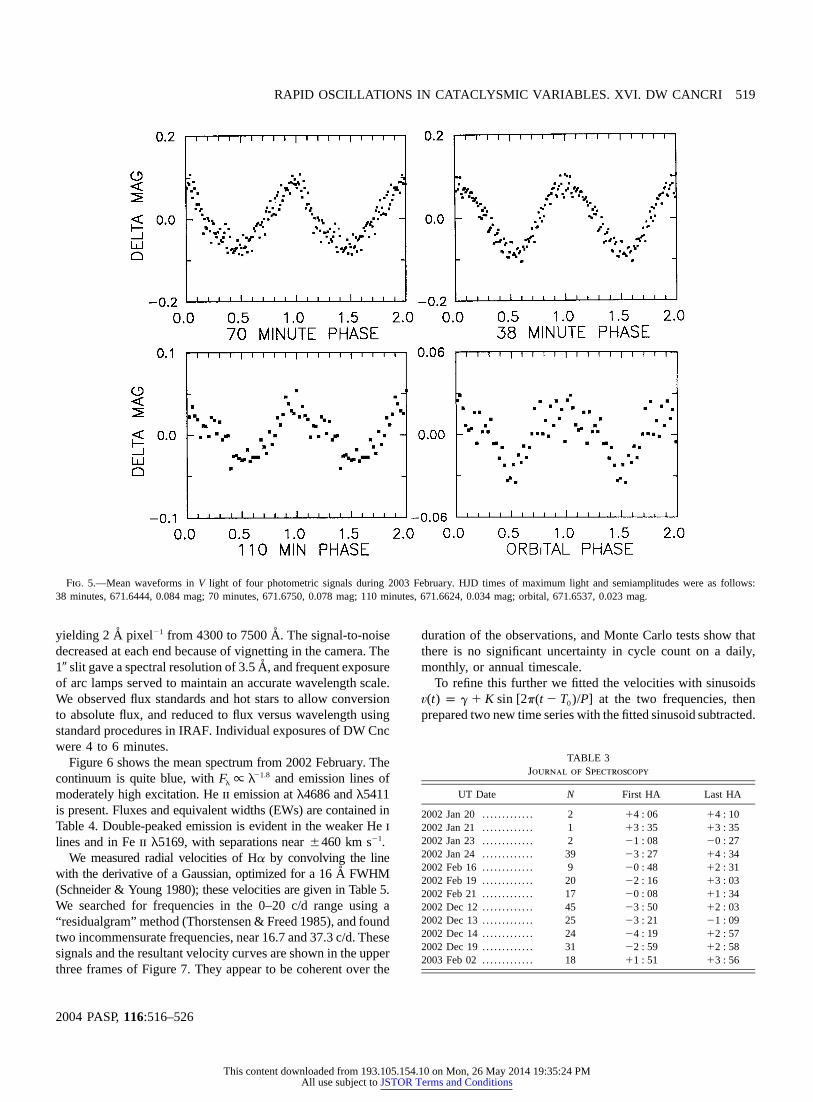
In Figure 5 we present mean waveforms for each of the detectedsignals during the 2003 February segment. They appear roughlysinusoidal, as suggested by the power spectra. The semiam-plitudes are 0.078(4), 0.084(4), 0.034(7), and 0.023(9) mag forthe four signals (respectively 70 minutes, 38 minutes, 110minutes, and orbital—as we shall refer to these signals at 20.60,37.32, 12.99, and 16.72 c/d). Other segments gave similar re-sults for the two strong signals. Thus, it appears that thesesignals maintain essentially constant amplitude, although weknow this only for long timescales (weeks). Amplitude changeon shorter timescales would probably elude detection in thisstudy.
Since the spectroscopy reported below appears to specify thetrue orbital period with high precision, we studied the data care-fully for its possible presence. A marginal detection in the bestcluster is possible (shown in Fig. 5); but this detection weakened
considerably when the entire year’s data were considered. So itwould be better to say that nostable orbital modulation is present,to a semiamplitude upper limit of 0.02 mag.
2.3. Colors
Like nearly all CVs, DW Cnc is a very blue star, with, . We obtained 10 nights of multicolorB�V ∼ 0 U�B ∼ �0.8
photometry in order to study the pulsed fraction in several pass-bands. The main signals, at 20.61 and 37.31 c/d, were found tohave similar amplitudes inV andI, but the 20.61 c/d signal wassomewhat weaker inU (0.05 compared to 0.08 mag semiam-plitude). The data were not strictly simultaneous, and there arenight-to-night variations of up to 30% in pulse amplitude, sothis constraint is not very strong. But to a first approximation,both pulse colors are fairly blue (similar to the star’s meancolor), with the 20 c/d signal somewhat less blue.
3. SPECTROSCOPY
Our spectroscopy is from four observing runs in 2002–2003(Table 3). We used the Hiltner 2.4 m telescope at MDM, themodular spectrograph, and a thinned 20482 Tektronix CCD
This content downloaded from 193.105.154.10 on Mon, 26 May 2014 19:35:24 PMAll use subject to JSTOR Terms and Conditions
RAPID OSCILLATIONS IN CATACLYSMIC VARIABLES. XVI. DW CANCRI 519
2004 PASP,116:516–526
Fig. 5.—Mean waveforms inV light of four photometric signals during 2003 February. HJD times of maximum light and semiamplitudes were as follows:38 minutes, 671.6444, 0.084 mag; 70 minutes, 671.6750, 0.078 mag; 110 minutes, 671.6624, 0.034 mag; orbital, 671.6537, 0.023 mag.
yielding 2 A pixel�1 from 4300 to 7500 A˚ . The signal-to-noisedecreased at each end because of vignetting in the camera. The1� slit gave a spectral resolution of 3.5 A˚ , and frequent exposureof arc lamps served to maintain an accurate wavelength scale.We observed flux standards and hot stars to allow conversionto absolute flux, and reduced to flux versus wavelength usingstandard procedures in IRAF. Individual exposures of DW Cncwere 4 to 6 minutes.
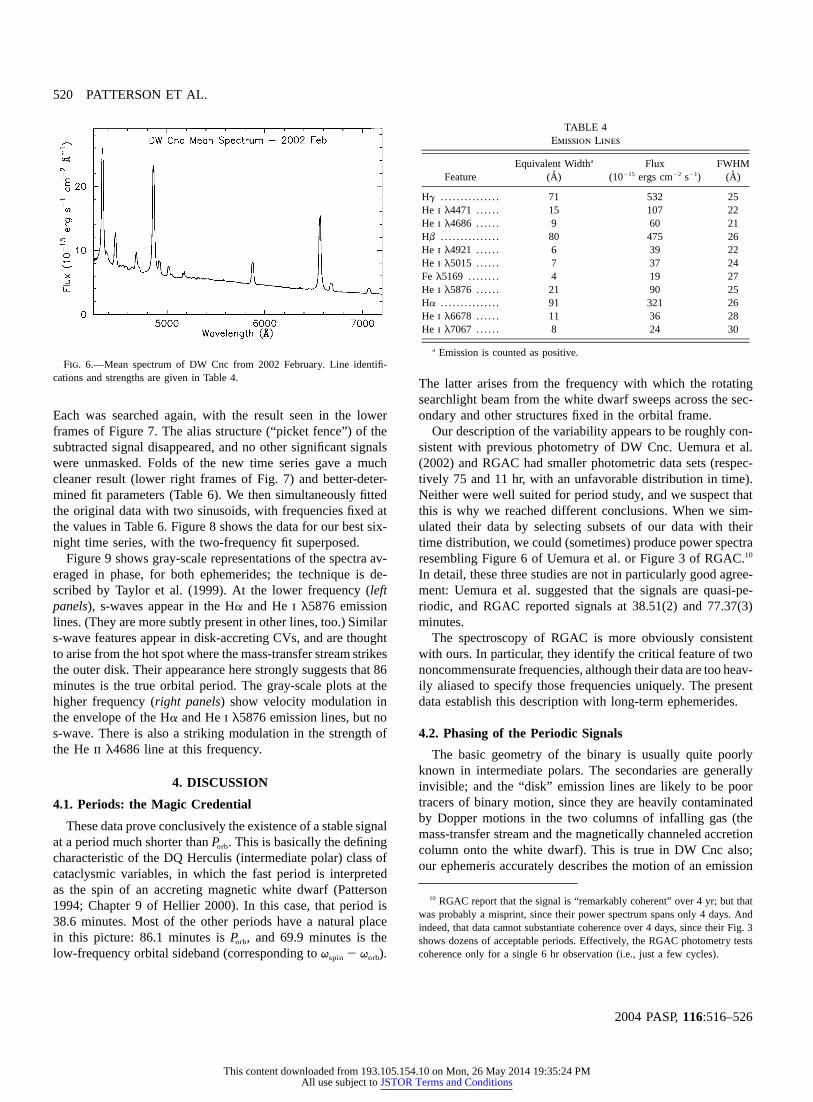
Figure 6 shows the mean spectrum from 2002 February. Thecontinuum is quite blue, with and emission lines of�1.8F ∝ ll
moderately high excitation. Heii emission atl4686 andl5411is present. Fluxes and equivalent widths (EWs) are contained inTable 4. Double-peaked emission is evident in the weaker Heilines and in Feii l5169, with separations near�460 km s�1.
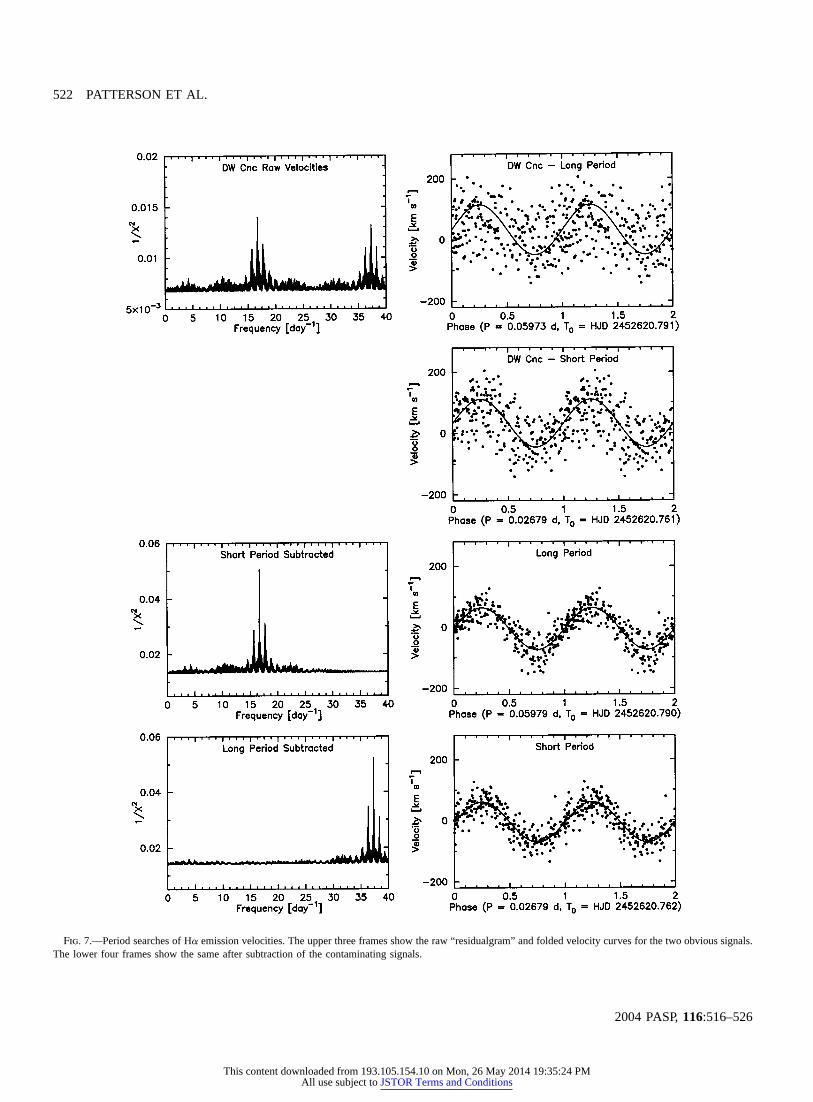
We measured radial velocities of Ha by convolving the linewith the derivative of a Gaussian, optimized for a 16 A˚ FWHM(Schneider & Young 1980); these velocities are given in Table 5.We searched for frequencies in the 0–20 c/d range using a“residualgram” method (Thorstensen & Freed 1985), and foundtwo incommensurate frequencies, near 16.7 and 37.3 c/d. Thesesignals and the resultant velocity curves are shown in the upperthree frames of Figure 7. They appear to be coherent over the
duration of the observations, and Monte Carlo tests show thatthere is no significant uncertainty in cycle count on a daily,monthly, or annual timescale.
To refine this further we fitted the velocities with sinusoidsat the two frequencies, thenv(t) p g � K sin [2p(t � T )/P]0
prepared two new time series with the fitted sinusoid subtracted.
This content downloaded from 193.105.154.10 on Mon, 26 May 2014 19:35:24 PMAll use subject to JSTOR Terms and Conditions
Each was searched again, with the result seen in the lowerframes of Figure 7. The alias structure (“picket fence”) of thesubtracted signal disappeared, and no other significant signalswere unmasked. Folds of the new time series gave a muchcleaner result (lower right frames of Fig. 7) and better-deter-mined fit parameters (Table 6). We then simultaneously fittedthe original data with two sinusoids, with frequencies fixed atthe values in Table 6. Figure 8 shows the data for our best six-night time series, with the two-frequency fit superposed.
Figure 9 shows gray-scale representations of the spectra av-eraged in phase, for both ephemerides; the technique is de-scribed by Taylor et al. (1999). At the lower frequency (leftpanels), s-waves appear in the Ha and Hei l5876 emissionlines. (They are more subtly present in other lines, too.) Similars-wave features appear in disk-accreting CVs, and are thoughtto arise from the hot spot where the mass-transfer stream strikesthe outer disk. Their appearance here strongly suggests that 86minutes is the true orbital period. The gray-scale plots at thehigher frequency (right panels) show velocity modulation inthe envelope of the Ha and Hei l5876 emission lines, but nos-wave. There is also a striking modulation in the strength ofthe Heii l4686 line at this frequency.
4. DISCUSSION
4.1. Periods: the Magic Credential
These data prove conclusively the existence of a stable signalat a period much shorter than . This is basically the definingPorb
characteristic of the DQ Herculis (intermediate polar) class ofcataclysmic variables, in which the fast period is interpretedas the spin of an accreting magnetic white dwarf (Patterson1994; Chapter 9 of Hellier 2000). In this case, that period is38.6 minutes. Most of the other periods have a natural placein this picture: 86.1 minutes is , and 69.9 minutes is thePorb
low-frequency orbital sideband (corresponding to ).q � qspin orb
The latter arises from the frequency with which the rotatingsearchlight beam from the white dwarf sweeps across the sec-ondary and other structures fixed in the orbital frame.
Our description of the variability appears to be roughly con-sistent with previous photometry of DW Cnc. Uemura et al.(2002) and RGAC had smaller photometric data sets (respec-tively 75 and 11 hr, with an unfavorable distribution in time).Neither were well suited for period study, and we suspect thatthis is why we reached different conclusions. When we sim-ulated their data by selecting subsets of our data with theirtime distribution, we could (sometimes) produce power spectraresembling Figure 6 of Uemura et al. or Figure 3 of RGAC.10
In detail, these three studies are not in particularly good agree-ment: Uemura et al. suggested that the signals are quasi-pe-riodic, and RGAC reported signals at 38.51(2) and 77.37(3)minutes.
The spectroscopy of RGAC is more obviously consistentwith ours. In particular, they identify the critical feature of twononcommensurate frequencies, although their data are too heav-ily aliased to specify those frequencies uniquely. The presentdata establish this description with long-term ephemerides.
4.2. Phasing of the Periodic Signals
The basic geometry of the binary is usually quite poorlyknown in intermediate polars. The secondaries are generallyinvisible; and the “disk” emission lines are likely to be poortracers of binary motion, since they are heavily contaminatedby Dopper motions in the two columns of infalling gas (themass-transfer stream and the magnetically channeled accretioncolumn onto the white dwarf). This is true in DW Cnc also;our ephemeris accurately describes the motion of an emission
10 RGAC report that the signal is “remarkably coherent” over 4 yr; but thatwas probably a misprint, since their power spectrum spans only 4 days. Andindeed, that data cannot substantiate coherence over 4 days, since their Fig. 3shows dozens of acceptable periods. Effectively, the RGAC photometry testscoherence only for a single 6 hr observation (i.e., just a few cycles).
This content downloaded from 193.105.154.10 on Mon, 26 May 2014 19:35:24 PMAll use subject to JSTOR Terms and Conditions
a Heliocentric JD of mid-integration minus 2,452,000.b Heliocentric Ha velocity (km s�1).
line, but we do not know what that implies about the truedynamical motions of the stars.
The geometry of the spin pulse can also be complex. Hellier(1997) summarizes the available data. Of the five intermediatepolars (IPs) with radial-velocity variations at , two (AO PscPspin
and FO Aqr) show maximum blueshift at maximum light, asexpected in the simplest interpretation of this component (aris-ing from infalling gas onto the “back pole”; see Kim & Beuer-mann 1995). The other three (EX Hya, BG CMi, PQ Gem) failto obey this simple relation. DW Cnc appears to join the mis-creants in this respect, showing maximum blueshift 0.27�
cycles before maximum light.0.05Thus, without additional assumptions that we are unwilling
to make, the observed phase information does not yet constrainthe binary and accretion geometries. A secure measurement oftrue orbital motion would help a great deal, as would a detectionof the spin pulse in X-rays.
4.3. Distance and Luminosity
Little information is available concerning the star’s distance.Cataclysmic variables tend to follow an empirical law relating
to (Figs. 5 and 7 of Patterson 1984), but DW Cnc isM PV orb
unusual because it is magnetic. It is probably wiser to comparewith the one star it most closely resembles: EX Hya, the onlyother short-period magnetic CV with a long . A recentPspin
This content downloaded from 193.105.154.10 on Mon, 26 May 2014 19:35:24 PMAll use subject to JSTOR Terms and Conditions
Fig. 7.—Period searches of Ha emission velocities. The upper three frames show the raw “residualgram” and folded velocity curves for the two obvious signals.The lower four frames show the same after subtraction of the contaminating signals.
This content downloaded from 193.105.154.10 on Mon, 26 May 2014 19:35:24 PMAll use subject to JSTOR Terms and Conditions
Note—Parameters of least-squares sinusoids of the form , fitted to thev(t) p g � K sin [2p(t � T )/P]0
233 Ha velocities. The last two lines are from a fit in which sinusoids at the two frequencies were fittedsimultaneously, sog andj are common to the two fits.
a Heliocentric JD minus 2,400,000.
Hubble Space Telescope parallax puts EX Hya at 65 pc, im-plying (Beuermann et al. 2003). Since DW Cnc isM p 8.8V
another magnetic CV of short and long , we mightP Porb spin
expect a similar , suggesting a distance of∼200 pc. As-MV
suming a “bolometric” correction appropriate to its color(∼1.2 mag), the luminosity in the high state would0.1� 1.0m
be , where is its distance in units32 �1 24 # 10 ergs s (d ) d200 200
of 200 pc.
4.4. He ii Emission and the X-Ray Searchlight
DW Cnc shows fairly strong Heii l4686 emission( A), which is sometimes used as an identifier of mag-EW ∼ 9netic CVs. But caution is needed on this point. Heii emissionis rare in dwarf novae, and common in nova-like variables (say,at the level of A; see Fig. 5 of Patterson & RaymondEW ∼ 3–81985). Stronger emission (say, A˚ ) is generally limitedEW 1 10to magnetic CVs and stars of very high (the supersofts). ItMis worth exploring why. The origin of the line is very likelyphotoionization, and thus it mainly testifies to an abundanceof X-ray/EUV photons (with energy above 54 eV). This impliesa high-temperature region ( K). Now, in the blackbody5T 1 10approximation,T scales as , whereL is the accretion1/4(L/f )luminosity andf is the fraction of white-dwarf area that isradiating. So highT can be achieved with high luminosity (high
) or with a very smallf. Supersofts choose the former route.MA small f is most readily achieved with a magnetic field thatchannels accretion flow to a very small area around the mag-netic pole. This is the main reason11 that magnetic CVs con-sistently sport strong Heii emission even whenL and areMquite modest.
But with A, and with emission∼10EW(l4686)∼ 9 Hb
times stronger, DW Cnc is only of moderately high excitation,not quite in the realm of the well-established magnetic CVs.The much more salient credential is the stable fast period. And
11 Not the only reason. Hard X-rays, usually present in equal or greatersupply, also contribute; but they are relatively inefficient ionizers of helium(since they waste much more energy per photon).
the presence of a large-amplitude signal at (i.e., theq � qspin orb
70 minute period) is perhaps the most compelling credentialof all.
Why? The reason is that the 70 minute signal is of largeamplitude, nearly as strong as the 38 minute signal that pre-sumably drives it. That can only mean that the 38 minute signalis very powerful indeed. The sideband signal must arise fromreprocessing in nonaxisymmetric structures that orbit the whitedwarf at exactly . The latter are most simply described asPorb
“the secondary,” so let us adopt that assumption. Now, in Rochegeometry the secondary subtends a solid angle of∼3% of
sr at the white dwarf, so only a few percent of white-dwarf4p
luminosity can be reprocessed in the secondary. This ineffi-ciency is basically why “reflection effects” in the secondaryare only rarely seen in CV light curves.
Thus, sideband signals are generally expected to be quiteweak, contrary to observation in DW Cnc. There are a fewrescue strategies that could be considered.
1. Beaming: maybe the white-dwarf radiation illuminates thesecondary powerfully, but illuminates terrestrial observersquite weakly.
2. Maybe the absorbing fraction is much higher than 3%.Another discrete structure that orbits with can be the mass-Porb
transfer stream, or more specifically the “hot spot” where thestream impacts the accretion disk. The hot-spot size is not wellconstrained, but could possibly subtend as much as 15% of
sr.4p
3. Maybe the bolometric luminosity of the white dwarf’s 38minute signal is very high, due to the presence of hithertounseen EUV and X-ray flux.
Each of these excuses could play a role. There is not muchto say about (1), since none of the relevant angles are knownfor this binary. Possibly (2) plays some role, but even 15% isstill inadequate, as we will see below. The dominant expla-nation is likely to be (3). And this is very plausible, sinceaccretion onto a magnetic white dwarf is predominantly radial,and high temperatures are generally achieved in radial accretion
This content downloaded from 193.105.154.10 on Mon, 26 May 2014 19:35:24 PMAll use subject to JSTOR Terms and Conditions
Fig. 8.—Ha radial velocities from the six nights of longest coverage. Each frame covers the same time interval.
flow. There must be a powerful UV/EUV/X-ray searchlightassociated with that 38 minute signal.
More specifically, a minimum luminosity in the 70 minutesignal can be estimated by assuming a pulsed fraction of 100%,and a bolometric correction of zero. In this case we obtain
ergs s�1. More plausibly, let us assume31 2L p 2 # 10 (d )70 200
that the 70 minute signal is actually 50% pulsed,12 with a bo-lometric correction near 0.5 mag. This impliesL ∼ 6 #70
ergs s�1. In order to power this with a prograde31 210 (d )200
searchlight at minutes, with a generous assumptionP p 38spin
of 15% reprocessing, we probably need a searchlight∼7 timesstronger, or ergs s�1.32 2L ∼ 4 # 10 (d )38 200
Hard X-rays are a plausible choice for the powering search-light. The only X-ray observation is in theROSAT All-SkySurvey, in which the star appears to be detected at 0.34�
counts s�1. For an unabsorbed 10 keV spectrum, typical0.12
12 We do not know the true pulse fraction. It must be at least 16%, becausethat is observed. And it is probably not very close to 100%, because that ishard to achieve with a highly sinusoidal waveform. So∼50% is a plausibleand simple choice.
of CVs in general, this corresponds to a 1–10 keV flux of, or ergs s�1.�12 �2 �1 31 29 # 10 ergs cm s L p 5 # 10 (d )X 200
Intermediate polars commonly show a fairly large absorptionfrom cool gas near the emission site; assumingN p 2 #H
, we obtain ergs s�1.21 �2 32 210 cm L (1 � 10 keV)p 10 (d )X 200
This is somewhat of an upper limit; ignoring uncertainties ofsource variability, a hard X-ray source much brighter than thiswould have been detected by the all-sky surveys of the 1970s(HEAO-1, HEAO-2).
The other strong candidate for the searchlight is theL38
component in the ultraviolet. Again assuming a pulsed fractionof 50%, but with a bolometric correction of 1.5 mag (since the
component appears to be slightly bluer than the star’s meanL38
color, whereas the component is slightly redder), we obtainL 70
ergs s�1. Thus, we get a likely optical/32 2L p 1.5# 10 (d )38 200
RAPID OSCILLATIONS IN CATACLYSMIC VARIABLES. XVI. DW CANCRI 525
2004 PASP,116:516–526
Fig. 9.—Montage of gray-scale representations of phase-averaged spectra. The vertical axes show phase increasing vertically, and the horizontal axes arewavelength in A˚ . Left and right panels are respectively folded on the long (86.1 minute) and short (38.6 minute) period. The top panels show the region aroundHb, He ii l4686, Hei ll4922 and 5015, and Fei l5169; the middle panels show Hei l5876; the bottom panels show Ha. Gray scales are selected to maximizevisibility of the periodic features.
This content downloaded from 193.105.154.10 on Mon, 26 May 2014 19:35:24 PMAll use subject to JSTOR Terms and Conditions
the “secondary” (where we use this term to denote “mass donorplus hot spot”), which could be considered optimistic. It isobvious that the searchlight powers the signal, but weL L38 70
do not yet understand the energetics of this.13
5. SUMMARY
1. We establish strictly periodic signals at 38.6 and 86.1minutes in the radial velocities of DW Cnc. The presence ofstable noncommensurate frequencies is a strong credential—almost adefining credential—for membership in the DQ Her(intermediate polar) class of cataclysmic variables.
2. Time-series photometry reveals strictly periodic 38.6 and69.9 minute periodic signals that maintain a constant phaseover the 1 year baseline of measurement. The three frequenciesfollow a simple relation , to(1/69.9)p (1/38.6)� (1/86.1)within limits to measurement. This is a well-known hallmarkof the DQ Her class, and suggests that 86.1 minutes should beregarded as , 38.6 minutes as , and 69.9 minutes as theP Porb spin
“reprocessing” period (lower orbital sideband). Ephemeridesfor all three signals have an expiration date around 2006.
13 An obvious candidate is a strong EUV component, seen in a few inter-mediate polars (Haberl & Motch 1995). These are normally very weak in CVs,but stars with magnetic channeling can easily have smallf and therefore highT—high enough to ionize helium and thereby avoid the edges that normallyquench the emission. This is definitely worth a search.
3. The existence of so strong a signal (0.16 mag full am-plitude) at 70 minutes implies a strong “searchlight” signal at38 minutes sweeping over the parts of the binary fixed in theorbital frame (secondary, mass-transfer stream). This is likelyto be powered in part by a pulsed hard X-ray source (with
ergs s�1), but most of the searchlight’s power32 2L ∼ 10 (d )X 200
probably appears at UV and EUV wavelengths. Since all ofthese bandpasses are unexplored, searches for this componentare very desirable!
4. There is also some evidence for a weak periodic signalat 110.85(9) minutes. This does not seem related to any of theother clocks in the binary, and we leave it as an unsolvedproblem.
We acknowledge financial support from NSF (AST-00-98254) and NASA (NNG04GA83G), and thank Jerry Foote,Thomas Krajci, Donn Starkey, and David Skillman for con-tributions to the photometry campaign. We dedicate this paperto our dear friend and colleague Bob Fried, who died on 13November 2003 while piloting his plane to a remote airstripin Black Canyon, AZ, on one of his many “Angel Flight” tripsto transport needy people for medical help. Bob was one ofthe most charismatic amateur astronomers in the world, and alegend in the world of variable stars. This paper was one ofhis last major projects, although his data were widely availableto the astronomical community, and will surely be appearingin scientific journals for many years to come.
REFERENCES
Beuermann, K., Harrison, T. E., McArthur, B. E., Benedict, G. F., &Gansicke, B. T. 2003, A&A, 412, 821
Haberl, F., & Motch, C. 1995, A&A, 297, L37Hellier, C. 1997, MNRAS, 288, 817———. 2000, Cataclysmic Variable Stars: How and Why They Vary
(London: Springer-Verlag)Kim, Y., & Beuermann, K. 1995, A&A, 298, 165Kopylov, I. M., et al. 1988, Astrofizika, 28, 287Patterson, J. 1984, ApJS, 54, 443———. 1994, PASP, 106, 209
Patterson, J., & Raymond, J. C. 1985, ApJ, 292, 550Rodriguez-Gil, P., Gaensicke, B. T., Araujo-Betancor, S., & Casares,
J. 2004, MNRAS, 349, 367Schneider, D., & Young, P. J. 1980, ApJ, 240, 871Skillman, D. R., & Patterson, J. 1993, ApJ, 417, 298Stepanian, J. A., 1982, Perem. Zvesdy, 21, 691Taylor, C. J., Thorstensen, J. R., & Patterson, J. 1999, PASP, 111, 184Thorstensen, J. R., & Freed, I. 1985, AJ, 90, 2082Uemura, Y., et al. 2002, PASJ, 54, 299
This content downloaded from 193.105.154.10 on Mon, 26 May 2014 19:35:24 PMAll use subject to JSTOR Terms and Conditions


![Dw Manual [eBook]](https://static.documents.pub/doc/80x56/55cf9d9c550346d033ae5f9c/dw-manual-ebook.jpg)


