Here, for the first time, we developed Raman spectroscopy in combination with chemometrics for the quanti-fication of adulteration of fresh coconut water by dilution, and its masking with sugars. Coconut water wasextracted from young Costa Rican coconuts and heat treated to emulate pasteurization. Samples were thenadulterated by dilution with water and single sugars, mixtures of sugars, and high-fructose corn syrup (HFCS). Atotal of 155 samples were analysed with Raman spectroscopy at 785 nm excitation and 620 spectra analysedwith chemometrics. Results showed successful quantification of dilution and adulteration with single sugarsbetween 1.9 and 2.6%, masking of dilution with mixtures of sugars at 9.8%, and masking of dilution with HFCSat 7.1%. It can be concluded that Raman spectroscopy has significant potential as a rapid accurate analyticalmethod for the detection of adulteration in this product, with the ability to discern small abnormalities in sugarratios within coconut water.
1. Introduction
The tropical coconut palm (Cocos nucifera L.) has played an im-portant role in the mobility of humans across different geographicalregions of the globe as a source of food, water, and multiple other uses(Loiola et al., 2016), said to be unparalleled in the plant kingdom(Gunn, Baudouin, & Olsen, 2011). Whilst all parts of this plant havebeen put to an especially wide variety of uses for millennia, it is theliquid endosperm of the coconut, commonly referred to as coconutwater, which is the subject of our study here. Fresh coconut water is arefreshing and nutritious drink typically extracted from immature co-conuts of 6–9months of age (Rolle, 2007). This is due to the fact that ascoconuts mature their composition and physicochemical propertiesalter (Tan, Cheng, Bhat, Rusul, & Easa, 2014), with the white kernellining the inner shell becoming opaque and hardening. While the co-conut water in the centre decreases in volume and sugar content (Child& Nathanael, 1950), undergoes alterations in sugar ratios, as well asincreases in pH, turbidity and mineral content with a resultant loss oftaste and quality (Tan et al., 2014). The nutrient content of coconutwater has also been central to several studies (Santoso, Kubo, Ota,Tadokoro, & Maekawa, 1996; USDA, 2016a) (Table 1) as have its hy-dration properties.
However, it is the perceived and promoted health benefits of co-conut products (DebMandal & Mandal, 2011) and packaged coconut
water in particular, that could be said to be responsible for its hugeincrease in popularity and sales in recent years (Kaplan, 2017). Thesehealth claims are wide-ranging; from its effectiveness (Kalman,Feldman, Krieger, & Bloomer, 2012), or not (Peart, Hensby, & Shaw,2017), as a sports energy drink, its vitamin B and C content (USDA,2016b), potential for the treatment of hypertension (Bhagya, Prema, &Rajamohan, 2012) and high cholesterol, through to multiple claimedmedical properties including hypoglycemic and antioxidant effects(Bispo et al., 2017), as well as antimicrobial (Mandal et al., 2009),antiviral, antiparasitic, antidermatophytic, hepatoprotective and im-munostimulant properties (DebMandal & Mandal, 2011). The relativelyrecent explosion in popularity of coconut water as a packaged drink inthe last five years is well evidenced, with the global market for coconutwater reaching $2.2 billion in 2016, up from $533 million in2011(Kaplan, 2017). In the UK for example, 40 different brands arecurrently available, and it has increased in value as a product by 20times since 2012 with consumption levels of 0.21 L per capita, threetimes that of the USA (Glotz, 2016b).
This relatively sudden and increased visibility on supermarketshelves prompted us to consider this product as vulnerable to, and apotential target of, adulteration. It is also well known that productssuch as these have known vulnerabilities to a variety of opportunisticbehaviours and illicit practises, such as dilution with water, followed bythe attempted masking of dilution with the addition of sugars, or
https://doi.org/10.1016/j.foodchem.2018.08.038Received 11 January 2018; Received in revised form 7 August 2018; Accepted 8 August 2018
straightforward sugar adulteration in a product whose label may stateno-added sugars etc. Moreover, when the huge demand for a productonly normally available from immature coconuts of a specific age rangeand sources (five countries worldwide (Glotz, 2017)) has the potentialto outstrip supply, this can also lead to these supply networks becomingsignificantly more vulnerable to fraud.
Several methods have been used to analyse coconut water for var-ious purposes, including nuclear magnetic resonance (NMR) spectro-scopy with chemometrics to monitor process quality parameters, suchas glucose and sucrose levels (Sucupira et al., 2017), characterisation ofthe volatile profiles (aroma) from multiple varieties using headspacesolid phase microextraction gas chromatography (HS-SPME-GC)(Prades, Assa, Dornier, Pain, & Boulanger, 2012), simultaneous analysisof different classes of phytohormones with high performance liquidchromatography (HPLC) and liquid chromatography mass spectrometry(Ma et al., 2008). And monitoring the physicochemical degradation ofcoconut water (including sugars) using an electrospray ionisation (ESI)source combined with Fourier transform ion cyclotron resonance massspectrometry (FT-ICR MS) (Costa et al., 2015). The common problemwith all these techniques is that they are time-consuming and ex-pensive, as well as requiring extensive sample preparation, and can notreadily be employed on site. Conversely, vibrational spectroscopy(which includes near (NIR), mid-infrared (MIR) and Raman) are agroup of techniques that are rapid, require minimal sample preparation,and are relatively inexpensive when compared to mass spectrometryand chromatographic approaches. Vibrational spectroscopies also havethe potential for portable on-site analysis via handheld or at-linespectrometers.
Here, for the first time, Raman spectroscopy in combination withchemometrics has been used for the analysis of fresh coconut water toestablish the feasibility of a vibrational spectroscopic approach in de-tecting intentional adulteration. Adulteration was undertaken withdeionised water (dilution) as well as the addition of incremental vo-lumes of sucrose, fructose, glucose, and mixtures of these sugars, as wellas high fructose corn syrup (HFCS). These sugars could be used illicitlyin order to mask dilution, or added to affect the flavour of coconutwater products labelled as fresh, natural, pure, no-added sugar etc.(Glotz, 2017), when they are nothing of the sort, an issue observed inother fruit juices previously (Rodriguez-Saona, Fry, McLaughlin, &Calvey, 2001).
2. Materials and methods
2.1. Stock solution
Seven young coconuts (6–9months maturity) of Costa Rican originwere purchased from a UK-based online retailer. The juice was thenextracted using a specialised Cocodrill® purchased from the same re-tailer, centrifuged at 18,000 g, for 10min at 4 °C and pooled together tocreate a consistent stock solution. Our coconut water solution had a pH
of 5.33 and a Brix value of 6.4°. This pooled stock solution was thenstored at −80 °C in 45mL aliquots until required. Prior to use, thecoconut water from the stock solution was thawed at room temperatureand divided into 1mL aliquots, which were then heat-treated using aTechne Dri-Block DB-3A (Cole-Parmer, Stone, Staffordshire, UK) hot-plate for 150 s at 70 °C, to emulate pasteurisation, recombined andcooled in a refrigerator at 5 °C. Heat-treated aliquots were used for amaximum of three days after being thawed. D-glucose anhydrous, D-sucrose (for biochemistry 99%, RNAse and DNAse free) and D-(-)-fructose ≥99% were purchased from Fisher Scientific (FisherScientific Ltd., UK), Acros Organics (Acros Organics, Belgium) andSigma-Aldrich (Sigma-Aldrich Chemie GMBH, Germany) respectively.
2.2. Standard addition method
Solutions of sucrose (5.984 g), glucose (5.990 g) and fructose(6.010 g) were each dissolved in 50mL water (120mg·mL−1). Sampleswere made up by spiking 250 µL aliquots of coconut water with variousvolumes of sugar solution ranging from 25 µL to 250 µL, increasing in25 µL increments, and filling each sample to a final volume of 500 µLwith deionised water. Unadulterated coconut water was used as a ne-gative control. A total of 31 samples were analysed using 4 machinereplicates, resulting in a total of 124 spectra for this experiment. Samplecontents are shown in Table S1.
2.3. Detection of adulteration
Stock solutions matching coconut water’s total sugar concentration(USDA, 2016b) obtained from the standard addition method were madeup by dissolving sucrose (3.171 g), glucose (3.150 g) and fructose(3.172 g) in 50mL deionised water (63mg·mL−1). Additionally, amixed sugar solution, matching a coconut water’s naturally occurringconcentration for each sugar, was made up by dissolving 1.347 g glu-cose, 1.220 g fructose and 0.582 g sucrose in 50mL deionised water(26.94 mg·mL−1 glucose, 24.40mg·mL−1 fructose, 11.64mg·mL−1 su-crose, 62.98mg·mL−1 total). Samples were made up by adulteratingcoconut water with deionised water, single sugar solutions, or themixed sugar solution in increasing ratios (5–100%, 5% increments),with 3 samples of unadulterated coconut water being used as controlsamples. In addition, adulteration with HFCS was investigated as this isalso a known and readily available alternative adulterant. A 1mL ali-quot of HFCS (Daesang America inc., Hackensack, USA) was dissolvedin 10mL water to reach a °Brix value of 6.4, matching that of coconutwater. °Brix was obtained using a Signstek ATC Brix Refractometer(Signstek, London, UK). Samples were prepared and analysed in amanner identical to that of the adulteration experiments with labora-tory grade sugars. For detection of adulteration, a total of 124 sampleswere analysed using 4 machine replicates, resulting in a total of 496spectra for this experiment. Adulteration ratios are presented in TableS2.
2.4. Raman spectroscopy
Aliquots (360 µL) of each sample were transferred onto a 96 wellquartz sampling plate. Raman spectra were collected using a RenishawinVia Raman spectrometer (Renishaw Plc. Gloucestershire, UK)equipped with a laser wavelength of 785 nm and an Olympus MD Plan10× 10 long distance objective (KeyMed (Medical & IndustrialEquipment) Ltd. Essex, UK). A 600 l/mm grating was used and the ac-quisition was centred at 1600 cm−1, leading to a range of 408 cm−1 to2579 cm−1 with 1015 bins. The optimal depth for maximum intensitywas found using a depth-series acquisition, and 4 machine replicateswere taken by acquiring a spectrum of each sample at optimal depthand 1, 2, and 3 µm closer using an automated system set up in-house.All spectra were collected as 6 accumulations and 10 s acquisition witha laser power of ∼30mW at each sample.
Table 1Typical water, macronutrient, and sugar contents offresh coconut water harvested at 6months from theUSDA National Nutrient Database (USDA, 2016a) andSantosa et al. (Santoso et al., 1996).
P.I.C. Richardson et al. Food Chemistry 272 (2019) 157–164
158
2.5. Data analysis
For the standard addition method, spectra were first subjected tomanual cosmic ray removal in the WiRe Raman software used to controlthe instrument. These were then imported into Matlab R2017a (TheMathWorks, Natick, USA) where they were subjected to baseline cor-rection using a partial least squares algorithm (based on an algorithmby Eilers (Eilers, 2003) and created as part of an in-house analysispackage) using a smoothing parameter of 10,000 and an asymmetryparameter of 0.001. These data were then imported into Microsoft Excel2013, where the intensity of peaks unique to glucose (1123 cm−1),fructose (627 cm−1) and sucrose (835 cm−1) were plotted against theconcentration of the sugar added. A least-squares linear fitting algo-rithm was used to generate a line of best fit, which was then used tocalculate the concentration of each sugar in coconut water using thefollowing equation:
=S Ia
[ ] 2 0
where S (Saxberg and Kowalski, 1979) is the concentration of sugar, I0is the y-intercept of the line of best fit, and a is the slope. The valueswere doubled to account for the 50% aqueous dilution.
For adulteration studies, spectra were subjected to manual cosmicray removal, imported into MatLab R2017a, and baseline-corrected asdescribed above, after which they were auto-scaled. Principal compo-nent analysis (PCA (Gromski et al., 2015) was used to reduce the di-mensionality of these data into uncorrelated principal components(PCs) and describe relationships between samples. Additionally, partialleast squares regression (PLSR (Gromski et al., 2015)) was used togenerate a linear predictive model. This was undertaken by dividingeach dataset into training sets consisting of the samples with adul-teration levels being increments of 10% (from 0%, 10%, 20%, 30%,40%, 50% through to 100%) and test sets consisting of the rest of thedata between these levels (at 5%, 15%, 25%, 35%, 45% for example, upto 95%). The training set was used to create several models, each withan increasing number of latent variables (LVs) used and a k-fold cross-validation (Gromski et al., 2015) system where k=20 was used to testeach model. The optimal model was chosen by aiming to minimise theroot-mean-squared error on the cross-validation set (RMSECV) and thenumber of LVs, and the test set was fed into it.
3. Results and discussion
3.1. Standard addition method
As with all wholefoods, which include fruits, vegetables, and wholegrains, coconuts can vary in their total water volume and nutrientcontent (Manivannan et al., 2018). As well as slight natural individualvariation within the same species, broader differences in coconut watercan be a result of several factors such as differences between species(Prades, Dornier, Diop, & Pain, 2012), the country or area of origin(Loiola et al., 2016), as well as maturity (Santoso et al., 1996). Thenature of the current study also required an accurate knowledge of thesugar content of our stock coconut water, as to mimic intentionaladulteration with sugar solutions of incorrect concentrations wouldsimply result in poor masking. The standard addition method (SAM)was therefore chosen as a method to calculate each sugar concentra-tion. As well as serving as a proof-of-concept, in ensuring that coconutwater and the changes within it can reliably be detected, it is also asimple yet effective self-validating method, removing the requirementfor a second quantitative method like HPLC or GC to confirm the re-sults.
As the spiked solution is the unknown solution, any matrix effectsand variances that could be a result of using standard concentrationcurves are eliminated. SAM functions (Westley et al., 2017) by using thesolution of unknown concentration as a base and adding known
quantities of the analyte in question to create a model where con-centration points are seen as x, x+ n, x+ 2n, x+ 3n etc., where x isthe concentration of the unknown sample and n is the known quantityadded. These points can then be used to create a regression modelwhich is then shifted to place the signal at a true 0 concentration. Fi-nally, the signal at concentration x is plotted into the shifted regressionmodel to find the true concentration.
The strongest peak of each signal was chosen as a reference toperform the standard addition calculations. As depicted in Fig. S1, thesecan be found at 627, 835, and 1123 cm−1 for fructose, sucrose, andglucose respectively. SAM assumes that the signal at 0% concentrationwill be 0, baseline correction was performed to minimise error. How-ever, scaling was found to be detrimental to the model and was notperformed. Using SAM the sugar concentrations were found to be24.39, 26.95 and 11.64mg·mL−1 for fructose, glucose and sucrose re-spectively (Fig. S2). These concentrations were in agreement with thevalues reported in the literature, ranging from 24, 27, and 15mg·mL−1
for each sugar as reported by the Food Standards Australia New Zealandnutrient database (FSANZ, 2010), to 25.5, 26.1, and 0.6 mg·mL−1 asreported by Santoso et al. (Santoso et al., 1996). While the mono-saccharide concentrations are fairly constant, a large variance in thesucrose concentration is observed, which is likely due to the differentstages of maturity of the coconuts tested (Child & Nathanael, 1950; Tanet al., 2014). Child and Nathanael (Child & Nathanael, 1950) observedan increase in sucrose concentration beginning around the 7th month ofgrowth. The experimental values can therefore be confidently stated assufficiently accurate.
3.2. Adulteration with solutions of single sugars
Dilution with water, as well as being readily detectable with mul-tiple analytical methods, would also result in noticeable changes inorganoleptic characteristics if coconut water were watered down athigher concentrations. As the majority of the total dry weight of co-conut water is sugar, keeping this concentration constant would be asimple way to not only mask this watered down taste, but also oftenrequire the use of expensive and time consuming chromatography orenzymatic methods to detect the adulteration. Moreover, in order thatthe taste of the final product remains consistent, producers can addsugars without dilution to normalise the sweetness of coconut waterand total soluble solids content as measured by Degrees Brix (°Bx)(Nicolai et al., 2007) originating from several different processingplants.
To gain an understanding of the potential of Raman spectroscopy todiscriminate between sugars, coconut water was replaced with in-dividual solutions of fructose, glucose and sucrose in various levels in5% increments (from 0%, 5%, 10%, 15% etc. up to 100%), whilekeeping the total sugar concentration at a constant 63mg·mL−1. Thisprocess would allow for adulterated products to remain undetectedusing Brix measurements. PCA was then used to reduce the di-mensionality of the data (Granato et al., 2018), and the loadings wereexamined for the most relevant principal components so as to under-stand the possible sources of the explained variance (Fig. 1). Even whenthe total sugar concentration is kept at a constant, any alteration in theconcentration of individual sugars remains clearly detectable, as dis-played on the PCA scores plot of all data (Fig. 1A). From the PCA plot itcan be observed that each sugar extends linearly in a distinct directionfrom the middle (or origin) point occupied by pure unadulterated co-conut water, with PC 1 separating fructose from glucose and sucrose,whilst PC 2 separates sucrose (positive side) from glucose and fructose(negative side).
Additionally, the gradual colour change in the plot from black to redfor each of the sugars with their respective chosen symbol, indicatesthat each trend is concentration dependent. Only the 95% and 100%data points for fructose adulteration samples were found to be outliers.Further evaluation of the spectra for these data points led to the
P.I.C. Richardson et al. Food Chemistry 272 (2019) 157–164
159
observation of an abnormal signal in the 400–500 cm−1 range, likelydue to an as yet unexplained reduction in signal-to-noise ratios in thisregion. Since each sugar has a distinct spectrum, clear similarities be-tween the PCA loadings plots (Fig. 1B and C) and the spectra for eachsugar can be found. The loadings for PC 1, for example, indicated apositive weighting for the fructose reference peak at 627 cm−1 alongwith the two peaks at 822 and 871 cm−1, while indicating a negativeweighting for the glucose reference peak at 1123 cm−1 and the twopeaks at 1331 and 1363 cm−1. The loadings for PC 2 further confirmthis, as they show positive influence of the reference sucrose peak at835 cm−1 and the 1132 cm−1 signal, among others. From this in-formation, it is clear that Raman spectroscopy, in combination withchemometrics, can accurately detect low levels of adulteration of co-conut water with a single sugar solution, with LOD’s of 2.1%, 2.6% and1.9% for glucose, fructose and sucrose respectively, even when the totalconcentration of sugar is kept constant.
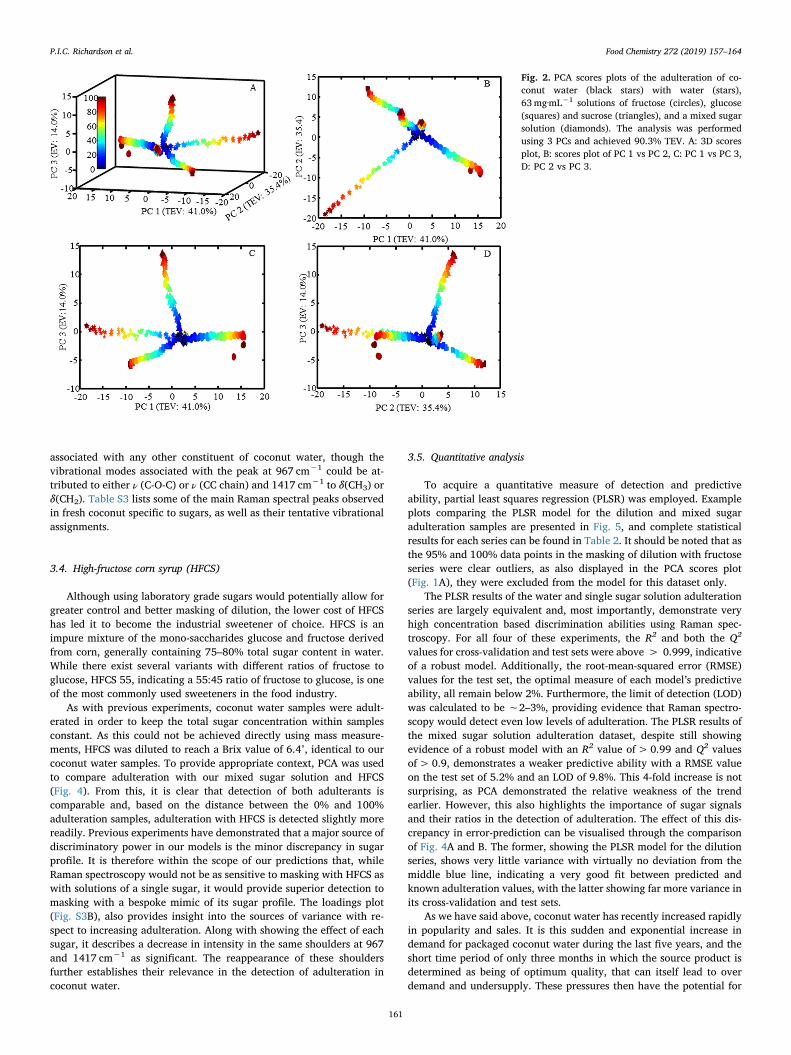
3.3. Adulteration with a mixed sugar solution
The next step in exploring the discriminatory potential of Ramanspectroscopy in detecting adulteration with sugars was to adulteratecoconut water with a mixed sugar solution. To ensure comparable re-sults, the experimental conditions and analytical protocols were keptidentical. Additionally, the control dataset using unmasked dilutionwith water was included as a comparison. The PCA score plot (Fig. 2)shows clear and regular trends relating to adulteration using solutionsof single sugars. Additionally, an equivalent trend in the scores plots isvisible for the unmasked dilution with water, demonstrating that such apractice would be easily detectable with Raman spectroscopy. It isworth noting that, although the samples adulterated with varyingconcentrations of single sugars (glucose and sucrose) are also on thenegative side of PC1 axis (Fig. 2B), similar to that of the water-dilutedsamples, using PC3 scores (Fig. 2C) these samples display distinct
clusters which allows for their discrimination from one another.Unlike the use of individual sugars to adulterate coconut water in
order to mask its dilution with water, the use of a mixed sugar solutionto mask dilution while keeping individual sugar concentrations con-stant is significantly more difficult to detect. Compared to the PCAscores of earlier single sugar adulteration, adulteration with a mixedsugar solution shows little to no change relative to the other conditionsinvestigated. This is predictable and even desired to an extent; given thevariance for each principal component originates from changes in theconcentration of each individual sugar, a lack of change indicates thatthese concentrations have not altered and that the masking of dilutionwas successful. To examine the source of variance within the mixedsugar adulteration dataset, PCA was performed on the mixed sugardataset alone (Fig. 3). Immediately, there are several factors present inthe scores plot (Fig. 3A) which point to a far weaker detection ability.Additionally, the total explained variance (TEV) of each principalcomponent is far smaller; where previously 3 PCs achieved a TEVof> 90%, the use of 10 PCs only achieved ∼44% TEV. Although thetrend is weaker, it is still present; a gradual change from blue (lowadulteration) to red (high adulteration) can be seen (Fig. 3A).
In addition to the scores, the loadings plot was also examined toestablish possible sources of variance within the dataset, and severalareas of high variance were identified and highlighted. The negativelyweighted peaks at 835 and 1132 cm−1, indicative of sucrose, and thepositively weighted peak at 627 cm−1, indicative of fructose, suggestthat masking of dilution was not entirely successful (Fig. 3B). Based onFig. 3A showing a decrease in scores with respect to increasing adul-teration, it can be inferred that sucrose was slightly in excess and thatan insufficient concentration of fructose was used. Additionally, thereare two peaks with positive weighting at 967 and 1417 cm−1 which arenot attributed to any sugar (Fig. 3B). In Fig. 3C, these signals can beattributed to two shoulders in the coconut water spectra, which recedewith increasing adulteration. These peaks could not be readily
Fig. 1. PCA scores plot of the adulterated coconutwater with increasing quantities of individual sugarsolutions, using 2 PCs and achieving 90.1% totalexplained variance (TEV). A: PCA scores plot com-paring PC 1 and PC 2. B: Loadings plot for PC 1(black line), C: Loadings plot for PC 2 (black line).The reference peaks for fructose, glucose and su-crose (627, 1123 and 835 cm−1 respectively) werehighlighted, and their Raman spectra (red, greenand blue respectively) were overlaid onto the load-ings. (For interpretation of the references to colourin this figure legend, the reader is referred to theweb version of this article.)
P.I.C. Richardson et al. Food Chemistry 272 (2019) 157–164
160
associated with any other constituent of coconut water, though thevibrational modes associated with the peak at 967 cm−1 could be at-tributed to either ν (C-O-C) or ν (CC chain) and 1417 cm−1 to δ(CH3) orδ(CH2). Table S3 lists some of the main Raman spectral peaks observedin fresh coconut specific to sugars, as well as their tentative vibrationalassignments.
3.4. High-fructose corn syrup (HFCS)
Although using laboratory grade sugars would potentially allow forgreater control and better masking of dilution, the lower cost of HFCShas led it to become the industrial sweetener of choice. HFCS is animpure mixture of the mono-saccharides glucose and fructose derivedfrom corn, generally containing 75–80% total sugar content in water.While there exist several variants with different ratios of fructose toglucose, HFCS 55, indicating a 55:45 ratio of fructose to glucose, is oneof the most commonly used sweeteners in the food industry.
As with previous experiments, coconut water samples were adult-erated in order to keep the total sugar concentration within samplesconstant. As this could not be achieved directly using mass measure-ments, HFCS was diluted to reach a Brix value of 6.4°, identical to ourcoconut water samples. To provide appropriate context, PCA was usedto compare adulteration with our mixed sugar solution and HFCS(Fig. 4). From this, it is clear that detection of both adulterants iscomparable and, based on the distance between the 0% and 100%adulteration samples, adulteration with HFCS is detected slightly morereadily. Previous experiments have demonstrated that a major source ofdiscriminatory power in our models is the minor discrepancy in sugarprofile. It is therefore within the scope of our predictions that, whileRaman spectroscopy would not be as sensitive to masking with HFCS aswith solutions of a single sugar, it would provide superior detection tomasking with a bespoke mimic of its sugar profile. The loadings plot(Fig. S3B), also provides insight into the sources of variance with re-spect to increasing adulteration. Along with showing the effect of eachsugar, it describes a decrease in intensity in the same shoulders at 967and 1417 cm−1 as significant. The reappearance of these shouldersfurther establishes their relevance in the detection of adulteration incoconut water.
3.5. Quantitative analysis
To acquire a quantitative measure of detection and predictiveability, partial least squares regression (PLSR) was employed. Exampleplots comparing the PLSR model for the dilution and mixed sugaradulteration samples are presented in Fig. 5, and complete statisticalresults for each series can be found in Table 2. It should be noted that asthe 95% and 100% data points in the masking of dilution with fructoseseries were clear outliers, as also displayed in the PCA scores plot(Fig. 1A), they were excluded from the model for this dataset only.
The PLSR results of the water and single sugar solution adulterationseries are largely equivalent and, most importantly, demonstrate veryhigh concentration based discrimination abilities using Raman spec-troscopy. For all four of these experiments, the R2 and both the Q2
values for cross-validation and test sets were above > 0.999, indicativeof a robust model. Additionally, the root-mean-squared error (RMSE)values for the test set, the optimal measure of each model’s predictiveability, all remain below 2%. Furthermore, the limit of detection (LOD)was calculated to be ∼2–3%, providing evidence that Raman spectro-scopy would detect even low levels of adulteration. The PLSR results ofthe mixed sugar solution adulteration dataset, despite still showingevidence of a robust model with an R2 value of> 0.99 and Q2 valuesof> 0.9, demonstrates a weaker predictive ability with a RMSE valueon the test set of 5.2% and an LOD of 9.8%. This 4-fold increase is notsurprising, as PCA demonstrated the relative weakness of the trendearlier. However, this also highlights the importance of sugar signalsand their ratios in the detection of adulteration. The effect of this dis-crepancy in error-prediction can be visualised through the comparisonof Fig. 4A and B. The former, showing the PLSR model for the dilutionseries, shows very little variance with virtually no deviation from themiddle blue line, indicating a very good fit between predicted andknown adulteration values, with the latter showing far more variance inits cross-validation and test sets.
As we have said above, coconut water has recently increased rapidlyin popularity and sales. It is this sudden and exponential increase indemand for packaged coconut water during the last five years, and theshort time period of only three months in which the source product isdetermined as being of optimum quality, that can itself lead to overdemand and undersupply. These pressures then have the potential for
Fig. 2. PCA scores plots of the adulteration of co-conut water (black stars) with water (stars),63mg·mL−1 solutions of fructose (circles), glucose(squares) and sucrose (triangles), and a mixed sugarsolution (diamonds). The analysis was performedusing 3 PCs and achieved 90.3% TEV. A: 3D scoresplot, B: scores plot of PC 1 vs PC 2, C: PC 1 vs PC 3,D: PC 2 vs PC 3.
P.I.C. Richardson et al. Food Chemistry 272 (2019) 157–164
161
Fig. 3. PCA of the adulteration of coconut water with a mixed sugar solution in 5% increments ranging from 0 to 100%, using 2 PCs to achieve 25.7% TEV. A) PCAscores plot comparing PC 1 and PC 2. B) Loadings plot for PC 1, indicating the variance corresponding to each wavenumber sampled. C) Overlaid Raman spectra afterbaseline correction and autoscaling. For each level of adulteration, the average of four machine replicates is presented. Increasing levels of adulteration are re-presented by a colour change from black to purple. (For interpretation of the references to colour in this figure legend, the reader is referred to the web version of thisarticle.)
Fig. 4. PCA scores plot comparing the adulteration of coconut water (black stars) with a mixed sugar solution (diamonds) and a high-fructose corn syrup solution(triangles). The analysis was performed using 2 PCs and achieved 54.0% TEV.
P.I.C. Richardson et al. Food Chemistry 272 (2019) 157–164
162
dysfunctionality within supply chains making this product vulnerable(Spink, Ortega, Chen, & Wu, 2017) and a target for illicit practises suchas mislabelling, substitution, misrepresentation, dilution, adulterationwith sugars, and other forms of food fraud (Ellis et al., 2012). In thecase of coconut water, this has already been observed on multiple oc-casions (Glotz, 2016a), from the extreme of one product being removedfrom shelves in the Caribbean due to it containing no coconut water atall (just chemicals and additives (Sorias, 20 May 2016), to recent in-vestigations in the UK by the National Food Crime Unit of the FoodStandards Agency (Glotz, 2017). More pertinent to our study here, thislatter UK-based investigation found added sugar in 60% of samples,sugars derived from starch, sugar cane, and maize, despite the fact thatthe products were labelled as being pure and free from additives. Thisinvestigation led to a total of 400 tonnes of coconut water being seizedand removed from the market (Glotz, 2017). These cases readily illus-trate the vulnerable nature of this type of product and the necessity fornew methods to be able to detect these forms of adulteration, rapidly,and ideally on-site.
4. Concluding remarks
Here, for the first time, we have demonstrated Raman spectroscopyas a potential tool for the detection of coconut water adulteration,which in combination with chemometrics successfully detected the di-lution of this product, as well as its adulteration with solutions of singlesugars below 3%. Using this approach, we showed that detection ofdilution was still possible despite normalisation of the total sugarconcentration with glucose, fructose or sucrose. Robust predictivemodels Q2 on test set> 0.99) were able to detect very low levels ofsingle sugar adulteration, with LOD’s of 2.1%, 2.6% and 1.9% forglucose, fructose and sucrose respectively. With the masking of dilutionwith mixed sugar solutions to emulate coconut water’s natural sugar
profile being detected at concentrations of less than 10% (Q2 on test set:0.97, LOD: 9.8%). Further investigation, this time using the more in-dustrially relevant and common soft drink sweetener HFCS as anadulterant, showed that HFCS was detectable at even lower con-centrations than our laboratory made mixed sugar solution (Q2 on testset: 0.98, LOD: 7.1%).
We believe that as well as being novel, there is capacity for furtherdevelopment of Raman spectroscopy in combination with chemo-metrics for the detection of adulteration in this popular product. Thesecould include refinement and application of a range of chemometricapproaches for data analysis, or the use of laser wavelengths which aremore suitable to specific types of product or adulteration, as well asclosely related forms of Raman spectroscopy such as spatially offsetRaman spectroscopy (SORS). SORS also has the added advantage ofbeing able to penetrate through many types of opaque non-metallicpacking, such as bottles and cartons, to retrieve detailed chemical in-formation, and has been shown to detect a wide range of adulterants inother beverages at extremely low concentrations (Ellis et al., 2017). Itcan be concluded that Raman spectroscopy has significant potential as arapid accurate analytical method for the detection of adulteration inthis product, able to discern small abnormalities in sugar ratios in co-conut water. Whilst being simple to use and with the increasing com-mercial availability of multiple handheld instruments, the potential forportability for on-site analyses (Ellis, Muhamadali, Haughey, Elliott, &Goodacre, 2015; Hargreaves, 2014).
Acknowledgements
DIE and RG thank the UK ESRC and UK FSA for funding (Food fraud:a supply network integrated systems analysis (Grant number ES/M003183/1)).
Fig. 5. A) PLSR prediction model for unmasked di-lution of coconut water. Q2 and the RMSE for thetest set are 0.9965 and 1.67% respectively. B) PLSRprediction model for dilution masked with a mixedsugar solution. Q2 and the RMSE for the test set are0.9671 and 5.21% respectively. A complete set ofstatistical values can be found in Table 2.
Table 2PLSR model statistical results for each dataset measured. For each dataset, R2, Q2 values for the k-fold (k=20) cross-validation and test sets, along with the RMSEvalues for the training, cross-validation and test sets are presented. Calculated limit of detection (LOD) values are also presented. * R2 and Q2 values are measures ofthe total in the training, cross-validation and test sets explained by the model. As the 95% and 100% data for the fructose dataset were found to be outliers, they wereremoved.
P.I.C. Richardson et al. Food Chemistry 272 (2019) 157–164
163
Appendix A. Supplementary data
Supplementary data associated with this article can be found, in theonline version, at https://doi.org/10.1016/j.foodchem.2018.08.038.
References
Bhagya, D., Prema, L., & Rajamohan, T. (2012). Therapeutic effects of tender coconutwater on oxidative stress in fructose fed insulin resistant hypertensive rats. AsianPacific Journal of Tropical Medicine, 5(4), 270–276.
Bispo, V. S., Dantas, L. S., Chaves, A. B., Pinto, I. F. D., da Silva, R. P., Otsuka, F. A. M., ...Matos, H. R. (2017). Reduction of the DNA damages, hepatoprotective effect andantioxidant potential of the coconut water, ascorbic and caffeic acids in oxidativestress mediated by ethanol. Anais Da Academia Brasileira De Ciencias, 89(2),1095–1109.
Child, R., & Nathanael, W. R. N. (1950). Changes in the sugar composition of coconutwater during maturation and germination. Journal of the Science of Food andAgriculture, 1(11), 326–329.
Costa, H. B., Souza, L. M., Soprani, L. C., Oliveira, B. G., Ogawa, E. M., Korres, A. M. N., ...Romao, W. (2015). Monitoring the physicochemical degradation of coconut waterusing ESI-FT-ICR MS. Food Chemistry, 174, 139–146.
DebMandal, M., & Mandal, S. (2011). Coconut (Cocos nucifera L.: Arecaceae): In healthpromotion and disease prevention. Asian Pacific Journal of Tropical Medicine, 4(3),241–247.
Eilers, P. H. C. (2003). A perfect smoother. Analytical Chemistry, 75(14), 3631–3636.Ellis, D. I., Brewster, V. L., Dunn, W. B., Allwood, J. W., Golovanov, A. P., & Goodacre, R.
(2012). Fingerprinting food: Current technologies for the detection of food adul-teration and contamination. Chemical Society Reviews, 41(17), 5706–5727.
Ellis, D. I., Eccles, R., Xu, Y., Griffen, J., Muhamadali, H., Matousek, P., Goodall, I., &Goodacre, R. (2017). Through-container, extremely low concentration detection ofmultiple chemical markers of counterfeit alcohol using a handheld SORS device.Scientific Reports, 7 Article no. 12082.
Ellis, D. I., Muhamadali, H., Haughey, S. A., Elliott, C. T., & Goodacre, R. (2015). Point-and-shoot: Rapid quantitative detection methods for on-site food fraud analysis -moving out of the laboratory and into the food supply chain. Analytical Methods,7(22), 9401–9414.
FSANZ (2010). Nutrient tables for use in Australia. http://www.foodstandards.gov.au/science/monitoringnutrients/nutrientables/nuttab/Pages/default.aspx.
Glotz, J. (2016a). Coconut water: a fair target? In: The Grocer.Glotz, J. (2016b). Infographic: The UK coconut water market at a glance. In: The Grocer.Glotz, J. (2017). FSA probe finds widespread addition of undeclared sugar in coconut
water. In: The Grocer.Granato, D., Putnik, P., Kovacevic, D., Santos, J., Calado, V., Rocha, R., et al. (2018).
Trends in chemometrics: Food authentication, microbiology, and effects of proces-sing. Comprehensive Reviews in Food Science and Food Safety, 17, 663–677.
Gromski, P. S., Muhamadali, H., Ellis, D. I., Xu, Y., Correa, E., Turner, M. L., & Goodacre,R. (2015). A tutorial review: Metabolomics and partial least squares-discriminantanalysis – A marriage of convenience or a shotgun wedding. Analytica Chimica Acta,879, 10–23.
Gunn, B. F., Baudouin, L., & Olsen, K. M. (2011). Independent Origins of CultivatedCoconut (Cocos nucifera L.) in the Old World Tropics. Plos One, 6(6), 8.
Hargreaves, M. D. (2014). Handheld raman spectrometers and their applications.Encyclopedia of analytical chemistry. John Wiley & Sons.
Kalman, D. S., Feldman, S., Krieger, D. R., & Bloomer, R. J. (2012). Comparison of co-conut water and a carbohydrate-electrolyte sport drink on measures of hydration andphysical performance in exercise-trained men. Journal of the International Society ofSports Nutrition, 9, 10.
Kaplan, J. (2017). Vita Coco to Near $1 Billion in Sales as Potential Buyers Circle. In:Bloomberg Markets.
Loiola, C. M., Azevedo, A. O. N., Diniz, L. E. C., Aragao, W. M., Azevedo, C. D. D., Santos,P., ... Ramos, S. R. R. (2016). Genetic relationships among tall coconut palm (Cocosnucifera L.) accessions of the international coconut genebank for Latin America andthe Caribbean (ICG-LAC), evaluated using microsatellite markers (SSRs). Plos One,11(3), 11.
Ma, Z., Ge, L., Lee, A. S. Y., Yong, J. W. H., Tan, S. N., & Ong, E. S. (2008). Simultaneousanalysis of different classes of phytohormones in coconut (Cocos nucifera L.) waterusing high-performance liquid chromatography and liquid chromatography-tandemmass spectrometry after solid-phase extraction. Analytica Chimica Acta, 610(2),274–281.
Mandal, S. M., Dey, S., Mandal, M., Sarkar, S., Maria-Neto, S., & Franco, O. L. (2009).Identification and structural insights of three novel antimicrobial peptides isolatedfrom green coconut water. Peptides, 30(4), 633–637.
Manivannan, A., Bhardwaj, R., Padmanabhan, S., Suneja, P., Hebbar, K. B., & Kanade, S.R. (2018). Biochemical and nutritional characterization of coconut (Cocos nucifera L.)haustorium. Food Chemistry, 238, 153–159.
Nicolai, B. M., Beullens, K., Bobelyn, E., Peirs, A., Saeys, W., Theron, K. I., & Lammertyn,J. (2007). Nondestructive measurement of fruit and vegetable quality by means ofNIR spectroscopy: A review. Postharvest Biology and Technology, 46(2), 99–118.
Peart, D. J., Hensby, A., & Shaw, M. P. (2017). Coconut water does not improve markersof hydration during sub-maximal exercise and performance in a subsequent time trialcompared with water alone. International Journal of Sport Nutrition and ExerciseMetabolism, 27(3), 279–284.
Prades, A., Assa, R. R. A., Dornier, M., Pain, J. P., & Boulanger, R. (2012).Characterisation of the volatile profile of coconut water from five varieties using anoptimised HS-SPME-GC analysis. Journal of the Science of Food and Agriculture, 92(12),2471–2478.
Prades, A., Dornier, M., Diop, N., & Pain, J. P. (2012). Coconut water uses, compositionand properties: A review. Fruits, 67(2), 87–107.
Rodriguez-Saona, L. E., Fry, F. S., McLaughlin, M. A., & Calvey, E. M. (2001). Rapidanalysis of sugars in fruit juices by FT-NIR spectroscopy. Carbohydrate Research,336(1), 63–74.
Rolle, R. (2007). Good practice for the small-scale production of coconut water. Rome: FAO.Santoso, U., Kubo, K., Ota, T., Tadokoro, T., & Maekawa, A. (1996). Nutrient composition
of kopyor coconuts (Cocos nucifera L). Food Chemistry, 57(2), 299–304.Saxberg, B., & Kowalski, B. (1979). Generalised standard addition method. Analytical
Chemistry, 51(7), 1031–1038.Sorias, L. (20 May 2016). Health Ministry removes local coconut water off the market.
Trinidad Express.Spink, J., Ortega, D. L., Chen, C., & Wu, F. (2017). Food fraud prevention shifts the food
risk focus to vulnerability. Trends in Food Science & Technology, 62, 215–220.Sucupira, N. R., Alves, E. G., Silva, L. M. A., de Brito, E. S., Wurlitzer, N. J., & Sousa, P. H.
M. (2017). NMR spectroscopy and chemometrics to evaluate different processing ofcoconut water. Food Chemistry, 216, 217–224.
Tan, T. C., Cheng, L. H., Bhat, R., Rusul, G., & Easa, A. M. (2014). Composition, physi-cochemical properties and thermal inactivation kinetics of polyphenol oxidase andperoxidase from coconut (Cocos nucifera) water obtained from immature, mature andoverly-mature coconut. Food Chemistry, 142, 121–128.
USDA. (2016a). National Nutrient Database for Standard Reference Release 28, BasicReport 12119, Nuts, coconut water (liquid from coconuts).
USDA. (2016b). Nuts, coconut water (liquid from coconuts): National Nutrient Databasefor Standard Reference Release 28.
Westley, C., Xu, Y., Thilaganathan, B., Carnell, A. J., Turner, N. J., & Goodacre, R. (2017).Absolute quantification of uric acid in human urine using surface enhanced ramanscattering with the standard addition method. Analytical Chemistry, 89(4),2472–2477.
P.I.C. Richardson et al. Food Chemistry 272 (2019) 157–164


![Food Adulteration[1]](https://static.documents.pub/doc/80x56/577d260e1a28ab4e1ea02b30/food-adulteration1.jpg)
