23
RAPID SMART SURVEY REPORT WAJIR WEST AND ELDAS SUB-COUNTIES February, 2015 Survey done by Islamic Relief and Save the Children in collaboration with Department of Health Wajir

RAPID SMART SURVEY REPORT
WAJIR WEST AND ELDAS SUB-COUNTIES
February, 2015
Survey done by Islamic Relief and Save the Children in collaboration with Department of Health Wajir
ACKNOWLEDGEMENT
Sincere appreciation to all those who made this survey a success.
The survey was conducted by Islamic Relief and Save the Children in collaboration with MoH
and the local community who are hereby all acknowledged. Those who participated as key
informants, village elders, women, men and children in Wajir West and Eldas sub-counties,
their willingness to patiently respond to the questions and the description of the current
situation has been invaluable.
Much appreciation to the survey teams composed of Enumerators, Team leaders, Supervisors,
IRK and SCI teams for the coordination as well as for the hard work of ensuring quality data
collection.
Gratitude to Eunice Ngina (IRK Nutrition Advisor) and Dennis Mramba (Senior M & E Officer) for
technical support and guidance and to the support departments for facilitation.
Further appreciation to Department of Health, especially Nuria Abdi (County Nutrition Officer),
National Drought Management Authority (NDMA) team and UNICEF Nutrition Support Officer
Oliver Kamar.
Report by:
Florence Kirimi,
M&E officer – IRK Wajir
List of abbreviations/Acronyms ARI Acute respiratory infection
CHW Community Health Worker
CI Confidence Interval
ENA Emergency Nutrition Assessment
GAM Global Acute Malnutrition
H/A Height for Age HINI High Impact Nutrition Intervention HH Household IRK Islamic Relief Kenya NDMA National Drought Management Authority
MAM Moderate Acute Malnutrition
MUAC Mid Upper Arm Circumference
MtMSG Mother to Mother Support Group
PPS Probability Proportional to size
SAM SCI
Severe Acute Malnutrition Save the Children International
SD Standard Deviation
SMART Standardized monitoring and assessment of relief and transitions
SPSS Statistical package for social sciences
UNICEF United Nations Children’s Fund
W/A Weight for Age
WASH WFP
Water Sanitation and Hygiene World Food Programme
Table of Contents List of abbreviations/Acronyms .................................................................................................................... 3
SUMMARY OF RESULTS ................................................................................................................................. 4
1.0 INTRODUCTION ....................................................................................................................................... 6
2. SURVEY METHODOLOGY ........................................................................................................................... 7
3. RESULTS ..................................................................................................................................................... 9
4. CONCLUSION AND RECOMMENDATIONS ............................................................................................... 17
5. APPENDICES ............................................................................................................................................ 18
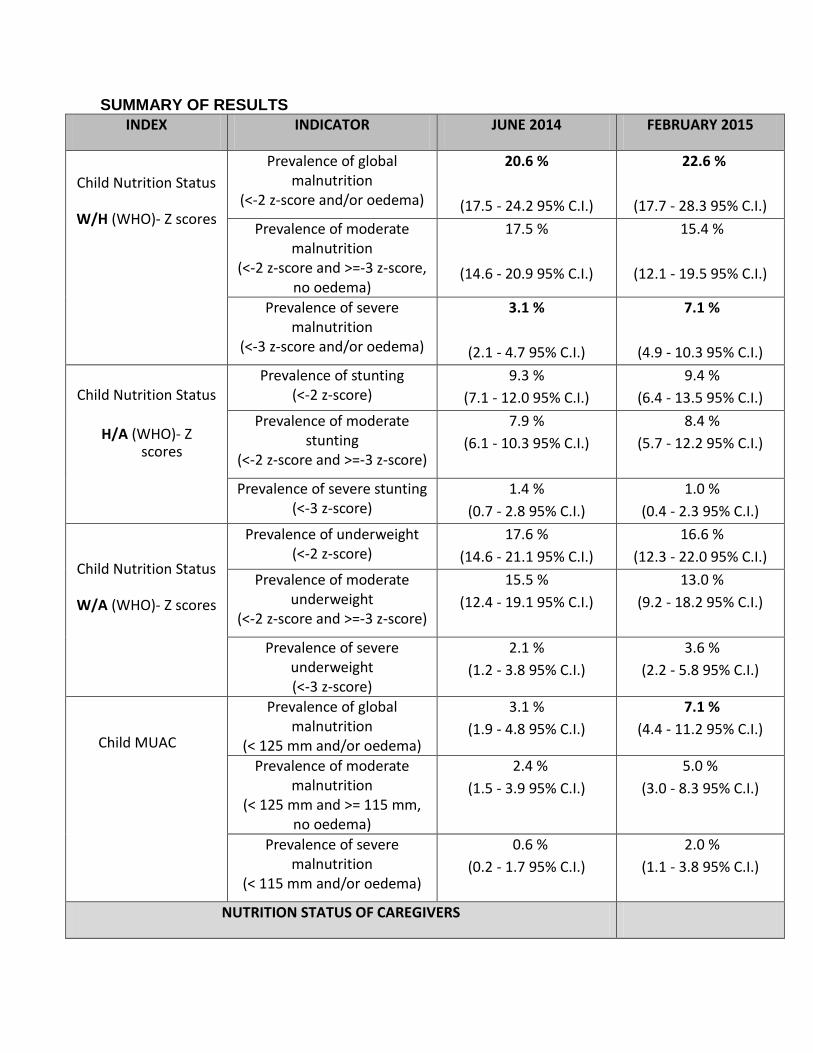
SUMMARY OF RESULTS
INDEX INDICATOR JUNE 2014 FEBRUARY 2015
Child Nutrition Status
W/H (WHO)- Z scores
Prevalence of global malnutrition
(<-2 z-score and/or oedema)
20.6 %
(17.5 - 24.2 95% C.I.)
22.6 %
(17.7 - 28.3 95% C.I.)
Prevalence of moderate malnutrition
(<-2 z-score and >=-3 z-score, no oedema)
17.5 %
(14.6 - 20.9 95% C.I.)
15.4 %
(12.1 - 19.5 95% C.I.)
Prevalence of severe malnutrition
(<-3 z-score and/or oedema)
3.1 %
(2.1 - 4.7 95% C.I.)
7.1 %
(4.9 - 10.3 95% C.I.)
Child Nutrition Status
H/A (WHO)- Z
scores
Prevalence of stunting (<-2 z-score)
9.3 %
(7.1 - 12.0 95% C.I.)
9.4 %
(6.4 - 13.5 95% C.I.)
Prevalence of moderate stunting
(<-2 z-score and >=-3 z-score)
7.9 %
(6.1 - 10.3 95% C.I.)
8.4 %
(5.7 - 12.2 95% C.I.)
Prevalence of severe stunting (<-3 z-score)
1.4 %
(0.7 - 2.8 95% C.I.)
1.0 %
(0.4 - 2.3 95% C.I.)
Child Nutrition Status
W/A (WHO)- Z scores
Prevalence of underweight (<-2 z-score)
17.6 %
(14.6 - 21.1 95% C.I.)
16.6 %
(12.3 - 22.0 95% C.I.)
Prevalence of moderate underweight
(<-2 z-score and >=-3 z-score)
15.5 %
(12.4 - 19.1 95% C.I.)
13.0 %
(9.2 - 18.2 95% C.I.)
Prevalence of severe underweight (<-3 z-score)
2.1 %
(1.2 - 3.8 95% C.I.)
3.6 %
(2.2 - 5.8 95% C.I.)
Child MUAC
Prevalence of global malnutrition
(< 125 mm and/or oedema)
3.1 %
(1.9 - 4.8 95% C.I.)
7.1 %
(4.4 - 11.2 95% C.I.)
Prevalence of moderate malnutrition
(< 125 mm and >= 115 mm, no oedema)
2.4 %
(1.5 - 3.9 95% C.I.)
5.0 %
(3.0 - 8.3 95% C.I.)
Prevalence of severe malnutrition
(< 115 mm and/or oedema)
0.6 %
(0.2 - 1.7 95% C.I.)
2.0 %
(1.1 - 3.8 95% C.I.)
NUTRITION STATUS OF CAREGIVERS

Physiological status
MUAC< 21
N = 462
Pregnant - 14.5%
Lactating – 6.7%
None – 5.8%
N= 434
Pregnant - 16.5%
Lactating – 9.8%
None – 4.9%
MUAC>21
Pregnant - 85.5%
Lactating – 93.3%
None - 94.2%
Pregnant - 83.5%
Lactating – 90.2%
None - 95.1%
MORBIDITY IN THE LAST 2 WEEKS
Child illness in the last
2 weeks
N = 619
Yes – 14.7% No –
85.3%
N = 546
Yes – 25% No – 75%
Proportion of children by type of illness:
Fever with chills
(27) 30%
(58) 42%
ARI/Coughs
(50) 55%
(98) 72%
Watery Diarrhoea
(13) 14%
(11) 8%
Bloody Diarrhoea
(1) 1%
(1) 1%
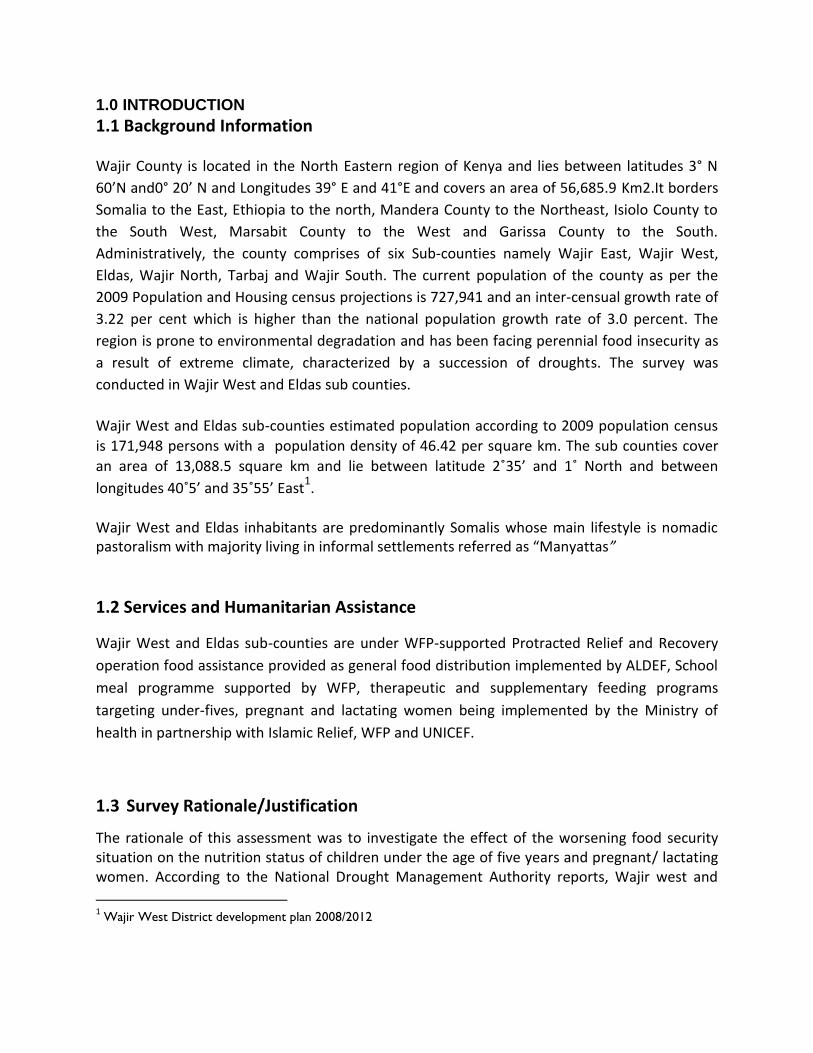
1.0 INTRODUCTION
1.1 Background Information
Wajir County is located in the North Eastern region of Kenya and lies between latitudes 3° N
60’N and0° 20’ N and Longitudes 39° E and 41°E and covers an area of 56,685.9 Km2.It borders
Somalia to the East, Ethiopia to the north, Mandera County to the Northeast, Isiolo County to
the South West, Marsabit County to the West and Garissa County to the South.
Administratively, the county comprises of six Sub-counties namely Wajir East, Wajir West,
Eldas, Wajir North, Tarbaj and Wajir South. The current population of the county as per the
2009 Population and Housing census projections is 727,941 and an inter-censual growth rate of
3.22 per cent which is higher than the national population growth rate of 3.0 percent. The
region is prone to environmental degradation and has been facing perennial food insecurity as
a result of extreme climate, characterized by a succession of droughts. The survey was
conducted in Wajir West and Eldas sub counties.
Wajir West and Eldas sub-counties estimated population according to 2009 population census
is 171,948 persons with a population density of 46.42 per square km. The sub counties cover
an area of 13,088.5 square km and lie between latitude 2˚35’ and 1˚ North and between
longitudes 40˚5’ and 35˚55’ East1.
Wajir West and Eldas inhabitants are predominantly Somalis whose main lifestyle is nomadic pastoralism with majority living in informal settlements referred as “Manyattas”
1.2 Services and Humanitarian Assistance Wajir West and Eldas sub-counties are under WFP-supported Protracted Relief and Recovery
operation food assistance provided as general food distribution implemented by ALDEF, School
meal programme supported by WFP, therapeutic and supplementary feeding programs
targeting under-fives, pregnant and lactating women being implemented by the Ministry of
health in partnership with Islamic Relief, WFP and UNICEF.
1.3 Survey Rationale/Justification The rationale of this assessment was to investigate the effect of the worsening food security situation on the nutrition status of children under the age of five years and pregnant/ lactating women. According to the National Drought Management Authority reports, Wajir west and
1 Wajir West District development plan 2008/2012

Eldas were among the most affected sub counties
1.4 Survey Objectives • To determine the prevalence of chronic and acute malnutrition in children aged 6-59
months • To estimate the morbidity rates two weeks prior to the survey • To determine the nutritional status of Caregivers aged 15-49 years
1.5 Survey timings
The Small Scale SMART was carried out from 9th to 14th February 2015. Training was carried out for 2 days followed by four days data collection.
2. SURVEY METHODOLOGY
2.1 Sample size /design The sample size/ design was based on the Small Scale SMART survey guidelines which
recommend a total of 25 clusters with 12 households in each cluster but due to the fact the
survey zone comprised of 2 sub counties, this was increased to 35 clusters to increase
representativeness. Villages were considered clusters.
The rapid survey was cross-sectional with two-stage cluster sampling based on the SMART
methodology. Anthropometric data, retrospective morbidity data and MUAC data for women of
reproductive age were collected.
2.2 Sampling procedures: selection of clusters A two stage cluster sampling technique was used. The sampling frame was drawn from the
population of the 2 sub counties. In the first stage clusters were randomly selected based on
probabilities proportional to size (PPS) using the ENA for SMART software version 2014. All the
villages with their respective estimated under-five populations were entered into SMART
software. The number of clusters allocated /generated was proportional to the number of
under-fives within the village. In villages with more than one cluster, with the help of the area
chiefs, the village was segmented and clusters selected randomly.
2.3 Sampling procedures: selection of households and Children The second stage involved random selection of households using the National guidelines for
Nutrition and Mortality Assessments in Kenya. Simple random method was employed to select
the surveyed households. In each selected household, all children aged 6-59 months were
included for anthropometric survey. In cases where there was no eligible child, the household
was still considered part of the sample and questions on maternal health were administered.
Revisits were done to households in which eligible under five child or entire family were absent at first attempt.
2.5 Questionnaire, Training and Supervision
2.5.1 Questionnaire The questionnaire included Anthropometry (6-59 months), child morbidity and maternal MUAC.
See questionnaire in attached in appendix 1.
2.5.2 Survey teams Training and supervision The survey teams underwent a 2 days training during which the following were covered: field
procedures, anthropometry measurements, filling in the questionnaire and practical field pre-
testing.
Six survey teams each consisting of 2 enumerators and a team leader from MoH or NDMA were
involved in data collection for Wajir West/ Eldas. Supervision was conducted on a daily basis
during data collection by the team leaders and an overall supervision by the County Nutrition
Officer, Nutrition Support Officer (UNICEF) and IRK Officer.
2.6 Data Collection Data collection was done from the 11th February 2015, for a period of 4 days.
2.7 Data Analysis Anthropometry data was analyzed using the ENA for SMART software version 2014 while child morbidity and maternal data analyzed using MS Excel.

3. RESULTS
3.1 Anthropometric results Anthropometric results were collected for 539 children but only 532 were included in the nutritional analysis with 7 records being excluded as data was flagged out of range/ the limits in analysis (WHO). Table 1: Distribution of age and sex of sample Boys Girls Total Ratio
AGE (mo.) no. % no. % no. % Boy: Girl
6-17 56 48.3 60 51.7 116 21.5 0.9
18-29 82 51.3 78 48.8 160 29.7 1.1
30-41 59 45.0 72 55.0 131 24.3 0.8
42-53 51 51.0 49 49.0 100 18.6 1.0
54-59 15 46.9 17 53.1 32 5.9 0.9
Total 263 48.8 276 51.2 539 100.0 1.0
The overall sex ratio was 0.95 which is within the acceptable range of 0.8-1.2
Age ratio of 6-29 months to 30-59 months was 1.05; the value should be around 0.85. Age distribution was reported as problematic; this is associated to the fact that 63% of date of birth was through recall. There is likelihood that the calendar of events was not well utilized by the data collectors. Figure 1: Weight for height Z-scores distribution
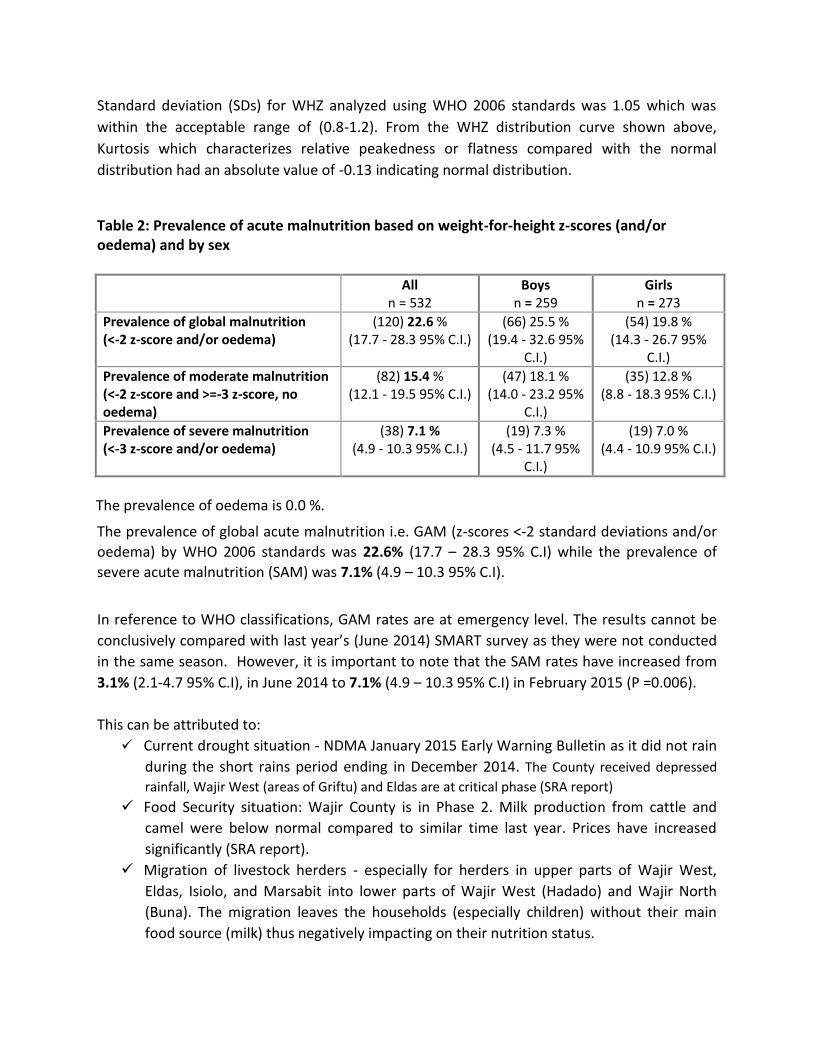
Standard deviation (SDs) for WHZ analyzed using WHO 2006 standards was 1.05 which was
within the acceptable range of (0.8-1.2). From the WHZ distribution curve shown above,
Kurtosis which characterizes relative peakedness or flatness compared with the normal
distribution had an absolute value of -0.13 indicating normal distribution.
Table 2: Prevalence of acute malnutrition based on weight-for-height z-scores (and/or oedema) and by sex
All n = 532
Boys n = 259
Girls n = 273
Prevalence of global malnutrition (<-2 z-score and/or oedema)
(120) 22.6 % (17.7 - 28.3 95% C.I.)
(66) 25.5 % (19.4 - 32.6 95%
C.I.)
(54) 19.8 % (14.3 - 26.7 95%
C.I.)
Prevalence of moderate malnutrition (<-2 z-score and >=-3 z-score, no oedema)
(82) 15.4 % (12.1 - 19.5 95% C.I.)
(47) 18.1 % (14.0 - 23.2 95%
C.I.)
(35) 12.8 % (8.8 - 18.3 95% C.I.)
Prevalence of severe malnutrition (<-3 z-score and/or oedema)
(38) 7.1 % (4.9 - 10.3 95% C.I.)
(19) 7.3 % (4.5 - 11.7 95%
C.I.)
(19) 7.0 % (4.4 - 10.9 95% C.I.)
The prevalence of oedema is 0.0 %. The prevalence of global acute malnutrition i.e. GAM (z-scores <-2 standard deviations and/or
oedema) by WHO 2006 standards was 22.6% (17.7 – 28.3 95% C.I) while the prevalence of
severe acute malnutrition (SAM) was 7.1% (4.9 – 10.3 95% C.I). In reference to WHO classifications, GAM rates are at emergency level. The results cannot be
conclusively compared with last year’s (June 2014) SMART survey as they were not conducted
in the same season. However, it is important to note that the SAM rates have increased from
3.1% (2.1-4.7 95% C.I), in June 2014 to 7.1% (4.9 – 10.3 95% C.I) in February 2015 (P =0.006).
This can be attributed to:
Current drought situation - NDMA January 2015 Early Warning Bulletin as it did not rain
during the short rains period ending in December 2014. The County received depressed
rainfall, Wajir West (areas of Griftu) and Eldas are at critical phase (SRA report)
Food Security situation: Wajir County is in Phase 2. Milk production from cattle and
camel were below normal compared to similar time last year. Prices have increased
significantly (SRA report).
Migration of livestock herders - especially for herders in upper parts of Wajir West,
Eldas, Isiolo, and Marsabit into lower parts of Wajir West (Hadado) and Wajir North
(Buna). The migration leaves the households (especially children) without their main
food source (milk) thus negatively impacting on their nutrition status.
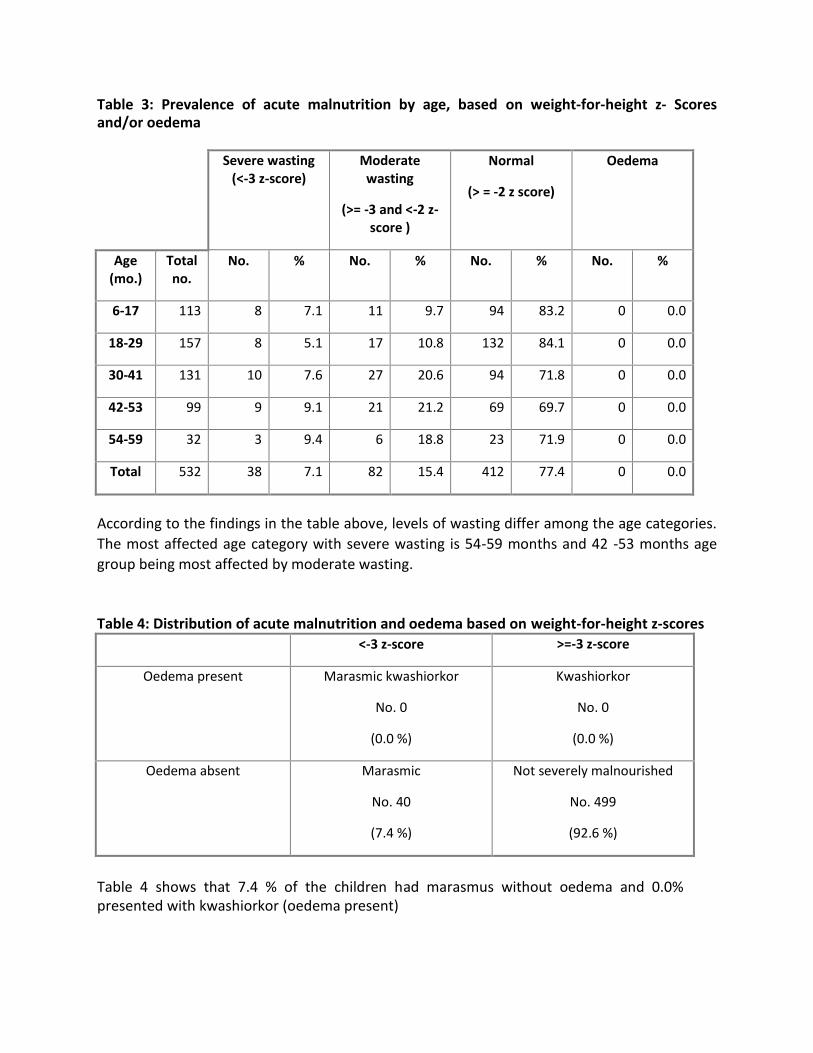
Table 3: Prevalence of acute malnutrition by age, based on weight-for-height z- Scores and/or oedema
Severe wasting (<-3 z-score)
Moderate wasting
(>= -3 and <-2 z-score )
Normal
(> = -2 z score)
Oedema
Age (mo.)
Total no.
No. % No. % No. % No. %
6-17 113 8 7.1 11 9.7 94 83.2 0 0.0
18-29 157 8 5.1 17 10.8 132 84.1 0 0.0
30-41 131 10 7.6 27 20.6 94 71.8 0 0.0
42-53 99 9 9.1 21 21.2 69 69.7 0 0.0
54-59 32 3 9.4 6 18.8 23 71.9 0 0.0
Total 532 38 7.1 82 15.4 412 77.4 0 0.0
According to the findings in the table above, levels of wasting differ among the age categories.
The most affected age category with severe wasting is 54-59 months and 42 -53 months age
group being most affected by moderate wasting.
Table 4: Distribution of acute malnutrition and oedema based on weight-for-height z-scores
<-3 z-score >=-3 z-score
Oedema present Marasmic kwashiorkor
No. 0
(0.0 %)
Kwashiorkor
No. 0
(0.0 %)
Oedema absent Marasmic
No. 40
(7.4 %)
Not severely malnourished
No. 499
(92.6 %)
Table 4 shows that 7.4 % of the children had marasmus without oedema and 0.0% presented with kwashiorkor (oedema present)

Table 5: Prevalence of acute malnutrition based on MUAC cut off's (and/or oedema) and by sex All
n = 539
Boys
n = 263
Girls
n = 276
Prevalence of global malnutrition
(< 125 mm and/or oedema)
(38) 7.1 %
(4.4 - 11.2 95% C.I.)
(16) 6.1 %
(3.2 - 11.4 95% C.I.)
(22) 8.0 %
(4.8 - 13.0 95% C.I.)
Prevalence of moderate malnutrition
(< 125 mm and >= 115 mm, no
oedema)
(27) 5.0 %
(3.0 - 8.3 95% C.I.)
(13) 4.9 %
(2.6 - 9.3 95% C.I.)
(14) 5.1 %
(2.9 - 8.8 95% C.I.)
Prevalence of severe malnutrition
(< 115 mm and/or oedema)
(11) 2.0 %
(1.1 - 3.8 95% C.I.)
(3) 1.1 %
(0.4 - 3.6 95% C.I.)
(8) 2.9 %
(1.4 - 6.0 95% C.I.)
MUAC is a rapid assessment of the mid upper arm muscle area and is an indicator of acute
malnutrition. From the study, the prevalence of GAM using MUAC (< 125 mm and/or
oedema) is 7.1 %, while the prevalence of MAM (< 125 mm and >= 115 mm, no oedema)
and SAM (< 115 mm and/or oedema) using MUAC is 5.0 % and 2.0 % respectively.
Table 6: Prevalence of acute malnutrition by age, based on MUAC cut off's and/or oedema
Severe wasting (< 115 mm)
Moderate wasting
(>= 115 mm and < 125 mm)
Normal
(> = 125 mm )
Oedema
Age
(mo.)
Total
no.
No. % No. % No. % No. %
6-17 116 7 6.0 11 9.5 98 84.5 0 0.0
18-29 160 3 1.9 9 5.6 148 92.5 0 0.0
30-41 131 1 0.8 5 3.8 125 95.4 0 0.0
42-53 100 0 0.0 1 1.0 99 99.0 0 0.0
54-59 32 0 0.0 1 3.1 31 96.9 0 0.0
Total 539 11 2.0 27 5.0 501 92.9 0 0.0
The prevalence of acute malnutrition (SAM and MAM) using MUAC cut off points differed
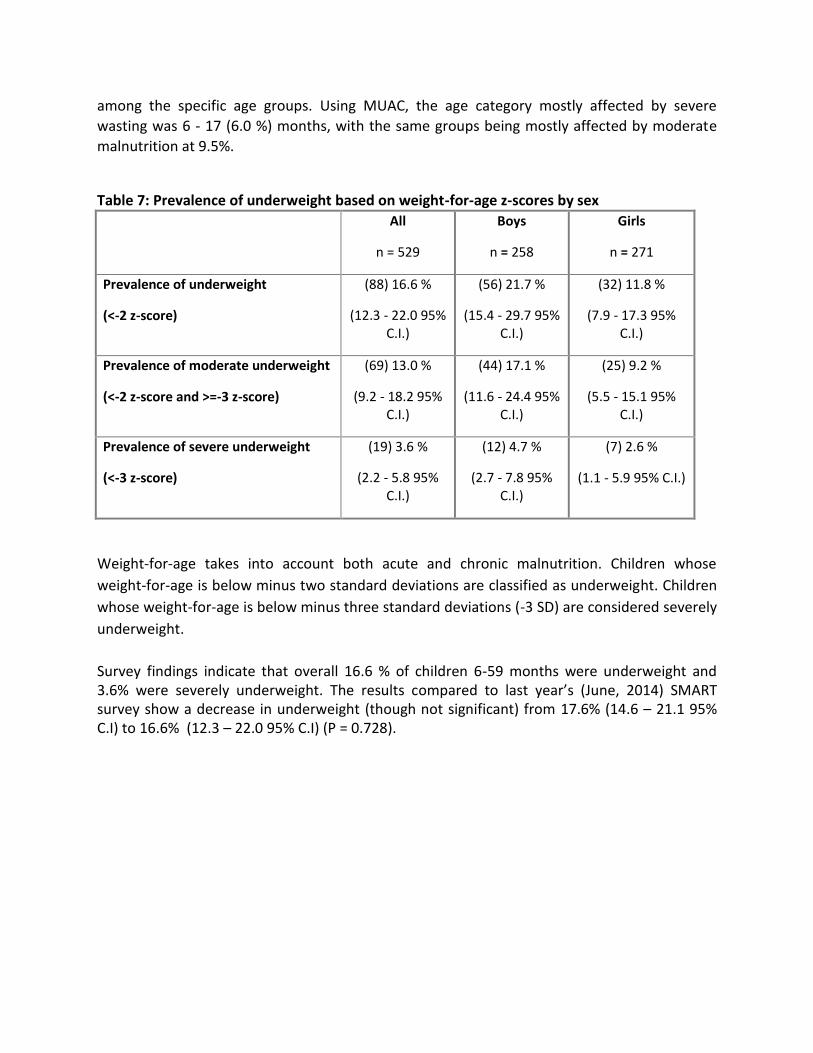
among the specific age groups. Using MUAC, the age category mostly affected by severe
wasting was 6 - 17 (6.0 %) months, with the same groups being mostly affected by moderate
malnutrition at 9.5%.
Table 7: Prevalence of underweight based on weight-for-age z-scores by sex
All
n = 529
Boys
n = 258
Girls
n = 271
Prevalence of underweight
(<-2 z-score)
(88) 16.6 %
(12.3 - 22.0 95% C.I.)
(56) 21.7 %
(15.4 - 29.7 95% C.I.)
(32) 11.8 %
(7.9 - 17.3 95% C.I.)
Prevalence of moderate underweight
(<-2 z-score and >=-3 z-score)
(69) 13.0 %
(9.2 - 18.2 95% C.I.)
(44) 17.1 %
(11.6 - 24.4 95% C.I.)
(25) 9.2 %
(5.5 - 15.1 95% C.I.)
Prevalence of severe underweight
(<-3 z-score)
(19) 3.6 %
(2.2 - 5.8 95% C.I.)
(12) 4.7 %
(2.7 - 7.8 95% C.I.)
(7) 2.6 %
(1.1 - 5.9 95% C.I.)
Weight-for-age takes into account both acute and chronic malnutrition. Children whose
weight-for-age is below minus two standard deviations are classified as underweight. Children
whose weight-for-age is below minus three standard deviations (-3 SD) are considered severely
underweight.
Survey findings indicate that overall 16.6 % of children 6-59 months were underweight and 3.6% were severely underweight. The results compared to last year’s (June, 2014) SMART survey show a decrease in underweight (though not significant) from 17.6% (14.6 – 21.1 95% C.I) to 16.6% (12.3 – 22.0 95% C.I) (P = 0.728).
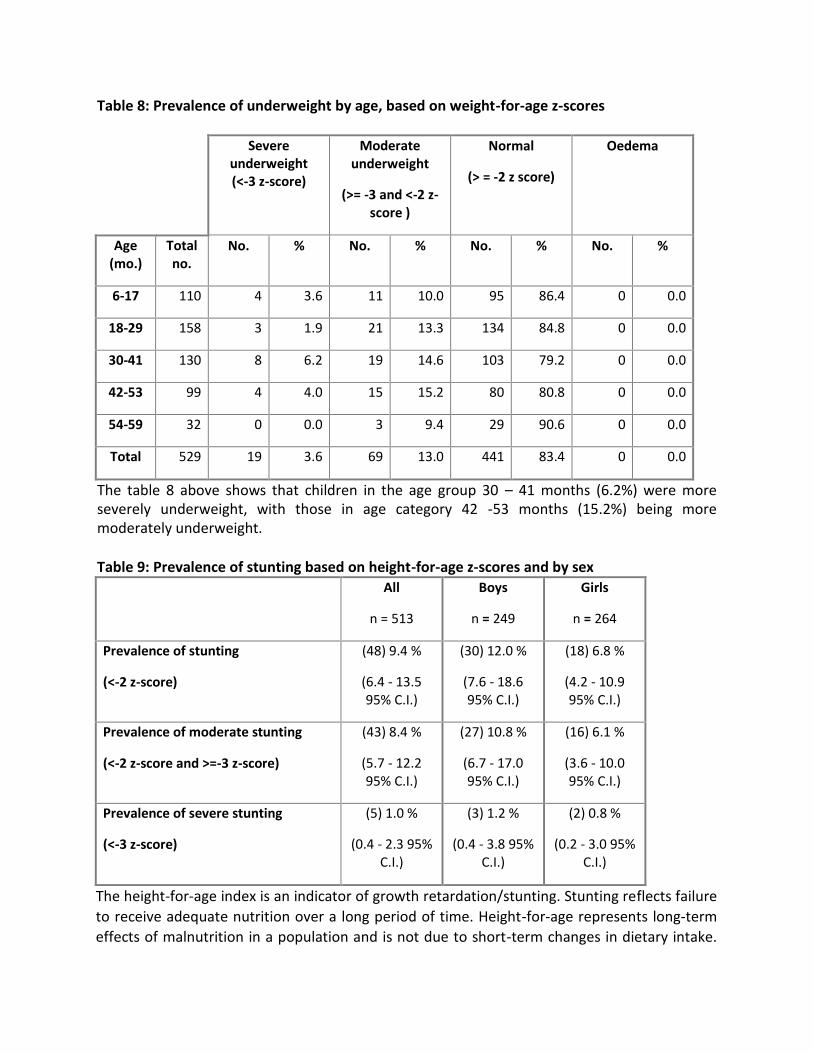
Table 8: Prevalence of underweight by age, based on weight-for-age z-scores
Severe underweight (<-3 z-score)
Moderate underweight
(>= -3 and <-2 z-score )
Normal
(> = -2 z score)
Oedema
Age (mo.)
Total no.
No. % No. % No. % No. %
6-17 110 4 3.6 11 10.0 95 86.4 0 0.0
18-29 158 3 1.9 21 13.3 134 84.8 0 0.0
30-41 130 8 6.2 19 14.6 103 79.2 0 0.0
42-53 99 4 4.0 15 15.2 80 80.8 0 0.0
54-59 32 0 0.0 3 9.4 29 90.6 0 0.0
Total 529 19 3.6 69 13.0 441 83.4 0 0.0
The table 8 above shows that children in the age group 30 – 41 months (6.2%) were more severely underweight, with those in age category 42 -53 months (15.2%) being more moderately underweight. Table 9: Prevalence of stunting based on height-for-age z-scores and by sex
All
n = 513
Boys
n = 249
Girls
n = 264
Prevalence of stunting
(<-2 z-score)
(48) 9.4 %
(6.4 - 13.5 95% C.I.)
(30) 12.0 %
(7.6 - 18.6 95% C.I.)
(18) 6.8 %
(4.2 - 10.9 95% C.I.)
Prevalence of moderate stunting
(<-2 z-score and >=-3 z-score)
(43) 8.4 %
(5.7 - 12.2 95% C.I.)
(27) 10.8 %
(6.7 - 17.0 95% C.I.)
(16) 6.1 %
(3.6 - 10.0 95% C.I.)
Prevalence of severe stunting
(<-3 z-score)
(5) 1.0 %
(0.4 - 2.3 95% C.I.)
(3) 1.2 %
(0.4 - 3.8 95% C.I.)
(2) 0.8 %
(0.2 - 3.0 95% C.I.)
The height-for-age index is an indicator of growth retardation/stunting. Stunting reflects failure
to receive adequate nutrition over a long period of time. Height-for-age represents long-term
effects of malnutrition in a population and is not due to short-term changes in dietary intake.

Survey findings show stunting at 9.4% of children 6-59 months with severe stunting at 1.0%.
Table 9: Prevalence of stunting by age based on height-for-age z-scores
Severe stunting (<-3 z-score)
Moderate stunting
(>= -3 and <-2 z-score )
Normal
(> = -2 z score)
Age (mo.)
Total no.
No. % No. % No. %
6-17 105 0 0.0 9 8.6 96 91.4
18-29 153 4 2.6 17 11.1 132 86.3
30-41 126 1 0.8 11 8.7 114 90.5
42-53 97 0 0.0 6 6.2 91 93.8
54-59 32 0 0.0 0 0.0 32 100.0
Total 513 5 1.0 43 8.4 465 90.6
According to the survey, children aged 18-29 months (2.6%) were mostly affected by both severe stunting and moderate stunting at 11.1%.
Table 10: Mean z-scores, Design Effects and excluded subjects
Indicator n Mean z-scores ± SD
Design Effect (z-score < -2)
z-scores not available*
z-scores out of range
Weight-for-Height 532 -1.24±1.05 2.10 0 7
Weight-for-Age 529 -1.03±1.02 2.16 0 10
Height-for-Age 513 -0.37±1.18 1.77 0 26 * contains for WHZ and WAZ the children with edema.
3.2 Nutrition Status of caregivers
According to the survey findings 72% of caregivers were either pregnant or breastfeeding as summarized in table 11 below:
Table 11: Physiological status of care givers Physiological status N %
Currently pregnant
109 25%
Lactating
203 47%
Not pregnant /not breastfeeding
122 28.%

Good nutrition is important for all pregnant women as it contributes to maternal health and
optimal birth outcomes.
Table 12: Nutritional status of care givers by MUAC
PHYSIOLOGICAL STATUS
(N=434)
MUAC < 21 MUAC > 21
Pregnant
16.5%
83.5%
Lactating
9.8%
90.2%
None
4.9%
91.5%
3.3 Children’s Morbidity Morbidity has direct relationship with acute malnutrition with nutritional deficiencies increasing the susceptibility of the child to infectious diseases such as diarrhea, fevers and malaria while on the other hand; illness interferes with the intake, digestion, absorption and utilization of nutrients leading to under nutrition. Retrospective morbidity data was collected among 6-59 months children (two-week recall) to assess the prevalence of main diseases. The survey established that 25% (138 cases) had been sick two weeks prior to survey period. Among children reported sick, the common type of illnesses was found to be fever with chills (42%) and ARI/Coughs at 71% as illustrated in the table below: Table 13: Child morbidity analysis by type of illness
Type of Illness WAJIR WEST/ELDAS (N=138)
n %
Fever with chills 58 42
ARI/Coughs 98 71
Watery Diarrhoea 11 8
Bloody Diarrhoea 1 1
The high proportion of children suffering from ARI/coughs could be attributed to the dry and dusty conditions which was evident during the survey period.

4. CONCLUSION AND RECOMMENDATIONS
The prevalence of Global Acute Malnutrition in Wajir West and Eldas sub-counties among the
surveyed population was estimated at 22.6 % (17.7 - 28.3 95% C.I) and the prevalence of severe
acute malnutrition was 7.1% (4.9 – 10.3 95% C.I). The malnutrition rate is classified as critical as
per the WHO classification.
The following recommendations were agreed upon together with the sub county and county health teams:
Action Rationale Responsible By When
Sensitization of health workers to carry out daily passive screening, growth monitoring & Health Education at Health facility level at any contact point with clients
To ensure early detection of malnutrition
SCHMT Eldas/Wajir West, IRK, UNICEF
End of March 2015
Mapping of hotspots across the two Sub-Counties and Carry out targeted joint monitoring
To plan for mass screening, scale up of HINI services, provide technical support
SCHMT Eldas/Wajir West, IRK, UNICEF
March 2015
Recruitment of more health workers in case caseloads are high
To enable facilities cope with increased admission figures
CHMT , IRK April, 2015
Operationalize Eldas SC and improve quality of care at Griftu SC through OJT
Increase capacity to deal with high workload
SCHMT Eldas/Wajir West, IRK, UNICEF
April 2015
Mapping and re-deployment of nutritionists to hot spot sites
Provide additional support to most affected areas
Director of Health/CNC
End of Feb 2015
Timely requisition and prepositioning of nutrition commodities at health facilities based on storage space and need at hot spots
SCNO, IRK, Aldef, WFP, UNICEF
15th Every Month
Sensitization of community members on hygiene and sanitation
SCHMT Eldas/Wajir West, IRK, UNICEF Mar-15
Sensitization of 8 and 3 CU s in Wajir West & Eldas respectively on malnutrition & active case finding, defaulter tracing and community referral mechanisms
To improve early detection SCHMT Eldas/Wajir West, IRK, UNICEF
April 2015
Sensitization of MtMSG and key community leaders on malnutrition.
SCHMT
Eldas/Wajir West,
IRK, UNICEF End of March 2015
Conduct mass screening SCNO Eldas/Wajir West, IRK, UNICEF
Feb/March 2015
5. APPENDICES
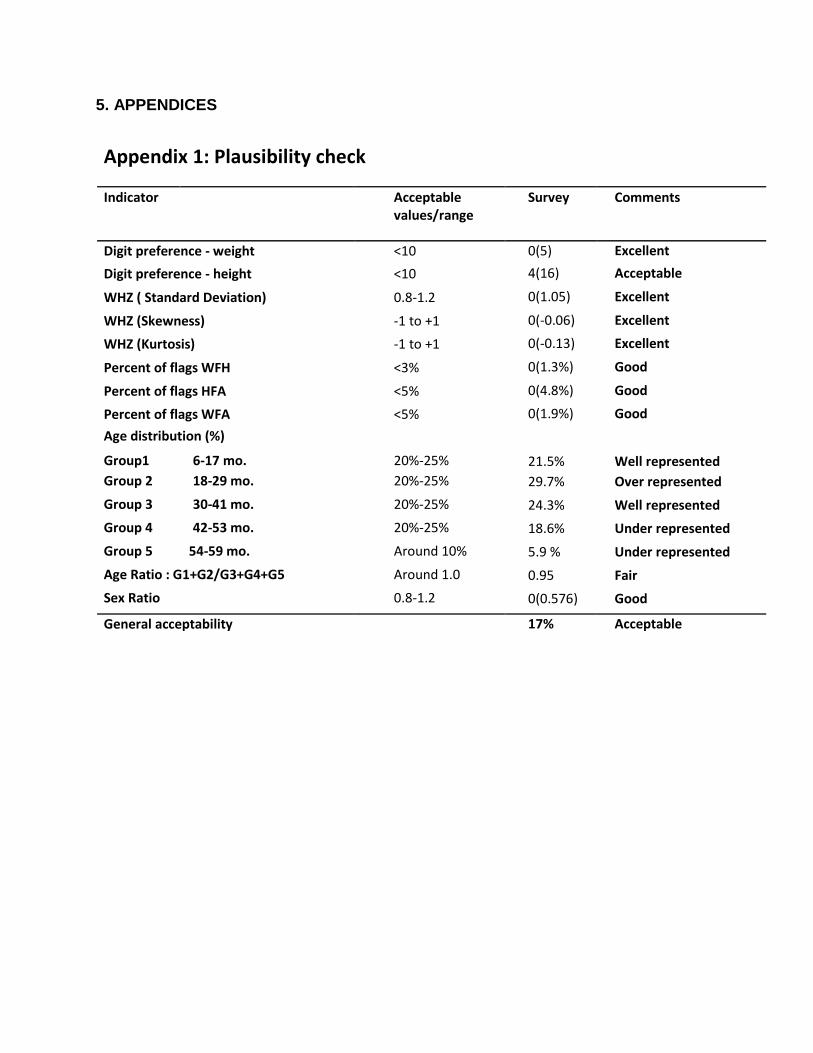
Appendix 1: Plausibility check
Indicator Acceptable Survey Comments values/range
Digit preference - weight <10 0(5) Excellent
Digit preference - height <10 4(16) Acceptable
WHZ ( Standard Deviation) 0.8-1.2 0(1.05) Excellent
WHZ (Skewness) -1 to +1 0(-0.06) Excellent
WHZ (Kurtosis) -1 to +1 0(-0.13) Excellent
Percent of flags WFH <3% 0(1.3%) Good
Percent of flags HFA <5% 0(4.8%) Good
Percent of flags WFA <5% 0(1.9%) Good
Age distribution (%)
Group1 6-17 mo. 20%-25% 21.5% Well represented Group 2 18-29 mo. 20%-25% 29.7% Over represented
Group 3 30-41 mo. 20%-25% 24.3% Well represented
Group 4 42-53 mo. 20%-25% 18.6% Under represented
Group 5 54-59 mo. Around 10% 5.9 % Under represented
Age Ratio : G1+G2/G3+G4+G5 Around 1.0 0.95 Fair
Sex Ratio 0.8-1.2 0(0.576) Good
General acceptability 17% Acceptable
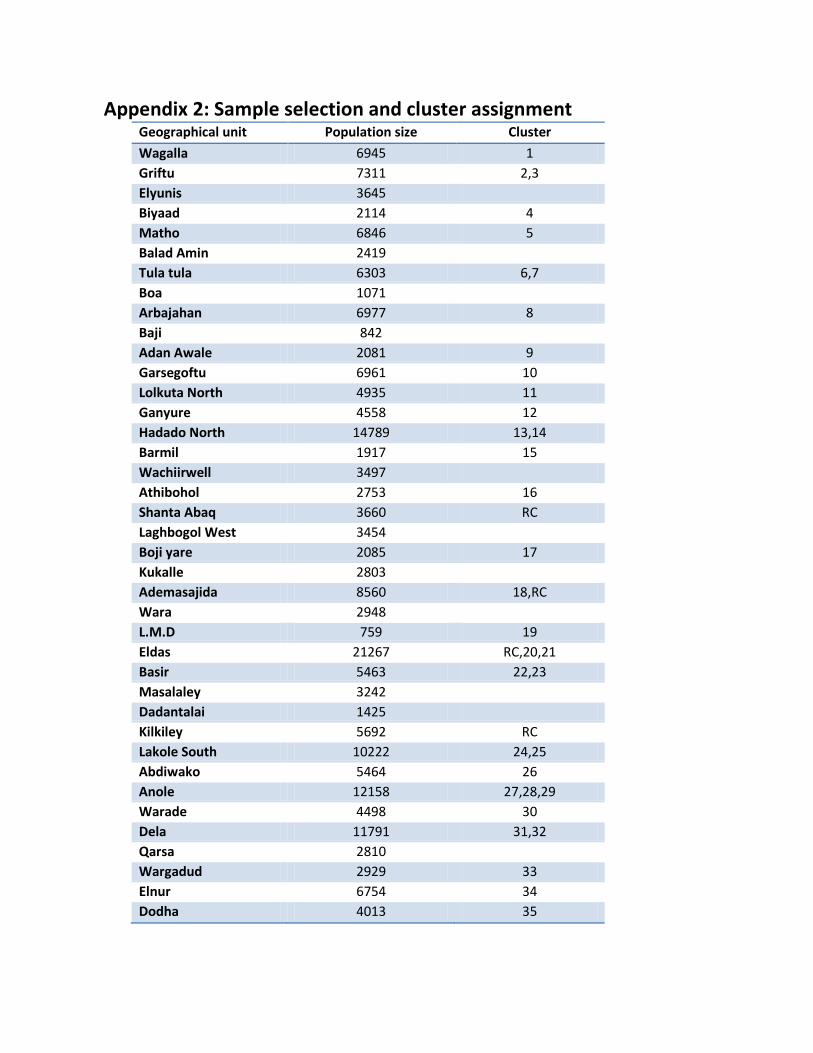
Appendix 2: Sample selection and cluster assignment
Geographical unit Population size Cluster
Wagalla 6945 1
Griftu 7311 2,3
Elyunis 3645
Biyaad 2114 4
Matho 6846 5
Balad Amin 2419
Tula tula 6303 6,7
Boa 1071
Arbajahan 6977 8
Baji 842
Adan Awale 2081 9
Garsegoftu 6961 10
Lolkuta North 4935 11
Ganyure 4558 12
Hadado North 14789 13,14
Barmil 1917 15
Wachiirwell 3497
Athibohol 2753 16
Shanta Abaq 3660 RC
Laghbogol West 3454
Boji yare 2085 17
Kukalle 2803
Ademasajida 8560 18,RC
Wara 2948
L.M.D 759 19
Eldas 21267 RC,20,21
Basir 5463 22,23
Masalaley 3242
Dadantalai 1425
Kilkiley 5692 RC
Lakole South 10222 24,25
Abdiwako 5464 26
Anole 12158 27,28,29
Warade 4498 30
Dela 11791 31,32
Qarsa 2810
Wargadud 2929 33
Elnur 6754 34
Dodha 4013 35
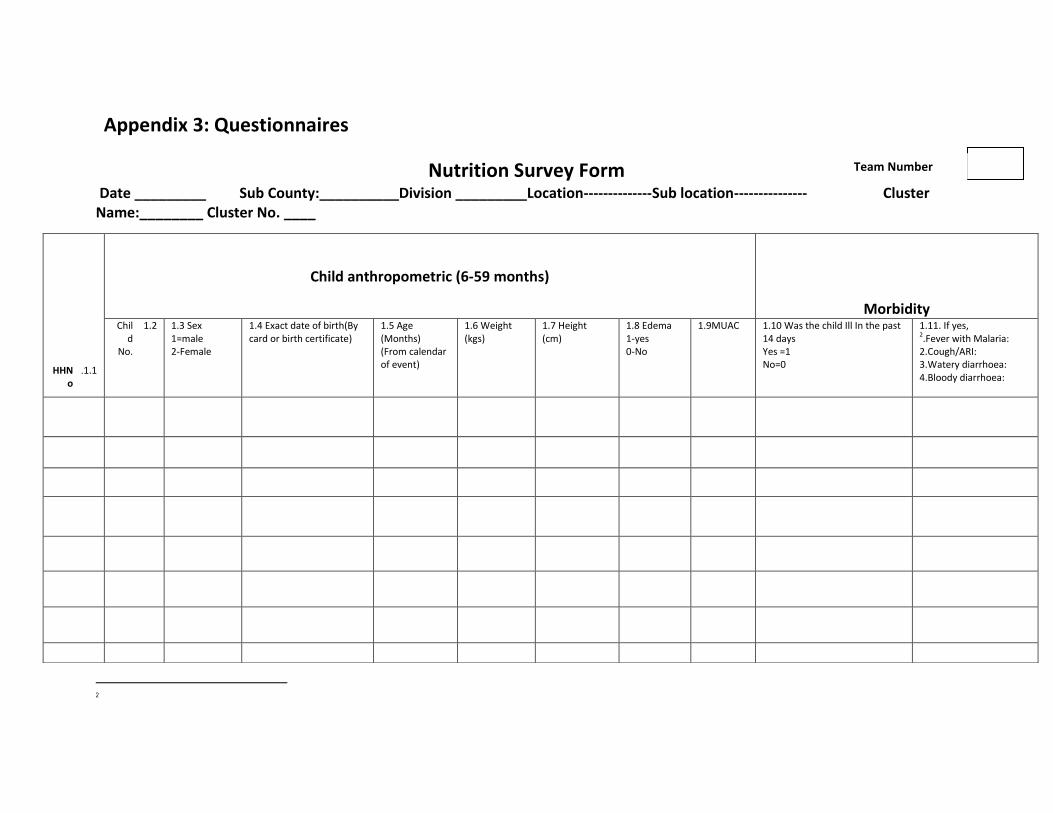
Appendix 3: Questionnaires
Nutrition Survey Form Date _________ Sub County:__________Division _________Location--------------Sub location--------------- Cluster Name:________ Cluster No. ____
2
1.1. HHNo
Child anthropometric (6-59 months)
Morbidity 1.2 Chil
d No.
1.3 Sex 1=male 2-Female
1.4 Exact date of birth(By card or birth certificate)
1.5 Age (Months) (From calendar of event)
1.6 Weight (kgs)
1.7 Height (cm)
1.8 Edema 1-yes 0-No
1.9MUAC 1.10 Was the child Ill In the past 14 days Yes =1 No=0
1.11. If yes, 2.Fever with Malaria: 2.Cough/ARI: 3.Watery diarrhoea: 4.Bloody diarrhoea:
Team Number
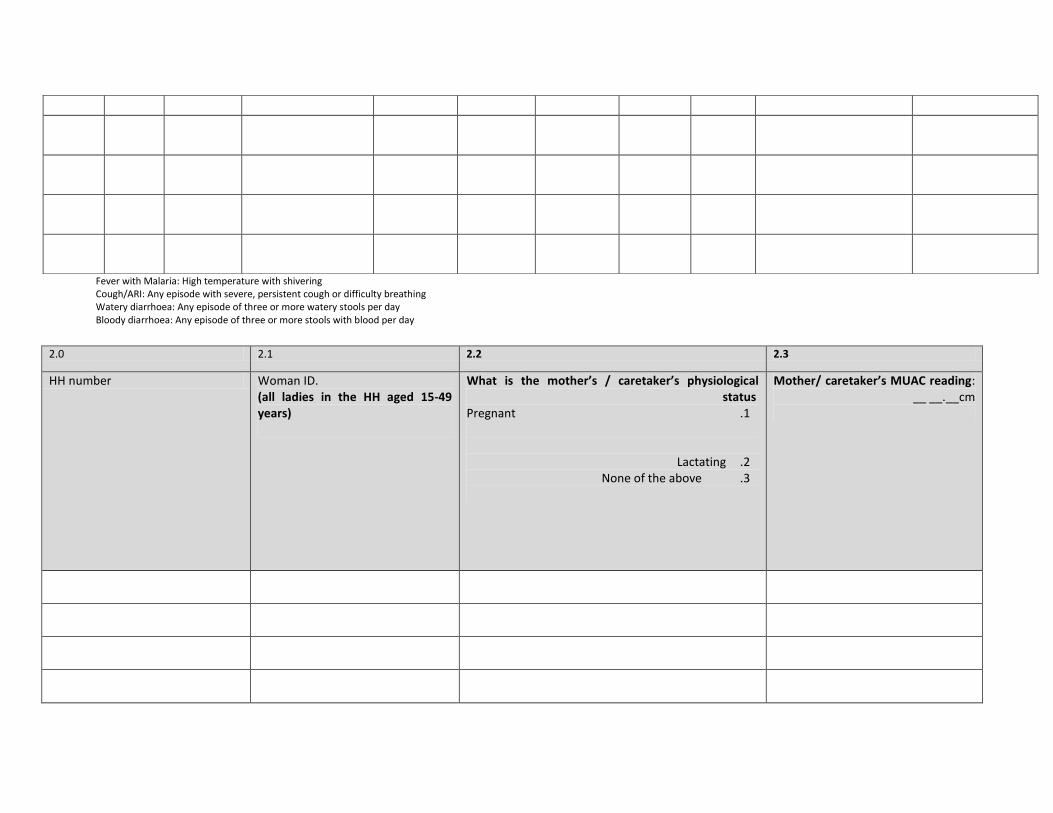
Fever with Malaria: High temperature with shivering Cough/ARI: Any episode with severe, persistent cough or difficulty breathing Watery diarrhoea: Any episode of three or more watery stools per day Bloody diarrhoea: Any episode of three or more stools with blood per day
2.0 2.1 2.2 2.3
HH number Woman ID. (all ladies in the HH aged 15-49 years)
What is the mother’s / caretaker’s physiological status
1. Pregnant
2. Lactating 3. None of the above
Mother/ caretaker’s MUAC reading: __ __.__cm

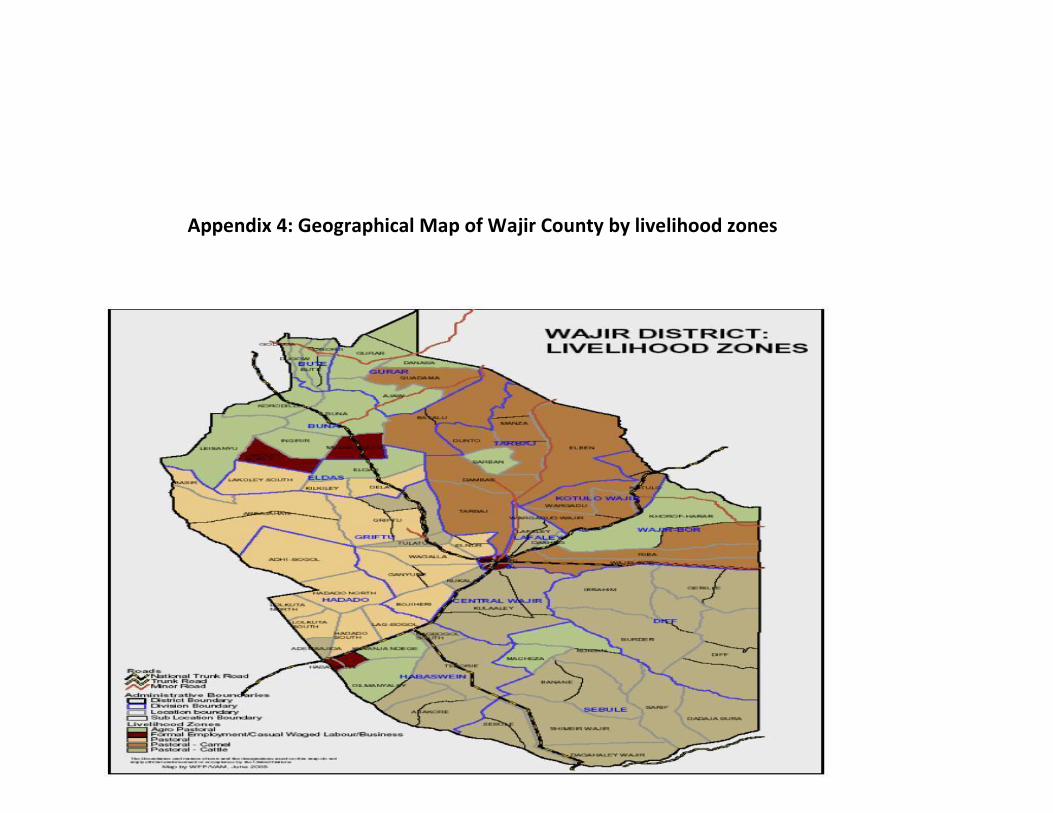
Appendix 4: Geographical Map of Wajir County by livelihood zones


