* [email protected]; phone 1 734-615-5290; http://www-personal.engin.umich.edu/~jerlynch/ Rapid-to-Deploy Wireless Monitoring Systems for Static and Dynamic Load Testing of Bridges: Validation on the Grove Street Bridge Tsung-Chin Hou and Jerome P. Lynch * Department of Civil and Environmental Engineering University of Michigan, Ann Arbor, MI 48109-2125, USA ABSTRACT Bridge management officials have expressed a keen interest in the use of low-cost and easy-to-install wireless sensors to record bridge responses during short-term load testing. To illustrate the suitability of wireless sensors for short-term monitoring of highway bridges, a wireless monitoring system is installed upon the Grove Street Bridge to monitor structural responses during static and dynamic load testing. Specifically, load testing of the Grove Street Bridge is conducted after its construction to validate the behavior of a novel jointless bridge deck constructed from a high- performance fiber reinforced cementitious composite (HPFRCC) material. A heterogeneous array of sensing transducers are installed in the bridge including metal foil strain gages, accelerometers and linear variable differential transducers (LVDTs). First, the acceleration response of the bridge is monitored by the wireless system during routine traffic loading. Modal parameters (modal frequencies and mode shapes) are calculated by the wireless sensors so that an analytical model of the bridge constructed in a standard commercial finite element package can be updated off-line. Next, the bridge is closed to traffic and trucks of known weight are parked on the bridge to induce static deformations. The installation strategy of the wireless monitoring system during static load testing is optimized to monitor the strain and rotation response of the HPFRCC deck. The measured static response of the deck is compared to that predicted by the updated analytical model. Keywords: load testing; wireless sensors, structural monitoring, system identification 1. INTRODUCTION The management of national transportation systems has grown increasingly complex due to aging inventories coupled with limited inspection and maintenance resources. In the United States, over $74 billion is invested annually to maintain and upgrade existing systems; unfortunately, this investment is shy of the $91 billion needed to adequately maintain our infrastructure systems [2]. To ensure the safety of the national inventory of highway bridges (currently over 583,000 bridges), the federal National Bridge Inspection Program (NBIP) was established in 1971. The NBIP mandates highway bridges be visually inspected every two years. Based on past ratings, approximately 13% of the national bridge inventory is currently classified by the NBIP guidelines as structurally deficient, suggesting many bridges do not meet safety standards [3]. Bridge managers are exploring the adoption of nondestructive evaluation (NDE) technologies (e.g. ultrasonic testing) so that NBIP bridge ratings are given with greater objectivity. In addition, structural monitoring systems installed in highway bridges for short- or long-term study can alternatively be employed. However, structural monitoring systems are often reserved for instances where their necessity clearly offsets their relatively high cost. A large contributor to the total cost of a structural monitoring system is the cost associated with installation of coaxial wires in the structure. Alternatively, wireless sensors have been proposed to eliminate coaxial wiring between sensors in a structural monitoring system. Elimination of wiring also allows bridge inspectors to quickly move individual wireless sensors during short-term testing. Since their introduction, wireless monitoring systems have rapidly advanced with current platforms offering performance levels on par with those of common tethered systems. Recent short-term installations of Source: SPIE 13th Annual International Symposium on Smart Structures and Materials, San Diego, CA, February 26 - March 2, 2006.
Rapid-to-Deploy Wireless Monitoring Systems for Static and Dynamic Load Testing of Bridges: Validation on the Grove Street Bridge
Tsung-Chin Hou and Jerome P. Lynch*
Department of Civil and Environmental Engineering University of Michigan, Ann Arbor, MI 48109-2125, USA
ABSTRACT Bridge management officials have expressed a keen interest in the use of low-cost and easy-to-install wireless sensors to record bridge responses during short-term load testing. To illustrate the suitability of wireless sensors for short-term monitoring of highway bridges, a wireless monitoring system is installed upon the Grove Street Bridge to monitor structural responses during static and dynamic load testing. Specifically, load testing of the Grove Street Bridge is conducted after its construction to validate the behavior of a novel jointless bridge deck constructed from a high-performance fiber reinforced cementitious composite (HPFRCC) material. A heterogeneous array of sensing transducers are installed in the bridge including metal foil strain gages, accelerometers and linear variable differential transducers (LVDTs). First, the acceleration response of the bridge is monitored by the wireless system during routine traffic loading. Modal parameters (modal frequencies and mode shapes) are calculated by the wireless sensors so that an analytical model of the bridge constructed in a standard commercial finite element package can be updated off-line. Next, the bridge is closed to traffic and trucks of known weight are parked on the bridge to induce static deformations. The installation strategy of the wireless monitoring system during static load testing is optimized to monitor the strain and rotation response of the HPFRCC deck. The measured static response of the deck is compared to that predicted by the updated analytical model. Keywords: load testing; wireless sensors, structural monitoring, system identification
1. INTRODUCTION The management of national transportation systems has grown increasingly complex due to aging inventories coupled with limited inspection and maintenance resources. In the United States, over $74 billion is invested annually to maintain and upgrade existing systems; unfortunately, this investment is shy of the $91 billion needed to adequately maintain our infrastructure systems [2]. To ensure the safety of the national inventory of highway bridges (currently over 583,000 bridges), the federal National Bridge Inspection Program (NBIP) was established in 1971. The NBIP mandates highway bridges be visually inspected every two years. Based on past ratings, approximately 13% of the national bridge inventory is currently classified by the NBIP guidelines as structurally deficient, suggesting many bridges do not meet safety standards [3]. Bridge managers are exploring the adoption of nondestructive evaluation (NDE) technologies (e.g. ultrasonic testing) so that NBIP bridge ratings are given with greater objectivity. In addition, structural monitoring systems installed in highway bridges for short- or long-term study can alternatively be employed. However, structural monitoring systems are often reserved for instances where their necessity clearly offsets their relatively high cost. A large contributor to the total cost of a structural monitoring system is the cost associated with installation of coaxial wires in the structure. Alternatively, wireless sensors have been proposed to eliminate coaxial wiring between sensors in a structural monitoring system. Elimination of wiring also allows bridge inspectors to quickly move individual wireless sensors during short-term testing. Since their introduction, wireless monitoring systems have rapidly advanced with current platforms offering performance levels on par with those of common tethered systems. Recent short-term installations of
Source: SPIE 13th Annual International Symposium on Smart Structures and Materials, San Diego, CA, February 26 - March 2, 2006.
wireless monitoring systems in long-span bridges, including the Alamosa Canyon Bridge (New Mexico)[4], Geumdang Bridge (Korea)[5], and Gi-Lu Bridge (Taiwan)[6], have all validated the accuracy and ease-of-use of wireless monitoring systems in real civil structures. These studies represent only a first step towards complete understanding of the merits and limitations of wireless monitoring technologies; further testing in the complex field environment is needed. Wireless monitoring systems can also serve as powerful tools for the rapid collection of bridge response data used to validate assumptions and novel concepts adopted in the design process. In Michigan, many highway bridges have deteriorated bridge decks due to poorly maintained expansion joints. Cracks resulting from restrained thermal expansion commonly end with the corrosion of buried steel reinforcement and steel girders below the cracked deck. To remedy this recurrent problem, a number of researchers have explored the concept of a jointless bridge deck which are decks designed without expansion joints. In lieu of expansion joints, soft and flexible link slab elements are integrated in the deck between adjacent bridge spans. The result is a link slab that renders the bridge deck continuous but also permits the spans to operate independently as would be the case with expansion joints. Since the initial study by Caner and Zia [1], a number of bridges in the United States have adopted the jointless bridge design concept. For example, Wing and Kowalsky [7] report on a long-term monitoring study that measured the performance of a jointless bridge designed in North Carolina; the link slab in their study employed concrete as the primary slab material. Since 2001, the Michigan Department of Transportation (MDOT) has designed and constructed 8 bridges using the jointless deck design concept. In all of these jointless bridges, the link slab is constructed of concrete. To control cracking in the link slab when loaded, significant longitudinal reinforcement detailing is necessary. If too little longitudinal reinforcement is specified in the link slab design, significant cracking may occur thereby negating the benefit of removing bridge expansion joints. To address this concern, MDOT has proposed the adoption of a highly ductile cementitious material known as engineered cementitious composites (ECC) for link slab construction [8]. Under tension, this high-performance fiber reinforced cementitious composite undergoes strain hardening with energy released by micro-cracking in the cement matrix. ECC micro-cracking is an inherent material property independent of longitudinal steel reinforcement; this renders the material well suited for the construction of link slab elements. In 2005, a highway bridge requiring deck rehabilitation was identified for installation of an ECC link slab element. The Grove Street Bridge, located in Ypsilanti, Michigan, was selected. Being the first bridge designed in the United States with an ECC link slab element, MDOT sought a rapid means of assessing the slab performance under the anticipated maximum traffic load for which the bridge is designed. Wireless sensors, because of their cost and installation attributes, are ideally suited for the rapid collection of link slab response measurements during load testing conducted on the Grove Street Bridge. In this study, a wireless monitoring system is installed on the Grove Street Bridge during and after its construction to monitor the performance of the ECC link slab under static loading. Instrumentation of the bridge is conducted in concert with the construction schedule of the bridge. The bridge is constructed in two phases with phase one reconstructing half of the bridge width while the other half remains open to two-way traffic. At the end of the first phase, the reconstructed half-width of the bridge is opened to two-way traffic while the remaining half of the bridge is reconstructed. The testing strategy for the Grove Street Bridge is broken down to two stages. First, wireless sensors are installed after completion of the first half of the bridge construction to monitor static strain responses of the ECC link slab due to heavy trucks positioned along the bridge length. Second, after the bridge has been fully reconstructed, wireless sensors are installed to monitor the static strain response and rotation of the link slab element under static loading again delivered by the same pair of trucks. To update a finite element model of the bridge, the acceleration response of the completely rehabilitated bridge (full-width) is monitored using wireless sensors. The dynamic properties of the reconstructed bridge (including modal frequencies and mode shapes) are estimated from the acceleration response data to assist in updating the finite element model of the bridge. The updated model is then used to confirm the static response of the bridge measured during the second stage of field testing on the full width bridge.
2. GROVE STREET BRIDGE The Grove Street Bridge, shown in Figure 1, is located in Ypsilanti, Michigan and carries two opposing lanes of traffic over Interstate 94. The two-lane highway bridge, designed in the late-1960’s, is primarily a steel girder-concrete deck
composite structure with a 42° skew angle. The 9 in. concrete bridge deck is supported by 10 built-up steel girder sections to which shear studs are welded on the top flange surface. The bridge is designed to carry traffic using 4 independent spans. The north and south spans (denoted herein as Spans 1 & 4) are designed as cantilever bridge spans. Each cantilever span is 66 ft long with one end supported by a bridge abutment and at the other by a pier situated 8 ft from the span edge. The two inner spans (denoted herein as Spans 2 & 3) are each supported at one end by the north and south cantilever spans using pinned link plates as shown in Figure 1. The opposite ends of Spans 2 & 3 share a concrete pier at the bridge center. Reconstruction of the bridge occurs during the summer months of 2005. The bridge is constructed in two phases to permit the continual use of the bridge by traffic on Grove Street. First, the northbound half-width is reconstructed while the southbound half carries two opposing lanes of traffic. After the northbound half-width is completed, it is used for two-way traffic while the southbound half-width is reconstructed. A integral feature of the Grove Street Bridge retrofit project includes the adoption of a flexible link slab element at the bridge center. Adoption of the jointless bridge design concept eliminates the expansion joint at the bridge center, thereby minimizing future maintenance efforts associated with cracked decks. The design of the ECC link slab follows the link slab design guidelines offered by Caner and Zia [1] originally proposed for concrete link slabs. The link slab is designed to be sufficiently flexible (offering no rotational restraint) to permit the spans on both sides of the link slab to behave as simply supported elements. To ensure the stiffness of the link slab is sufficiently low, it is recommended to debound the link slab from the ends of the steel girders for a length (Ldz) of at least 5% of the total simply supported span length. The link slab is designed to undergo strain induced by the moments developed at the span-link slab interface. If the link slab moment of inertia, Ils, and elastic modulus, E, are known, then the constant moment, Mls, developed in the link slab due to the relative rotation, θ, at the link slab ends is given [1]:
θdz
lsls L
EIM 2= (1)
The link slab element is designed to withstand the induced moment using the standard AASHTO (American Association of State Highway and Transportation Officials) crack control specifications. AASHTO also specifies the rotation angle of the simply supported bridge spans should not exceed 0.00375 rad under specified truck loadings (generally, H and HS series trucks). In the ECC link slab designed for the Grove Street Bridge, the ECC is designed to operate in its elastic region (pre-strain hardening) under the maximum permissible rotation (0.00375 rad).
3. INSTRUMENTATION Instrumentation of the Grove Street Bridge is selected to obtain a quantitative measure of the performance of the ECC link-slab and the adjoining free spans of the bridge. The stated goals of testing are to ascertain the dynamic properties (modal parameters including natural frequencies and mode shapes) of the bridge and two specific static response
(a) (b)
Figure 1. Grove Street Bridge, Ypsilanti, Michigan: (a) top view plan and (b) link slab section
(a) (b) (c)
Figure 2. Wireless structural monitoring system components: (a) fully assembled wireless sensor opened to reveal power source (batteries), (b) strain gage interface circuit, and (c) accelerometer amplification circuit
parameters of the link slab element: 1) maximum rotation at the ends of the link slab, and, 2) the maximum tensile strain of the link slab top surface under static live loading conditions (HS25 trucks). 3.1 Wireless data acquisition For the collection of bridge response data, a wireless monitoring system assembled from a set of wireless sensor prototypes is employed in this study. The wireless sensors are not sensor per se, but rather are autonomous nodes of a wireless data acquisition system to which traditional sensors (e.g. accelerometers, strain gages, among others) can be interfaced. The wireless sensors, as fully described in Wang, Lynch and Law [9], are assembled from off-the-shelf electrical components to offer true 16-bit data acquisition capabilities. The wireless sensors employed in this study are academic prototypes fabricated at the University of Michigan. They feature 4-channels for simultaneous data collection from up to 4 analog sensors at sample rates as high as 100 kHz. In addition, the wireless sensors can achieve communication ranges exceeding 1000 ft. using a spread spectrum 900 MHz wireless transceiver (Maxstream 9XCite). Included in the wireless sensor design is a low-power 8-bit microcontroller (Atmel ATmega128) which is responsible for: 1) coordinating data collection tasks, 2) locally interrogating response data (including modal parameter estimation), 3) local storage of data, and 4) transfer of data through the wireless transceiver. When deployed upon the Grove Street Bridge, the wireless sensors are packaged in a hardened plastic container and are powered by batteries (5 AA batteries) which offer an operational life expectancy of 30 continuous hours. A picture of the completed wireless sensor prototype is shown in Figure 2a. 3.2 Strain gages for link slab strain measurement: The strain response of the ECC link slab element is monitored using strain gages mounted to the continuous longitudinal steel reinforcement running parallel to the slab width. The epoxy coating on the reinforcement steel is removed and thin film strain gages (Texas Measurements FLA-5) are mounted to a flat surface machined on the steel face. The gage factor of these 120 Ω strain gages are 2.0 and their gage length is 0.2 in. After the strain gages are securely mounted (Texas Measurements CN bonding adhesive), epoxy is recoated upon the bar to protect it from long-term corrosion. The wires that originate from the gages are carried to the slab’s top surface where they connect to the wireless sensors situated on the top deck of the bridge. Mounted to the top surface of the Grove Street Bridge link slab is an additional set of metal foil strain gages (Texas Measurements metal-backing Strain Gage FLM-60-11) with a 2.4 in. gage length, 2.0 gage factor and 120 Ω resistance. A Wheatstone bridge circuit is required to convert strain gage readings to a voltage signal compatible with the wireless sensor (0 - 5V). A separate signal conditioning board is designed and fabricated that allows 120 Ω strain gages to be connected to a Wheatstone bridge circuit. The bridge circuit also amplifies the bridge output by 50 before superimposing it upon a 2.5 V output that is connected to the wireless sensor. A picture of the strain gage circuit is shown in Figure 2b.
Figure 3. Location of strain gages within the ECC link slab element
3.3 Linear variable differential transducers (LVDTs) for beam rotation: To measure the rotation of the bridge spans located to the left and right of the center pier, a set of identical LVDTs are installed on the top and bottom surfaces of two adjacent steel beam webs. Based on the relative displacements of the top and bottom portions of a girder, span end rotations will be calculated. The LVDT selected in this study is the Novotechnik TR10 (maximum displacement of 0.39 in.). 3.4 Microelectromechanical systems (MEMS) accelerometers: To measure the acceleration response of the bridge to ambient traffic loading, a set of accelerometers are installed along the bridge length. The microelectromechanical system (MEMS) Crossbow CXL02 accelerometers are selected for use in this study. The CXL02 accelerometers, with an acceleration range of + 2g, noise floor of 0.5 mg and sensitivity of 1 V/g, are particularly well suited for dynamic structural monitoring. Prior use of MEMS accelerometers with wireless sensors in the Geumdang Bridge dynamic monitoring study [5] revealed the lower than expected performance of the wireless sensor’s analog-to-digital converter (ADC). To overcome the reduced resolution of the 16-bit ADC (measured to be a little better than 13-bits), a separate signal conditioning circuit is designed to amplify and band-pass the outputs of MEMS accelerometers. The signal conditioning circuit, shown in Figure 2c, has a pass band of 0.014 to 25 Hz and is able to amplify sensor outputs by 5, 10 or 20 times.
4. HALF-WIDTH STATIC LOAD TESTING During construction of the first half-width (the northbound side) of the Grove Street Bridge, three metal foil strain gages are mounted to a longitudinal steel reinforcement bar. As shown in Figure 3, the three Texas Measurements FLA-5 strain gages are epoxy mounted to the surface of a longitudinal reinforcement bar 14 ft from the edge of the link slab. The three gages are configured with one strain gage in the center of the link slab and the two remaining gages mounted 2 ft from both sides of the center gage. After the ECC link slab is poured and cured for one-week, epoxy mounted to the slab surface immediately above the buried strain gages are three Texas Measurements FLM-60-11 gages. Each of the six strain gages is individually interfaced to a Wheatstone bridge circuit which is then connected to a wireless sensor. In total, six wireless sensors are employed to record the strain response of the link slab. The first set of load tests, conducted on September 19, 2005, is intended to measure the static strain response of the link slab under truck loading. For static loading of the reconstructed bridge half-width, two 6-axel carting trucks (Figure 4) are selected because their weights have the same load effect as the design load (AASHTO HS25 truck). Each truck, prior to arrival, is driven to a local highway weigh station (Grass Lake, Michigan) where each axel weight is measured. The approximate weights of the axels, starting with the first axel in the front of the truck, are 18000, 16000, 16000, 13000, 13000, and 13000 lb, respectively.
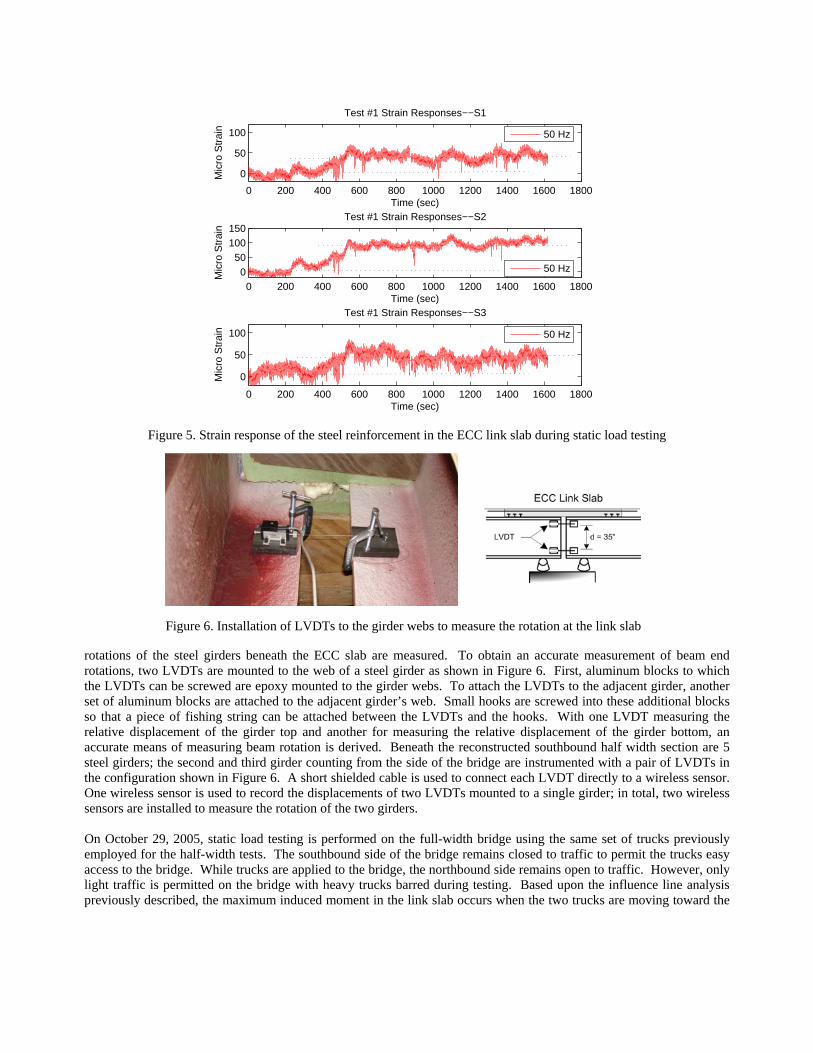
Based upon an influence line analysis conducted using an analytical model of the half-width bridge configuration, the truck location inducing maximum girder rotation beneath the link slab is identified. This location is roughly 35 ft. from the center line of the link slab element. The 6-axel trucks are slowly driven (5 mi/hr) from opposite ends of the bridge to locations 35 ft. from the link slab center as shown in Figure 4c. When the trucks reach their final location, they stop and remain parked. While the trucks are driven to this position, the wireless monitoring system is recording (at 50 Hz) the strain from the three strain gages mounted to the steel reinforcement (locations S1, S2 and S3 in Figure 3). In addition, the strain gages mounted to the link slab surface are simultaneously monitored but the results from these gages suffer from extreme zero-mean drifts and are discounted. During testing, a laptop computer is employed as a data repository for the wireless monitoring system; the laptop is located 40 feet from the center of the link slab on the northern half of the bridge. As shown in Figure 5, the strain gages mounted to the reinforcement bar provide a rough measure of the strain response of the link slab. As can be seen by the strain gage time history plots, the strain gages suffer from some variation in their zero-mean signals. Irrespective of these drifts, the strain time histories reveal the slow increase in strain as the trucks drive to their final locations (300 to 600 seconds). The mean strain at strain gage S2 is roughly 95 µε while at S1 and S3 it is lower at 48 µε. This is expected since strain gage S2 is at the center of the link slab while S1 and S3 are situated 2 ft from S1. At some location along the length of the link slab, the link slab must have zero curvature suggesting the strains would reduce as the measurement point is moved away from the link slab center. The measured maximum strain values of the ECC link slab are compared to those predicted by an analytical model of the half-width bridge. The analytical model predict a maximum strain in the center of the ECC slab to be 68 µε. The static load tests are repeated a number of times with similar results obtained.
5. FULL-WIDTH STATIC LOAD TESTING During construction of the southbound bridge half-width, again, metal foil strain gages (Texas Measurements FLA-5) are mounted to a longitudinal reinforcement bar in the ECC link slab. As presented in Figure 3, a longitudinal bar roughly 14 ft from the side of the bridge is instrumented with three strain gages (denoted as S4, S5, and S6). Strain gage S5 is positioned in the center of the ECC link slab while S4 and S6 are 2 ft away from both sides of S5. Each buried strain gage is interfaced to a Wheatstone bridge circuit which is connected to a wireless sensor. In total, three wireless sensors are employed to record the strain response of the ECC link slab. The Caner and Zia [1] link slab design procedure directly correlates top surface strain in the link slab element to the rotation induced at the link slab ends (Equation 1). To experimentally validate this relationship for an ECC link slab, the
0 200 400 600 800 1000 1200 1400 1600 1800
0
50
100
Test #1 Strain Responses−−S1
Time (sec)
Mic
ro S
trai
n
0 200 400 600 800 1000 1200 1400 1600 18000
50100150
Test #1 Strain Responses−−S2
Time (sec)
Mic
ro S
trai
n
0 200 400 600 800 1000 1200 1400 1600 1800
0
50
100
Test #1 Strain Responses−−S3
Time (sec)
Mic
ro S
trai
n
50 Hz
50 Hz
50 Hz
Figure 5. Strain response of the steel reinforcement in the ECC link slab during static load testing
Figure 6. Installation of LVDTs to the girder webs to measure the rotation at the link slab
rotations of the steel girders beneath the ECC slab are measured. To obtain an accurate measurement of beam end rotations, two LVDTs are mounted to the web of a steel girder as shown in Figure 6. First, aluminum blocks to which the LVDTs can be screwed are epoxy mounted to the girder webs. To attach the LVDTs to the adjacent girder, another set of aluminum blocks are attached to the adjacent girder’s web. Small hooks are screwed into these additional blocks so that a piece of fishing string can be attached between the LVDTs and the hooks. With one LVDT measuring the relative displacement of the girder top and another for measuring the relative displacement of the girder bottom, an accurate means of measuring beam rotation is derived. Beneath the reconstructed southbound half width section are 5 steel girders; the second and third girder counting from the side of the bridge are instrumented with a pair of LVDTs in the configuration shown in Figure 6. A short shielded cable is used to connect each LVDT directly to a wireless sensor. One wireless sensor is used to record the displacements of two LVDTs mounted to a single girder; in total, two wireless sensors are installed to measure the rotation of the two girders. On October 29, 2005, static load testing is performed on the full-width bridge using the same set of trucks previously employed for the half-width tests. The southbound side of the bridge remains closed to traffic to permit the trucks easy access to the bridge. While trucks are applied to the bridge, the northbound side remains open to traffic. However, only light traffic is permitted on the bridge with heavy trucks barred during testing. Based upon the influence line analysis previously described, the maximum induced moment in the link slab occurs when the two trucks are moving toward the
12 14 16 18 20 22−5
0
5
10x 10
−4
Rot
atio
n (r
ad)
Derived from LVDTs
12 14 16 18 20 22−2
0
2
4
6x 10
−5
Str
ain
Caner & Zia Estimate
12 14 16 18 20 22
0
2
4x 10
−5
Str
ain
Time (sec)
Strain Gage S5
Figure 7. (Top) girder 2 (beneath the southbound) rotation calculated from top and bottom girder LVDTs; (middle) estimated strain based on link slab rotation [1]; (bottom) measured strain in S4, S5 and S6.
link slab and stop with their first axles 35 ft. away from the link slab center. Similar to the load tests prescribed for the half-width bridge, the two trucks are located on opposite sides of the link slab element. The first test consists of the trucks driving onto the bridge from opposite sides at a slow speed (5 mi/hr) until they reach their final positions 35 ft from the link slab center. As the trucks proceed onto the bridge, the strain gages and LVDTs are recorded using 5 wireless sensors installed on the bridge deck (3 wireless sensors are reserved for the three strain gages while 2 wireless sensors record the girder rotations each from 2 LVDTs). Bridge response data collected (at 50 Hz) by the wireless sensors is wirelessly transmitted to a laptop computer serving as the wireless monitoring system data repository. This laptop is again situated roughly 40 ft from the center of the link slab. As presented in Figure 7, rotation measurements of the girders beneath the link slab are of a high quality. For the set of LVDTs installed upon the second girder, the point when the trucks ride upon the simply supported spans adjacent to the link slab can be identified at 14 seconds; the trucks come to a stop with maximum girder rotations attained (6.33 x 10⁻⁴ rad.) at 20 seconds. Using Equation 1, which calculates the moment in the link slab resulting from the span rotation, the strain in the center of the top face of the link slab is estimated to be 41.2 µε. Similar results are found for the third girder with a calculated rotation of 7.61 x 10⁻⁴ rad and estimated link slab strain of 50.0 µε. These results correspond well to data collected from strain gages mounted to the buried steel reinforcement (strain gages S4, S5, and S6); for example, for strain gage S5, the maximum strain measured during the test was 30 µε which is a bit shy of the estimated 41.2 µε (25% difference). This result suggests the Caner and Zia [1] design method is applicable for ECC link slabs. An assortment of additional static load tests are conducted using the two trucks. The results obtained from the LVDT’s are of a consistently high quality as previously presented. However, the strain gages for the full width static load tests were somewhat temperamental with zero mean drifts. For some of the load tests, the strain gage data quality is consistent with that presented in Figure 7; for other tests, mean drifts hide changes in the slab strain due to truck loading.
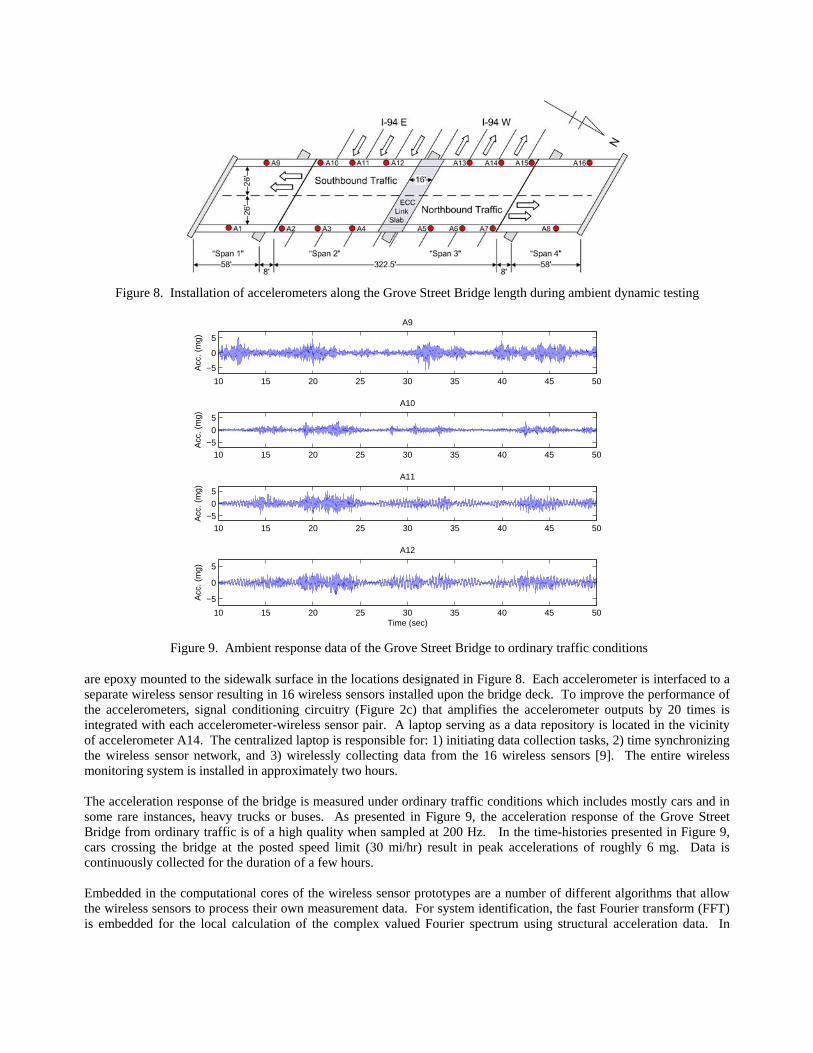
6. AMBIENT VIBRATION TESTING AND MODEL UPDATING In addition to measurement of the static response of the ECC link slab, the dynamic properties of the reconstructed full-width bridge are of interest. The motivation for dynamic testing is to record ambient vibration data from which modal parameters can be extracted including modal frequencies and mode shapes. The modal parameters will be utilized to update a finite element model of the bridge. To record the response of the bridge, 16 Crossbow CXL02 accelerometers
are epoxy mounted to the sidewalk surface in the locations designated in Figure 8. Each accelerometer is interfaced to a separate wireless sensor resulting in 16 wireless sensors installed upon the bridge deck. To improve the performance of the accelerometers, signal conditioning circuitry (Figure 2c) that amplifies the accelerometer outputs by 20 times is integrated with each accelerometer-wireless sensor pair. A laptop serving as a data repository is located in the vicinity of accelerometer A14. The centralized laptop is responsible for: 1) initiating data collection tasks, 2) time synchronizing the wireless sensor network, and 3) wirelessly collecting data from the 16 wireless sensors [9]. The entire wireless monitoring system is installed in approximately two hours. The acceleration response of the bridge is measured under ordinary traffic conditions which includes mostly cars and in some rare instances, heavy trucks or buses. As presented in Figure 9, the acceleration response of the Grove Street Bridge from ordinary traffic is of a high quality when sampled at 200 Hz. In the time-histories presented in Figure 9, cars crossing the bridge at the posted speed limit (30 mi/hr) result in peak accelerations of roughly 6 mg. Data is continuously collected for the duration of a few hours. Embedded in the computational cores of the wireless sensor prototypes are a number of different algorithms that allow the wireless sensors to process their own measurement data. For system identification, the fast Fourier transform (FFT) is embedded for the local calculation of the complex valued Fourier spectrum using structural acceleration data. In
Figure 8. Installation of accelerometers along the Grove Street Bridge length during ambient dynamic testing
10 15 20 25 30 35 40 45 50
−5
0
5
A9
Acc
. (m
g)
10 15 20 25 30 35 40 45 50−5
0
5
A10
Acc
. (m
g)
10 15 20 25 30 35 40 45 50−5
0
5
A11
Acc
. (m
g)
10 15 20 25 30 35 40 45 50
−5
0
5
A12
Time (sec)
Acc
. (m
g)
Figure 9. Ambient response data of the Grove Street Bridge to ordinary traffic conditions
addition to the FFT, a peak picking algorithm is also embedded so that model frequencies can be estimated from Fourier spectra. As will be illustrated in this study, the combination of the FFT and peak picking algorithms will provide the wireless monitoring system with the capability to estimate modal frequencies as well as the mode shapes of the bridge. Provided an output-only structural response data set, it is assumed that the traffic crossing the Grove Street bridge provides a broadband excitation source [10]. By assuming the system input is broadband, the Fourier spectrum calculated by the wireless sensors can be treated as the structure’s transfer function which offers a direct measure of the system’s modal features. The Fourier spectra (4096 point) calculated by the wireless monitoring system are presented in Figure 10. The wireless sensor peak picking algorithm identifies the frequencies corresponding to the bridge’s first three modes at 2.91, 3.22, 3.39, 4.35 Hz. After determination of the modal frequencies, the wireless sensors wirelessly transmit the imaginary component of their Fourier spectra at those four modal frequencies. If the modal frequencies are assumed to be well spaced and the structure lightly damped, the imaginary component of the Fourier spectra at modal frequencies are proportionally scaled to the structure’s mode shape [11]. Commonly termed operational deflection shapes (ODS), for a broadband input, the ODS are equivalent to the structural mode shapes. During collection of ambient vibration data, the Grove Street Bridge wireless monitoring system calculates the mode shapes of the bridge using the distributed computational resources of the wireless monitoring system. The calculated mode shapes are presented in Figure 11: mode 1 (2.91 Hz) is primarily a flexural mode, mode 2 (3.22 Hz) is dominated by torsion, and mode 3 (3.39 Hz) and mode 4 (4.35 Hz) are higher order flexural modes. A finite element model of the bridge is constructed using the commercial SAP2000 finite element package. The bridge is modeled full-width, as was tested in the field. The modal frequencies and mode shapes calculated by SAP2000 are compared to those empirically derived during field testing. The modal assurance criteria (MAC) is a single index that can be used to assess the correlation between modes experimentally derived and those calculated by SAP2000 [12].
( )
( ) ( )⎟⎠
⎞⎜⎝
⎛⋅⎟
⎠
⎞⎜⎝
⎛⋅
⋅=
∑∑
∑n
iSAP
iSAP
ni
Wirelessi
Wireless
niSAP
iWireless
conjconj
conjMAC
120002000
1
2
12000
φφφφ
φφ (2)
In Equation 2, φWireless corresponds to the mode determined by the wireless monitoring system while φSAP2000 represents the mode calculated by SAP2000. A MAC close to 1 suggests the modes are correlated and a MAC close to 0 suggests the modes are uncorrelated and orthogonal. In this study, the MAC is used as an integral element of a model updating scheme used to refine the SAP2000 model. Model parameters including the modulus of elasticity of the bridge deck, support conditions, and the amount of composite action between the bridge deck and steel girders are varied to maximize the MAC between the SAP2000 and wireless monitoring system modes. The modal frequencies of the final SAP2000 model, after updating, are presented in Table 1.
2 2.5 3 3.5 4 4.5 5 5.5 60
20
40
60
80
100
120
140A1
Frequency (Hz)
Mag
nitu
de
2 2.5 3 3.5 4 4.5 5 5.5 60
50
100
150
200
250A2
Frequency (Hz)
Mag
nitu
de
2 2.5 3 3.5 4 4.5 5 5.5 60
200
400
600
800
1000
1200
1400
1600A5
Frequency (Hz)
Mag
nitu
de
Figure 10. Dynamic test 1 responses at A1, A2, and A5: frequency response spectrum magnitude as calculated by the wireless sensors
Table 1. Modal parameters estimated by wireless monitoring system and SAP2000
After updating the SAP2000 model, the behavior of the Grove Street Bridge under static loading is revisited. A model of the truck loads identical to the ones employed during testing, are applied to the full width SAP2000 model. For the load condition leading to the recorded behavior of Figure 7, the link slab rotation and top surface strain are estimated by SAP2000 to be 5.4 x 10⁻⁴ rad and 35.5 µε, respectively. These response parameters, compared to the measured values of 6.33 x 10⁻⁴ rad and 30 µε, are within 15% of the SAP2000 predicted response.
7. CONCLUSIONS In this study, a re-configurable wireless monitoring system is installed upon the Grove Street Bridge to showcase its ability to collect static and dynamic response data. A unique aspect of the Grove Street Bridge is its jointless bridge deck which employs an ECC link slab at its center in lieu of a traditional expansion joint. The bridge is load tested on three occasions to assess the response of the ECC link slab during application of static loads delivered by two 6-axel trucks. Rotation at the ends of the link slab and strain in longitudinal steel reinforcement bars are accurately measured using wireless sensors. In particular, measurement of slab rotation is highly accurate while the performance of the strain gages varied between load tests with zero mean drifts present in the majority of the strain readings. After reconstruction of the Grove Street Bridge is completed, a dense array of accelerometers is installed along the bridge length. Dynamic response data recorded by the wireless monitoring system is used to estimate the modal frequencies and mode shapes of the bridge. These parameters are calculated by the network of wireless sensors using the computational resources coupled with each sensor. Modal parameters are sought so that a finite element model of the bridge modeled in SAP2000 can be updated. The MAC is the single measure used to update a SAP2000 model; the updated SAP2000 model is shown accurate in its prediction of the bridge response to the static loads applied to the full-width bridge. This study has illustrated the potential use of wireless monitoring systems as a rapid and low-cost means of load testing vast inventories of highway bridges. A key feature of the study includes in-network determination of modal parameters by the wireless monitoring system. An additional advancement proposed in this study is a tight integration of a rapid to
Mode 1 Mode 2
0 500 1000 1500 2000 2500 3000 3500 4000 45000
500
1000
0 500 1000 1500 2000 2500 3000 3500 4000 45000
500
1000
Mode 3 Mode 4
0 500 1000 1500 2000 2500 3000 3500 4000 45000
200
400
600
800
1000
0 500 1000 1500 2000 2500 3000 3500 4000 45000
200400
600800
1000
Figure 11. Mode shapes of the bridge (operational deflection shapes) after rehabilitation
deploy wireless monitoring system and finite element models commonly employed by bridge officials during the design and maintenance of their bridges. Future work will explore automation of updating analytical models as a core component of monitoring bridge structures for damage.
8. ACKNOWLEDGEMENT This research is partially funded by the Michigan Department of Transportation (MDOT) through Contract Number #03-0026. The authors would like to express their gratitude to Professor Victor C. Li, Mr. Michael Lepech, Ms. Mo Li, Mr. Ken Loh, Mr. Andrew Swartz, and Mr. Andy Zimmerman, University of Michigan, for assistance during field testing. The authors are thankful for the guidance and fruitful suggestions offered by Mr. Roger Till, MDOT. The technical expertise of Dr. Maria Szerszen and her students are greatly appreciated.
9. REFERENCES 1. A. Caner, Zia, P., "Behavior and Design of Link Slab for Jointless Bridge Decks", PCI Journal, 43, 68-80, 1998 2. TRB, Critical Issues in Transportation, The National Academies, Washington, D. C., 2005. 3. FHWA, Status of the Nation's Highways, Bridges, and Transit: Conditions & Performance, Federal Highway
Administration, Washington, D. C., 2003. 4. J. P. Lynch, Law, K. H., Kiremidjian, A. S., Carryer, E., Farrar, C. R., Sohn, H., Allen, D. W., Nadler, B. and Wait,
J. R., "Design and Performance Validation of a Wireless Sensing Unit for Structural Monitoring Applications", Structural Engineering and Mechanics, 17, 393-408, 2004.
5. J. P. Lynch, Wang, Y., Loh, K., Yi, J. K., Yun, C. B., "Wireless Structural Monitoring of the Geumdang Bridge Using Resolution Enhancing Signal Conditioning", Proceedings of the 24th International Modal Analysis Conference (IMAC XXIV), Vol. SEM, St. Louis, MO, 2006.
6. K.-C. Lu, Wang, Y., Lynch, J. P., Loh, C.-H., Chen, Y.-J., Lin, P.-Y., Lee, Z.-K., "Ambient Vibration Study of the Gi-Lu Cable-Stay Bridge: Application of Wireless Sensing Units", Proceedings of the SPIE - The International Society for Optical Engineering, San Diego, CA, 2006.
7. K. M. Wing, Kowalsky, M. J., , "Behavior, Analysis, and Design of an Instrumented Link Slab Bridge", Journal of Bridge Engineering, 10, 331-344, 2005.
8. V. C. Li, Lepech, M., Li, M., Field Demonstration of Durable Link Slabs for Jointless Bridge Decks Based on Strain-Hardening Cementitious Composites, Michigan Department of Transportation, Lansing, MI, 2005.
9. Y. Wang, Lynch, J. P. and Law, K. H., "Design of a Low-Power Wireless Structural Monitoring System for Collaborative Computational Algorithms", Proceedings of the SPIE - The International Society for Optical Engineering, Vol. 5768, 106-117, San Diego, CA, USA, 2005.
10. J. M. W. Brownjohn, Moyo, P., Omenzetter, P. and Lu, Y., "Assessment of Highway Bridge Upgrading by Dynamic Testing and Finite-Element Model Updating", Journal of Bridge Engineering, 8, 162-172, 2003.
11. B. Peeters and Ventura, C. E., "Comparative Study of Modal Analysis Techniques for Bridge Dynamic Characteristics", Mechanical Systems and Signal Processing, 17, 965-988, 2003.
12. C. R. Farrar and James, G. H., "System Identification from Ambient Vibration Measurements on a Bridge", Journal of Sound and Vibration, 205, 1-18, 1997.