Rapid transfer of 15 N from labeled beech leaf litter to functional soil organic matter fractions in a Rendzic Leptosol Carolin Bimüller a, * , Pascale S. Naumann a , Franz Buegger b , Michael Dannenmann c , Bernd Zeller d , Margit von Lützow a , Ingrid Kögel-Knabner a, e a Lehrstuhl für Bodenkunde, Department of Ecology and Ecosystem Management, Center of Life and Food Sciences, Weihenstephan, Technische Universität München, D-85350 Freising-Weihenstephan, Germany b Helmholtz Zentrum München, German Research Center for Environmental Health, Institute of Soil Ecology, D-85764 Neuherberg, Germany c Karlsruhe Institute of Technology, Institute of Meteorology and Climate Research, Atmospheric Environmental Research (IMK-IFU), D-82467 Garmisch-Partenkirchen, Germany d INRA Centre de Nancy, UR 1138, Biogéochimie des Ecosystèmes Forestiers, F-54280 Champenoux, France e Institute for Advanced Study, Technische Universität München, Lichtenbergstraße 2a, D-85748 Garching, Germany article info Article history: Received 25 May 2012 Received in revised form 9 November 2012 Accepted 17 November 2012 Available online 20 December 2012 Keywords: 15 N Physical fractionation Light fraction Organo-mineral fraction Clay Fagus sylvatica L. Nitrogen storage Field experiment Transfer rates Decomposition abstract Our main objective was to trace and to quantify the stabilization of nitrogen released from litter decomposition in different functional soil organic matter fractions. To identify the fate of nitrogen in a free-range experiment, 15 N-labeled beech litter was deposited on the bare soil surface of three 2m 2 m plots on a Rendzic Leptosol under beech (Fagus sylvatica L.) with mull humus form near Tuttlingen (Swabian Jura, Germany). The 15 N composition of bulk soil and soil fractions was monitored for three years by sampling the litter layer and the Ah horizon (0e5, 5e10 cm) after140, 507, and 876 d. A combined density and particle size fractionation procedure allowed the isolation of different functional soil organic matter fractions: free light fraction, occluded organic matter, and organo-mineral associa- tions. The first flush in the 15 N enrichment was observed in the bulk soil within 140 d, due to plant debris transferred to the free light fraction by probably bioturbation and soluble compounds being leached from the litter directly to the clay fractions. The observed rates within the first 140 d indicated a quick transfer of 15 N-enriched compounds from litter into the free light fraction, with a rate of 0.07 mg kg 1 d 1 , and to the clay fractions, with a rate of 0.31 mg kg 1 d 1 . In contrast, transfer to the occluded light fractions was delayed, with rates of 0.01 mg kg 1 d 1 (> 20 mm) and 0.001 mg kg 1 d 1 (< 20 mm), respectively. After 876 d, we recovered 9% of the added label in the 0e10 cm soil horizon, of which more than 4% was found in the organo-mineral fraction (0e5 cm), nearly 3% in the light fractions (0e5 cm), and another 2% unspecified in the bulk soil of 5e10 cm depth. We therefore conclude that the clay fractions act as the main sink for the recovered 15 N. The rapid incorporation and the high preservation of 15 N in the clay fractions revealed the dominant role of organo-mineral associations in the stabilization of nitrogen in the investigated soil. Ó 2012 Elsevier Ltd. All rights reserved. 1. Introduction Litter decomposition and mineralization of soil organic matter are two of the main sources of bioavailable nitrogen (N) in forest soils and thus play a key role in the nutrition of forest trees. 15 N labeling techniques are frequently used to study N transformation and partitioning processes in forest soils. 15 NH 4 þ or 15 NO 3 have been applied in most experiments using isotopes for studying N dynamics in forest soils, because the use of inorganic N allows a rapid and localized investigation of the N partitioning between soil, plants, and microbial biomass (Preston and Mead, 1994; Perakis and Hedin, 2001; Compton and Boone, 2002). The appli- cation of 15 N-labeled litter material facilitates the identification of N release and redistribution of the original litter in the soil and thus provides insight into N cycling processes under less disturbed conditions (Högberg, 1997). Such an experimental setup with slow but long-term release of excess 15 N allows researchers to perform free-range experiments under natural conditions. Hence, this method is well suited to investigate long-term N processes and allocation. However, this technique is used only rarely, because both the production of the labeled residues and the long-term experiments are time and resource intensive. * Corresponding author. Tel.: þ49 (0)8161 71 5338; fax: þ49 (0)8161 71 4466. E-mail address: [email protected](C. Bimüller). Contents lists available at SciVerse ScienceDirect Soil Biology & Biochemistry journal homepage: www.elsevier.com/locate/soilbio 0038-0717/$ e see front matter Ó 2012 Elsevier Ltd. All rights reserved. http://dx.doi.org/10.1016/j.soilbio.2012.11.021 Soil Biology & Biochemistry 58 (2013) 323e331
Rapid transfer of 15N from labeled beech leaf litter to functional soilorganic matter fractions in a Rendzic Leptosol
Carolin Bimüller a,*, Pascale S. Naumann a, Franz Buegger b, Michael Dannenmann c, Bernd Zeller d,Margit von Lützowa, Ingrid Kögel-Knabner a,e
a Lehrstuhl für Bodenkunde, Department of Ecology and Ecosystem Management, Center of Life and Food Sciences, Weihenstephan, Technische Universität München,D-85350 Freising-Weihenstephan, GermanybHelmholtz Zentrum München, German Research Center for Environmental Health, Institute of Soil Ecology, D-85764 Neuherberg, GermanycKarlsruhe Institute of Technology, Institute of Meteorology and Climate Research, Atmospheric Environmental Research (IMK-IFU), D-82467 Garmisch-Partenkirchen, Germanyd INRA Centre de Nancy, UR 1138, Biogéochimie des Ecosystèmes Forestiers, F-54280 Champenoux, Francee Institute for Advanced Study, Technische Universität München, Lichtenbergstraße 2a, D-85748 Garching, Germany
a r t i c l e i n f o
Article history:Received 25 May 2012Received in revised form9 November 2012Accepted 17 November 2012Available online 20 December 2012
0038-0717/$ e see front matter � 2012 Elsevier Ltd.http://dx.doi.org/10.1016/j.soilbio.2012.11.021
a b s t r a c t
Our main objective was to trace and to quantify the stabilization of nitrogen released from litterdecomposition in different functional soil organic matter fractions. To identify the fate of nitrogen ina free-range experiment, 15N-labeled beech litter was deposited on the bare soil surface of three2 m � 2 m plots on a Rendzic Leptosol under beech (Fagus sylvatica L.) with mull humus form nearTuttlingen (Swabian Jura, Germany). The 15N composition of bulk soil and soil fractions was monitoredfor three years by sampling the litter layer and the Ah horizon (0e5, 5e10 cm) after 140, 507, and 876 d.A combined density and particle size fractionation procedure allowed the isolation of different functionalsoil organic matter fractions: free light fraction, occluded organic matter, and organo-mineral associa-tions. The first flush in the 15N enrichment was observed in the bulk soil within 140 d, due to plant debristransferred to the free light fraction by probably bioturbation and soluble compounds being leached fromthe litter directly to the clay fractions. The observed rates within the first 140 d indicated a quick transferof 15N-enriched compounds from litter into the free light fraction, with a rate of 0.07 mg kg�1 d�1, and tothe clay fractions, with a rate of 0.31 mg kg�1 d�1. In contrast, transfer to the occluded light fractions wasdelayed, with rates of 0.01 mg kg�1 d�1 (> 20 mm) and 0.001 mg kg�1 d�1 (< 20 mm), respectively. After876 d, we recovered 9% of the added label in the 0e10 cm soil horizon, of which more than 4% was foundin the organo-mineral fraction (0e5 cm), nearly 3% in the light fractions (0e5 cm), and another 2%unspecified in the bulk soil of 5e10 cm depth. We therefore conclude that the clay fractions act as themain sink for the recovered 15N. The rapid incorporation and the high preservation of 15N in the clayfractions revealed the dominant role of organo-mineral associations in the stabilization of nitrogen in theinvestigated soil.
� 2012 Elsevier Ltd. All rights reserved.
1. Introduction
Litter decomposition and mineralization of soil organic matterare two of the main sources of bioavailable nitrogen (N) in forestsoils and thus play a key role in the nutrition of forest trees. 15Nlabeling techniques are frequently used to study N transformationand partitioning processes in forest soils. 15NH4
þ or 15NO3� have been
applied in most experiments using isotopes for studying Ndynamics in forest soils, because the use of inorganic N allows
fax: þ49 (0)8161 71 4466.. Bimüller).
All rights reserved.
a rapid and localized investigation of the N partitioning betweensoil, plants, and microbial biomass (Preston and Mead, 1994;Perakis and Hedin, 2001; Compton and Boone, 2002). The appli-cation of 15N-labeled litter material facilitates the identification of Nrelease and redistribution of the original litter in the soil and thusprovides insight into N cycling processes under less disturbedconditions (Högberg, 1997). Such an experimental setup with slowbut long-term release of excess 15N allows researchers to performfree-range experiments under natural conditions. Hence, thismethod is well suited to investigate long-term N processes andallocation. However, this technique is used only rarely, becauseboth the production of the labeled residues and the long-termexperiments are time and resource intensive.
C. Bimüller et al. / Soil Biology & Biochemistry 58 (2013) 323e331324
Most studies using labeled organic material investigated Nprocesses in agricultural systems (Haynes, 1997; Kölbl et al., 2006;Wessels Perelo et al., 2006), whereas a few studies traced the fate ofbeech leaf litter N from decomposition in broadleaf forest ecosys-tems to its distribution in the plantesoil system (e.g., D’Annunzioet al., 2008). Zeller et al. (2000, 2001) were the first to investigatethe decomposition of 15N-labeled beech litter in beech forests withdifferent soils and humus forms over three years. They showed thatN released from the labeled litter was proportional to mass loss andthat about 50% of the litter-derived N reached the topsoil (0e30 cm) after three years of litter decomposition. Furthermore,they observed a high variability for both N release and incorpora-tion into the soil among forest sites, depending strongly on the soiltype (Cambisol and Leptosol) and humus form (moder and mull-moder). Zeller and Dambrine (2011) compared the potentialmineralization of the total soil organic N with that of recent litter-released N at the same sites after 4e5 years. They identified coarseparticulate organic matter as the primary source of mineral N intopsoils of three beech forests. Aside from classic litterbag studiesobserving litter degradation (Olson, 1963), only Hatton et al. (2012)examined the transfer of forest leaf litter N in the mineral soil andits density fractions. They studied the incorporation of litter-derived N at 4, 8 and 12 years and showed that w40% of thelitter-derived N was present in soil organo-mineral associationsafter 4 years, suggesting a rapid incorporation at earlier stages oflitter decomposition. Whereas C and N release and enrichment insoil organic matter and microbial biomass by litter decompositionhave been already described (Bird and Torn, 2006; Fahey et al.,2011; Mambelli et al., 2011), the transfer of litter-derived N to soilorgano-mineral associations remains unexplored for early stages oflitter degradation.
To study the decomposition and distribution of 15N-labeledmustard litter in cropland soils, Kölbl et al. (2006) applieda combined density and particle size fractionation procedure. Thismethod allows the isolation of soil organic matter (SOM) fractionsthat are associated with particles of diverse size, structure, andfunctions defined by different specific stabilization mechanisms.These measurable SOM fractions represent functional SOM poolsthat have different roles in SOM turnover concerning rate andstability (von Lützow et al., 2007; Sollins et al., 2009). Physicalfractionation is based on the concept that the organization of soilparticles plays a key role in SOM dynamics, because bioavailabilityis a prerequisite for decomposition. Density fractionation is appliedto separate the light fraction (LF), which is not firmly associatedwith soil minerals, from the heavy fraction. The free light fraction(fLF) is mostly related to primary litter input, whereas in soilaggregates occluded light fraction (oLF) is mainly affected by theaggregate turnover of the particular soils (Six et al., 1999). Theheavy fraction contains organo-mineral associations in which SOMis more processed than in the LF, which contains less decomposedplant and animal residues (Christensen, 1992). The separation ofthe SOM into different functional fractions enables the study ofmajor pathways of N stabilization processes, such as chemicalrecalcitrance, spatial inaccessibility, and the mineral association ofSOM (von Lützow et al., 2006). Moreover, the combination of soilfractionation and labeling techniques in SOM studies (Mueller et al.,2009) enables a direct and rapid investigation of the decompositionand partitioning processes of SOM in the soil.
We used the application of 15N-labeled beech litter in a sub-montane European beech forest (Fagus sylvatica L.) together witha combined particle size and density fractionation procedure usingsodium polytungstate to investigate the incorporation and parti-tioning of litter-derived N in different functional SOM fractions ina clay-rich Rendzic Leptosol. This soil with mull humus form ischaracterized by high bioturbation through the activity of
earthworms (Green et al., 1993; Zanella et al., 2011). Our aimwas toidentify the extent of N stabilization in such soils and their func-tional SOM fractions including fLF, organic matter occluded byaggregation, and organo-mineral associations. Transfer rates for thesingle functional pools were estimated using a complete dataset ofthree consecutive years. The experimental setup was designed tobe adapted to the mull humus form and thus specifically allowedfree access for macro fauna.
2. Materials and methods
2.1 Site characteristics
This study was conducted at the Tuttlingen Research Station(8�450E, 47�590N) in the Swabian Jura, a low mountain range insouthwestern Germany. Dannenmann et al. (2008, 2009) previ-ously described the study site which receives low atmospheric Ndeposition (<10 kg N ha�1 year�1). The area’s cool-moist climate ischaracterized by a mean annual air temperature of 6.5 �C andprecipitation of 854 mm per year. The experimental plots of thepresent study were set up on an even steep slope (approx. 25�
inclination) exposed to the northeast, at an elevation of approxi-mately 800 m above sea level. European beech (F. sylvatica) is themain species, accounting for more than 90% of all the approxi-mately 90-year-old trees (Dannenmann et al., 2009).
According to the International Union of Soil Sciences WorkingGroup WRB (2007), the soil is classified as Rendzic Leptosol (Sce-letic) developed on straight bedded Jurassic limestone and marls.Soil profiles are thin, developed on weathered parent rock enclos-ing approximately 45% gravel and stones. The Ah horizon at thestudy site is characterized by organic carbon (OC) contents of64.1 � 1.9 g kg�1, N contents of 4.8 � 0.1 g kg�1, C/N ratios of13.3 � 0.2, and pH values of 5.7 � 0.2. The clay content of the soil ishigh (70.1 � 1.3%), whereas silt (26.8 � 1.7%) and sand (3.2 � 1.0%)contribute to soil texture to a minor degree. The mineralogy of thelarger grain sizes is dominated by quartz; the clay fraction is rela-tively enriched in phyllosilicates, esp. irregular mixed-layer illiteesmectite and kaolinite (Fig. 1). The bulk density of the Ah horizonis 0.8 g cm�3 resulting in an amount of 40 kg m�2 in 0e5 cm topsoildepth. The Ah horizon of the investigated Rendzic Leptosol locatedbelow the mull litter layer (FAO, 2006) is characterized by organo-mineral aggregates resulting from ingesting andmixing activities ofearthworms (Ponge and Ferdy, 1997; Zanella et al., 2011).
2.2 Experimental design
In April 2008, three 2 m � 2 m plots were selected froma backslope with different relative altitudes with distances of atleast 20 m. The litter layer was removed from each plot andreplaced by an equivalent amount of 15N-labeled beech litter(500 g litter m�2). We thereby applied 237.48 mg 15N to each plot.The labeled beech litter was evenly distributed on the plot surfaceand then fixed on top with a nylon net (1.5-cm mesh size) to avoidwind dispersal and slipping. The nylon net was fastened at theborder with small wooden pales. In contrast to litterbag studies,this experimental design gives macro fauna access to the litter andallows for incorporation of the litter material into the mineral soil,characteristic for sites with mull humus form.
The 15N-labeled beech litter was produced by spraying 15N-labeled urea on the foliage of a 10-year-old beech stand in a naturalregeneration area on calcareous soil (Calcisol) at Puvenelle nearPont-à-Mousson, France, in late summer of three subsequent years(Zeller et al., 1998). Senescent leaves were collected by hand fromthe labeled trees in November, dried at 30 �C, and stored until theywere used as leaf litter in this experiment. This method achieved an
5 10 15 20 25 30 35 40 45 50 55 60
2 CK
coarse sand
fine sand
medium sand
coarse silt
medium silt
fine silt
coarse clay
fine clay
P M
P Q
Q
Q
GG
G
K
K
Q
Q
C
CQ
CQ
Q QC
QC
C
Q
Chl Chl
P
P
Fs Fs
C
θ α
Fig. 1. XRD analysis of particle size classes. C ¼ calcite, Chl ¼ chlorite, Fs ¼ feldspar, G ¼ goethite, K ¼ kaolinite, M ¼ mica, P ¼ other phyllosilicates, undifferentiated (esp. mixed-layer illiteesmectite), Q ¼ quartz.
C. Bimüller et al. / Soil Biology & Biochemistry 58 (2013) 323e331 325
15N enrichment of 0.80520 15N atom% excess. The C/N ratio of thelabeled litter (34.6 � 0.4) was larger than that of the original beechlitter removed from the plots (31.8 � 1.3).
2.2.1 Litter samplingSamples of 15N-labeled beech litter were taken on the day of
distribution (0 d) and again in May 2008 (21 d), June 2008 (70 d),September 2008 (140 d), June 2009 (428 d), September 2009(507 d), and September 2010 (876 d). At each sampling, three littersamples were collected from an area of approximately 0.02 m2 ineach plot and the samples from each plot were mixed, resulting inthree litter samples per sampling date. Collected litter sampleswere air-dried and homogenized using an ultra-centrifugation mill(ZM 100, Retsch, Haan, Germany) prior to chemical analysis.
2.2.2 Soil samplingBefore 15N-labeled beech litter was distributed, reference
samples were obtained by using a root auger (80-mm diameter) tocollect three soil cores (0e10 cm) from spots with a distance of atleast 1 m per experimental plot. Further soil samples were taken atdays 21, 70, 140, 428, 507 and 876 of the experiment by using thesame method, resulting in a total of nine soil samples per samplingdate. Boreholes were refilled with quartz sand to minimize waterdisturbance. Each borehole was marked with sticks to preventa second sampling from the same borehole. For analyses, the core
was divided into two subsamples (0e5 cm and 5e10 cm). Eachsubsample was air dried and sieved to a particle size < 2 mm.
2.3 Physical fractionation design
To obtain data reflecting N stabilization in different SOM pools,we separated bulk soil samples into seven SOM soil fractions.Fractionation was performed on the samples harvested at theoutset of the experiment and in autumn of three consecutive years,namely in September 2008, 2009, and 2010 (i.e., after 140, 507, and876 d).
Bulk soil samples of 0e5 cm depth were subjected toa combined density and particle-size fractionation. Twenty gramsof air-dried soil material (< 2 mm) were saturated with 200 ml ofsodium polytungstate solution with a density of 1.7 g cm�3 andwere allowed to settle overnight. Preliminary tests with this soilshowed that this cut-off best separated plant residues frommineralsoil. The floating fLF was extracted by sucking via a water jet pump.The fLF was washed several times with deionized water to removethe sodium polytungstate. To disrupt soil aggregates and liberatethe occluded organic matter, the remaining residual was dispersedultrasonically (Sonopuls HD 2200, Bandelin, Berlin, Germany; VS70 T Sonotrode Ø 13 mm, at a power level of 70%) with a liquidcoverage of 1.5 cm for 20 min, resulting in an energy input of450 J ml�1. The energy input was tested before to avoid disruption
C. Bimüller et al. / Soil Biology & Biochemistry 58 (2013) 323e331326
of coarse LF and redistribution along with aggregate disruption.Subsequently, the samples were centrifuged (30min at: 2.9� 103 g)to separate the oLF from the denser organo-mineral pellet. Thesupernatant containing the oLF was passed through a sieve of 20-mm mesh size to obtain the oLF > 20 mm and oLF < 20 mm. TheoLF < 20 mm was pressure filtrated, and both oLFs were washedseveral times with deionized water to eliminate excessive salt. Toremove the salt from the remaining dense organo-mineral pellet,this fraction was centrifuged several times with deionized wateruntil the fine clay fraction appeared in the supernatant. The denseorgano-mineral pellet was then wet-sieved with a sieve of 20-mmmesh size to separate the sand and coarse silt fraction (> 20 mm).All material in the heavy fraction measuring > 20 mm was definedas the sand fraction. The organo-mineral soil fraction < 20 mmwasseparated into medium and fine silt (2e20 mm) and clay (< 2 mm)fractions by sedimentation. The size class 2e20 mmwas referred toas the silt fraction. The fine clay (< 0.2 mm) fractionwas obtained bycentrifuging the clay fraction several times for 18 min at 4.0 � 103 gand collecting the supernatant until it stayed clear, followed bypressure-filtration of the collected supernatant. The residual sedi-ments containing the coarse and medium clay (0.2e2 mm) werecentrifuged with deionized water until the electrical conductivityof the supernatant dropped below 10 mS cm�1. Each fraction wasfreeze-dried and weighed in order to determine the mass distri-bution based on the initial weight portion.
2.4 Chemical and physical analyses of bulk soil and soil fractions
For chemical analyses, bulk soil samples and soil fractions werehomogenized using a vibrating ball mill with zircon-grinding tools(Pulverisette 23, Fritsch, Idar-Oberstein, Germany). For the subsoilsamples (5e10 cm), the bulk soil was only analyzed for the last twosamplings. The subsoil was not fractionated because results fromprevious studies indicate that only small amounts of 15N reachedthat depth (Preston and Mead, 1995; Swanston and Myrold, 1997;Zeller et al., 2000; Zeller and Dambrine, 2011). Determination oftotal carbon (TC), N, and 15N was performed in duplicate with anisotope ratio mass spectrometer (Delta V, Thermo Electron Corpo-ration, Dreieich, Germany) coupled to an elemental analyzer (EuroEA, Eurovector, Milan, Italy) at the Helmholtz Zentrum München,German Research Center for Environmental Health, Institute of SoilEcology in Neuherberg. The 15N-values were corrected at intervalsusing a lab standard (Acetanilid) that was part of every sequence.The standard was used in different weights to determine theisotope linearity of the system. The lab standard was calibratedagainst different international 15N-standards from IAEA (e.g., IAEAN1, IAEA N2, USGS 40). The samples were free of carbonates so thatthe TC concentration equaled the OC concentration.
Analysis of bulk soil texture was conducted according to themethod described by Mueller and Kögel-Knabner (2009). Organicmatter was broken down using 30% H2O2 prior to texture analysisand X-ray diffraction (XRD). Clay mineralogy was assessed by XRDafter Moore and Reynolds (1989). XRD was performed on randompowder samples (Co-Ka; diffractometer PW1830, Philips, Alemlo,Netherlands) from all particle size fractions.
Soil pHwas determinedwith a pHmeasuring instrument (WTW197i, Weilheim, Germany) in 0.01 M CaCl2 at a soil-to-solution ratioof 1:2.5 using a glass electrode (Hamilton, Höchst, Germany).
2.5 Data presentation and statistical analysis
15Nvalues are presented in 15Natom%. Valuesof 15Natom%excesswere calculated by subtracting natural abundance 15N atom% of therespective fractions of unlabeled soil (sampling after 0 d) from theenrichments obtained from the labeled fractions. To estimate the
excess values in mg per kg soil, the mass distribution, N concentra-tions, and 15N concentrations were multiplied for each fraction.
Mean values and standard errors were calculated using Micro-soft Excel (ver. 14.0; Microsoft, Redmond, WA, USA). Furtherstatistical analyses were carried out with SPSS (ver. 19.0; IBM,Ehningen, Germany). Figures were created either by Sigmaplot 11.0(Systat Software GmbH, Erkrath, Germany) or Xact (ver. 8.05f, Sci-Lab, Hamburg, Germany). Data were analyzed for homogeneity ofvariances by applying the Levene test, and the analysis of normalitywas performed using the ShapiroeWilk test. Because a normaldistribution was not guaranteed for the whole dataset, we testedfor significant differences (p < 0.05) between the groups byapplying the KruskaleWallis and ManneWhitney tests. Becausethe KruskaleWallis tests showed no differences between the threeplots within bulk soil and within soil fractions, we considered allnine samples as replicates at every occasion.
3. Results
3.1 Distribution of mass, OC, and N in soil fractions
3.1.1 Light fractionsSignificant differences were found in mass concentrations, with
the fLF varying between 11.3 and 59.0 mg (g soil)�1 and theoLF < 20 mm ranging from 6.1 to 35.1 mg (g soil)�1, respectively(Table 1). The oLF> 20 mm revealed significant differences in the OCconcentrations,which ranged from399.6 to 449.8mg g�1, and in theN concentrations, which varied between 13.9 and 15.7 mg g�1. Thecontribution of the LFs to bulk soil OC exceeded 23%, whereas only11e23% of total bulk soil N was stored within these three fractions.Except for the samples collected after 140 d, OC and N concentra-tions were clearly higher in the oLF > 20 mm than in any otherfraction. With regard to the LFs, the results showed no obvioustrends over the entire period investigated.
3.1.2 Organo-mineral fractionsThe mass distribution of the organo-mineral fractions showed
no variation over time. The clay-sized fractions accounted fornearly 50% of the bulk soil mass (Table 1), followed by the silt andsand fractions. The mass contribution of the sand fraction waslarger in the fractionated soil (10%) compared to the measured soiltexture (3%), where the clayey grain sizes accounted for 70%. Incomparison to the samples from the fractionation method, thesamples from the texture analysis were treated with H2O2 todestroy the organic matter. This altered the mass percentages andincreased the amounts of grain sizes with comparatively littleorganic residues.
The lowest concentrations of N and OC were detected in thesand-sized fraction, whereas the coarse clay fraction showed thehighest concentrations. The contribution of N and OC from thefractions to the bulk soil showed that the clay-sized fractionsaccounted for 64e75% of N and for more than 41% of OC, respec-tively (Table 1). We observed the highest N contents in each frac-tion at the outset of the experiment. A narrowing C/N ratio withdecreasing particle size from the sand-sized fraction to the fine clayfraction was calculated (Table 1). We did not observe a trend in theC/N ratios of the individual fractions over the period of the exper-iment. This relationship suggests the stability of each fraction,especially the organo-mineral fractions.
Because the recovery rate of N summed over all seven fractions(Table 1) after the soil fractionation procedure amounted to 90% ofthe untreated bulk soil, we assume that a small amount of soluble Nwas extracted by the sodium polytungstate solution and subse-quently discarded.
Table 1Mass distribution, organic carbon (OC), and nitrogen (N) concentrations in soil organic matter (SOM) fractions per fraction and bulk soil and the contribution of N and OC ofa specific fraction to the bulk soil depending on sampling date. Data aremean values with standard errors for nine replicates. Significant differences between different harvestsof a single SOM fraction are indicated by lowercase letters (p < 0.05).
fLF 0 15.6 � 3.3 bc 10.9 � 0.5 b 0.2 c 3.4 c 352.2 � 16.1 b 5.3 c 8.5 c 32.2 a140 59.0 � 8.2 a 14.0 � 0.6 a 0.9 a 16.9 a 346.1 � 18.7 b 21.3 a 31.0 a 24.7 b507 25.6 � 4.1 b 13.3 � 0.7 a 0.3 b 7.8 b 372.8 � 13.6 ab 9.6 b 17.1 b 28.1 a876 11.3 � 1.4 c 13.3 � 0.3 a 0.2 c 3.4 c 383.1 � 3.4 a 4.3 c 8.5 c 28.8 a
oLF > 20 0 11.3 � 2.3 ab 13.9 � 0.4 b 0.2 ab 3.1 ab 449.8 � 7.8 a 5.1 ab 8.1 b 32.4 a140 7.3 � 1.3 b 14.4 � 0.5 b 0.1 b 2.2 b 439.2 � 10.3 a 3.3 b 4.9 b 30.6 a507 10.7 � 1.0 a 14.9 � 0.3 b 0.2 a 3.6 a 399.6 � 2.8 c 4.3 a 7.8 a 26.8 b876 12.0 � 1.4 a 15.7 � 0.3 a 0.2 a 4.3 a 416.5 � 3.7 b 5.0 a 9.9 a 26.5 b
oLF < 20 0 12.0 � 2.1 bc 13.4 � 0.6 ab 0.2 bc 3.3 b 271.0 � 11.1 a 3.3 bc 5.8 b 20.2 ab140 6.1 � 1.5 c 15.3 � 0.8 a 0.1 c 2.4 b 278.4 � 12.9 a 1.7 c 3.9 b 18.2 b507 35.1 � 8.9 a 12.3 � 0.4 b 0.4 ab 10.4 a 267.1 � 12.2 a 9.2 ab 19.7 a 21.7 a876 21.7 � 3.5 ab 13.1 � 0.5 b 0.3 a 6.5 a 278.5 � 7.7 a 5.9 a 12.8 a 21.2 a
sand 0 107.4 � 0.0 b 0.5 � 0.0 a 0.1 a 1.0 a 8.3 � 0.0 a 0.9 a 1.5 a 17.5 b140 107.1 � 5.5 ba 0.5 � 0.1 ab 0.1 ab 1.3 ab 10.2 � 1.9 a 1.1 ab 2.0 a 18.7 a507 108.7 � 2.0 a 0.5 � 0.1 ab 0.1 a 1.3 ab 8.6 � 1.4 ab 0.9 ab 1.7 a 16.8 b876 106.3 � 2.5 ab 0.4 � 0.0 b 0.0 b 0.9 b 6.3 � 0.5 b 0.7 b 1.3 a 16.8 b
silt 0 253.0 � 0.3 a 3.9 � 0.2 a 0.9 a 18.5 a 63.7 � 1.4 a 15.6 a 25.9 a 16.5 ab140 260.0 � 6.3 a 2.5 � 0.2 b 0.7 b 13.6 b 43.9 � 3.3 b 11.4 b 18.3 b 17.5 a507 250.1 � 2.4 a 1.7 � 0.1 c 0.4 c 9.9 c 26.9 � 3.1 c 6.8 c 12.5 c 15.6 b876 256.0 � 1.8 a 1.9 � 0.1 c 0.5 c 10.6 bc 31.4 � 3.2 c 8.0 c 15.7 bc 16.9 ab
coarse clay 0 225.0 � 0.0 a 9.3 � 0.2 a 2.1 a 42.3 a 91.9 � 0.7 a 20.7 a 34.4 ab 9.9 a140 221.3 � 5.5 a 8.3 � 0.3 b 1.8 b 37.9 b 79.9 � 5.4 b 17.6 b 28.0 c 9.7 a507 229.7 � 6.4 a 7.5 � 0.2 c 1.7 b 39.1 b 71.9 � 2.9 b 16.5 b 30.4 bc 9.7 a876 223.9 � 5.7 a 8.0 � 0.2 bc 1.8 b 40.8 ab 77.6 � 3.1 b 17.4 b 34.5 a 9.7 a
fine clay 0 242.7 � 0.0 ab 5.8 � 0.1 a 1.4 a 28.4 ab 40.2 � 0.8 a 9.7 a 16.2 ab 6.9 a140 238.6 � 6.1 bc 5.3 � 0.1 b 1.3 bc 26.2 b 34.6 � 1.4 c 8.3 b 13.3 c 6.5 b507 230.7 � 9.2 c 5.4 � 0.1 ab 1.2 b 28.7 b 33.1 � 1.0 cb 7.6 b 14.2 bc 6.1 c876 258.8 � 5.6 a 5.7 � 0.1 ab 1.5 ac 33.7 a 35.4 � 1.1 b 9.1 a 18.2 a 6.2 ac
C. Bimüller et al. / Soil Biology & Biochemistry 58 (2013) 323e331 327
3.2 15N in litter, bulk soil, and soil fractions
The 15N enrichment of the labeled beech litter declined quicklyafter litter application, especially during the first vegetation period,and was much slower thereafter (Fig. 2). After 876 d, 15N in beech
time [d]
0 200 400 600 800 1000
15 N
[ato
m%
] exce
ss
0.0000.0010.0020.0030.0040.005
0.200
0.400
0.600
0.800litterbulk soil
Fig. 2. 15N excess of labeled beech litter and bulk soil. Box plots represent threereplicates of each litter sample and nine replicates of bulk soil (0e5 cm depth)samples.
litter had only 16% of the initial 15N atom% excess enrichment. Thisdecrease indicated a release of the initial litter N besides dilutingeffects by natural, unlabeled litterfall.
A significant increase in bulk soil 15N atom% excess was detected140 d after litter application. The 15N natural abundance of the bulksoil (0e5 cm) was 0.36662 atom%. The 15N atom% excess valuesincreased consistently to 0.00184 atom% after 876 d, but thesamples showed a large variability in 15N atom% (Fig. 2). Bulk soilsamples from a depth of 5e10 cm showed a slight enrichment of0.00092 atom% excess after 507 d and 0.00068 atom% excess after876 d (data not shown).
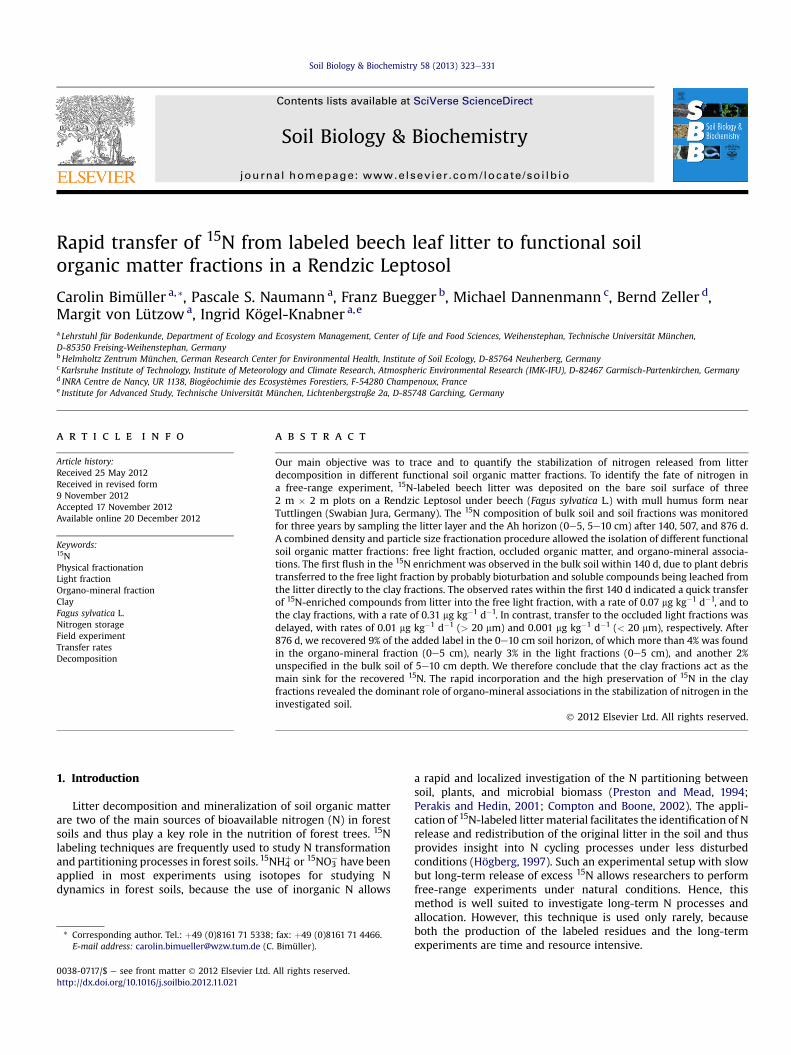
The fLF showed the highest 15N enrichment of the soil fractionsat each sampling date, except after 140 d (Fig. 3). From that dayonward, it was significantly different from the natural abundance.Although the increase of the 15N atom% excess of oLF > 20 mmwasdelayed, its 15N signature was also significantly altered after 140 d.In comparison to the LFs, the development of the 15N signature inatom% in the organo-mineral fractions showed a much smallerincrease. All organo-mineral fractions had increased significantlyafter 140 d, but they changed little thereafter. Both clay fractionsbehaved similarly concerning the development in 15N enrichment(Figs. 3e5); only the absolute values of total OC and N differed(Table 1).
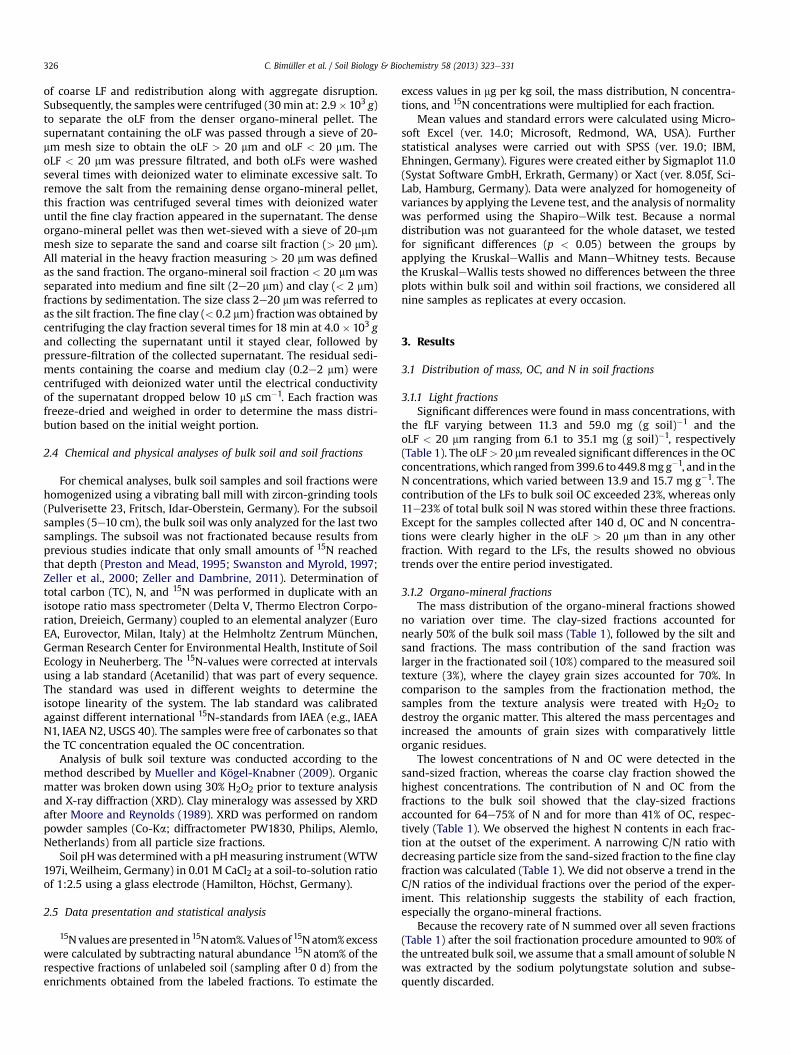
9.4 mg 15N (kg soil)�1 were found in the fLF 140 d after litterapplication (Fig. 4). This value more than doubled by the followingautumn (507 d) to 23.5 mg 15N (kg soil)�1 and reached 27.0 mg 15N
Fig. 3. 15N excess in atom% in soil organic matter (SOM) fractions. Data are the mean ofnine replicates, with error bars representing standard errors. Significant differences in15N excess between different harvests of a single SOM fraction are indicated bylowercase letters (p < 0.05). The first letter represents the first harvest at 0 d (i.e.,natural abundance).
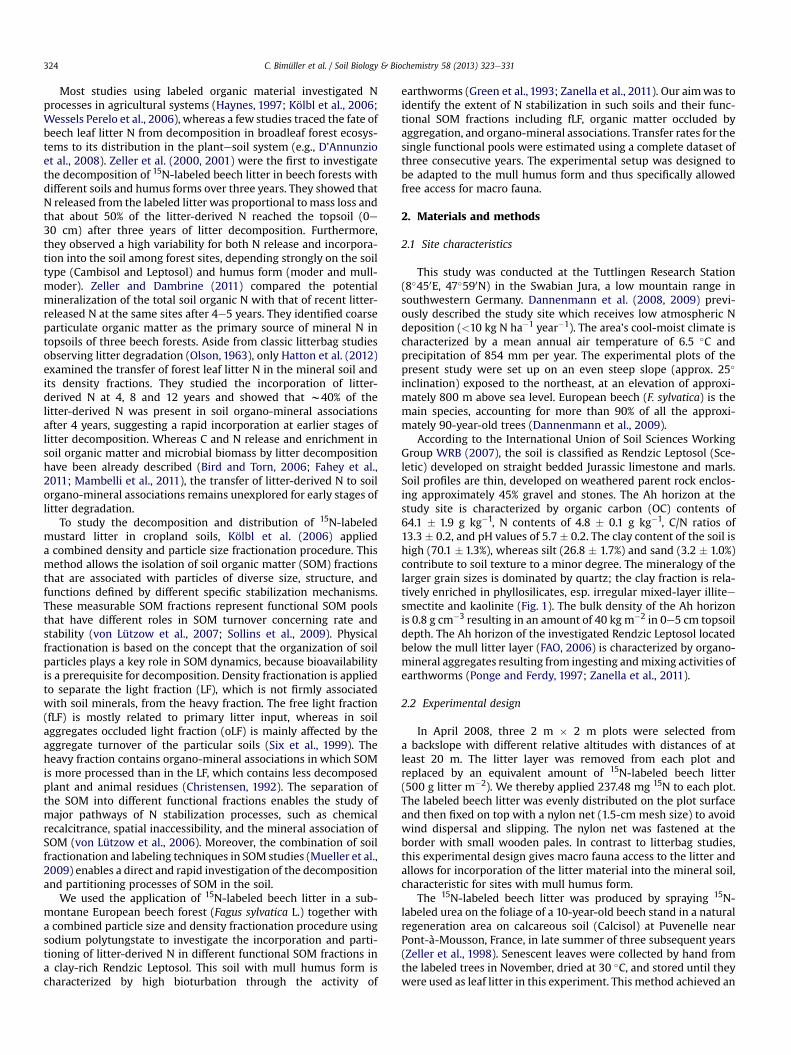
Fig. 5. Rates of net 15N excess accumulation in mg (kg soil)�1 d�1 in bulk soil and soilorganic matter (SOM) fractions calculated as daily averages from intervals between thesampling dates (n ¼ 9). Error bars indicate standard errors. Significant differencesbetween different harvests of a single SOM fraction are indicated by lowercase letters(p < 0.05).
C. Bimüller et al. / Soil Biology & Biochemistry 58 (2013) 323e331328
(kg soil)�1 after 876 d. The 15N excess in the oLF > 20 mm increasedfrom 0.8 mg 15N (kg soil)�1 after 140 d to 10.8 mg 15N (kg soil)�1 after876 d. The oLF < 20 mm fraction was at first 15N-depleted, but itshowed an excess of 3.4 mg 15N (kg soil)�1 after 876 d. Litter-derived15N increased significantly in all organo-mineral fractions withinthe first 140 d and did not follow any trend thereafter. The contri-bution of mineral-associated 15N to the bulk soil was higher thanthat of the LFs due to the high N concentration and the mass ofthese fractions. Their amount after 140 d followed the same trendas their enrichments in atom%. After 876 d, 54.6 mg 15N (kg soil)�1
was found in the clay fractions (Table 2).We calculated mean transfer rates from the litter to the mineral
soil by dividing the excess in mg per kg soil for every fraction by thenumber of days between the sampling dates assuming constantrates. The mean rates of 15N transfer from litter to the soil fractionsranged from losses of < 0.01 mg (kg soil)�1 d�1 (coarse clay) toyields of 0.16 mg (kg soil)�1 d�1 (coarse clay) over the course of theexperiment (Fig. 5). The rates of 15N input to each fraction showeda distinct variation over time: Whereas the organo-mineral frac-tions revealed a significant decline after the first 140 d, the oLF ratesrose only in the period between 507 and 876 d.
Fig. 4. 15N excess in mg (kg soil)�1 in bulk soil and soil organic matter (SOM) fractions(n ¼ 9). Error bars indicate standard errors. Significant differences between differentharvests of a single SOM fraction are indicated by lowercase letters (p < 0.05). The firstletter represents the first harvest at 0 d.
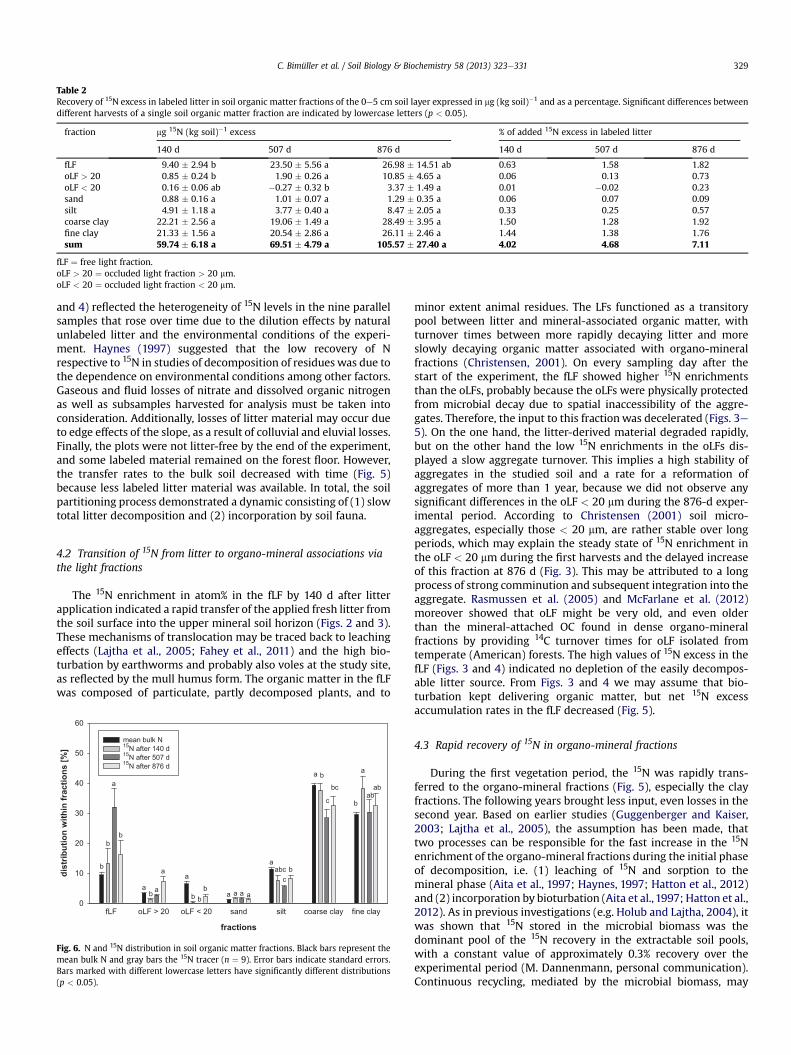
We studied the concept of N dynamics by tracking our 15N labelas a specific cohort through seven SOM fractions. Herby, the 15Ntracer offered a snapshot of the status of a single cohort of litter-derived N. Thus, differences in 15N tracer and total N distributionsamong the fractions should showwhere the litter-derived N cohortwas favorably incorporated or retained over time. The distributionof the 15N showed high values in the fLF compared to total N, whichmeans that the litter-derived N was preferentially found therecompared to all fractions (Fig. 6). We observed two further trendsover the course of the experiment: (1) 140 days after litter appli-cation a higher percentage of 15N compared to bulk soil N wasfound in the fine clay fraction. This high enrichment of 15N in thefine clay fraction declined subsequently and (2) the recovery of 15Nin the oLFs was delayed.
By summing up the seven fractions in the upper 0e5 cm of thesoil (Table 2), the recovery of litter-derived 15N tracer revealed 4.0%after 140 d, nearly 4.7% after 507 d and 7.1% after 876 d. Regardingthe absolute concentrations, more than 60% of the total 15N labelrecovered was found in the organo-mineral fractions at everysampling date. In the bulk soil of the subsoil horizon (5e10 cmdepth), we recovered another 2% of litter-derived 15N tracer after876 d.
4. Discussion
4.1 15N in bulk soil: recovery from litter application
The litter-derived N of our study accumulated mainly in the topmineral soil, progressively increasing the topsoil’s 15N signature(Fig. 2). Litter-derived N is principally found in the upper centi-meters of the Ah horizon of different forest ecosystems over thefirst decade after litterfall (Zeller et al., 2000, 2001; Zeller andDambrine, 2011; Hatton et al., 2012). After 876 d, we recovered9% of the added label in the 0e10 cm soil horizon. Other free rangestudies showed similar results reporting the distribution of 15N-labeled beech leaf litter within different compartments of theecosystem over time (Hatton et al., 2012). Mueller et al. (2009)showed a decreasing 15N enrichment trend with increasing soildepth due to less fresh SOM input in deeper layers.
The comparably slight 15N enrichment of the mineral soil in ourexperiment can be ascribed to the small enrichment of the labeledlitter. The incorporation of residues into the soil via bioturbationand without any artificial mixing showed a high degree of vari-ability (Fig. 2). The increase in the standard errors with time (Figs. 3
Table 2Recovery of 15N excess in labeled litter in soil organic matter fractions of the 0e5 cm soil layer expressed in mg (kg soil)�1 and as a percentage. Significant differences betweendifferent harvests of a single soil organic matter fraction are indicated by lowercase letters (p < 0.05).
fraction mg 15N (kg soil)�1 excess % of added 15N excess in labeled litter
140 d 507 d 876 d 140 d 507 d 876 d
fLF 9.40 � 2.94 b 23.50 � 5.56 a 26.98 � 14.51 ab 0.63 1.58 1.82oLF > 20 0.85 � 0.24 b 1.90 � 0.26 a 10.85 � 4.65 a 0.06 0.13 0.73oLF < 20 0.16 � 0.06 ab �0.27 � 0.32 b 3.37 � 1.49 a 0.01 �0.02 0.23sand 0.88 � 0.16 a 1.01 � 0.07 a 1.29 � 0.35 a 0.06 0.07 0.09silt 4.91 � 1.18 a 3.77 � 0.40 a 8.47 � 2.05 a 0.33 0.25 0.57coarse clay 22.21 � 2.56 a 19.06 � 1.49 a 28.49 � 3.95 a 1.50 1.28 1.92fine clay 21.33 � 1.56 a 20.54 � 2.86 a 26.11 � 2.46 a 1.44 1.38 1.76sum 59.74 � 6.18 a 69.51 � 4.79 a 105.57 � 27.40 a 4.02 4.68 7.11
C. Bimüller et al. / Soil Biology & Biochemistry 58 (2013) 323e331 329
and 4) reflected the heterogeneity of 15N levels in the nine parallelsamples that rose over time due to the dilution effects by naturalunlabeled litter and the environmental conditions of the experi-ment. Haynes (1997) suggested that the low recovery of Nrespective to 15N in studies of decomposition of residues was due tothe dependence on environmental conditions among other factors.Gaseous and fluid losses of nitrate and dissolved organic nitrogenas well as subsamples harvested for analysis must be taken intoconsideration. Additionally, losses of litter material may occur dueto edge effects of the slope, as a result of colluvial and eluvial losses.Finally, the plots were not litter-free by the end of the experiment,and some labeled material remained on the forest floor. However,the transfer rates to the bulk soil decreased with time (Fig. 5)because less labeled litter material was available. In total, the soilpartitioning process demonstrated a dynamic consisting of (1) slowtotal litter decomposition and (2) incorporation by soil fauna.
4.2 Transition of 15N from litter to organo-mineral associations viathe light fractions
The 15N enrichment in atom% in the fLF by 140 d after litterapplication indicated a rapid transfer of the applied fresh litter fromthe soil surface into the upper mineral soil horizon (Figs. 2 and 3).These mechanisms of translocation may be traced back to leachingeffects (Lajtha et al., 2005; Fahey et al., 2011) and the high bio-turbation by earthworms and probably also voles at the study site,as reflected by the mull humus form. The organic matter in the fLFwas composed of particulate, partly decomposed plants, and to
mean bulk N 15N after 140 d 15N after 507 d 15N after 876 d
b
b
a
b
ab a
aa
b bb
a a a a
aabc
cb
a b
c
bc
b
a
abab
Fig. 6. N and 15N distribution in soil organic matter fractions. Black bars represent themean bulk N and gray bars the 15N tracer (n ¼ 9). Error bars indicate standard errors.Bars marked with different lowercase letters have significantly different distributions(p < 0.05).
minor extent animal residues. The LFs functioned as a transitorypool between litter and mineral-associated organic matter, withturnover times between more rapidly decaying litter and moreslowly decaying organic matter associated with organo-mineralfractions (Christensen, 2001). On every sampling day after thestart of the experiment, the fLF showed higher 15N enrichmentsthan the oLFs, probably because the oLFs were physically protectedfrom microbial decay due to spatial inaccessibility of the aggre-gates. Therefore, the input to this fractionwas decelerated (Figs. 3e5). On the one hand, the litter-derived material degraded rapidly,but on the other hand the low 15N enrichments in the oLFs dis-played a slow aggregate turnover. This implies a high stability ofaggregates in the studied soil and a rate for a reformation ofaggregates of more than 1 year, because we did not observe anysignificant differences in the oLF < 20 mm during the 876-d exper-imental period. According to Christensen (2001) soil micro-aggregates, especially those < 20 mm, are rather stable over longperiods, which may explain the steady state of 15N enrichment inthe oLF < 20 mm during the first harvests and the delayed increaseof this fraction at 876 d (Fig. 3). This may be attributed to a longprocess of strong comminution and subsequent integration into theaggregate. Rasmussen et al. (2005) and McFarlane et al. (2012)moreover showed that oLF might be very old, and even olderthan the mineral-attached OC found in dense organo-mineralfractions by providing 14C turnover times for oLF isolated fromtemperate (American) forests. The high values of 15N excess in thefLF (Figs. 3 and 4) indicated no depletion of the easily decompos-able litter source. From Figs. 3 and 4 we may assume that bio-turbation kept delivering organic matter, but net 15N excessaccumulation rates in the fLF decreased (Fig. 5).
4.3 Rapid recovery of 15N in organo-mineral fractions
During the first vegetation period, the 15N was rapidly trans-ferred to the organo-mineral fractions (Fig. 5), especially the clayfractions. The following years brought less input, even losses in thesecond year. Based on earlier studies (Guggenberger and Kaiser,2003; Lajtha et al., 2005), the assumption has been made, thattwo processes can be responsible for the fast increase in the 15Nenrichment of the organo-mineral fractions during the initial phaseof decomposition, i.e. (1) leaching of 15N and sorption to themineral phase (Aita et al., 1997; Haynes, 1997; Hatton et al., 2012)and (2) incorporation by bioturbation (Aita et al., 1997; Hatton et al.,2012). As in previous investigations (e.g. Holub and Lajtha, 2004), itwas shown that 15N stored in the microbial biomass was thedominant pool of the 15N recovery in the extractable soil pools,with a constant value of approximately 0.3% recovery over theexperimental period (M. Dannenmann, personal communication).Continuous recycling, mediated by the microbial biomass, may
C. Bimüller et al. / Soil Biology & Biochemistry 58 (2013) 323e331330
explain the steady 15N recovery in the extractable pools (Holub andLajtha, 2004), because no decrease with time due to unlabeledsources by dilution was detected. Several studies support theassumption that soil microbial biomass and its residues are mainlyassociated with the clay fractions (Jocteur Monrozier et al., 1991;Kandeler et al., 2000). In addition, the LFs increasing in 15N excessenrichment throughout the whole period were able to provide 15Nin the form of plant debris, which was further transferred fromplant fragments to organo-mineral associationswith some time lag.These more decomposed products may contribute to the 15Nenrichment of the clay fractions during a second stage, and aretherefore more important in the long-term view (Christensen,1992). At 876 d after the start of the experiment, we stillobserved an incorporation of labeled material. The fine clay of ourstudy was not saturated with N, as this fraction could retain pro-portionally even more of the 15N tracer than total N (Fig. 6).
In similar leaf litter experiments, Hatton et al. (2012) showedthat the formation of organo-mineral associations is a centralmechanism for decadal- to longer-term preservation of litter-derived N in forest soils. They observed increases in the litter-derived N of heavy fractions at 4 years and even at 12 years afterleaf litter application. Thus, we assume that the organo-mineralfractions were also stable in our experiment over three years andthat their enrichment may further rise with time. Their sorptioncharacter and the inaccessibility may protect the litter-derived Nfrommicrobial activity, which consequently leads to a stabilizationprocess (Kögel-Knabner et al., 2008; Hatton et al., 2012). Ourdetailed particle size fractionation allowed us to observe the uniqueimportance of the clay fractions in terms of N partitioning, becausetheir 15N enrichment hardly changed after the first rapid pulse(Figs. 3e5). With regard to the organo-mineral fractions, this rapidflux may be generally important for the attachment of 15N toorgano-mineral associations over amedium time scale, because 15Nenrichment concentrations in atom% excess and mg per kg soilstayed constant and rates slowed after that first pulse (Figs. 3e5).Therefore, the clay fractions may act as a sink, with 15N remainingin the system, because their pool sizes did not change significantlyafter 140 d. This conclusion was only valid for the recovered 15N,while the fate for the remaining 90% stayed uncertain.
Although the 15N atom% excess of sand and silt increasedsignificantly after 140 d, these fractions played quantitativelyminorroles in the turnover of the labeled litter material (Fig. 4) due tovery low mass and N concentrations (Table 1). The rise in the15N atom% enrichment in the sand fraction can be ascribed toparticles of particulate organic matter. Considering this, the frac-tionation method reached its limit in separating light material fromthe heavy fractions.
5. Conclusions
Our results revealed a specific response of the different SOMfractions in a highly aggregated clay-rich Rendzic Leptosol witha mull humus form.
During the experiment, 15N transfer rates from litter sloweddown in the fLF but even after three years one fourth of therecovered 15N in themineral soil was still present in the form of freeplant debris incorporated by bioturbation. Plant debris occluded inaggregates occurred in substantial amounts at the final stage of theexperiment only, demonstrating a delayed relocation of the 15Ntracer in oLFs due to a slow aggregate turnover. It may therefore actas a temporary storage of 15N.
Incorporation of litter-derived 15N in the mineral soil occurredmainly in the coarse and fine clay fractions, with an unexpectedlyrapid transfer of 15N completedwithin 140 d. 15N in organo-mineralassociations accounted for more than 60% of the total 15N
recovered, presenting a rapid stabilization of the recovered 15Nderived from leaf litter in the long-term pool. This result underlinesthe dominant role of organo-mineral associations for the stabili-zation of nitrogen in the investigated soil.
Acknowledgments
We thank Marlene Ausfelder and Sigrid Hiesch for technicalassistance and Werner Häusler for XRD analysis. We are grateful tothe Deutsche Forschungsgemeinschaft (DFG) for their generousfunding of the project KO 1035/41-1. We also express our thanks toAngelika Kölbl for supporting discussions and all the anonymousreviewers for helpful comments and suggestions improving themanuscript significantly.
References
Aita, C., Recous, S., Angers, D.A., 1997. Short-term kinetics of residual wheat straw Cand N under field conditions: characterization by 13C15N tracing and soilparticle size fractionation. European Journal of Soil Science 48, 283e294.
Bird, J., Torn, M., 2006. Fine roots vs. needles: a comparison of 13C and 15N dynamicsin a Ponderosa pine forest soil. Biogeochemistry 79, 361e382.
Christensen, B.T., 1992. Physical fractionation of soil and organic matter in primaryparticle size and density separates. In: Stewart, B.A. (Ed.), Advances in SoilScience. Springer, New York, pp. 1e90.
Christensen, B.T., 2001. Physical fractionation of soil and structural and functionalcomplexity in organic matter turnover. European Journal of Soil Science 52,345e353.
Compton, J.E., Boone, R.D., 2002. Soil nitrogen transformations and the role of lightfraction organic matter in forest soils. Soil Biology and Biochemistry 34, 933e943.
Dannenmann, M., Butterbach-Bahl, K., Gasche, R., Willibald, G., Papen, H., 2008. Dini-trogenemissions and theN2:N2O emission ratio of a Rendzic Leptosol as influencedby pH and forest thinning. Soil Biology and Biochemistry 40, 2317e2323.
Dannenmann, M., Simon, J., Gasche, R., Holst, J., Naumann, P.S., Kögel-Knabner, I.,Knicker, H., Mayer, H., Schloter, M., Pena, R., Polle, A., Rennenberg, H., Papen, H.,2009. Tree girdling provides insight on the role of labile carbon in nitrogenpartitioning between soil microorganisms and adult European beech. SoilBiology and Biochemistry 41, 1622e1631.
D’Annunzio, R., Zeller, B., Nicolas, M., Dhôte, J.-F., Saint-André, L., 2008. Decompo-sition of European beech (Fagus sylvatica) litter: combining quality theory and15N labelling experiments. Soil Biology and Biochemistry 40, 322e333.
Fahey, T.J., Yavitt, J.B., Sherman, R.E., Groffman, P.M., Fisk, M.C., Maerz, J.C., 2011.Transport of carbon and nitrogen between litter and soil organic matter ina northern hardwood forest. Ecosystems 14, 326e340.
FAO, 2006. Guidelines for Soil Description. FAO, Rome.Green, R.N., Trowbridge, R.L., Klinka, K., 1993. Towards a taxonomic classification of
humus forms. Forest Science 39, 1e48.Guggenberger, G., Kaiser, K., 2003. Dissolved organic matter in soil: challenging the
paradigm of sorptive preservation. Geoderma 113, 293e310.Hatton, P.-J., Kleber, M., Zeller, B., Moni, C., Plante, A.F., Townsend, K., Gelhaye, L.,
Lajtha, K., Derrien, D., 2012. Transfer of litter-derived N to soil mineral-organicassociations: evidence from decadal 15N tracer experiments. OrganicGeochemistry 42, 1489e1501.
Haynes, R.J., 1997. Fate and recovery of 15N derived from grass/clover residues whenincorporated into a soil and cropped with spring or winter wheat for twosucceeding seasons. Biology and Fertility of Soils 25, 130e135.
Högberg, P., 1997. 15N natural abundance in soileplant systems. New Phytologist137, 179e203.
Holub, S.M., Lajtha, K., 2004. The fate and retention of organic and inorganic 15N-nitrogen in an old-growth forest soil in western Oregon. Ecosystems 7, 368e380.
International Union of Soil Sciences Working Group WRB, 2007. World ReferenceBase for Soil Resources 2006, First Update 2007. FAO, Rome.
Jocteur Monrozier, L., Ladd, J.N., Fitzpatrick, R.W., Foster, R.C., Rapauch, M., 1991.Components and microbial biomass content of size fractions in soils of con-trasting aggregation. Geoderma 50, 37e62.
Kandeler, E., Tscherko, D., Bruce, K.D., Stemmer, M., Hobbs, P.J., Bardgett, R.D.,Amelung, W., 2000. Structure and function of the soil microbial community inmicrohabitats of a heavy metal polluted soil. Biology and Fertility of Soils 32,390e400.
Kögel-Knabner, I., Guggenberger, G., Kleber, M., Kandeler, E., Kalbitz, K., Scheu, S.,Eusterhues, K., Leinweber, P., 2008. Organo-mineral associations in temperatesoils: integrating biology, mineralogy, and organic matter chemistry. Journal ofPlant Nutrition and Soil Science 171, 61e82.
Kölbl, A., von Lützow, M., Kögel-Knabner, I., 2006. Decomposition and distributionof 15N labelled mustard litter (Sinapis alba) in physical soil fractions of a crop-land with high- and low-yield field areas. Soil Biology and Biochemistry 38,3292e3302.
C. Bimüller et al. / Soil Biology & Biochemistry 58 (2013) 323e331 331
Lajtha, K., Crow, S.E., Yano, Y., Kaushal, S.S., Sulzman, E., Sollins, P., Spears, J.D.H.,2005. Detrital controls on soil solution N and dissolved organic matter in soils:a field experiment. Biogeochemistry 76, 261e281.
Mambelli, S., Bird, J.A., Gleixner, G., Dawson, T.E., Torn, M.S., 2011. Relative contri-bution of foliar and fine root pine litter to the molecular composition of soilorganic matter after in situ degradation. Organic Geochemistry 42, 1099e1108.
McFarlane, K., Torn, M., Hanson, P., Porras, R., Swanston, C., Callaham, M.,Guilderson, T., 2012. Comparison of soil organic matter dynamics at fivetemperate deciduous forests with physical fractionation and radiocarbonmeasurements. Biogeochemistry, 1e20.
Moore, D.M., Reynolds, R.C., 1989. X-ray Diffraction and the Identification andAnalysis of Clay Minerals. Oxford University Press, London.
Mueller, C., Kögel-Knabner, I., 2009. Soil organic carbon stocks, distribution, andcomposition affected by historic land use changes on adjacent sites. Biology andFertility of Soils 45, 347e359.
Mueller, C.W., Brüggemann, N., Pritsch, K., Stoelken, G., Gayler, S., Winkler, J.B.,Kögel-Knabner, I., 2009. Initial differentiation of vertical soil organic matterdistribution and composition under juvenile beech (Fagus sylvatica L.) trees.Plant and Soil 323, 111e123.
Olson, J.S., 1963. Energy-storage and balance of producers and decomposers inecological-systems. Ecology 44, 322e331.
Perakis, S.S., Hedin, L.O., 2001. Fluxes and fates of nitrogen in soil of an unpollutedold-growth temperate forest, southern Chile. Ecology 82, 2245e2260.
Ponge, J.-F., Ferdy, J.-B., 1997. Growth of Fagus sylvatica saplings in an old-growthforest as affected by soil and light conditions. Journal of Vegetation Science 8,789e796.
Preston, C., Mead, D., 1994. A bioassay of the availability of residual 15N fertilizereight years after application to a forest soil in interior British Columbia. Plantand Soil 160, 281e285.
Preston, C.M., Mead, D.J., 1995. Long-term recovery in the soil profile of 15N fromDouglas-fir needles decomposing in the forest floor. Canadian Journal of ForestResearch 25, 833e837.
Rasmussen, C., Torn, M.S., Southard, R.J., 2005. Mineral assemblage and aggregatescontrol carbon dynamics in a California conifer forest. Soil Science Society ofAmerica Journal 69, 1711e1721.
Six, J., Elliott, E.T., Paustian, K., 1999. Aggregate and soil organic matter dynamicsunder conventional and no-tillage systems. Soil Science Society of AmericaJournal 63, 1350e1358.
Sollins, P., Kramer, M.G., Swanston, C., Lajtha, K., Filley, T., Aufdenkampe, A.K.,Wagai, R., Bowden, R.D., 2009. Sequential density fractionation across soils ofcontrasting mineralogy: evidence for both microbial- and mineral-controlledsoil organic matter stabilization. Biogeochemistry 96, 209e231.
Swanston, C.W., Myrold, D.D., 1997. Incorporation of nitrogen from decomposingred alder leaves into plants and soil of a recent clearcut in Oregon. CanadianJournal of Forest Research 27, 1496e1502.
von Lützow, M., Kögel-Knabner, I., Ekschmitt, K., Matzner, E., Guggenberger, G.,Marschner, B., Flessa, H., 2006. Stabilization of organic matter in temperatesoils: mechanisms and their relevance under different soil conditionsdareview. European Journal of Soil Science 57, 426e445.
von Lützow, M., Kögel-Knabner, I., Ekschmitt, K., Flessa, H., Guggenberger, G.,Matzner, E., Marschner, B., 2007. SOM fractionation methods: relevance tofunctional pools and to stabilization mechanisms. Soil Biology and Biochemistry39, 2183e2207.
Wessels Perelo, L., Jimenez, M., Munch, J.C., 2006. Microbial immobilisation andturnover of 15N labelled substrates in two arable soils under field and laboratoryconditions. Soil Biology and Biochemistry 38, 912e922.
Zanella, A., Jabiol, B., Ponge, J.F., Sartori, G., De Waal, R., Van Delft, B., Graefe, U.,Cools, N., Katzensteiner, K., Hager, H., Englisch, M., 2011. A European morpho-functional classification of humus forms. Geoderma 164, 138e145.
Zeller, B., Dambrine, E., 2011. Coarse particulate organic matter is the primarysource of mineral N in the topsoil of three beech forests. Soil Biology andBiochemistry 43, 542e550.
Zeller, B., Colin-Belgrand, M., Dambrine, E., Martin, F., 1998. 15N partitioning andproduction of 15N-labelled litter in beech trees following [15N]urea spray.Annales des Sciences Forestieres 55, 375e383.
Zeller, B., Colin-Belgrand, M., Dambrine, E., Martin, F., Bottner, P., 2000. Decompo-sition of 15N-labelled beech litter and fate of nitrogen derived from litter ina beech forest. Oecologia 123, 550e559.
Zeller, B., Colin-Belgrand, M., Dambrine, E., Martin, F., 2001. Fate of nitrogen releasedfrom 15N-labeled litter in European beech forests. Tree Physiology 21, 153e162.