AIM CHAOS @AIM_Chaos [email protected]AIM Chaos is the research branch of a private investment vehicle named Sons of Ulster. Investment ideas shared are neither solicitations to buy nor offers to sell securities to 3 rd parties. Page 1 of 40 AIM CHAOS Rare Earth Elements: Time to Invest? Rare earth elements (‘REE’) are used in a multitude of diverse applications, from electric vehicles to wind turbines to missile systems. The global REE market has endured a torrid six years following a spectacular bursting of the 2010-11 bubble, during which period REEs had enjoyed a gargantuan surge in prices. The cause of the burst was down to the market’s near-monopolist, China, flooding the market with cheap supply and driving almost all international competition out of business. However, at last the dynamics of the industry are shifting once more: on the demand side, renewable energy technologies that utilise REEs are being rapidly adopted on a global scale; whilst on the supply side, China is curbing production and cracking down on illegal mining. A supply/demand imbalance is approaching: the development of ex- China REE deposits appears the logical solution. Executive summary Having extensively researched the global REE industry, we have come to the conclusion that the industry is at last in a state of recovery. Owing to the opaque nature of the market for REEs, coupled with a dearth of publicly listed REE-focussed companies that would offer investors exposure to the market, we believe that the commencement of the recovery has largely gone unnoticed by the investment community. Other ‘green metals’ (the name given to those metals that act as vital ingredients for clean-tech applications, e.g. electric vehicles) such as lithium and cobalt have experienced surges in prices over the past 20 months or so, which has resulted in extensive media coverage. Explorers and developers of these metals have reaped the benefits, enjoying dizzying share price gains. We are of the opinion that demand for REEs is now set upon a similar trajectory. Interestingly, on the supply side a simultaneous reduction in output is underway. We believe that these two converging trends have created an excellent investment opportunity. Below, we set out our thesis of this report: “The supply / demand dynamics of the global rare earth elements (‘REE’) industry are set to become imbalanced, owing to quasi-monopolist China curbing domestic production, and to the rapidly accelerating global adoption of renewable energy technologies that utilise REEs. We are of the opinion that the approaching market imbalance will ultimately be corrected by the fast-tracking into production of ex-China REE deposits. As such, we believe that investors should be positioning themselves for the impending recovery in the rare earth sector by investing in late stage REE projects that possess mineralisation geared towards renewable energy applications.”
AIM Chaos is the research branch of a private investment vehicle named Sons of Ulster. Investment ideas
shared are neither solicitations to buy nor offers to sell securities to 3rd parties.
Page 1 of 40
AIM CHAOS
Rare Earth Elements: Time to Invest?
Rare earth elements (‘REE’) are used in a multitude of diverse applications, from electric vehicles to wind turbines to missile systems. The global REE market has endured a torrid six years following a spectacular bursting of the 2010-11 bubble, during which period REEs had enjoyed a gargantuan surge in prices. The cause of the burst was down to the market’s near-monopolist, China, flooding the market with cheap supply and driving almost all international competition out of business. However, at last the dynamics of the industry are shifting once more: on the demand side, renewable energy technologies that utilise REEs are being rapidly adopted on a global scale; whilst on the supply side, China is curbing production and cracking down on illegal mining. A supply/demand imbalance is approaching: the development of ex-China REE deposits appears the logical solution.
Executive summary Having extensively researched the global REE industry, we have come to the conclusion that the industry is at last in a state of recovery. Owing to the opaque nature of the market for REEs, coupled with a dearth of publicly listed REE-focussed companies that would offer investors exposure to the market, we believe that the commencement of the recovery has largely gone unnoticed by the investment community. Other ‘green metals’ (the name given to those metals that act as vital ingredients for clean-tech applications, e.g. electric vehicles) such as lithium and cobalt have experienced surges in prices over the past 20 months or so, which has resulted in extensive media coverage. Explorers and developers of these metals have reaped the benefits, enjoying dizzying share price gains. We are of the opinion that demand for REEs is now set upon a similar trajectory. Interestingly, on the supply side a simultaneous reduction in output is underway. We believe that these two converging trends have created an excellent investment opportunity. Below, we set out our thesis of this report: “The supply / demand dynamics of the global rare earth elements (‘REE’) industry are set to become imbalanced, owing to quasi-monopolist China curbing domestic production, and to the rapidly accelerating global adoption of renewable energy technologies that utilise REEs. We are of the opinion that the approaching market imbalance will ultimately be corrected by the fast-tracking into production of ex-China REE deposits. As such, we believe that investors should be positioning themselves for the impending recovery in the rare earth sector by investing in late stage REE projects that possess mineralisation geared towards renewable energy applications.”
AIM Chaos is the research branch of a private investment vehicle named Sons of Ulster. Investment ideas
shared are neither solicitations to buy nor offers to sell securities to 3rd parties.
Rare Earth Elements: Time to Invest? 07 July 2017
Page 2 of 40
Rare earth elements: what are they? A rare earth element is one of a set of 17 metallic elements in the periodic table. The set is comprised of the 15 lanthanides (atomic numbers 57 through to 71), and two other chemically similar elements, namely scandium and yttrium. Exhibit 1: the 17 rare earth elements in the periodic table
Source: AIM Chaos. REEs are divided into two groups based on their atomic weight: the light REEs (‘LREE’) and the heavy REEs (‘HREE’). Two further groups – amalgamations of the LREE and HREE groups – have been compiled. The five critical rare earth elements (‘CREE’) were identified by the US Department of Energy in its ‘2011 Critical Materials Strategy’ report. Of the 17 REEs, these five CREEs were considered as having critical levels of short-term supply between 2011 and 2025. Naturally, the CREEs typically command higher prices than the other 12 REEs. The second amalgamated group is the Magnet REEs (‘MREE’), which is comprised of the four REEs that are used in the manufacturing of permanent magnets.
AIM Chaos is the research branch of a private investment vehicle named Sons of Ulster. Investment ideas
shared are neither solicitations to buy nor offers to sell securities to 3rd parties.
Rare Earth Elements: Time to Invest? 07 July 2017
Page 3 of 40
In nature, REEs are not nearly so rare as their name suggests. Cerium, the most common of the REEs, is in fact as abundant as copper in the Earth’s crust. However, they are relatively evenly distributed: accordingly, it is rare to find highly concentrated deposits of REEs that are economically viable to extract. Approximately 95% of all REEs occur in only three minerals: bastnasite, monazite and xenotime. REEs were first discovered in 1787 by Swedish army lieutenant Carl Axel Arrhenius – in the mineral ytterbite (later renamed gadolinite), which was extracted from a quartz mine at Ytterby in Sweden. In the subsequent decade yttrium oxide was separated from the mineral ytterbite for the first time. In the 1880s, REEs were commercialised following the invention of the incandescent gas mantle (which contained 60% magnesium oxide, 20% lanthanum oxide and 20% yttrium oxide). To support this, commercial mining of REEs commenced in Sweden and Norway at the same time. Brazil and the US commenced commercial production several years later, with India also joining the fray in the early 1900s. In the 1950s and 1960s, new techniques (beyond the existing technique of fractional distillation) for the efficient separation of REEs were developed: ion exchange and solvent extraction. This industry development effectively paved the way for explosive growth in both the quantity and the scale of use cases for REEs in the subsequent decades.
AIM Chaos is the research branch of a private investment vehicle named Sons of Ulster. Investment ideas
shared are neither solicitations to buy nor offers to sell securities to 3rd parties.
Rare Earth Elements: Time to Invest? 07 July 2017
Page 4 of 40
REE use-cases and applications
“Oil is the blood; steel is the body; but rare earth elements are the vitamins of a modern society”1 Introduction REEs have played a key role in enabling the development of myriad technologies over the past half century. They are used in catalysts (both catalytic converters used in cars, and fluid catalytic cracking in oil refineries); metal alloys; ceramics; phosphors; fibre optics; lasers; polishing powders; and glass additives. However, arguably their most important application is in permanent magnets – which are key components in electric vehicles (‘EV’), wind turbines and numerous consumer electronic applications (such as phones and computers). In the past decade, the wider human population has at long last begun to wake up to the damage that it has caused to planet Earth over the past hundred years. A truly global green revolution is now underway, with fossil fuels being steadily displaced by renewable energy in all walks of life. Both individual nations and the leading intergovernmental organisations have been continuously implementing and raising emissions standards to combat greenhouse gas emissions. As key ingredients for two of civilization’s most anti-fossil fuel technologies developed to date – EVs and wind turbines – rare earth magnets are accordingly set to play an increasingly essential role in the progression of the world’s society in the decades ahead. A second highly significant industry that REEs are integral to is the Defence Industry. The aforementioned technologies (especially permanent magnets) are utilised in a plethora of military applications. As such, REEs (and crucially, a secure supply of them) are also of critical importance to nations in a political sense. Permanent magnet applications Alloys of certain REEs are used to make permanent magnets. REE magnets were developed in the 1960s, and are significantly stronger than ferrite or aluminium-nickel-cobalt (‘alnico’) magnets. There are two types of REE magnets: samarium-cobalt (‘SmCo’) magnets (developed in the 1960s); and neodymium-iron-boron (‘NdFeB’) magnets (developed in the 1980s). The latter is stronger and, since it is cheaper to produce given that it uses the much more abundant element iron in place of cobalt, is today the most widely used type of permanent magnet. Exhibit 2:
Source: Widmer, J. D. et al. (April 2015): Sustainable materials and technologies.
1 Smithsonian.com (May 2016): Podcast: all about rare earth elements, the ‘vitamins’ of modern society.
AIM Chaos is the research branch of a private investment vehicle named Sons of Ulster. Investment ideas
shared are neither solicitations to buy nor offers to sell securities to 3rd parties.
Rare Earth Elements: Time to Invest? 07 July 2017
Page 5 of 40
[‘Maximum energy product’ is a measurement for the maximum amount of magnetic energy stored in a magnet. The standard unit of measurement is kj/m³ (Kilojoule per cubic meter) or MGOe (Mega-Gauss-Oersted).] Varying levels (5% to 10%) of dysprosium or terbium are used as a replacement for some of the neodymium in NdFeB magnets that are built for electric vehicles, as this preserves the magnetic performance of the magnet at elevated temperatures. Didymium – which is a mixture of 75% neodymium and 25% praseodymium – is also frequently used instead of 100% neodymium, as it is a cheaper alternative and moreover improves the magnet’s resistance to corrosion. The major use-cases of NdFeB magnets are:
- Wind turbine generators - Traction motors and integrated starter-generators in electric vehicles - Computer hard disk drives - Audio speakers and headphones - Industrial motors - Motors in cordless tools and household applications (refrigerators, vacuum cleaners, etc.) - Mobile phones, tablets, laptops, etc.
Other REE applications Catalysts Cerium and lanthanum are both used in catalyst applications. They are used in catalytic converters in cars, enabling them to run at high temperatures and playing a crucial role in the chemical reactions in the converter. They are both also employed in the process of fluid catalytic cracking in the oil refinery industry. Metallurgy and alloys A number of LREEs (neodymium, praseodymium, cerium and lanthanum) are used as alloying agents in specialised steel and aluminium alloys. An example of a use-case of such an alloy is in the engines of aircrafts. Polishing powders Cerium oxide (or ‘ceria’) is the most widely used of oxides in the application of polishing (having replaced previously used oxides such as iron oxide and zirconium dioxide). Glass additives Cerium, lanthanum, neodymium, praseodymium, europium, holmium and erbium are all used in the glass industry as colorants or fluorescents. Phosphors A number of REEs (notably europium and yttrium) are used as fluorescents and phosphors in lamps, monitors, LEDs, etc. Ceramics Several REEs (such as neodymium, praseodymium, erbium and yttrium) are also used as colorants in the ceramics industry.
AIM Chaos is the research branch of a private investment vehicle named Sons of Ulster. Investment ideas
shared are neither solicitations to buy nor offers to sell securities to 3rd parties.
Rare Earth Elements: Time to Invest? 07 July 2017
Page 6 of 40
Applications within the Defence Industry Exhibit 3 below has been sourced from a document titled “Strategic and critical materials 2013 report on stockpile requirements”, published in January 2013 by the Office of the Under Secretary of Defence for Acquisition, Technology and Logistics. It serves to demonstrate just how integral REEs are to a multitude of applications used within the Military industry.
Exhibit 3: Important Defence Uses of Strategic Materials
Cerium Semiconductors and electron tubes, Storage batteries, Glass products except containers, Motor vehicle parts
Dysprosium Nuclear control rods, Magnets, Ceramics for electronics
Erbium Communications, energy wires and cables, Nonferrous metal products, Semiconductors and electron tubes
Europium Nuclear control rods, Lasers, Phosphors for lighting and displays
Gadolinium Computer storage devices, semiconductors and electron tubes, electro-medical apparatus, magnetic and optical recording devices
Holmium Electronic components, Semiconductors and electron tubes, Other fabricated metal products
Lanthanum Primary ferrous metal products, Petroleum refineries, Storage batteries
Lutetium Electromedical apparatus, Communications, energy wires and cables, Semiconductors and electron tubes
Neodymium Magnets, Lasers, Capacitors Praseodymium Pigment, Ceramics, Fiber optics, Medical
imaging, Alloying agent Samarium Neutron absorber for nuclear reactors, Lasers,
Magnets, Capacitors Scandium Electric lamp bulbs and parts, Petroleum
refineries, Semiconductors and electron tubes, Other aircraft parts and equipment
Terbium Lasers, Phosphors for lighting and displays, Magnets, Magnet or restrictive alloys
Thulium Semiconductors and electron tubes, Other electronic components, Irradiation apparatus, Wiring devices
Ytterbium Communications, energy wires and cables, Semiconductors and electron tubes, Primary ferrous metal products, Irradiation apparatus
Yttrium Displays and lighting
Source: The Office of the Under Secretary of Defence for Acquisition, Technology and Logistics (January 2013): Strategic and critical materials 2013 report on stockpile requirements.
AIM Chaos is the research branch of a private investment vehicle named Sons of Ulster. Investment ideas
shared are neither solicitations to buy nor offers to sell securities to 3rd parties.
Rare Earth Elements: Time to Invest? 07 July 2017
Page 7 of 40
CAGR 2.5%
Market demand
“A 21st century gold rush”2 Introduction Having ascertained the numerous applications and use-cases of REEs, we now examine in detail current global demand for the group of metals. We analyse historic demand and growth in consumption to date; and we consider the market’s various forecasts for future demand of REEs. Global demand for REEs has steadily increased over the past quarter century In 1991, global consumption of the 17 REEs amounted to circa 45,000 tonnes. By 2016, this figure had increased to circa 155,000 tonnes. That is an increase of almost 250%, or a compound annual growth rate (‘CAGR’) of 5.1%. The obvious catalyst for this was the explosive growth in high-tech applications that made use of REES, such as consumer electronics, wind turbines, hybrid and electric vehicles, etc. Although growth in global consumption has slowed in the past decade, it is still increasing at a steady rate: Exhibit 4:
Source: AIM Chaos. Argus Media Ltd (August 2016): Analysing the changing global rare earths supply and demand outlook. Breakdown of global demand by REE type In 2015 (the latest year for which we have access to a comprehensive breakdown of REE figures), 149,000 tonnes of REEs were consumed. This equated to a global market value of circa $3.7bn. Exhibit 5 on the following page illustrates the breakdown of this global demand by individual REEs; whilst Exhibit 6 demonstrates how the market values of REEs vary tremendously. 2 BBC (April 2015): The dystopian lake filled by the world’s tech lust.
AIM Chaos is the research branch of a private investment vehicle named Sons of Ulster. Investment ideas
shared are neither solicitations to buy nor offers to sell securities to 3rd parties.
Rare Earth Elements: Time to Invest? 07 July 2017
Page 8 of 40
Exhibit 5:
Source: AIM Chaos. Argus Media Ltd (August 2016). Exhibit 6:
Source: AIM Chaos. Argus Media Ltd (August 2016). The charts illustrate that cerium and lanthanum are significantly cheaper than their fellow LREEs, neodymium and praseodymium; and that the HREEs europium, gadolinium, terbium and dysprosium command the highest values of the REEs. For example, in the past 18 months, cerium and lanthanum have been trading between $1,500 per tonne and $3,000 pt, whilst neodymium and praseodymium have been trading between $35,000 pt and $60,000 pt.
AIM Chaos is the research branch of a private investment vehicle named Sons of Ulster. Investment ideas
shared are neither solicitations to buy nor offers to sell securities to 3rd parties.
Rare Earth Elements: Time to Invest? 07 July 2017
Page 9 of 40
Breakdown of global demand by use-cases and applications To understand the price disparities, it is important to understand the breakdown of consumption of REEs by use-case. Exhibits 7 and 8 below illustrate this breakdown and, in combination with Exhibits 5 and 6 on the preceding page, demonstrate why certain REEs have higher price points. Exhibit 7:
Source: AIM Chaos. Argus Media Ltd (August 2016). Exhibit 8:
AIM Chaos is the research branch of a private investment vehicle named Sons of Ulster. Investment ideas
shared are neither solicitations to buy nor offers to sell securities to 3rd parties.
Rare Earth Elements: Time to Invest? 07 July 2017
Page 10 of 40
It is clear, for example, to observe that the REEs used in rare earth magnets are deemed more valuable than the majority of other REEs: demand for REEs for use in permanent magnets amounted to 21% of global demand in 2015; yet this same volume accounted for 62% of global sales. As was highlighted on pp.4-5, the expensive REEs neodymium, praseodymium and dysprosium are all used in the manufacturing of permanent magnets. On the other end of the spectrum, the REEs used predominantly in catalyst applications (both in automobiles and in the process of oil cracking) are the cheapest of the REEs, namely cerium and lanthanum. Forecast growth in global demand Given the myriad advanced technologies that REEs are used in and the substantial growth in global consumption that has occurred over the past three decades, it is rather unsurprising that industry analysts anticipate global demand continuing to grow considerably over the coming decade. This is especially true of the primary MREEs, neodymium and praseodymium. Argus Media is forecasting growth in global demand for REEs from 155,000 tonnes in 2016 to 195,000 tonnes by 2025 – a CAGR of 2.6% over the period. Exhibit 9:
AIM Chaos is the research branch of a private investment vehicle named Sons of Ulster. Investment ideas
shared are neither solicitations to buy nor offers to sell securities to 3rd parties.
Rare Earth Elements: Time to Invest? 07 July 2017
Page 11 of 40
MREEs demand to increase markedly as the world’s green revolution gathers momentum A core hypothesis of this paper is that the magnet rare earths, namely neodymium, praseodymium, terbium and dysprosium, are set to enjoy increased demand in the coming decade, and significantly increased market prices, relative to the other REEs. The rationale behind this view stems from the extensive utilisation of rare earth permanent magnets in green technologies, and specifically within two of the most important and well-known green technologies currently in existence – hybrid and electric vehicles, and wind turbines. Coupled with this is the now global recognition that we as a species must act urgently to stem expansion of the “greenhouse effect” in order to prevent global warming. The most important long-lived force catalysing the greenhouse effect is an increasing concentration of carbon dioxide within the atmosphere. The burning of fossil fuels has been a key driver of this over the past two and a half centuries, since the beginning of the Industrial Revolution. Indeed, since then the human species has increased atmospheric CO₂ by more than a third. Accordingly, the generation, storage and utilisation of renewable energy will become increasingly fundamental to the global economy and society in the future.
AIM Chaos is the research branch of a private investment vehicle named Sons of Ulster. Investment ideas
shared are neither solicitations to buy nor offers to sell securities to 3rd parties.
Rare Earth Elements: Time to Invest? 07 July 2017
Page 12 of 40
Wind energy
“Transitioning our electricity sector away from fossil fuels is no longer just an environmental imperative – it’s an economic one. Free markets now favour solar and wind”3
In 2016, a milestone was reached in the world’s transition to renewable energy sources: the levelized cost of energy (‘LCOE’) for both wind and solar for the first time fell below the LCOE for coal, nuclear and combined cycle gas. Renewables are now the cheapest available sources of electricity, even without government subsidies. Exhibit 10:
Source: Lazard (December 2016): Levelized cost of energy analysis 10.0. In fact, Lazard’s findings into today’s cheapness of wind energy (with explicit reference to the US) go further: “The all-in price of wind is not only cheaper than building new natural-gas plants in most of the US – new wind beats some fossil fuel power plants on their marginal cost (i.e. costs for operating, maintaining, fuelling, etc.) alone. In other words, it’s now cheaper in a significant number of places to build new wind than simply continuing to operate an existing coal and nuclear plant.” Lazard’s most recent ‘Levelized Cost of Energy Analysis’ report reveals that today’s wind costs are one-third of what they were as recently as 2009, having fallen from circa $140 per megawatt-hour (‘/MWh’) to $47/MWh in just seven years. The rapid progress made in improving the economics of wind energy is evident in the number of wind turbines that have been erected globally since the turn of the millennium:
3 America’s Power Plan (December 2016): Wind and solar are our cheapest electricity sources – now what do we do?
AIM Chaos is the research branch of a private investment vehicle named Sons of Ulster. Investment ideas
shared are neither solicitations to buy nor offers to sell securities to 3rd parties.
Rare Earth Elements: Time to Invest? 07 July 2017
Page 13 of 40
Exhibit 11:
Source: Global Wind Energy Council (January 2017): gwet.net. In the 15-year period from 2001 to 2016, total global installed wind capacity increased from 23.9 gigawatts (‘GW’) to 486.7 GW, which amounts to a CAGR of 22.3%. Across the globe, nations are expanding their wind energy generation capacities. The US produces 2.5 times more wind energy than it did only five years ago, whilst Denmark’s wind turbines now produce more than 40% of all the nation’s electricity. The now proven commercial attractiveness of wind energy over fossil fuels as demonstrated in Exhibit 10 is coupled with four other key political, social and environmental advantages over fossil fuels that point to wind (amongst other renewable sources such as solar) as the energy solution of the future.4 These are:
i) Jobs Renewable energy employs more people per unit of electricity than oil or gas. More than 1 million people worldwide are employed by the wind industry alone. If the global share of renewable energy were to be doubled by 2030, renewable energy employment would exceed 24 million people worldwide.
ii) Water Water is an essential ingredient in the energy production process. In the EU for example, energy production accounts for 44% of total water use. During power generation, solar power withdraws 200 times less water than a coal power plant to produce the same amount of electricity. Wind power requires no water. Analysis carried out by the International Renewable Agency (‘IRENA’) found that by doubling the global share of renewable energy, in particular solar PV and wind, water withdrawals in the power sector could be reduced by as much as 52% in the UK, 37% in the US, and 32% in Australia, for example.
4 Global Wind Energy Council (October 2016): Global wind energy outlook, 2016.
0
100,000
200,000
300,000
400,000
500,000
600,0002
00
1
20
02
20
03
20
04
20
05
20
06
20
07
20
08
20
09
20
10
20
11
20
12
20
13
20
14
20
15
20
16
MW
Global cumulative installed wind capacity, 2001-16
AIM Chaos is the research branch of a private investment vehicle named Sons of Ulster. Investment ideas
shared are neither solicitations to buy nor offers to sell securities to 3rd parties.
Rare Earth Elements: Time to Invest? 07 July 2017
Page 14 of 40
iii) Public health / air pollution Doubling the share of renewables would also decrease harmful emissions from pollutants such as ammonia, particulate matter, volatile organic compounds, and sulphur dioxide by 82%, 33%, 27% and 12% respectively, saving up to 4 million lives per year by 2030. The largest air pollution savings would come from the power sector, mainly due to reduced coal use. China, India, Indonesia and the US would accrue the greatest health savings, along with all developing countries thanks to the reduced use of traditional biomass.
iv) Climate change The energy sector accounts for more than two thirds of global greenhouse gas emissions. Renewable energy generation is the optimal technology (in terms of rollout speed and scalability) that can be deployed to combat the greenhouse effect.
Accordingly, there is ample scope for the wind energy industry to maintain its rapid growth going forward. Indeed, the Global Wind Energy Council’s latest forecasts indicate substantial expansion in the coming decades: Exhibit 12:
Source: Global Wind Energy Council (October 2016). *Using GWEC’s ‘Moderate Scenario’. GWEC’s ‘moderate scenario’ for future installation of global wind capacity forecasts 3,984 GW by 2050, which would amount to a highly impressive CAGR of 11.5% over the 50-year period from 2000. Other forecast scenarios for installed global wind capacity by 2030 range from 1,260 GW to 2,110 GW (and forecast as much as 5,806 GW by 2050).
0
500,000
1,000,000
1,500,000
2,000,000
2,500,000
3,000,000
3,500,000
4,000,000
4,500,000
2000 2010 2020 2030 2040 2050
MW
Forecast of global wind installation to 2050CAGR 11.5%
AIM Chaos is the research branch of a private investment vehicle named Sons of Ulster. Investment ideas
shared are neither solicitations to buy nor offers to sell securities to 3rd parties.
Rare Earth Elements: Time to Invest? 07 July 2017
Page 15 of 40
Rare earth magnets and wind turbines NdFeB magnets (permanent magnets comprised of neodymium, iron, boron and varying levels of praseodymium / dysprosium / terbium) are used within direct drive (‘DD’) wind turbines and hybrid drive (‘HD’) wind turbines. As opposed to the conventional, historically more widely adopted wind turbine engine model, namely the ‘gearbox’ system, the DD system employs a synchronous generator to convert the movement of the rotor directly into electrical energy. The advantages of the DD system over the gearbox system are:
- Lighter, more compact system; - Less maintenance required (as it has fewer components), which boosts production time; - Better efficiency rates even at lower wind speeds (as no power outlays are required to
operate electromagnets in the generator); - Significantly lower noise levels.
DD generators were first commercially produced in the early 1990s, with the preferred model being the electrically excited synchronous generator (‘EESG’). Today’s leader (and only major manufacturer) in the EESG field is German company Enercon GmbH, which is the fourth largest wind turbine manufacturer in the world. However, with the prices for MREEs coming down significantly from 1995 onwards, the permanent magnet synchronous generator (‘PMSG’) became the DD system of choice. In addition to lower cost, a turbine employing a PMSG enjoys a number of advantages over an equal megawatt (‘MW’) turbine that employs an EESG:
- It has greater efficiency, especially whilst operating at partial loads; - It is more robust and therefore requires less maintenance (as a result of having fewer
moving parts than EESGs). Major manufacturers of PMSGs include Goldwind (circa 73% market share); Siemans; and XEMC Darwind. As PMSGs are superior to EESGs, only Europe (owing to the aforementioned Enercon) has any meaningful installed wind capacity in the EESG DD format. In Asia, PMSG-based DD turbines account for almost 40% of total installed wind capacity. In the HD system, the turbine employs NdFeB magnets but in a geared motor format. These designs are more complicated than DD systems but less so than the conventional gearbox system: however, they require smaller magnets that use fewer REEs than do DD systems, and thus demand for them is increasing. Estimates for the weight of total NdFeB magnet material per MW of turbine output vary considerably:
- For a HD turbine, total magnet weight/MW averages 200kg/MW - For a DD turbine, total magnet weight/MW averages 600kg/MW
Neodymium content is estimated to be 31% of magnet weight; whilst dysprosium content is estimated to be between 2% and 4%.5 We therefore assume an average of 35% of the total magnet weight is attributable to REEs. Accordingly,
- For a 1 MW HD turbine, total REE weight averages 70kg
5 US Department of Energy (December 2011): Critical materials strategy.
AIM Chaos is the research branch of a private investment vehicle named Sons of Ulster. Investment ideas
shared are neither solicitations to buy nor offers to sell securities to 3rd parties.
Rare Earth Elements: Time to Invest? 07 July 2017
Page 16 of 40
- For a 1 MW DD turbine, total REE weight averages 210kg 6
Calculating the demand for REEs in HD and DD wind turbines going forward is difficult, owing to the lack of accurate market figures for the existing and forecast market share of HD and DD turbines. Recent estimates put the market share for HD/DD turbines at 25% to 28% of all global installed wind capacity. This is up from a global market share of only circa 12% in 2008. Industry analyst Adamas Intelligence has forecast that the global share of DD turbines will have increased to 47% by 2020.7 The key catalyst behind this assumption is the anticipated continued rapid rollout of wind power installations in China and in the Asia Pacific region. China is by some distance the global leader in wind energy, accounting for circa 35% of total global installed capacity as at end 2016. Crucially, China is also the clear market leader in the DD wind turbine market – and specifically, the PMSG DD submarket. This is as a result of China’s access to cheap supplies of MREEs, which we cover in depth later in this note. Through a process of simple extrapolation of the information already presented, we provide Exhibit 13 on the following page to illustrate the potential additional demand for neodymium / praseodymium (‘NdPr’) that a global build out of PMSG HD and DD type turbines could generate over the next 14 years, from end 2016 to end 2030. In light of PMSG DD systems being the design of choice (assuming all else being equal), and given that REE supply will likely be more readily available to turbine manufacturers from 2020, we have created scenarios based on PMSG HD / DD installations as a percentage of total installations increasing beyond Adamas’ 2020 target of 47%. Across our projections, we assume that 75% of the newly installed PMSG systems will be DD, and 25% will be HD.
6 These calculations are corroborated by both the: Massachusetts Institute of Technology (February 2012): Evaluating rare earth element availability: A case with revolutionary demand from clean technologies. Bulletin of the Atomic Scientists (November 2011): The myth of renewable energy. 7 Mkango Resources Ltd (February 2017): Investor presentation.
AIM Chaos is the research branch of a private investment vehicle named Sons of Ulster. Investment ideas
shared are neither solicitations to buy nor offers to sell securities to 3rd parties.
Rare Earth Elements: Time to Invest? 07 July 2017
Page 17 of 40
Source: AIM Chaos. At present, we believe that wind turbines account for circa 2,000 tonnes to 3,000 tonnes of NdPr, of the global annual NdPr demand of circa 39,000 tonnes. Accordingly, were even the most conservative of our scenarios to transpire in the coming years, a step change in NdPr production would have to occur to meet this increased annual demand. To put this forecast increase in demand into perspective, we reference Mkango Resources Ltd, owner and developer of a NdPr-rich deposit named Songwe Hill, located in Malawi, East Africa. The pre-feasibility study for Songwe Hill envisages an operation that would produce 983 tonnes of NdPr per annum. In other words, a further four Songwe Hills would have to come online in the next few years, simply to meet the most conservative of our scenarios for the global rollout of wind turbines.
Exhibit 13: Potential NdPr demand, 2017–2030, from permanent magnet synchronous generators used in direct drive and hybrid drive wind turbines
Global installed wind turbine capacity, end 2016 (estimated) (GW) 487 Global installed wind turbine capacity, end 2030 (forecast) (GW) 1,675 New capacity to be built in next 14 years (GW) 1,188
Scenario 1 PMSG HD / DD turbines as a percentage of forecast new capacity 50.0% New PMSG HD / DD capacity in next 14 years (GW) 594 REEs required over 14-year period (tonnes) 104,027 REEs required, annualised (tonnes) 7,430
Scenario 2 PMSG HD / DD turbines as a percentage of forecast new capacity 66.7% New PMSG HD / DD capacity in next 14 years (GW) 793 REEs required over 14-year period (tonnes) 138,771 REEs required, annualised (tonnes) 9,912
Scenario 3 PMSG HD / DD turbines as a percentage of forecast new capacity 75.0% New PMSG HD / DD capacity in next 14 years (GW) 892 REEs required over 14-year period (tonnes) 156,040 REEs required, annualised (tonnes) 11,146
AIM Chaos is the research branch of a private investment vehicle named Sons of Ulster. Investment ideas
shared are neither solicitations to buy nor offers to sell securities to 3rd parties.
Rare Earth Elements: Time to Invest? 07 July 2017
Page 18 of 40
Hybrid and electric vehicles
“The time is right for electric cars – in fact the time is critical”8 Since the dawn of the new millennium, there has been a rapidly growing global interest in the electric vehicle (‘EV’) industry: its crucial importance to Earth and humanity is at last being recognised and appreciated on a worldwide scale. Road-worthy EVs were in existence as far back as the late 1800s. Indeed, by the beginning of the 20th century in the US, 40% of automobiles were powered by steam, 38% by electricity, and 22% by gasoline. Sales of EVs peaked in the 1910s. However, a number of aspects led to the demise of EVs from the 1920s onwards, to be displaced by the gasoline automobile. These were:
- Gasoline vehicles were faster - Gasoline vehicles had a greater range (before refuel / recharge) - Substantial road infrastructure programmes were implemented across the globe,
augmenting the importance of the gasoline automobile’s aforementioned two superiorities
- The introduction of the electric switch in gasoline automobiles to replace the hand crank - New discoveries of significant oil reserves across the globe which resulted in the
availability of affordable gasoline - Henry Ford initiating mass production of gasoline automobiles, which drove EV pricing
out of the market The renaissance of the past decade Since 2008, there has been a renaissance in the manufacturing and usage of EVs. This has been brought about by two key themes:
i) Global acknowledgement of necessity of reducing greenhouse gas emissions In this report we have frequently referred to humanity’s green revolution that has been underway for the past two decades, and looks to be snowballing. For example, the UK’s Climate Change Act 2008 set in place a duty for the government to ensure that the net UK carbon account for greenhouse gases for the year 2050 is at least 80% lower than the 1990 baseline. This is binding on all formed governments that will rule from 2008 to 2050, regardless of party or leadership. The world took a colossal step forward last year, with the signing of the Paris Agreement by 195 countries: the Agreement is the first ever universal, legally binding global climate deal. Starting in 2020, it encompasses greenhouse gases emissions mitigation, adaptation and finance. The green revolution truly does appear an unstoppable force now, gathering momentum and pushing into many walks of life. The petrol-fuelled car is perhaps the most widely recognised icon when referencing global warming – and with good cause. The Transportation industry accounts for circa 14% of global greenhouse gas emissions (given that 95% of the world’s transportation energy comes from petroleum-based fuels). 9
8 President and CEO of Nissan – Carlos Ghosn (November 2009). 9 US Environmental Protection Agency (May 2017): www.epa.gov.
AIM Chaos is the research branch of a private investment vehicle named Sons of Ulster. Investment ideas
shared are neither solicitations to buy nor offers to sell securities to 3rd parties.
Rare Earth Elements: Time to Invest? 07 July 2017
Page 19 of 40
The use of such imagery by organisations to educate others about the hard facts concerning the damage that petrol and diesel vehicles do to the atmosphere, results in an acknowledgement of the necessity of reducing greenhouse gas emissions at both the individual and the organisational level. With specific regard to EVs:
a) Individual level Assuming a petrol-fuelled car and an EV are identical in everything save their energy sources, it is safe to assume that the vast majority of individuals in the world would drive the latter. Clearly, this is a product of years of national and international education by governments across the globe. However, an even greater percentage of people would select the EV over the petrol-fuelled car, were some sort of reward to be granted for doing so…
b) Organisational level For the past decade, governments have been providing subsidies (often extremely generous) to individuals who buy and drive EVs. The UK government is offering grants of up to £4,500 to buyers of EVs; and in the US, tax credits of up to $7,500 are being offered. In Norway, where there are now over 100,000 EVs compared to a population of only 5.2m, buyers of EVs are not charged any of the usual 25% VAT applicable to petrol-fuelled cars: as a result of this initiative, EVs now account for 37% of all new car sales in the country. In China, governmental subsidies to galvanise growth in the nation’s budding EV industry dwarf those of its Western counterparts. This has primarily been as a result of the government’s realisation of the urgent necessity to combat the terrible levels of pollution engulfing the nation’s cities. Not only are consumers granted significant subsidies, but developers and manufacturers of EVs are also receiving substantial amounts of grant funding. Consequently, in only a few short years China has become the global leader of the EV industry: more EVs are sold a year in China at present than throughout the rest of the world combined.
ii) Falling manufacturing costs for EVs In addition to the benefits of subsidies, manufacturing costs have also been reduced considerably due to falling battery costs. Batteries constitute approximately one third of the total cost of an EV: since 2008, battery costs have decreased by over 75% from circa $1,000/kWh to less than $230/kWh. This has been driven by continued technological innovation coupled with the advantages of scale of economy.
AIM Chaos is the research branch of a private investment vehicle named Sons of Ulster. Investment ideas
shared are neither solicitations to buy nor offers to sell securities to 3rd parties.
Rare Earth Elements: Time to Invest? 07 July 2017
Page 20 of 40
CAGR
124.8%
Exhibit 14:
Source: McKinsey & Company (January 2017): Electrifying insights: how automakers can drive electrified vehicle sales and profitability.
Recent and forecast market growth Due to government subsidies and cheaper manufacturing costs – and spurred on by a steadily increasing pan-global consciousness of the effects of greenhouse gas emissions on global warming – the EV market has enjoyed astronomical growth since 2010. Global sales of EVs increased from c.6,000 in 2010 to c.774,000 in 2016, equating to a CAGR of 125%. Exhibit 15:
Source: EV-volumes.com (2017): Global Plug-in Sales for 2016. The universal consensus is that rapid growth in EV sales is set to continue. As at end 2016, there were approximately 2.1 million EVs on the world’s roads: one research house, Frost & Sullivan,
AIM Chaos is the research branch of a private investment vehicle named Sons of Ulster. Investment ideas
shared are neither solicitations to buy nor offers to sell securities to 3rd parties.
Rare Earth Elements: Time to Invest? 07 July 2017
Page 21 of 40
forecasts sales of 950,000 in 2017.10 By 2030, French oil major Total SA expects EVs to account for up to 30% of all new car sales on a global basis.11 By 2035, UK oil major BP believes the EV global count could amount to 100m,12 whilst global mining conglomerate BHP Billiton forecasts that the count will have reach 140m by then.13 There are numerous other similar forecasts made by respected entities in the public domain. Many governments’ declared targets go a long way to validating the aforementioned forecasts: for example, China wants 11% of all domestic car sales to be EVs by 2020; and India wants all car sales to be EVs by 2030. Rare earth magnets and hybrid and electric vehicles The vast majority of EV manufacturers utilise NdFeB permanent magnets. Most significantly, the magnets are used in an EV’s electric traction motor (the engine that propels the vehicle). In short, the properties of NdFeB magnets enable the development of “compact, torque- and power-dense” motors that other competing technologies struggle to replicate.14 NdFeB magnets are also used in between 20 and 50 smaller electric motors throughout the vehicles (e.g. powering electric windows, etc.). To our knowledge, the only commercial models of pure EVs (i.e. not taking into account hybrids) that do not utilise NdFeB magnets in their traction motors are those produced by Tesla. Instead of the permanent magnet synchronous motor used by its competitors, Tesla employs an AC induction motor in it cars. In calendar year 2016, sales of Tesla models (S and X combined) amounted to 76,230. This figure equates to 9.8% of global sales in the year (777,497). With regard to hybrid electric vehicles (‘HEV’), only Honda has a model that does not require NdFeB magnets. EVs utilise between 1kg and 2kg of NdFeB magnets. For our basic forecasts, we assume that each EV utilises 2.0kg. Applying our previously defined makeup of a NdFeB magnet (see p.15) – i.e. REEs account for 35% of the magnet weight – we calculate that each EV has a content of 0.70kg of REEs. Accounting for Tesla’s market share growing in the coming years, and furthermore for other manufacturers also beginning to use AC induction motors, we assume that NdFeB magnets will be used in 80% of EV traction motors (and other appliances) going forward. We have compiled some basic forecasts for growth in global EV sales based on the above information and using data from Bloomberg (see Exhibits 16 and 17 overleaf) as an approximate guideline.
10 Frost & Sullivan (April 2017): EV manufacturers to focus on range, recharging, and inductive charging. 11 Bloomberg (April 2017): The EV boom is so real even oil companies say it’s coming. 12 The Telegraph (January 2017): BP braces for EV revolution as oil demand growth slows. 13 Financial Times (October 2016): EVs will influence demand for metals more than oil. 14 Widmer, J D et al. (April 2015).
AIM Chaos is the research branch of a private investment vehicle named Sons of Ulster. Investment ideas
shared are neither solicitations to buy nor offers to sell securities to 3rd parties.
Rare Earth Elements: Time to Invest? 07 July 2017
Page 22 of 40
Exhibit 16: Forecast EV sales as a % of total global vehicle sales
Source: Bloomberg New Energy Finance (February 2016): Here’s how electric cars will cause the next oil crisis. Exhibit 17: Forecast cumulative sales for EVs on a global basis
Source: Bloomberg New Energy Finance (February 2016). From our EV sales forecasts and from our assumptions on NdFeB magnet utilisation in EVs, we have generated forecasts out to 2040 for annual NdPr demand from the global EV market.
AIM Chaos is the research branch of a private investment vehicle named Sons of Ulster. Investment ideas
shared are neither solicitations to buy nor offers to sell securities to 3rd parties.
Rare Earth Elements: Time to Invest? 07 July 2017
Page 23 of 40
Exhibit 18:
Source: Aim Chaos. It is important to note that our calculations do not take into account production of HEVs, which also utilise NdFeB magnets extensively. It has been reported that a Toyota Prius (a best-selling hybrid vehicle) utilises around 1kg of NdPr in its motor, as well as nearly 30kg of lanthanum. Over 1.4m Toyota HEVs were sold last year globally – twice the number of EVs of all brands combined. Moreover, (growth in) production of petroleum vehicles – which use NdFeB magnets to a lesser extent (namely in motors for applications such as electric windows) – has also not been taken into account. Recently published research by UBS revealed that, in a 100% EV world (using today’s global production of all road vehicles), demand for REE would be 655% higher.15 Coupled with Morgan Stanley’s recent research – which envisages a base case global penetration rate of EV sales in 2050 of 69% (which equates to cumulative sales of EVs by 2050 of circa 1 billion) – it is straightforward to perceive that our own forecasts for growth in NdPr demand in the longer term could fall well short.16 This week, Chinese-owned Swedish carmaker Volvo announced that all of its cars launched after 2019 would be EV or HEV. This made Volvo the first auto giant to set a date for actual complete phase out of internal combustion engines. In our opinion, other majors will follow in Volvo’s footsteps in the near future.
15 Financial Times (May 2017): UBS takes apart Chevy Bolt, says electric vehicles will disrupt commodity markets. 16 Morgan Stanley (May 2017): Batteries may power future of auto industry.
AIM Chaos is the research branch of a private investment vehicle named Sons of Ulster. Investment ideas
shared are neither solicitations to buy nor offers to sell securities to 3rd parties.
Rare Earth Elements: Time to Invest? 07 July 2017
Page 24 of 40
The anticipated effect on demand for neodymium and praseodymium (‘NdPr’) As we highlight on p.10, total REE demand has been forecast to grow by 40,000 tonnes (or 34.5%) in the nine-year period from end 2016 to end 2025. However, as our internal forecasts support, the market consensus is that growth in demand for NdPr will significantly outstrip growth in demand for the 17 REEs as a whole. Below we list several examples of market forecasts for NdPr demand. From a global consumption of 37.3kt of NdPr in 2015:
- IMCOA forecasts that NdPr demand will have increased by circa 160% by 2025, to circa 97kt 17
- Resource Capital Research envisages demand increasing at a CAGR of 10% going forward, effectively doubling by 2024 18
- Corporate finance house RFC Ambrian forecasts NdPr demand increasing by between 15kt and 35kt (40% and 94%) by as soon as 2020 19
- Adamas Intelligence likewise believes that NdPr demand will have doubled by 2025 20
17 Industrial Minerals Company of Australia Pty Ltd (October 2016). 18 Resource Capital Research (October 2016): Arafura Resources Ltd. 19 RFC Ambrian (November 2016): The Alchemist. 20 Adamas Intelligence (October 2016): Rare earth market outlook: supply, demand, and pricing from 2016 through 2025.
AIM Chaos is the research branch of a private investment vehicle named Sons of Ulster. Investment ideas
shared are neither solicitations to buy nor offers to sell securities to 3rd parties.
Rare Earth Elements: Time to Invest? 07 July 2017
Page 25 of 40
Demand for REEs by geography In 2015, global consumption of REEs amounted to 149,000 tonnes. Of this total, demand from China was circa 86.4kt; demand from the US was c.16.4kt; and demand from Japan was c.14.9kt. Exhibit 19:
AIM Chaos is the research branch of a private investment vehicle named Sons of Ulster. Investment ideas
shared are neither solicitations to buy nor offers to sell securities to 3rd parties.
Rare Earth Elements: Time to Invest? 07 July 2017
Page 26 of 40
Market supply
Introduction Having analysed the demand side of the global REE market, we now turn our attention to the supply side. In this section, we analyse the technicalities behind mining and processing REEs; the current global reserves of REEs; and the current and future supply of REEs, including existing and potential producers. Given that China controls 88% of global production and hosts 42% of global reserves, we dedicate the next section to the nation’s position in the REE market. Mining, beneficiation and separation
Each rare earth deposit is unique, composed of a variety of minerals. Bastnasite, monazite, xenotime and ion-absorbing type rare earth clays, are the world’s key sources of rare earth production. Prior to individual REE separation, the mined rare earth ore goes through a series of crushing, screening, grinding, flotation and thickening processes. Given the uniqueness of each deposit, flowsheets are specifically tailored to deposits in order to concentrate the rare earth ore in the most economical manner. Concentrates are then cracked/roasted with sulphuric acids and leached with water and/or an acid/alkali solution. Once filtered and purified, the leach solution then undergoes solvent extraction (‘SX’) (and less commonly, ion exchange (‘IX’)) for the separation of individual REEs. The environmental issues caused by rare earth mining and processing These processes use up vast quantities of water as well as sulphuric acid and hydrochloric acid which often results in valuable by-products being unrecoverable. Moreover, the processes also produce vast quantities of hazardous waste, including acid mine drainage; heavy metals and radionuclides in dust; contaminated waste water; acidic gas fumes; volatile organic compounds; and airborne contaminants. But the most dangerous of waste products that emerges from the process is radioactive waste: specifically, the radioactive element thorium. Thorium is present within the rare earth mineral, monazite (and to a lesser degree within xenotime): ingesting it (inhaling thorium dust, drinking thorium-contaminated water, etc.) increases the risk of lung and pancreatic cancers and leukaemia. At the largest REE mining / processing operation in the world – the bastnasite / monazite deposits of the Bayan Obo Mining District in Inner Mongolia, China – a giant tailings pond (which could better be described as a lake) has been created to house the waste from the operations. One of these wastes is thorium. For many miles around, crops of surrounding villages have failed and livestock has been wiped out. Airborne toxins and soil and groundwater contaminated with thorium have been chief causes of this. The mining and processing of ion-absorbing type rare earth clay deposits (which contain a higher percentage of the highly valuable HREEs) is similarly damaging to the surrounding environment.
AIM Chaos is the research branch of a private investment vehicle named Sons of Ulster. Investment ideas
shared are neither solicitations to buy nor offers to sell securities to 3rd parties.
Rare Earth Elements: Time to Invest? 07 July 2017
Page 27 of 40
Global reserves of REEs by geography There is at present a global reserve base of all REEs of circa 130 Mt. China holds the largest reserve base of any individual nation, at circa 55 Mt; and Brazil comes in second place, at circa 22 Mt. Exhibit 20:
Source: AIM Chaos. Argus Media Ltd (August 2016). Approximately 95% of all REEs occur in only three minerals: bastnasite, monazite and xenotime. China, which holds circa 42% of the world’s currently known reserves, is rich in both LREEs and HREEs. Its LREEs are contained mainly in the form of bastnasite and monazite. Its highly valuable HREEs are largely sourced either from xenotime or from ion-absorbing type rare earth clays with the largest deposits and operations located in Southern China – in the Guangdong, Hunan, Jiangsu and Jiangxi provinces. Owing to the aggressive ramp up by China in HREE production over the past 30 years, it is believed that the country’s reserves of HREEs could be depleted within 20 years. Brazil holds the second largest REE reserve base in the world. Its reserves are predominantly in the form of monazite, concentrated along the east coast of the country. Similarly, India’s REE reserves mainly exist in the form of monazite distributed in coastal placers. Australia, which as we demonstrate overleaf is presently the only major producer of REEs outside of China, is rich in monazite deposits. Its only operation currently producing is Mt Weld in the South-West: its primary REE bearing minerals are monazite, apatite and synchysite. At the US’ largest and most advanced REE project – Mountain Pass in California – bastnasite is the leading mineral.
United States, 1%
Brazil, 17%
Australia, 2%
China, 42%
India, 2%
Other, 32%
Global REE reserves by geography, 2015: circa 130 Mt
AIM Chaos is the research branch of a private investment vehicle named Sons of Ulster. Investment ideas
shared are neither solicitations to buy nor offers to sell securities to 3rd parties.
Rare Earth Elements: Time to Invest? 07 July 2017
Page 28 of 40
Global production of REEs Exhibit 21 demonstrates the substantial growth that the industry has enjoyed since 1950. This rapid expansion in global production has been driven by the exponential growth in demand for certain REEs, which itself has come about due to incessant technological innovation. Exhibit 21:
Source: Geology.com It is however vital to note that Exhibit 21 only portrays official statistics coming out of China. In each of 2015 and 2016, China ostensibly produced 105,000 tonnes of REEs, with the Rest of World (‘RoW’) producing only 24,800 tonnes and 21,200 tonnes respectively: Exhibit 22:
Nation Mine production (tonnes)
2015 2016
United States 5,900 0 Australia 12,000 14,000 Brazil 880 1,100 China 105,000 105,000 India 1,700 1,700 Malaysia 500 300 Russia 2,800 3,000 Thailand 760 800 Vietnam 250 300
Total 129,790 126,200
Source: US Department of the Interior US Geological Survey (January 2017): Mineral commodity summaries 2017. Yet over the past 25 years, true global REE production has been difficult to quantify exactly, owing to the prevalence of illegal mining in China (which is of course not recorded). It has been estimated that production from illegal mining amounted to circa 44,000 tonnes in 2016, increasing the ‘official’ global total by circa 35% to 170,000 tonnes.
AIM Chaos is the research branch of a private investment vehicle named Sons of Ulster. Investment ideas
shared are neither solicitations to buy nor offers to sell securities to 3rd parties.
Rare Earth Elements: Time to Invest? 07 July 2017
Page 29 of 40
Exhibit 23:
Source: AIM Chaos. Argus Media Ltd (August 2016). China China’s government has officially limited production from its ‘legitimate’ operators at 105kt pa. As we examine in the next section, REE mining and smelting operations have over the past two years been consolidated into six major state-owned enterprises (‘SOE’) that control this 105kt pa output. The ratio of LREEs to HREEs being produced by the SOEs is currently circa 4 : 1. However, the substantial produce from illegal mining is predominantly in the form of HREEs. Australia Mt Weld, owned by ASX-listed Lynas Corp, is the nation’s only REE operation that is in production. It is in the process of being ramped up to its nameplate capacity of 22kt pa, having produced just shy of 14kt of rare earth oxides in CY 2016. Forecasts for global production At the time of writing, there are no new REE mines currently under construction globally. There are a handful that have completed definitive or bankable feasibility studies (‘DFS’ or ‘BFS’), but to our knowledge none have yet agreed definitive terms for project finance. As such, no new ex-China REE project of significant scale is likely to come online for two years at the very least, which makes forecasting global REE production over the next five or ten years a very difficult task. As we examine in the next section, global REE production is in fact likely to decrease over the next three years, as illegal production occurring in Southern China is stamped out.
AIM Chaos is the research branch of a private investment vehicle named Sons of Ulster. Investment ideas
shared are neither solicitations to buy nor offers to sell securities to 3rd parties.
Rare Earth Elements: Time to Invest? 07 July 2017
Page 30 of 40
China: quasi-monopolist of the REE industry
“The Middle East has oil, China has rare earths”21
Introduction 22 China has very nearly monopolised global production of REEs. We refer to the nation as a quasi-monopolist as there is limited production of REES from several other nations in the world, as demonstrated on the previous page. However, given its superiority on margins and size of reserves, for all intents and purposes China controls the global market supply of REEs. The nation has also become by far the world’s largest consumer of REEs, having developed a substantial and highly advanced downstream processing and application manufacturing industry. As highlighted on p.25, in 2015 the nation accounted for 58% of global consumption of REEs. However, China’s status of quasi-monopolist has only been attained relatively recently. In the 1970s, the nation’s production output of REEs was negligible: the US in fact dominated REE production, with the massive Mountain Pass mine in California churning out an average of 16kt pa throughout the 1980s. It was only in the early ‘80s that China’s government, finally appreciating the extent and quality of its own reserves, began actively driving the development of its nascent REE industry and ramping up national production. Yet within only two decades, by the turn of the millennium, the nation utterly dominated the global REE market. In this section we explain how China’s remarkable rise to dominance of the REE market occurred. The story of China’s monopolisation of the REE market Resource base provides the head-start China’s ability to establish a REE industry and subsequently to establish a quasi-monopoly over it in such an astoundingly short period is as a result of its substantial REE reserves. Strangely, the crown-jewel of the nation’s REE portfolio, namely the Bayan Obo Deposit to the north of the city of Baotou in Inner Mongolia, was developed as a giant iron ore mine, and only latterly were the REEs processed as by-products. The minerals that host the REEs are bastnasite and monazite, which largely contain LREEs. The nation also has two other major bastnasite LREE deposits: the Mianning Deposit in Sichuan Province, and the Weishan Deposit in Shandong Province. China also hosts another type of deposit: ion-absorbing type rare earth clays. These REE ores are relatively low grade but are inexpensive to extract. They possess a high concentration of HREEs, and are the world’s main source of them. China’s ion-absorbing type rare earth clay deposits are located in its tropical southern provinces. Processing this type of deposit is very simple, in comparison to the processing of bastnasite, monazite and xenotime: it is mined via open-pit method and no ore beneficiation is required. The leaching process is straightforward, usually carried out in a concrete bath. The deposit type also contains a very low content of radioactive elements. As such, ‘home-style pool leaching’ by individuals and small groups operating ‘off the grid’ (having received no inspections or permits) has become rife in Jiangxi and the other southern provinces:
21 Chinese Statesman – Deng Xiaoping (1992). 22 Much of the knowledge and theories in this section have been sourced from the excellent Master of Arts thesis by Gregory J. Bryant (March 2015): Examining perspectives on China’s near-monopoly of rare earths.
AIM Chaos is the research branch of a private investment vehicle named Sons of Ulster. Investment ideas
shared are neither solicitations to buy nor offers to sell securities to 3rd parties.
Rare Earth Elements: Time to Invest? 07 July 2017
Page 31 of 40
“It is reported that a country farmer in Jiangxi with a limited understanding of science can easily become a “rare earths elements producer”. All he/she needs to do is shovel a truckload full of rare-earth-rich soil, mix in high quality fertilizer, and submerge the mixture evenly in a backyard leaching pool.”23 From negligible output to the world’s powerhouse for REE production China was able to establish a quasi-monopoly over the global REE industry in just two short decades primarily as a result of its comparatively low cost of mining and processing REEs. China’s REE operations – from mining to processing to downstream manufacturing – have lower cost bases than all other REE operations across the globe. This has ultimately enabled China to destroy international competition. We believe that there are five key reasons that gave China a competitive advantage, cost-wise, over its international rivals during the decades of its rise to power:
i) Reserve base As we have discussed, China holds 42% of the world’s REE reserves. This is obviously of fundamental importance, as it provides a base from which an industry can flourish. Perhaps less obvious however, which we feel is of equal importance, is the diversity of China’s REE reserves. It contains deposits made up of all four of the main sources of REES, namely the minerals bastnasite, monazite and xenotime, as well as ion-absorbing type rare earth clays. This diversity ensures access to both LREEs and HREEs.
ii) Government support In the early ‘80s, China’s government began actively driving the development of its nascent REE industry as part of its long-term plan to stimulate economic growth and technological advancement. Substantial subsidies were provided by the government to institutions to build a global-leading, vertically integrated “mines-to-magnet” REE industry, encompassing mining, processing, REE applications and REE trade.
iii) Cheap labour cost This point is particularly relevant to the last two decades of the twentieth century, when China was striving to monopolise the global REE industry. On a comparative basis (notably against the US, which in those decades controlled the largest REE operation in the world, Mountain Pass in California), labour cost in China was very low. As its industry was scaled up, this key advantage became all the more pertinent.
iv) Environmental (un)concerns In China’s bid to become the dominant REE player on the global stage, growth in output was far greater a priority than was protection of its ecological environment. As we explained on p.26, the environmental impacts caused by REE mining and processing are numerous and can potentially be catastrophic, if not implemented with every caution. In the 1980s, 1990s and 2000s, lax environmental regulation (and its enforcement) in China resulted in substantial cost savings for its REE operations, relative to operations abroad. These included significantly reduced sums for initial capex, ongoing opex and mine closure costs. In contrast to China’s disregard for environmental protection, the US (the previous industry leader) did strictly enforce environmental protection measures. Chemical
AIM Chaos is the research branch of a private investment vehicle named Sons of Ulster. Investment ideas
shared are neither solicitations to buy nor offers to sell securities to 3rd parties.
Rare Earth Elements: Time to Invest? 07 July 2017
Page 32 of 40
processing at Mountain Pass was stopped in 1998 after a series of wastewater leaks; and in 2002, the mine itself was closed, partially in response to environmental restrictions.
v) Illegal mining As we have explained, the production and processing of ion-absorbing type rare earth clays is straightforward, and easy to achieve without attracting notice. Accordingly, illegal mining of these REE-type deposits has flourished in the southern provinces. The process used, namely pool leaching, is destructive to the environment, but much cheaper than in-situ leaching practices used by the major industry players (that are environmentally regulated and thus require high-tech equipment / additional costs). It has been suggested that in the 1990s, when China was pushing for global supremacy by flooding the market with its cheaper REEs, a blind eye was turned by the authorities towards the numerous unpermitted producers plaguing the southern provinces. However, in recent years, the unregulated production has become as damaging to the nation’s (and the global) industry as it was once helpful.
In addition to cost advantage, there are two other points worthy of mention that we believe expedited China’s ascension to domination of the REE industry:
i) The Balance Problem: oversupply owing to nature of co-production Separating rare earth minerals into individual REEs is already a very difficult and complex process. Extracting individual REEs directly from the earth is, at this point in time, far beyond our technological capabilities. As such, REE mining and processing is a form of co-production. This leads to the necessity to mine and produce a surplus of certain less desired REEs for the sake of producing the required amount of the desired REEs. For example, at Lynas Corp’s Mt Weld operation in Western Australia, for every tonne of final NdPr product, it produces two further tonnes of other REES – the vast majority of which are the light rare earths, lanthanum and cerium. NdPr (especially the Nd) is in high demand owing to its use in permanent magnets: however, this is no such anticipation of a similar spurt in demand for lanthanum and cerium. This issue is referred to within the industry as “the Balance Problem”, and has been a key contributor to crushing REE prices in recent years (especially of the more abundant LREEs, lanthanum and cerium). Specifically with regard to China’s ascension to quasi-monopolist, this industry phenomenon essentially flooded the market with the more common REEs. The result was to drive RoW players out of business. China’s operations themselves only survived predominantly due to the receipt of hefty government subsidies.
ii) Other nations unwilling to develop resources due to potential hazards As China tightened its grip on the world’s REE industry, the RoW players quickly dropped out of the supply side. Whilst it could be claimed that the closing up of operations by these players was their only option (through bankruptcy!), one could also argue that only a relatively small number of upstream players fell victim (those involved in mining and beneficiation). Indeed, RoW players involved in downstream activities could now source REE concentrates directly from China (which had by the
AIM Chaos is the research branch of a private investment vehicle named Sons of Ulster. Investment ideas
shared are neither solicitations to buy nor offers to sell securities to 3rd parties.
Rare Earth Elements: Time to Invest? 07 July 2017
Page 33 of 40
late ‘90s dramatically ramped up exports of REEs) much more cheaply than they had previously sourced REE concentrates. In addition, it meant that integrated players no longer had to be involved in the dirty and dangerous world of REE mining and beneficiation.
2010: dispute with Japan leads to China demonstrating its dominance over REE supply
“Some have compared China to a one-nation OPEC for rare earths”24 Although it had been the case for a decade or so, the mass media only seriously picked up on China’s position as quasi-monopolist of the REE industry in 2010, following a minor dispute between Japan and China that escalated rapidly. In September 2010, a Chinese fishing trawler collided with two Japanese Coast Guard (‘JCG’) vessels in the vicinity of the disputed Senkaku/Diaoyu Islands (the sovereignty of the islands has been disputed hotly by the two nations for many years). It was reported that the fishing trawler had been found 12km outside of the agreed area for Chinese fishing, but fled the scene when ordered to stop for inspection by the JCG. During its flight the collision occurred. The captain of the trawler was arrested and detained. In response to the detention, China unofficially banned exports of REEs to Japan, one of the world’s largest consumers of the metals owing to its electronic applications industry, “by slowing down administrative procedures in ports in Shanghai and Guangzhou to prevent materials being loaded on ships”.25 The response was that REE prices – having already risen considerably in 2010 prior to the incident – continue to rise dramatically: by the end of 2010, they had experienced price increases of more than four-fold. Prices continued to increase into 2011, spiking to all-time highs in June. With China cutting export quotas on multiple occasions throughout 2009, 2010 and 2011, other nations that had hitherto relied on a secure supply of REEs from China quickly turned to sourcing ex-China REE deposits in order to reduce their dependence on the now very apparent industry monopolist. 2010 to 2015: the short lived REE bubble bursts in spectacular fashion Owing to China’s actions in the international marketspace, 2009 to 2011 witnessed the founding of literally hundreds of REE-focussed exploration companies. Many of these listed on public markets (predominantly in Australia and Canada): investment into them stretched into the billions of dollars. Yet the full extent of China’s pricing power appeared not to have been fully appreciated by these industry newcomers. China’s competitive advantage in its cost base, coupled with the Balance Problem, ensured that the vast majority of the Western World’s exploration start-ups disappeared within a handful of years after being founded. Ironically, the RoW powers themselves put the final nail in the coffin of major scale, RoW-owned REE exploration, development and production. This nail came in the form of the so-called Rare Earths Trade Dispute: in short, the dispute was between China on one side and the US, the EU and Japan on the other, and concerned China’s export restrictions on REEs. The US, the EU and Japan brought a case to the World Trade Organisation’s (‘WTO’) Dispute Settlement Body against
24 US Senator from Alaska – Lisa Murkowski (September 2010). 25 The Telegraph (September 2010): China blocked exports of rare earth metals to Japan, traders claim.
AIM Chaos is the research branch of a private investment vehicle named Sons of Ulster. Investment ideas
shared are neither solicitations to buy nor offers to sell securities to 3rd parties.
Rare Earth Elements: Time to Invest? 07 July 2017
Page 34 of 40
China’s REE export restrictions, arguing that the restrictions were in breach of the accession treaty that China had signed when it joined the WTO in 2001. [The treaty disallowed export duties and quotas, except for goods specifically listed – and REEs were not listed.] The Dispute Settlement Body ruled against China, as although WTO regulations allow countries to impose export duties and quotas for reasons of conservation, in actually mining its REE resources but not exporting it China was giving its domestic firms preferential access. The 2014 ruling came into effect from 2015: at this point, the US, Japan and the EU could be confident that a secure supply of REEs would be readily available from China. Accordingly, the burning necessity that nations believed existed to secure ex-China REE sources evaporated overnight. The lifting of Chinese export quotas drove REE prices to multi-year lows as 2015 came to a close. The only major RoW REE operation that was in production in the 2000s was Mountain Pass in the US. However, such was the cost advantage that China enjoyed over the RoW that the owner of the mine was forced to close it in 2002. During the 2009-2011 REE bubble, a new owner attempted to revive the mine via an IPO on the New York Stock Exchange in 2010. However, the company was forced to file for bankruptcy by mid-2015. Now only one major RoW primary producer is in operation: Lynas Corp’s Mt Weld mine. A new era for China’s REE industry: striving to protect both reserves and monopoly Having established a quasi-monopoly over the world’s REE industry, China now has to contend with two major concerns – concerns that only seemed of minor importance during its ascension to global dominance:
i) Continued illegal mining Having contributed significantly to China’s rise to dominance of the world’s REE industry, the illegal producers (primarily situated in the nation’s southern provinces) have now become a bane on not just China’s but the entire world’s REE industry. Unlawful output – which as we have explained enjoys very cheap operating costs, and furthermore is not subject to tax or tariffs – has served to decimate REE prices, most notably in the past several years, as legitimate producers have scrambled to lower their prices in order to retain customers. [Although REEs produced illegally are of inferior quality due to lack of advanced equipment, they usually sell at around a 20% to 30% discount to the price of the legitimate product.]
ii) Depletion of reserves The aggressive over-mining of REEs in China since the 1980s (both legal and illegal) has caused a rapid depletion of China’s REE reserve base. At the nation’s REE crown jewel, Bayan Obo in Inner Mongolia, the most recent estimates put total mine reserves at only one third of the original amount. The HREE-containing ion-absorbing type rare earth clay deposits in the southern provinces have been even more severely depleted, with illegal production rife there. Some industry insiders believe that this particular supply could be exhausted within just two decades.
AIM Chaos is the research branch of a private investment vehicle named Sons of Ulster. Investment ideas
shared are neither solicitations to buy nor offers to sell securities to 3rd parties.
Rare Earth Elements: Time to Invest? 07 July 2017
Page 35 of 40
To combat these two major concerns, China is in the process of implementing three major programmes:
i) Consolidating REE operations and enforcing production quotas In early 2015, China’s Ministry of Industry and Information Technology (‘MIIT’) issued guidelines for the formation of large state-owned enterprises (‘SOE’) for REE mining, smelting and separating operations throughout China. The six SEOs are: - China Aluminum Group - Northern Rare Earth - Southern Rare Earth - China Minmetals Corporation - Guangdong Rare Earth - Xiamen Tungsten
The rationale for establishing the six SEOs is essentially to consolidate and in doing so refine the nation’s industry: to keep close records of, and impose limits on, production quotas and export quotas; to ensure best practise is employed throughout the supply chain; to improve margins via vertical integration; and finally, to assist in the stamping out of illegal production.
ii) Cracking down on illegal mining By consolidating all REE-based operations under six roofs, the government’s task of policing China’s REE operations is drastically simplified. To assist further, the SEOs are in the process of establishing a REE product tracking system. Moreover, in December 2016 the government announced a five-month crackdown against illegal activities in China’s REE industry. The investigation was nationwide, and by May this year had covered 415 enterprises across 23 provinces. It is believed be to the longest and strictest crackdown in the industry’s history. In May, it was announced that three people had been detained for illegal mining. According to one report, “If a company is found to be illegally mining material, it can be added to a black list, affecting its ability to secure credit. The clampdown has seen the Chinese media encouraged to expose any illegal activities, with individuals promised rewards if they expose illegal activity.”26
iii) State stockpiling In 2017, the State Reserve Bureau intends to purchase 15.5kt of certain REEs from the six SEOs for the purpose of stockpiling them. Additionally, the six SEOs themselves are to stockpile 5kt combined at government-designated warehouses.
As we examine in the next chapter, after continuing to slide even further throughout 2016, REE prices have been in a phase of recovery since late last year. It is therefore evident that the initiatives that China has set in motion are having their desired effect: illegal production in China is being slowly but steadily curtailed, which is resulting in prices rebounding to levels at which legitimate businesses can actually operate profitably (sans government handouts) once more.
26 Industrial Metals: McCormick, M; Perks, C (February 2017): A turning point for rare earths?
AIM Chaos is the research branch of a private investment vehicle named Sons of Ulster. Investment ideas
shared are neither solicitations to buy nor offers to sell securities to 3rd parties.
Rare Earth Elements: Time to Invest? 07 July 2017
Page 36 of 40
Conclusion: what is next for the REE market?
“Don’t be dismayed to see the Chinese invest in overseas projects for pennies on the dollar to take
advantage of the next upturn”27 Introduction In this report we have examined the supply and demand dynamics of the global REE industry, and the fundamental role that China plays in it. Taking all of the information into account, it should be apparent to the reader that there is a significant supply / demand imbalance looming over the industry. China is not only limiting its production, but is in fact cutting illegal operations. The RoW has no new projects of significance realistically coming online within the next two years. Meanwhile, global demand for REEs is set to increase dramatically over the coming decades, catalysed by the surge in adoption of renewable energy technologies. The obvious solution is for both China and the RoW to start aggressively investing in or acquiring ex-China REE sources. For both, there are commercial, political and economic reasons alike for doing so. There are already examples of this occurring over the past 18 months. This brings us neatly to the crux of the thesis of this report: namely, that investors should be positioning themselves for the impending recovery in the rare earth sector by investing in late stage REE projects. In our opinion, this would be best achieved by investing in deposits that crucially are rich in MREEs and/or HREEs. China is curbing production, but RoW is bringing nothing online in the near term… This is the third year running that China is limiting its (official) REE production at 105kt. Furthermore, the price action of REEs over the past seven months would suggest that the crackdown on illegal REE production is enjoying some success. Illegal production was circa 44,000 tonnes in 2016: if even half of that figure were to be eradicated, that would wipe circa 13% off of current global supply. Assuming China’s six SEOs do not suddenly decide to increase their combined quotas for 2017, then the only operation in the world that will be upping its output in CY 2017 is Lynas Corp’s Mt Weld mine (from circa 14kt to close to 20kt). Even accounting for this ramp up in output, the net effect would be a decline in global production year-on-year of almost 10%. One would expect industry players and investors alike to be scrambling to acquire REE deposits outside of China. Whilst there have been some deals in the past 18 months (predominantly involving Chinese investors or acquirers), development across the RoW’s leading REE projects has been sluggish: this is due to the severely depressed prices that were experienced throughout 2015 and 2016 that would have made even the lowest opex project uneconomical. However, now that China is at last effectively tackling its domestic issues of illegal production, the playing field for RoW REE producers is becoming (comparatively) fairer, and we expect investment in ex-China REE projects to increase considerably going forward. Nevertheless, it will still take at least two years in reality bring the most advanced of these projects into production.
27 President of Mining Development Corp – Jeb Handwerger (August 2015).
AIM Chaos is the research branch of a private investment vehicle named Sons of Ulster. Investment ideas
shared are neither solicitations to buy nor offers to sell securities to 3rd parties.
Rare Earth Elements: Time to Invest? 07 July 2017
Page 37 of 40
…Meanwhile, demand is increasing, driven by renewable energy technologies The key catalyst for growth in global demand for REEs stems from permanent magnets, and specifically their usage in two of the world’s most important renewable energy technologies developed to date – wind turbines and electric vehicles. We have demonstrated in this report the effect that rapid global adoption of these two technologies could have on demand for neodymium and praseodymium, as well as for terbium and dysprosium. Were our own very conservative forecasts to be met, there would have to be multiple new REE mine openings per annum going forward, simply to meet this demand. One answer to combat the impending market imbalance (especially for NdPr) is to find a substitution for the various REEs. Tesla for example has proved that it can manufacture EVs without NdFeB magnets. However, at this point in time the utilisation of NdFeB magnets are the most economically efficient application for EV traction motors, as every other EV manufacturer besides Tesla testifies to via their usage of them in their EV models. Similarly, whilst there are a number of options for drive configurations for turbine manufacturers, it is evident that were REEs readily available at competitive prices to all, the PMSG system would likely be most popular owing to its simplicity and low maintenance requirements. In short, it seems very unlikely that superior substitutions for NdPr magnets, and vitally at cost competitive levels for mass production, will be found for EVs and wind turbines in the next several years at least. REE prices have begun to react to supply/demand imbalance over past seven months… As a result of the supply squeeze brought about by China’s recent initiatives, coupled with the increase in demand from renewable energy technologies, NdPr prices have enjoyed a circa 32% uplift since November 2016.28 With no new RoW projects coming online within 24 months, and demand seemingly set to increase drastically, REE prices look set to continue their upward trajectory over the next two to three years at the least. China and RoW are now intent on seeking high quality, ex-China REE sources… In its present situation, China is facing a dilemma: to protect its domestic reserves (particularly the much depleted HREE reserves in the southern provinces)? Or to protect its monopoly by flooding the market with cheaper output, smashing global prices and consequently crushing RoW competitors? The obvious solution is, of course, to hit two birds with one stone by replenishing its reserves via the build-up of an asset base abroad, whilst maintaining its current production profile domestically. This has already begun to occur: in August last year, a subsidiary of Chinese coal producer Shandong Taizhong Energy Co. Ltd entered into a $30m equity funding agreement with Northern Minerals Ltd, owner of the Browns Range HREE project in Halls Creek, Western Australia. In September 2016, Chinese REE specialist Shenghe Resources Holding Ltd (‘Shenghe’) agreed to subscribe for a 12.5% equity stake in Greenland Minerals and Energy Ltd (‘GMEL’) for a consideration of $4.6m. GMEL is the owner of the Kvanefield REE project in southern Greenland.
AIM Chaos is the research branch of a private investment vehicle named Sons of Ulster. Investment ideas
shared are neither solicitations to buy nor offers to sell securities to 3rd parties.
Rare Earth Elements: Time to Invest? 07 July 2017
Page 38 of 40
More recently, in June this year, Shenghe (as part of a consortium that also consisted of two US financial institutions) outbid competitors in an auction to acquire the mothballed Mountain Pass mine in California, previously owned by Molycorp before the company went into bankruptcy. On the other hand, RoW institutions are also showing interest in REE projects. Japan in particular has been a strong backer of ex-China projects, ever since the 2010 REE trade dispute between China and Japan. Trading company Sojitz Corporation (‘Sojitz’) and Japanese government body JOGMEC are two leading creditors of Lynas Corp, having lent the company hundreds of millions of dollars to develop its Mt Weld mine. To date, they have been lenient in amending and extending debt terms in order to allow the only significant source of REE production outside of China to continue operating. Sojitz has also formed partnerships in Vietnam to explore REE opportunities in the country; whilst JOGMEC has done likewise in India. Another trading company, Sumitomo Corporation has previously partnered with JOGMEC to similarly investigate potential REE production in Kazakhstan from uranium mine tailings. The move by RoW players to gain secure supplies of REEs from outside of China seems economically sensible, in light of how China was able to shift global prices by many multiples in 2010/11, simply by flexing its muscles. It must also be noted that in a political sense – taking into account the variety of military applications that REEs are utilised in (see p.6) – the move also would appear not simply wise but of fundamental importance. After all, a secure supply of REEs is nowadays undisputedly essential to the national security of a nation. …Yet markets remain very cautious, having been savagely bitten once before Despite the mounting evidence of a supply/demand squeeze that is already underway, the investment community remains generally averse to listed REE exploration and development companies. We believe that there are two interlinked reasons for this: firstly, many investors fell victim to the bursting of the 2009-2011 REE bubble, which saw the vast majority of REE E&P plays completely wiped out. Such losses are difficult to forget. Secondly, it appears that having witnessed it occur in that first bubble-burst, the market retains the belief that China will suppress any future major rally in REE prices by simply increasing its national production quota and flooding the global market with the cheapest produce. This is a valid argument, and one worthy of consideration. After all, the six SEOs do have significant spare production capacity above the current government-imposed cap of 105kt pa. However, the thesis of this report – that ex-China REE resources will become increasingly sought after going forward – is founded upon the notion that for China, the preservation of its already much depleted domestic REE reserves is now the State’s number one priority. [It should also be added that in preventing further increases in REE production, a further increase in pollution is also being prevented. China is now in the process of tackling its much-documented national pollution crisis as vehemently as it is tackling illegal REE mining.] Yes, maintaining its near-monopoly over the global REE industry is of high import to the State, but as we have explained the obvious solution is to do so by increasing production abroad. To touch on this argument from the perspective of the RoW players: China will continue to hold a key competitive advantage over RoW players, namely cost of extraction (and this is likely to be held for the foreseeable future, until such time as the RoW players make a collective effort to invest substantially in all aspects of the REE chain). However, it is vital for investors to remember that cost alone doesn’t make up the entire picture for RoW players. Owing to the underlying
AIM Chaos is the research branch of a private investment vehicle named Sons of Ulster. Investment ideas
shared are neither solicitations to buy nor offers to sell securities to 3rd parties.
Rare Earth Elements: Time to Invest? 07 July 2017
Page 39 of 40
presence of global politics within the REE industry, it may be that with regard to the development of RoW deposits, security of supply is of primary importance, and cost of extraction – whilst important – is not the deciding factor when it comes to decision to mine. Conclusion: investors should be positioning for an impending recovery in the REE industry We stated our thesis at the beginning of this report: “The supply / demand dynamics of the global rare earth elements (‘REE’) industry are set to become imbalanced, owing to quasi-monopolist China curbing domestic production, and to the rapidly accelerating global adoption of renewable energy technologies that utilise REEs. We are of the opinion that the approaching market imbalance will ultimately be corrected by the fast-tracking into production of ex-China REE deposits. As such, we believe that investors should be positioning themselves for the impending recovery in the rare earth sector by investing in late stage REE projects that possess mineralisation geared towards renewable energy applications.” We have demonstrated that whilst global supply is unlikely to increase in the next 24 months (and indeed will probably decline), demand is set to increase. We have stated our reasoning as to why we believe China is unlikely to ramp up production significantly going forward, and also why we believe that both China and other nations will begin to seek in earnest for secure supplies of REEs located outside of China. For investors, there are a number of REE companies with quality deposits in terms of potential scale, grade and economic viability that we believe could attract the interest of Chinese and RoW players alike. In the past year alone, Chinese entities have taken equity stakes in three ex-China projects (in Australia, Greenland and the US). We feel that this trend is set to continue. Given the current constitution of the global REE industry, it is probable that potential investors from China will come in the form of REE-industry specialists, seeking to build up their reserves; whilst potential investors from the RoW will come in the form of financial institutions such as private equity houses, who have perceived the beginnings of a long-overdue recovery in the REE space. We believe that the ex-China REE projects that will be most in-demand will be the LREE deposits that host comparatively high percentages of neodymium and praseodymium (so as to minimise “the Balance Problem”; and HREE deposits. Projects that have already been extensively developed (at least to post pre-feasibility stage) will generally prove more appealing to potential investors or acquirers.
AIM Chaos is the research branch of a private investment vehicle named Sons of Ulster. Investment ideas
shared are neither solicitations to buy nor offers to sell securities to 3rd parties.
Rare Earth Elements: Time to Invest? 07 July 2017
Page 40 of 40
Disclosure
AIM Chaos is the research branch of a private investment vehicle named Sons of Ulster. It is responsible for generating investment ideas and subsequently monitoring held investments. The assembled information disseminated in this report is intended for internal use, and is neither a solicitation to buy nor an offer to sell securities to outside parties. All information collated and utilised in this report has been sourced from the public domain. AIM Chaos has no business relationship with any company referred to in this report, and has received no compensation from any party for writing this report. Sons of Ulster, which wholly owns AIM Chaos, does currently hold shares in Mkango Resources Ltd, a company referenced in this report. Consequently this report should not be regarded as independent research.
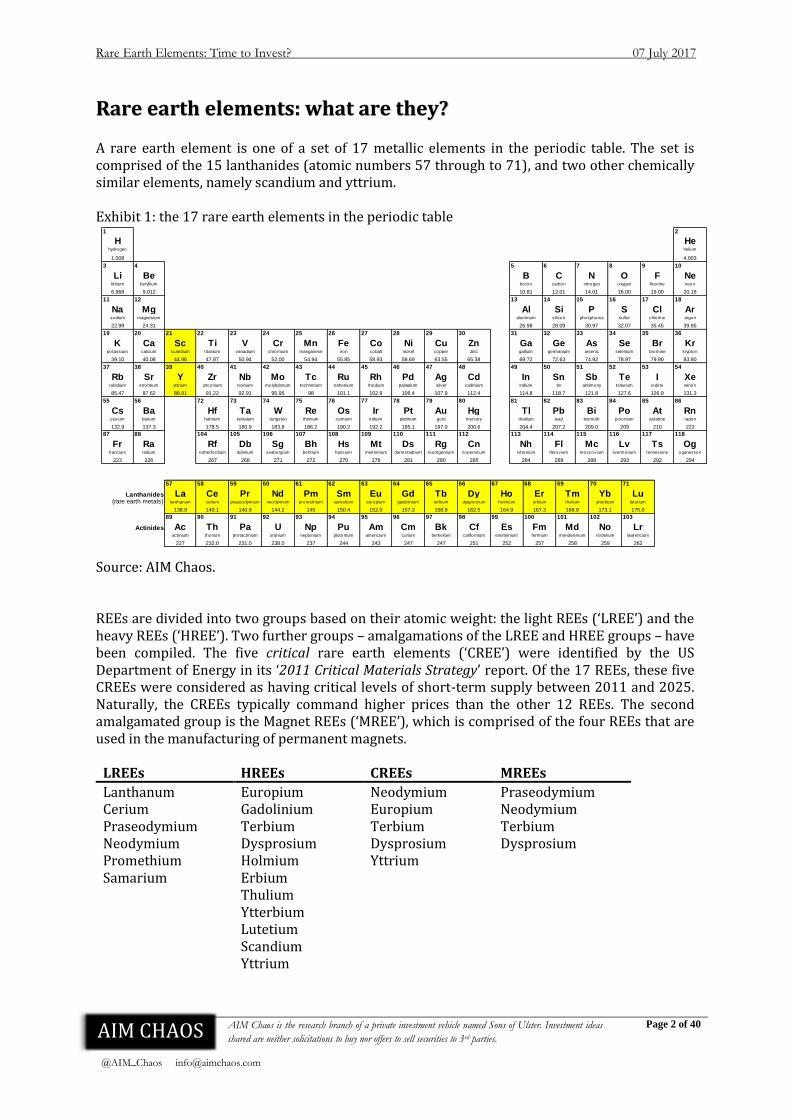
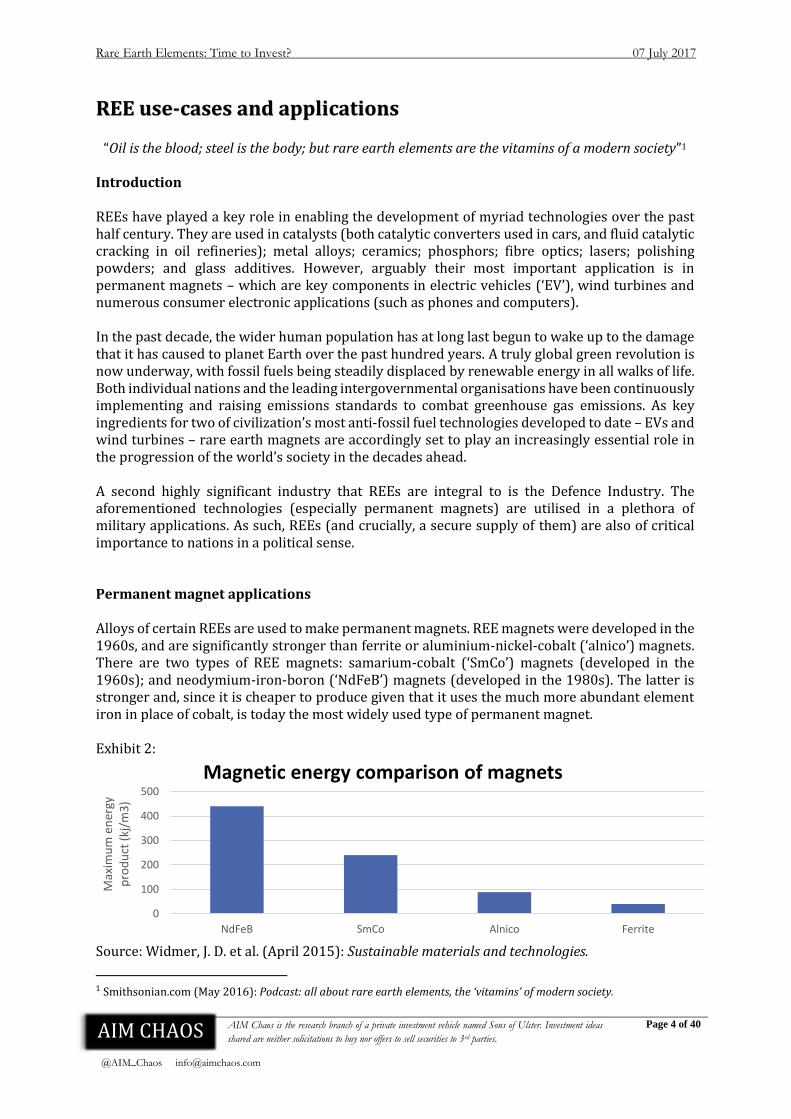
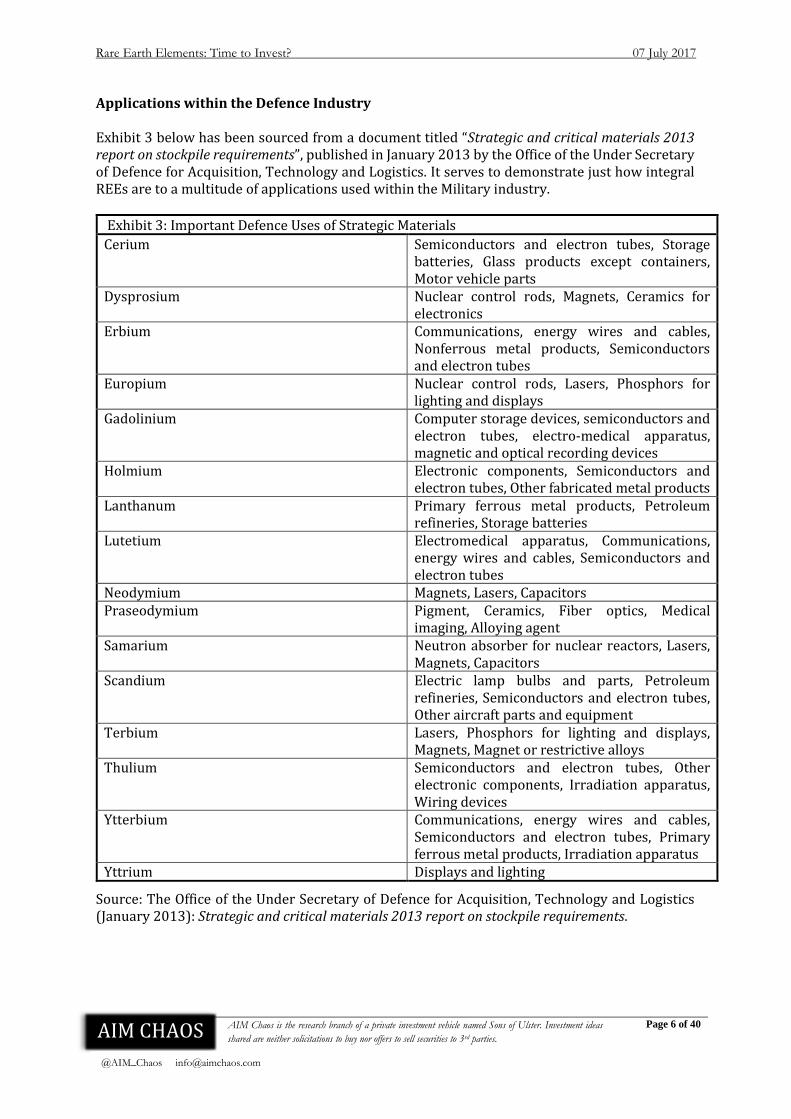
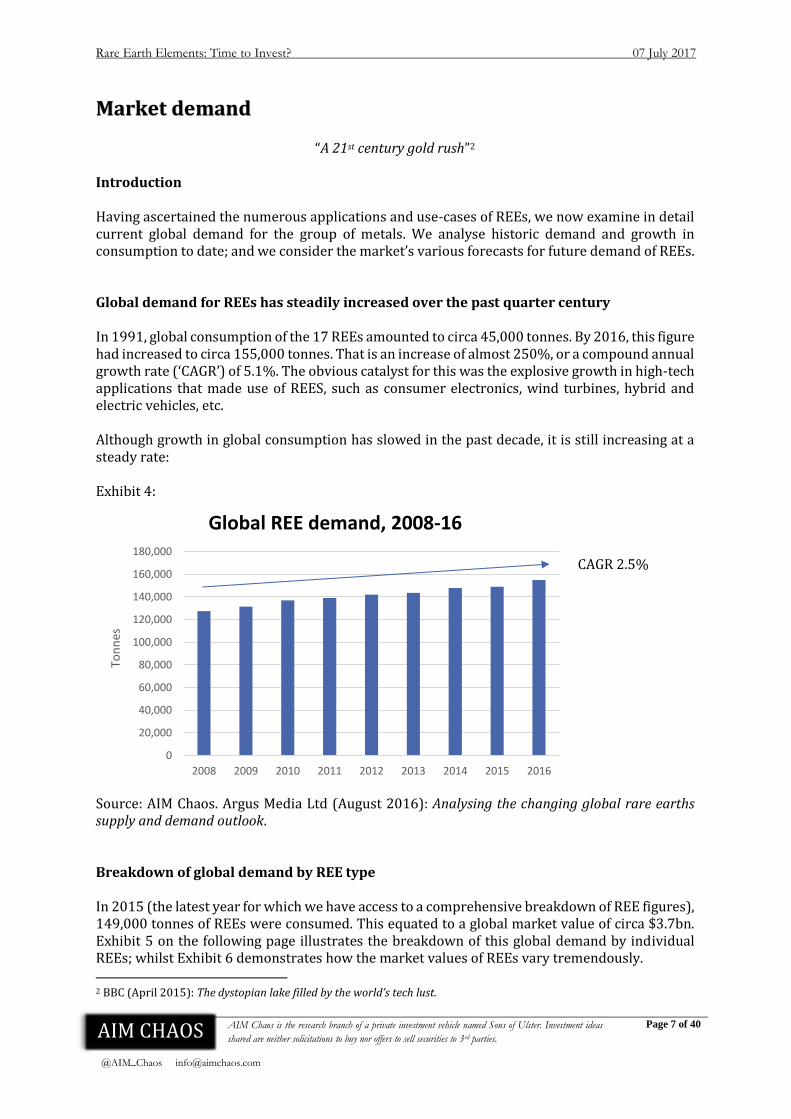
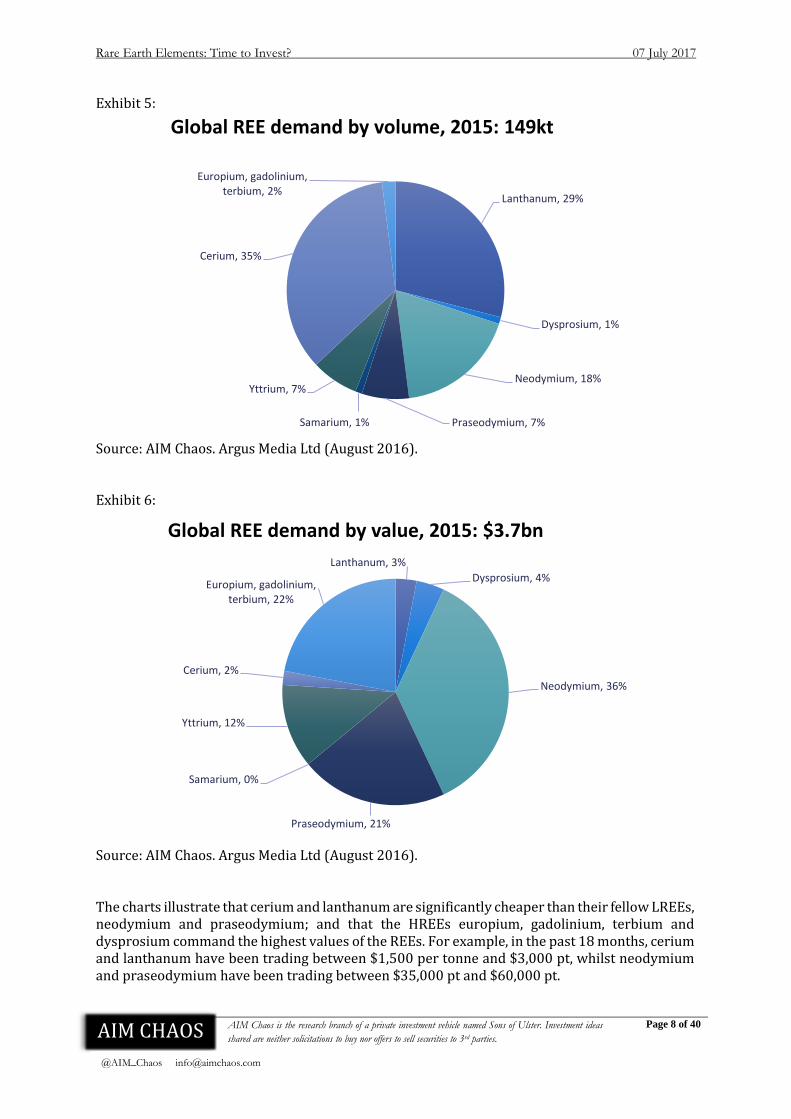
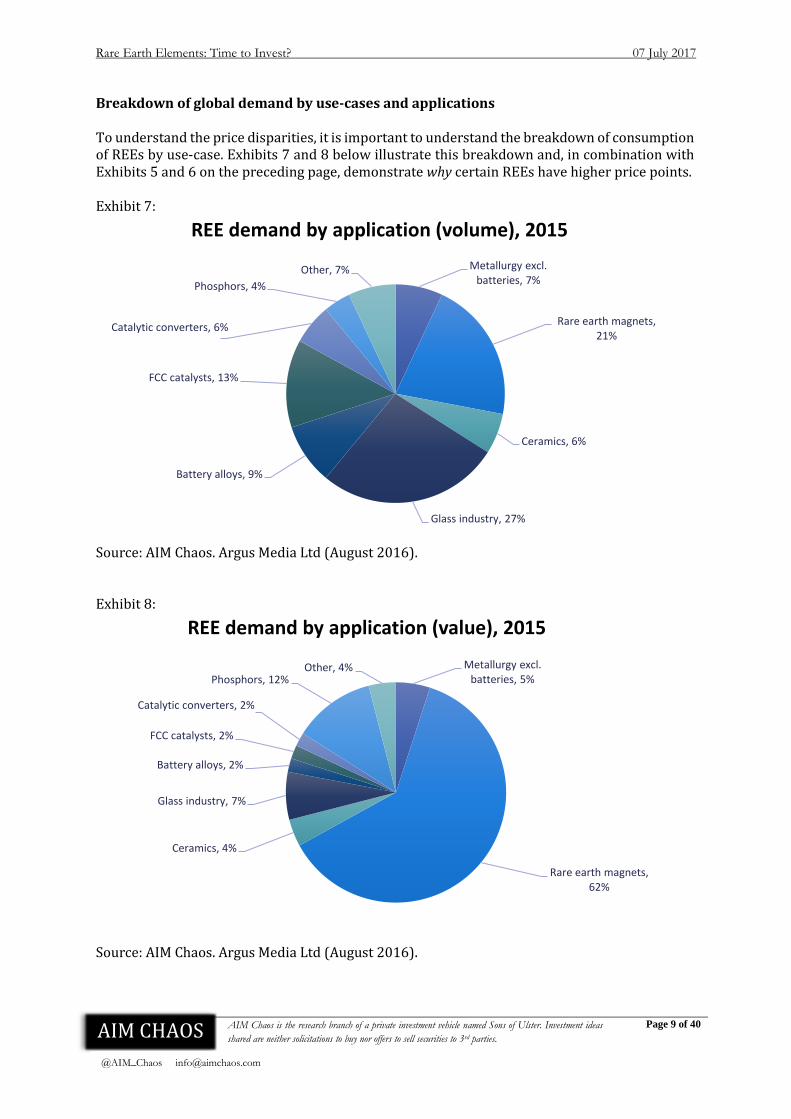
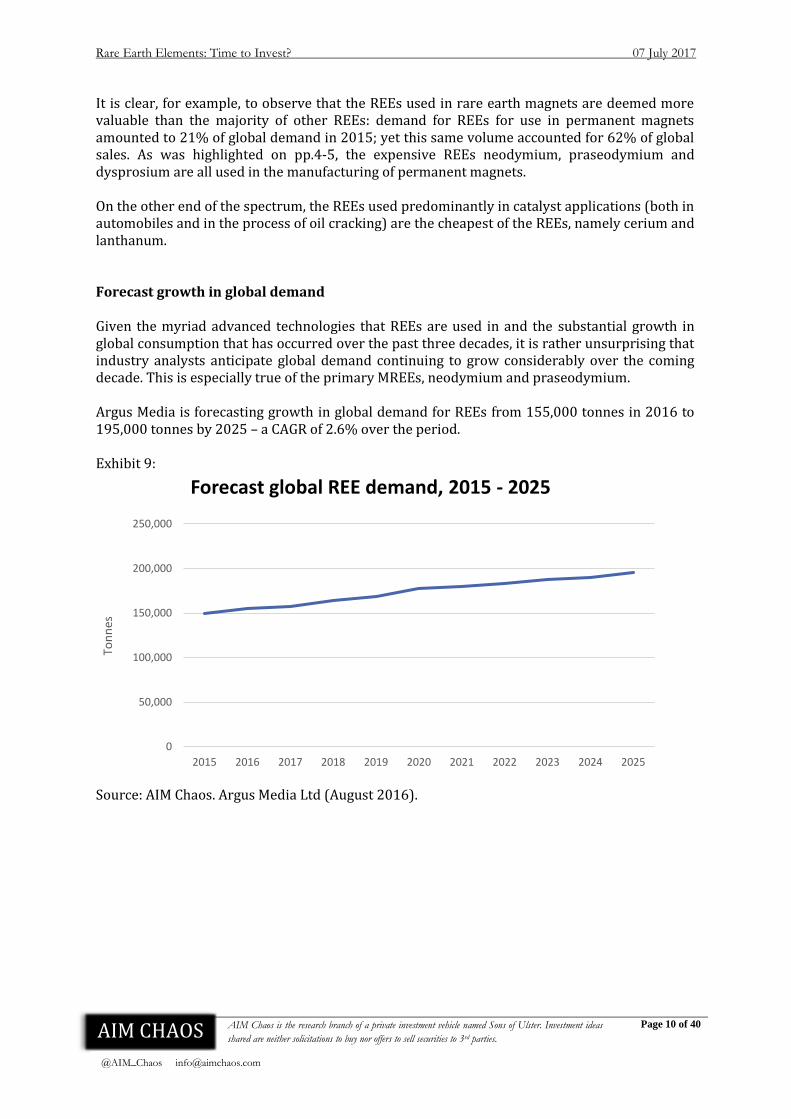
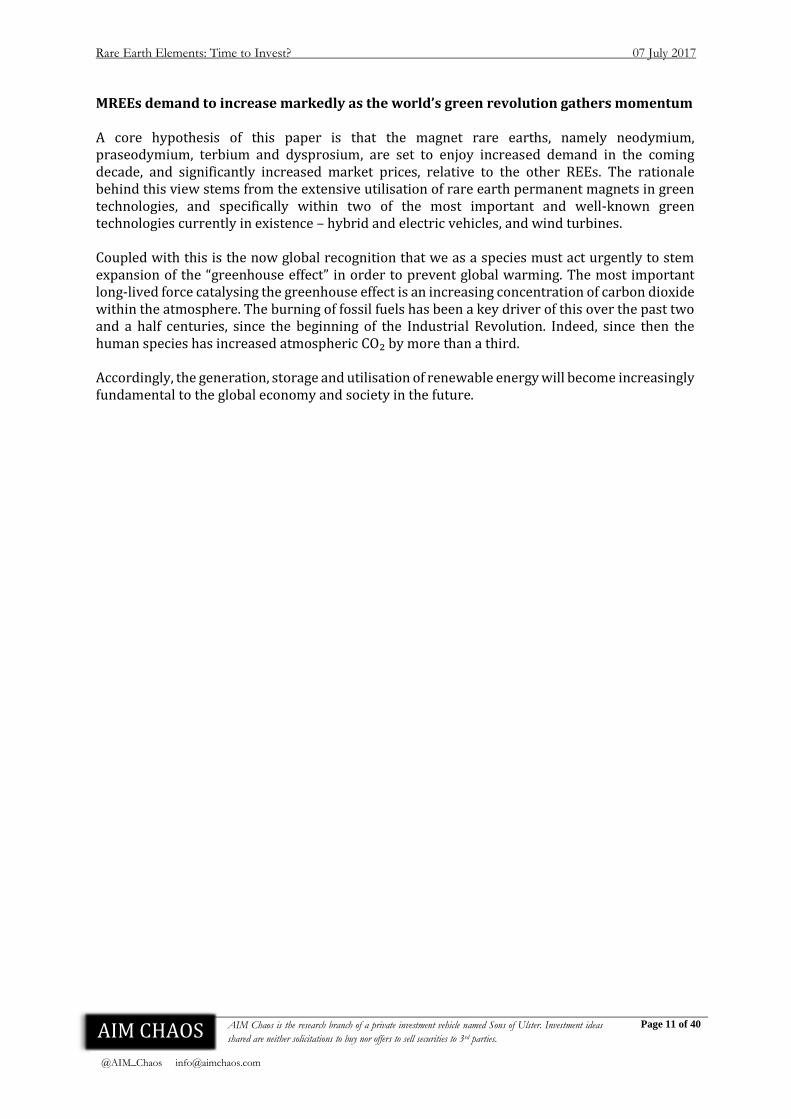
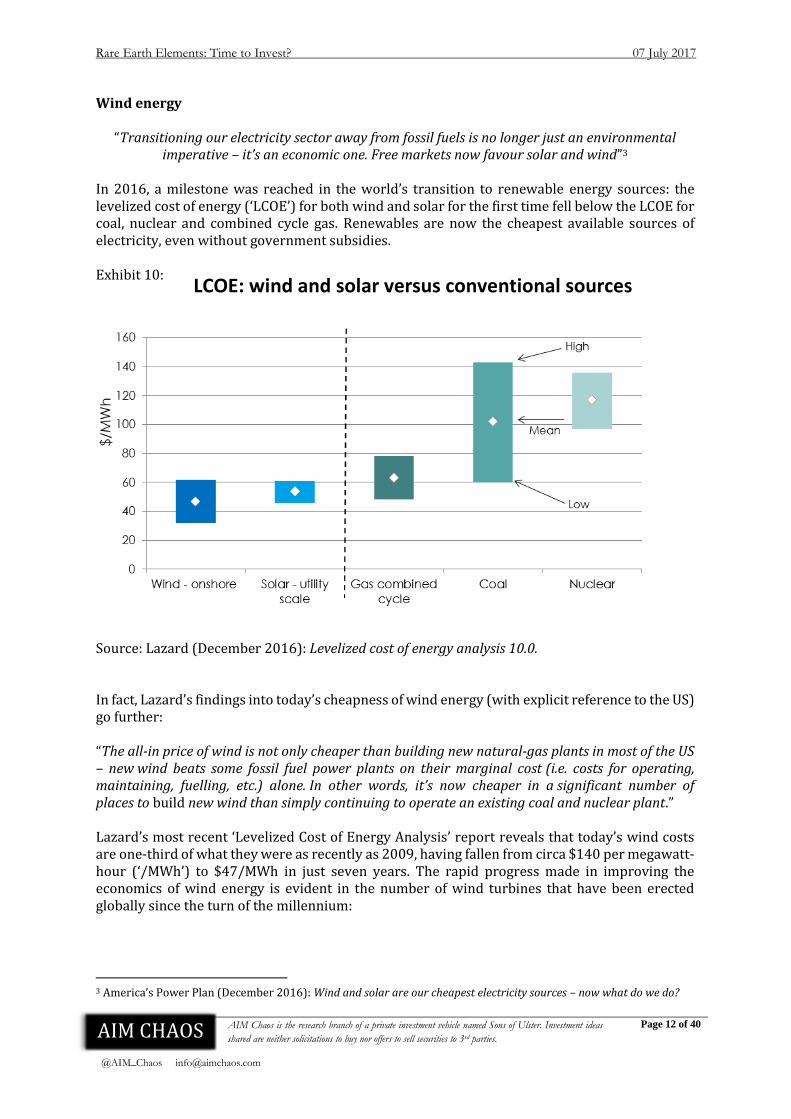
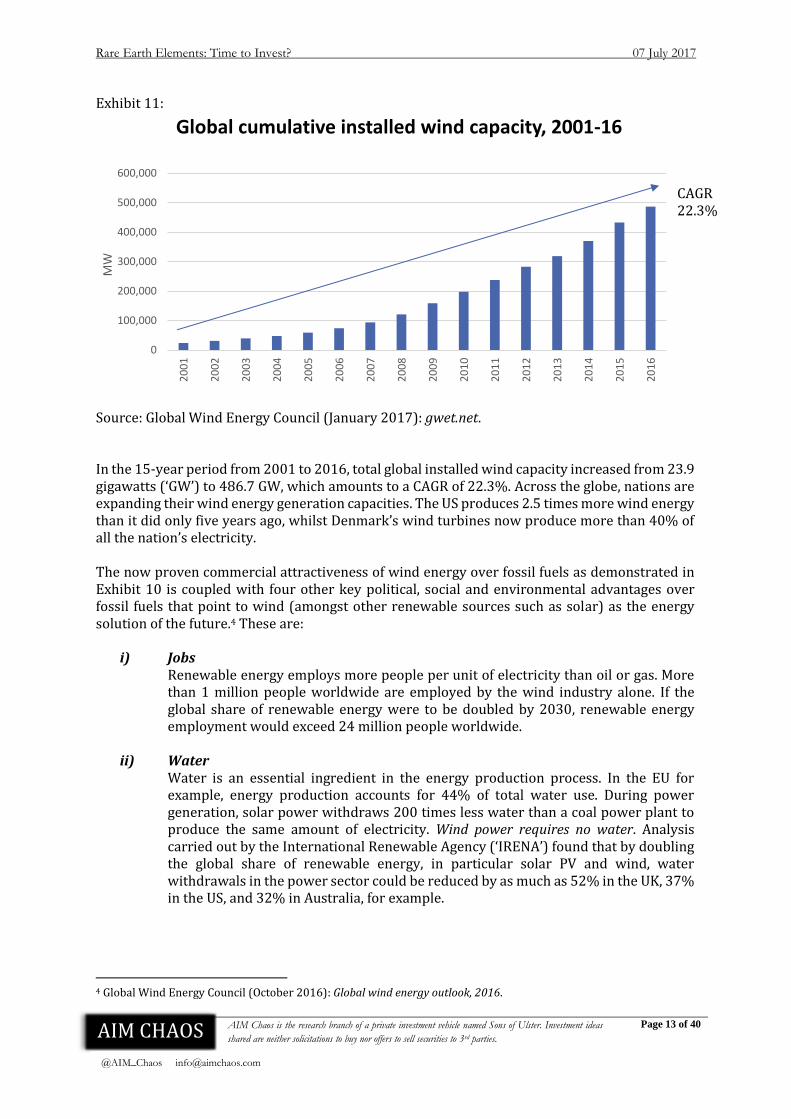
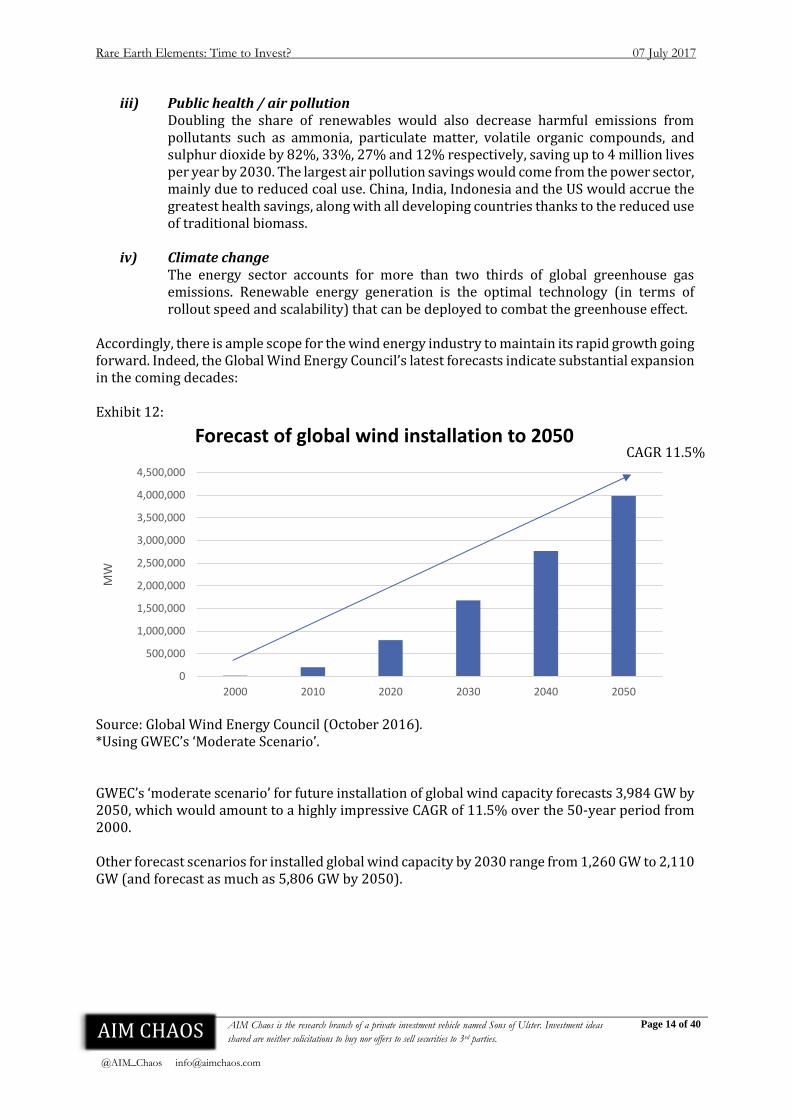
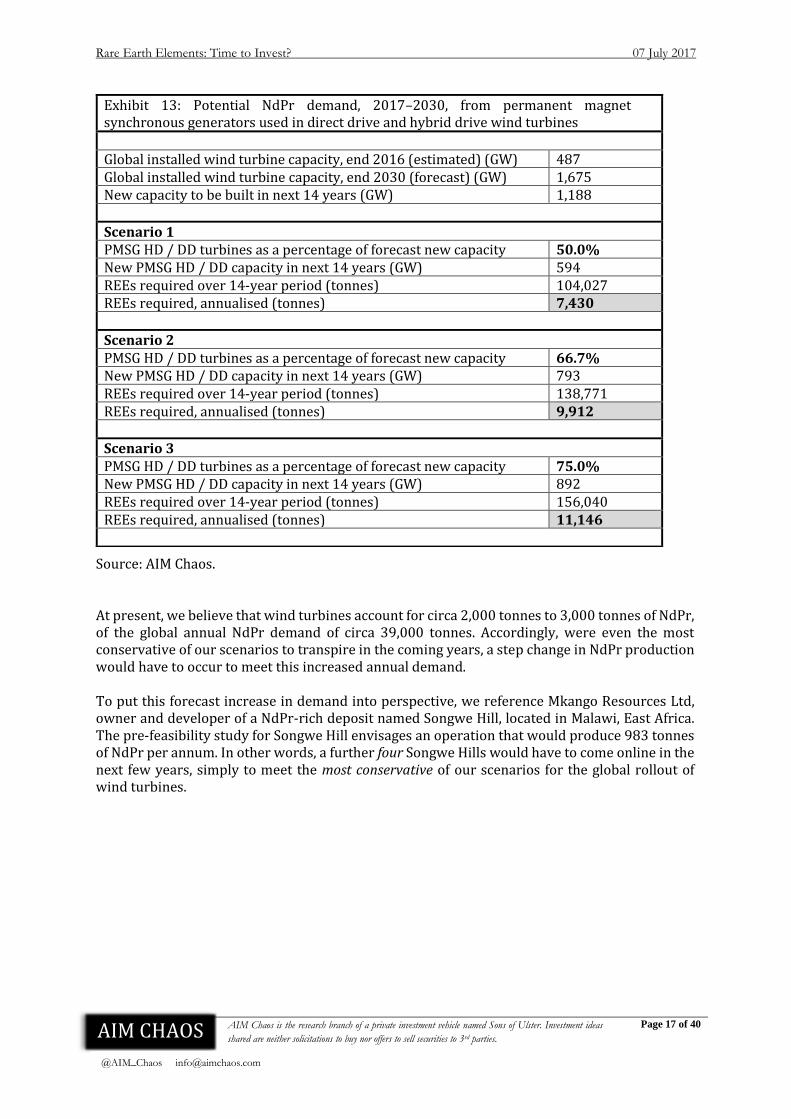
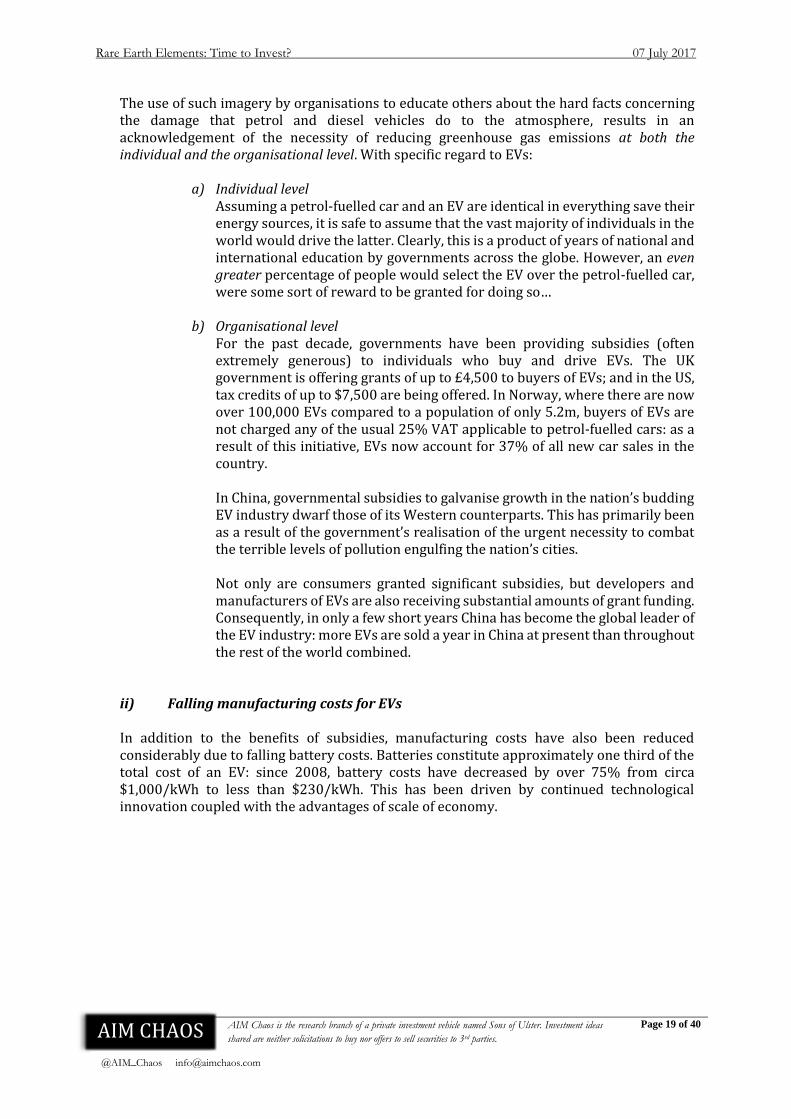
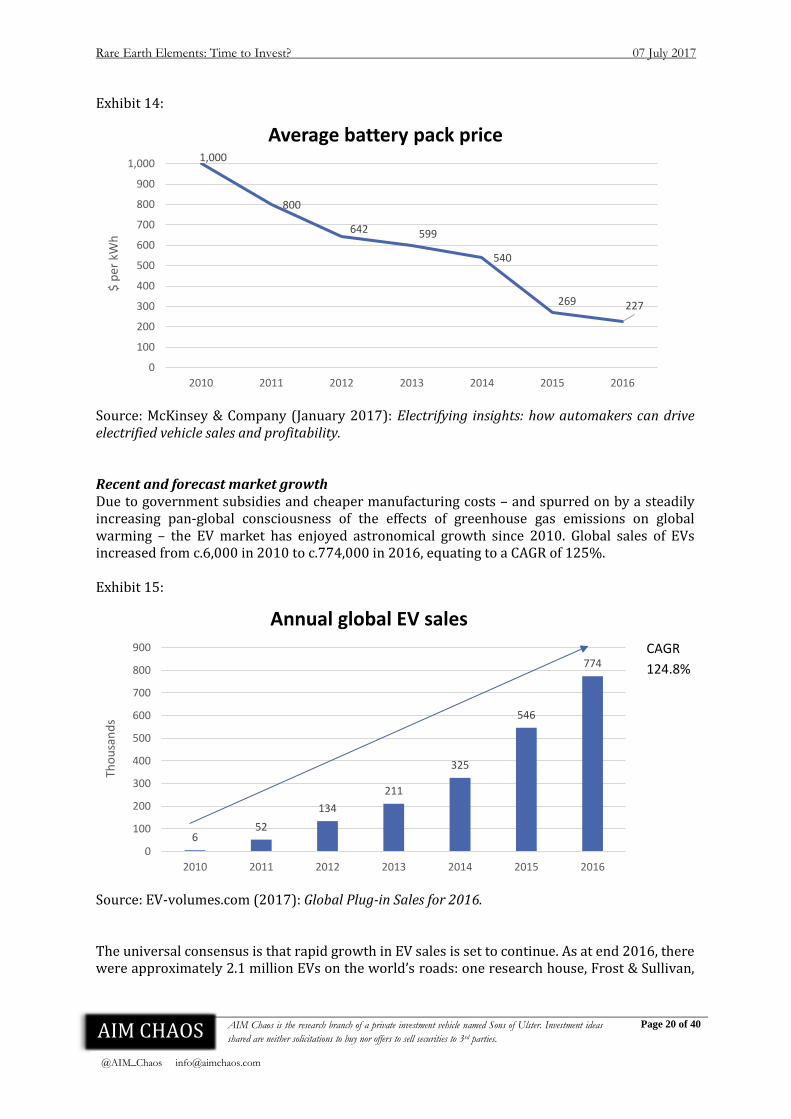
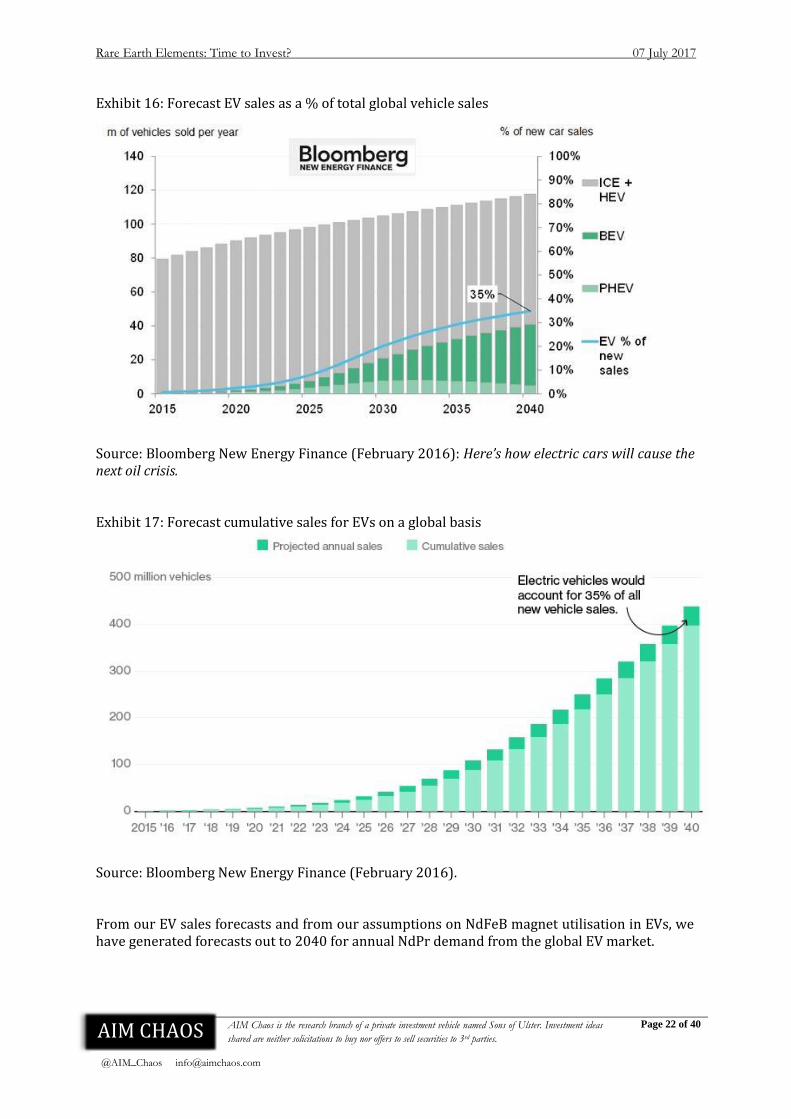
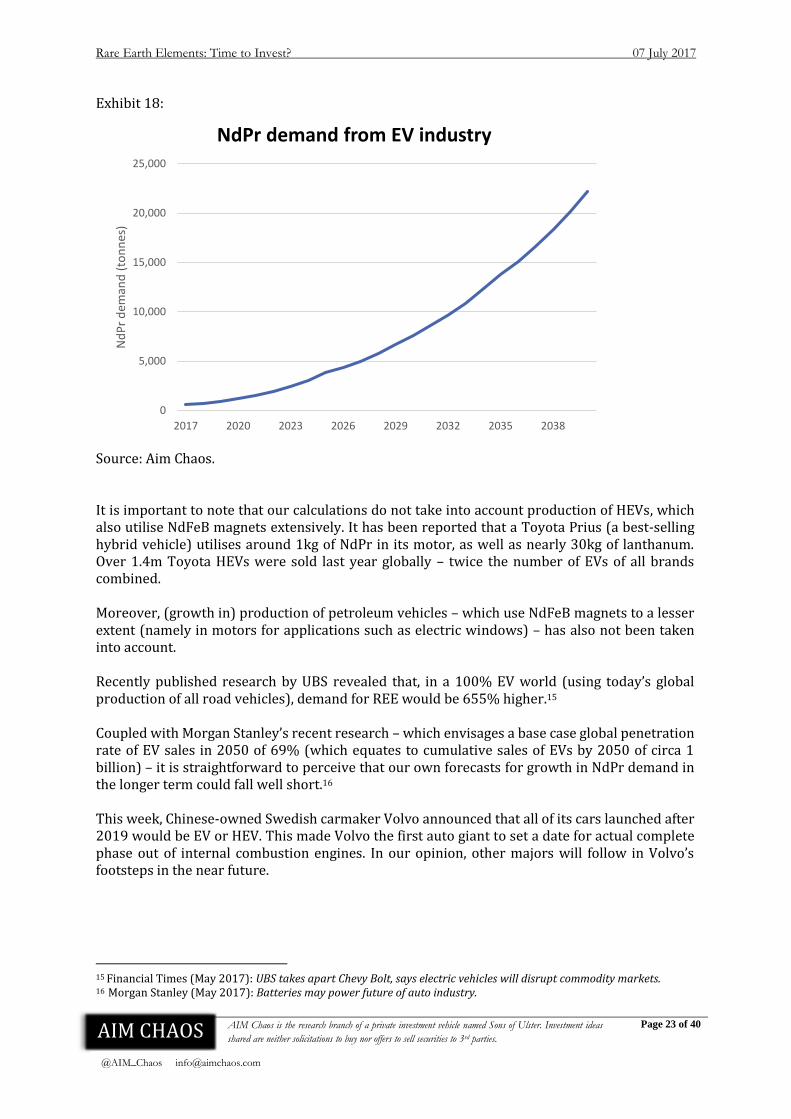
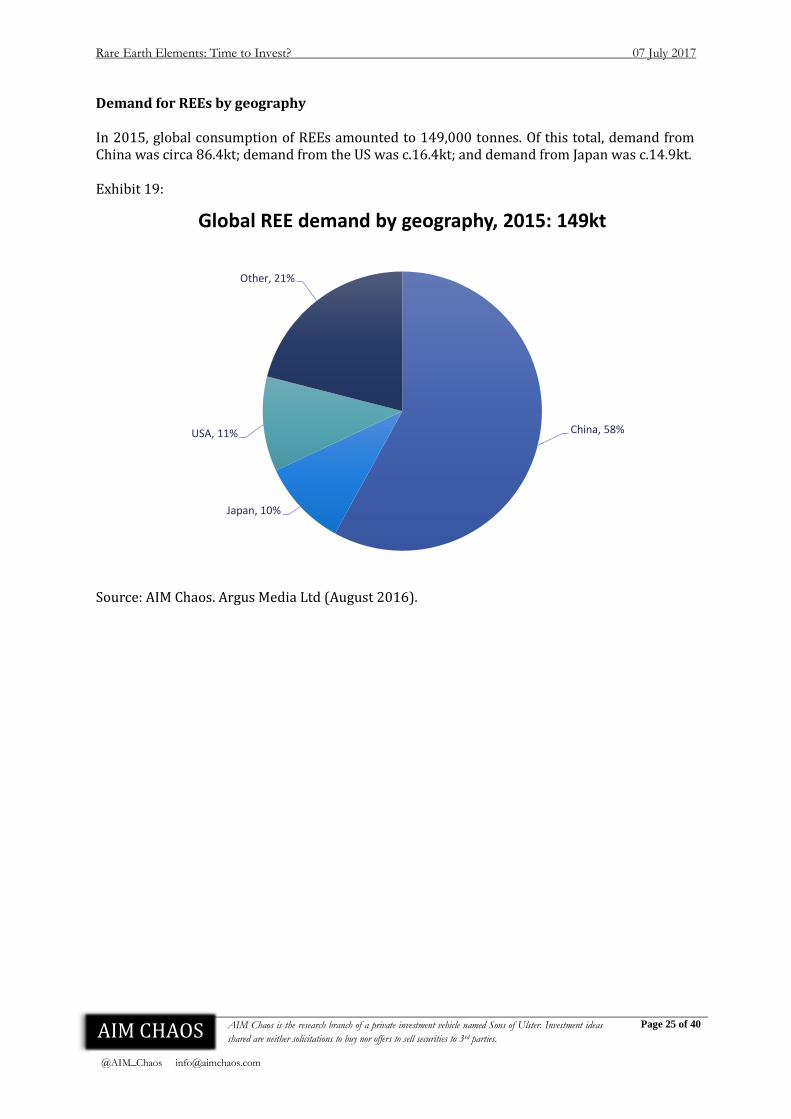
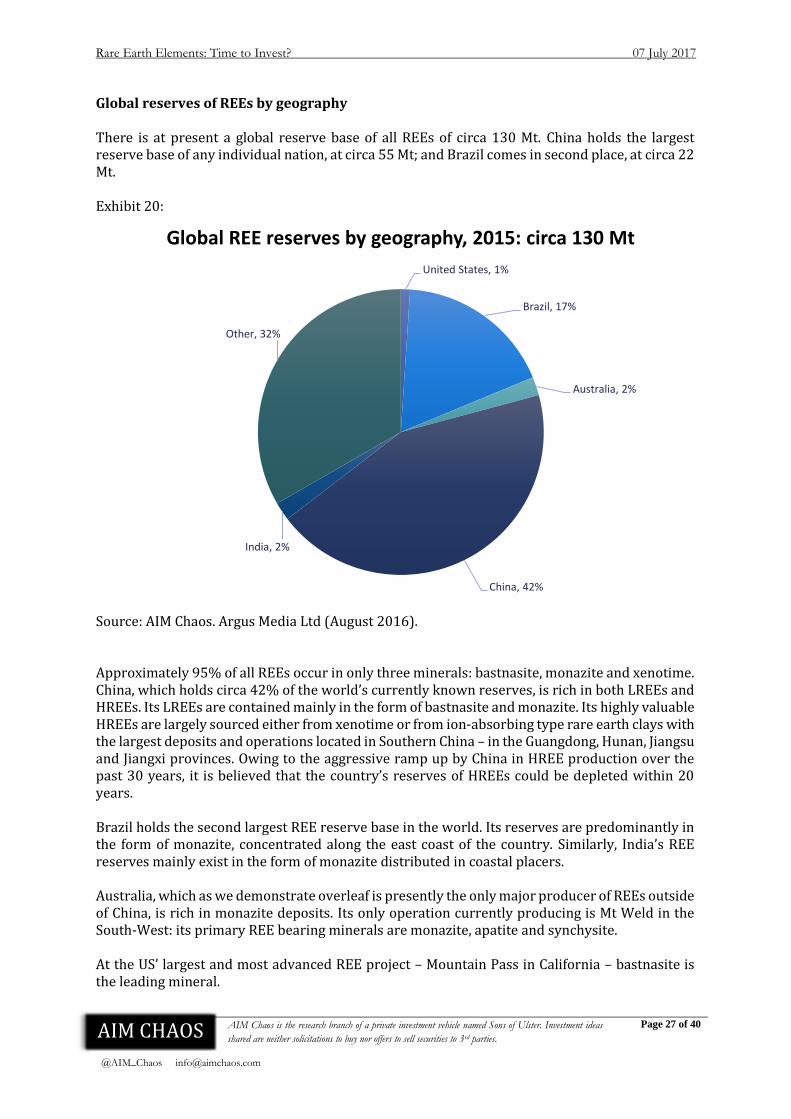
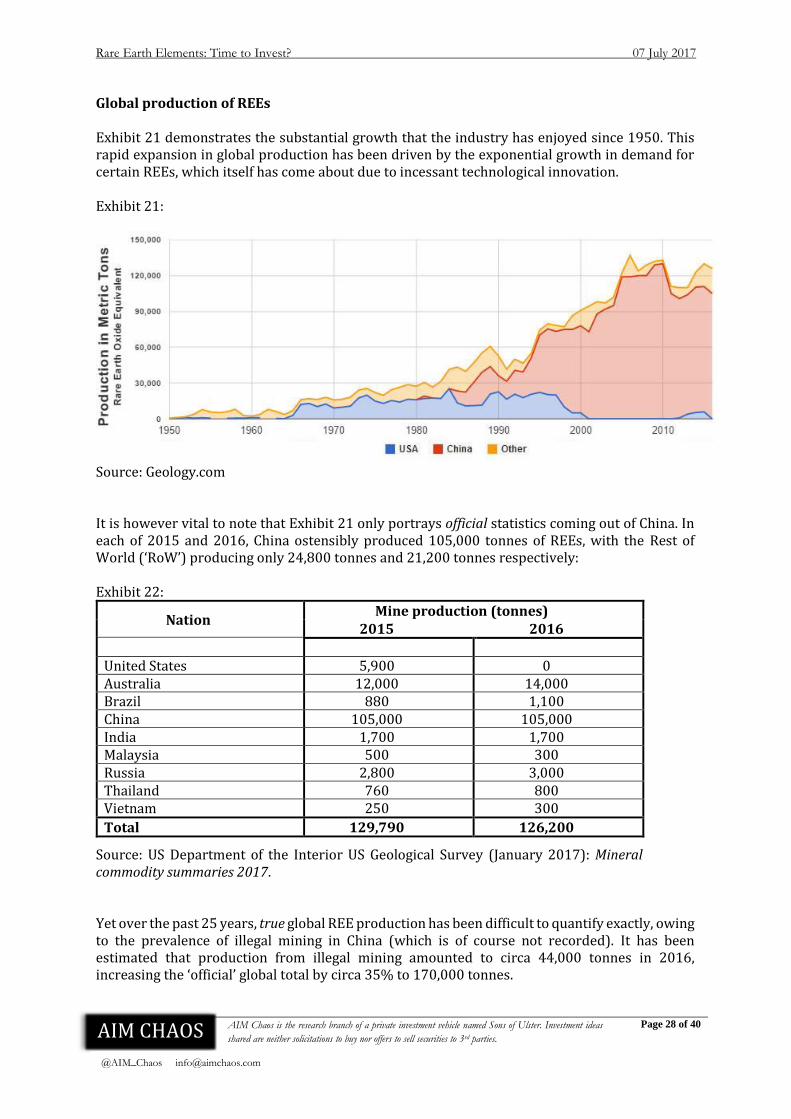
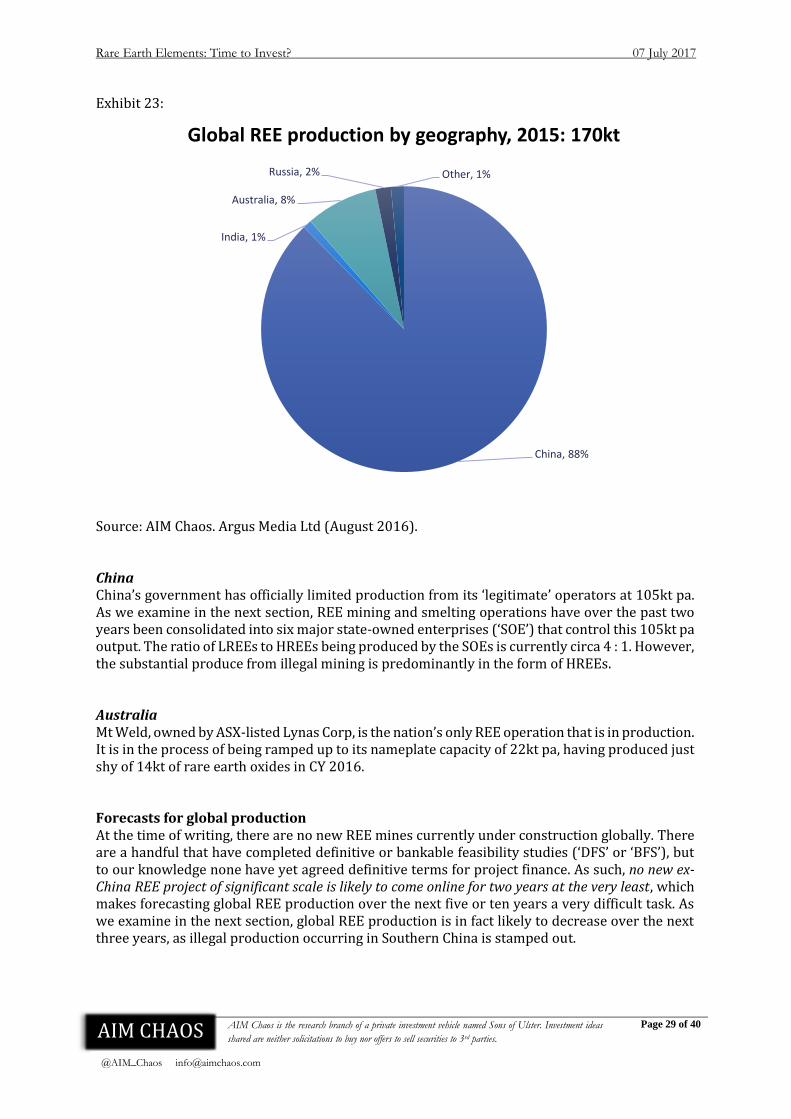


![Rare Earth Elements Truman Institute v[3]](https://static.documents.pub/doc/80x56/577cc4a61a28aba71199fba7/rare-earth-elements-truman-institute-v3.jpg)


