Rashid et al., 2:3http://dx.doi.org/10.4172/scientificreports699
Research Article Open Access
Open Access Scientific ReportsScientific Reports
Open Access
Volume 2 • Issue 3 • 2013
Keywords: Bay of Bengal; Ocean acidification; Mollusks; Oyster; Marine ecosystem
IntroductionBay of Bengal, the largest bay in the world, forms the northeastern
part of the Indian Ocean. Bangladesh is situated at the head of the Bay of Bengal, has 710 km long coast and 220 nautical mile maritime boundary appears a big marine resource of the country. Royal Society has run a study based on the impact of ocean acidification on the marine ecosystem in 2005. In this study they have shown the global pH level scenario of 1994, it was 7.95 in the Bay of Bengal. In addition, different discussion on ocean acidification has notified that the area may be highly threatened on ocean acidification. The report said that the pH level reduction rate may be around 0.08 per year which is very shocking news for the biodiversity of the Bay of Bengal Feely et al. [1] have shown a map on the global ocean acidification scenario of 2095 that the pH level of sea water in Bay of Bengal will be less than 8.0 in 2050 and bellow 7.8 in 2095. They also reported that the current pH of North Indian Ocean where Bay of Bengal is situated is 8.068 ± 0.03.
The Bay of Bengal is a reservoir of lot of marine species specially shells, coral reefs and many sea fish and mammals. The effect of ocean acidification on marine ecosystems and organisms that inhabit them has only recently been recognized and is of serious concern to scientists and policy makers involved in climate change, biodiversity and the marine environment. The goals of this study were to determine the current level of ocean acidification (OA) in the Bay of Bengal; to quantify the reduction rate of pH level of the Bay of Bengal compared with the values of 1994; and to quantify the shell and coral reef composition of the bay to compare with standard composition and to develop a conceptual model to study ocean acidification and its impact on marine ecosystem.
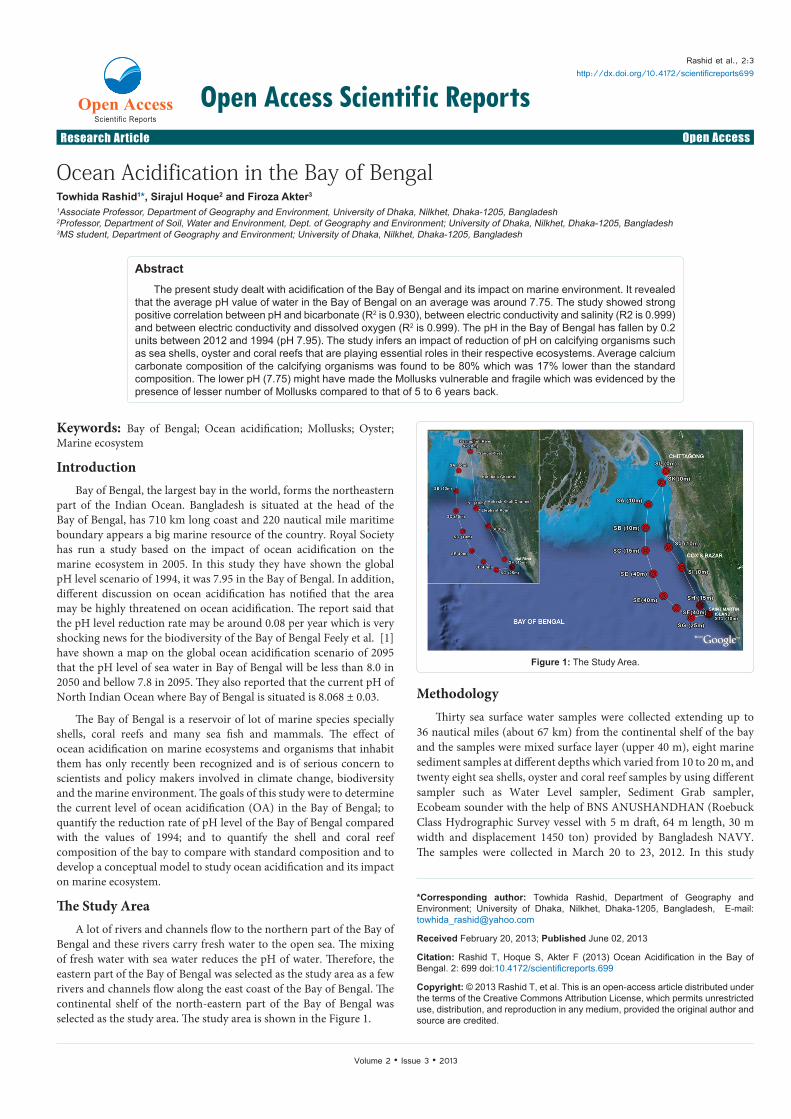
The Study AreaA lot of rivers and channels flow to the northern part of the Bay of
Bengal and these rivers carry fresh water to the open sea. The mixing of fresh water with sea water reduces the pH of water. Therefore, the eastern part of the Bay of Bengal was selected as the study area as a few rivers and channels flow along the east coast of the Bay of Bengal. The continental shelf of the north-eastern part of the Bay of Bengal was selected as the study area. The study area is shown in the Figure 1.
*Corresponding author: Towhida Rashid, Department of Geography and Environment; University of Dhaka, Nilkhet, Dhaka-1205, Bangladesh, E-mail: [email protected]
Received February 20, 2013; Published June 02, 2013
Citation: Rashid T, Hoque S, Akter F (2013) Ocean Acidification in the Bay of Bengal. 2: 699 doi:10.4172/scientificreports.699
AbstractThe present study dealt with acidification of the Bay of Bengal and its impact on marine environment. It revealed
that the average pH value of water in the Bay of Bengal on an average was around 7.75. The study showed strong positive correlation between pH and bicarbonate (R2 is 0.930), between electric conductivity and salinity (R2 is 0.999) and between electric conductivity and dissolved oxygen (R2 is 0.999). The pH in the Bay of Bengal has fallen by 0.2 units between 2012 and 1994 (pH 7.95). The study infers an impact of reduction of pH on calcifying organisms such as sea shells, oyster and coral reefs that are playing essential roles in their respective ecosystems. Average calcium carbonate composition of the calcifying organisms was found to be 80% which was 17% lower than the standard composition. The lower pH (7.75) might have made the Mollusks vulnerable and fragile which was evidenced by the presence of lesser number of Mollusks compared to that of 5 to 6 years back.
Ocean Acidification in the Bay of BengalTowhida Rashid1*, Sirajul Hoque2 and Firoza Akter3
1Associate Professor, Department of Geography and Environment, University of Dhaka, Nilkhet, Dhaka-1205, Bangladesh2Professor, Department of Soil, Water and Environment, Dept. of Geography and Environment; University of Dhaka, Nilkhet, Dhaka-1205, Bangladesh3MS student, Department of Geography and Environment; University of Dhaka, Nilkhet, Dhaka-1205, Bangladesh
MethodologyThirty sea surface water samples were collected extending up to
36 nautical miles (about 67 km) from the continental shelf of the bay and the samples were mixed surface layer (upper 40 m), eight marine sediment samples at different depths which varied from 10 to 20 m, and twenty eight sea shells, oyster and coral reef samples by using different sampler such as Water Level sampler, Sediment Grab sampler, Ecobeam sounder with the help of BNS ANUSHANDHAN (Roebuck Class Hydrographic Survey vessel with 5 m draft, 64 m length, 30 m width and displacement 1450 ton) provided by Bangladesh NAVY. The samples were collected in March 20 to 23, 2012. In this study
Citation: Rashid T, Hoque S, Akter F (2013) Ocean Acidification in the Bay of Bengal. 2: 699 doi:10.4172/scientificreports.699
Page 2 of 6
Volume 2 • Issue 3 • 2013
AAS (Atomic Absorption Spectroscopy) and different lab experiments are performed in BCSIR (Bangladesh Council for Scientific and Industrial Research), Department of Soil, Water and Environment, and Department of Geography and Environment in Dhaka University.
ResultsTo find out the status of ocean acidification several parameters were
considered. These were pH, concentrations of carbonate (CO32-) and
bicarbonate (HCO3-), salinity, total dissolved solids (TDS), electrical
conductivity (EC), and dissolved oxygen (DO).
pH status of the ocean water
Based on chemical analysis of twenty seven sea water samples, the average pH was found to be 7.75 (α=0.131) in the study (Figure 2). The highest pH value of the study area was 7.93, whereas the lowest pH value was 7.47.
The lowest pH value (7.47) was found at 10 meter depth in SH station whereas the ocean surface water pH value of the same station was found to be 7.87. SH is the second nearest station from the St. Martin Island. The adjacent shoreline from this station has a distance of 5.5 nautical miles from the Shahpuri dip (island). The distance of this station from the station ST2 is 8.25 nautical miles. The lowest pH was observed at station SH located near the NAF river estuary, which has a distance of 5.40 nautical miles from the shoreline. On the other hand, the highest pH value (7.93) was observed at SF station which has a distance of 20.60 nautical miles from the shoreline.
Carbonate of the ocean water
Presence of carbonate in ocean water indicates the pH value of the ocean is more than 8.3. Carbonate is converted to bicarbonate in ocean water if the pH is less than 8.3 (Figure 2). The study shows that carbonate was not found in the water samples of the study area. This result proves that all the water samples had a pH value less than 8.3 and data of pH also confirmed the findings.
Bicarbonate of the ocean water
Presence of bicarbonate in ocean water indicates that the pH value of that sample is less than 8.3 (Figure 3). With the decrease of pH of ocean water the amount of bicarbonate will be reduced. At a value of <4.3, bicarbonate would not be available in the water. Based on the
bicarbonate analysis of the samples, the mean amount of bicarbonate was found to be 138.940 mg/L with α=12.538mg/L.
Salinity condition of the ocean water
Salinity has a high influence on the marine environment of the Bay of Bengal. The average salinity of the study area was found to be 3.60%.
The lowest percentage of salinity of the water samples was 2.48% at the surface water of the SK station which is located in the estuary of the Karnafuli River and the highest was found 4.09% at the 40 meter depth of the SE station. The SE station is the farthest station from shoreline under present investigation. The station has a distance of 34 nautical miles from the Cox’s Bazar and 36.5 from the St. Martin Island. The distance of this station from the station SD is 16.89 nautical miles. An illustration of the salinity in the Bay of Bengal has been given in the Figure 4.
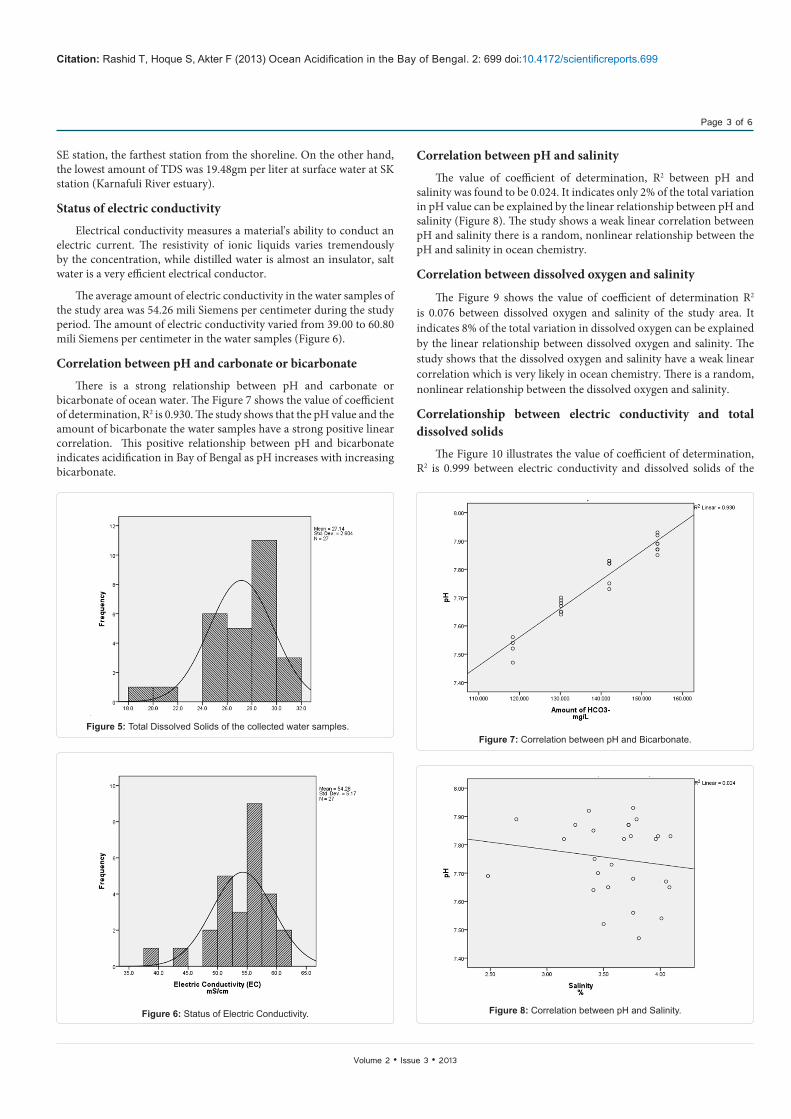
Total dissolved solids of the ocean water
The amount of total dissolved solids in sea water was increased by the influence of activities on the land. The study revealed that the average amount of total dissolved solids was 27.14 gm/L during the study period (Figure 5).
The maximum amount of TDS was 30.40 gm/L at 40 meter depth in
Figure 2: Average pH Value of the Study Area.
Figure 3: Amount of bicarbonate in the collected water samples of Bay of Bengal.
Citation: Rashid T, Hoque S, Akter F (2013) Ocean Acidification in the Bay of Bengal. 2: 699 doi:10.4172/scientificreports.699
Page 3 of 6
Volume 2 • Issue 3 • 2013
SE station, the farthest station from the shoreline. On the other hand, the lowest amount of TDS was 19.48gm per liter at surface water at SK station (Karnafuli River estuary).
Status of electric conductivity
Electrical conductivity measures a material's ability to conduct an electric current. The resistivity of ionic liquids varies tremendously by the concentration, while distilled water is almost an insulator, salt water is a very efficient electrical conductor.
The average amount of electric conductivity in the water samples of the study area was 54.26 mili Siemens per centimeter during the study period. The amount of electric conductivity varied from 39.00 to 60.80 mili Siemens per centimeter in the water samples (Figure 6).
Correlation between pH and carbonate or bicarbonate
There is a strong relationship between pH and carbonate or bicarbonate of ocean water. The Figure 7 shows the value of coefficient of determination, R2 is 0.930. The study shows that the pH value and the amount of bicarbonate the water samples have a strong positive linear correlation. This positive relationship between pH and bicarbonate indicates acidification in Bay of Bengal as pH increases with increasing bicarbonate.
Correlation between pH and salinity
The value of coefficient of determination, R2 between pH and salinity was found to be 0.024. It indicates only 2% of the total variation in pH value can be explained by the linear relationship between pH and salinity (Figure 8). The study shows a weak linear correlation between pH and salinity there is a random, nonlinear relationship between the pH and salinity in ocean chemistry.
Correlation between dissolved oxygen and salinity
The Figure 9 shows the value of coefficient of determination R2 is 0.076 between dissolved oxygen and salinity of the study area. It indicates 8% of the total variation in dissolved oxygen can be explained by the linear relationship between dissolved oxygen and salinity. The study shows that the dissolved oxygen and salinity have a weak linear correlation which is very likely in ocean chemistry. There is a random, nonlinear relationship between the dissolved oxygen and salinity.
Correlationship between electric conductivity and total dissolved solids
The Figure 10 illustrates the value of coefficient of determination, R2 is 0.999 between electric conductivity and dissolved solids of the
Figure 5: Total Dissolved Solids of the collected water samples.
Citation: Rashid T, Hoque S, Akter F (2013) Ocean Acidification in the Bay of Bengal. 2: 699 doi:10.4172/scientificreports.699
Page 4 of 6
Volume 2 • Issue 3 • 2013
collected water samples of the study area. That indicates 100% of the total variation in electric conductivity can be explained by the linear relationship between electric conductivity and total dissolved solids. The study shows a strong positive linear correlation between electric conductivity and total dissolved sediments in the study area. This positive value indicates a relationship between electric conductivity and total dissolved solids which is very appropriate for sea water chemistry. In the study area, electric conductivity increases with increase of dissolved solids.
Correlation between electric conductivity and salinity
The Figure 11 presents the value of coefficient of determination, R2
is 0.999 between electric conductivity and salinity of the collected water samples from the study area. It indicates 100% of the total variation in electric conductivity can be explained by the linear relationship between electric conductivity and salinity. The study reveals that the electric conductivity and salinity have a very strong positive linear correlation which is ideal condition for ocean water chemistry.
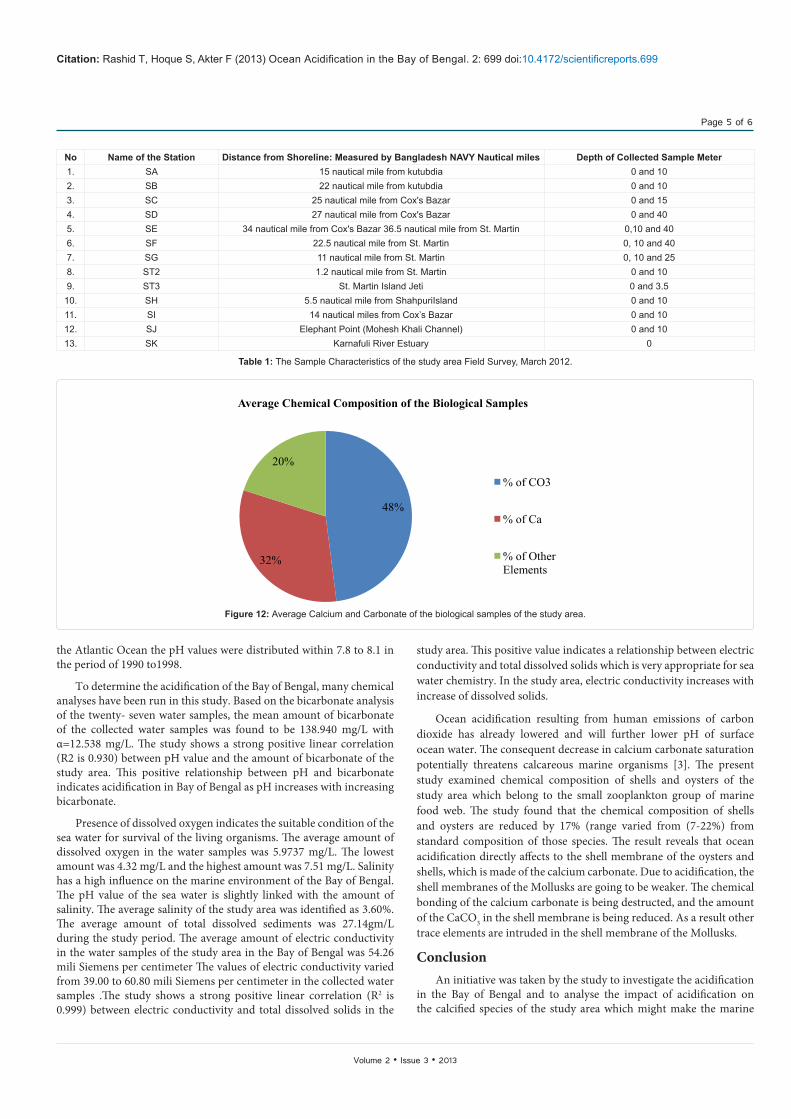
Biological samples
As organisms (like shell, oyster and coral) are the most vulnerable to ocean acidification, twenty eight (28) samples were collected to analyze their chemical composition to compare with their standard composition. The oyster creates its own environment by secreting a shell composed or ninety-five percent (95-97%) of calcium carbonate [2]. The remainder of the shell is made up of organic material and trace amounts of manganese, iron, aluminum, sulfate and magnesium [3,4] demonstrated that the calcification rates of the edible mussel (Mytilus edulis) and Pacific oyster (Crassostrea gigas) decline linearly with increasing pCO2.
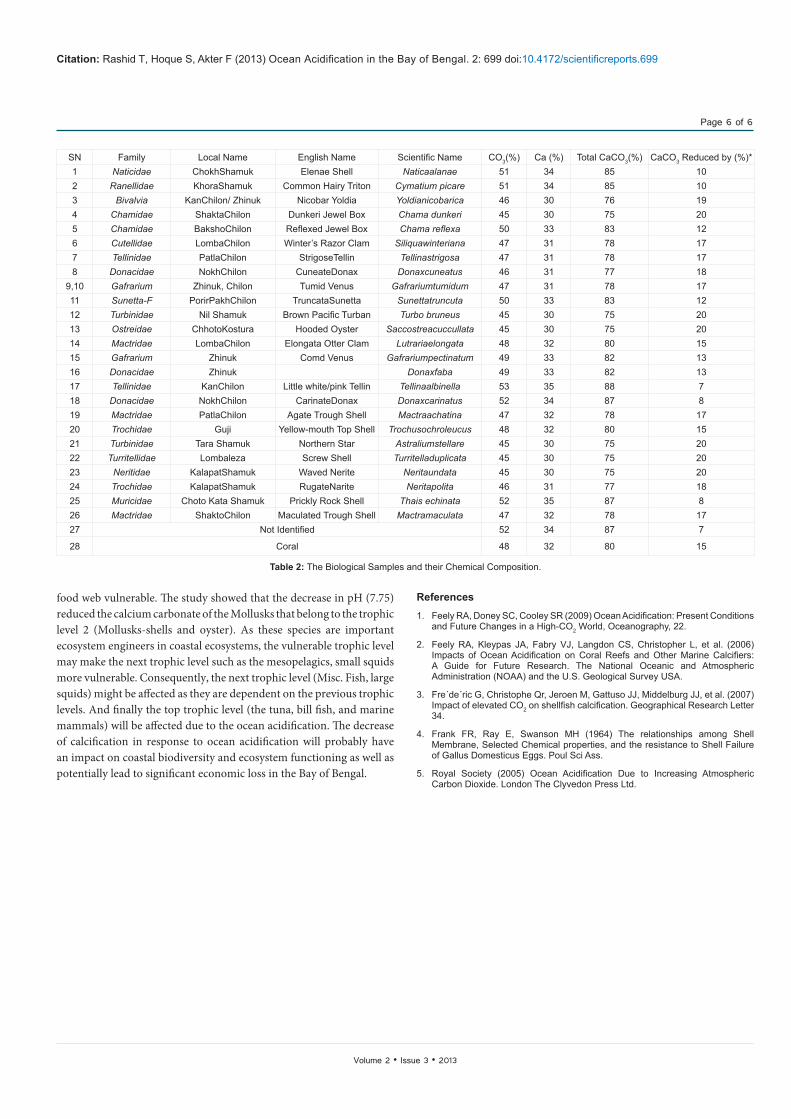
The Table 1 shows a brief description of the collected biological samples of the study area and their chemical composition particularly the percentage of CaCO3 in the shell membrane.
A reduced shell thickness and breaking strength was found in this study when compared to normal shells. The Figure 12 and Table 2 show that the samples had an average content of 80% calcium carbonate compared to 97.00 percent calcium carbonate in the normal shell. The Figure 12 shows that among 28 samples many of the species such as Chama dunkeri, Turbo bruneus, Saccostre acuccullata, Astraliumstellare, Turritelladuplicata, Neritaundata were composed of eighty percent (80%) of calcium carbonate. Average calcium carbonate composition was found to be 80% which is 17% lower than the standard composition.
DiscussionRoyal Society [5] showed geographic pH variation for the global
surface oceans (50 m) for the year 1994. The map shows surface pH values range from 7.9 to 8.25 with a mean value of 8.08. The lowest values are observed in upwelling regions (e.g. Equatorial Pacific, Arabian Sea) where subsurface waters with lower pH values are brought to the surface. The Bay of Bengal belongs to the lowest zone of pH. The bay had pH lower than 7.95 in 1994. The present study reveals that the average pH value in the Bay of Bengal was 7.75. The study showed that the pH in Bay of Bengal has fallen by 0.2 unit compared in 1994 (lower than 7.95). It can be concluded that the average reduction rate of the pH value is 0.0083 units per year. Feely et al. [1] notified that that in the Pacific Ocean the pH value varies from 7.6 to 8.0 whereas, in the Indian Ocean the pH values were mostly distributed within 7.7 to 8.1. And in
Figure 9: Correlation between Dissolved Oxygen and Salinity.
Figure 10: Correlation between Electrical Conductivity and Total Dissolved Solids.
Figure 11: Correlation between Electrical Conductivity and Salinity.
Citation: Rashid T, Hoque S, Akter F (2013) Ocean Acidification in the Bay of Bengal. 2: 699 doi:10.4172/scientificreports.699
Page 5 of 6
Volume 2 • Issue 3 • 2013
the Atlantic Ocean the pH values were distributed within 7.8 to 8.1 in the period of 1990 to1998.
To determine the acidification of the Bay of Bengal, many chemical analyses have been run in this study. Based on the bicarbonate analysis of the twenty- seven water samples, the mean amount of bicarbonate of the collected water samples was found to be 138.940 mg/L with α=12.538 mg/L. The study shows a strong positive linear correlation (R2 is 0.930) between pH value and the amount of bicarbonate of the study area. This positive relationship between pH and bicarbonate indicates acidification in Bay of Bengal as pH increases with increasing bicarbonate.
Presence of dissolved oxygen indicates the suitable condition of the sea water for survival of the living organisms. The average amount of dissolved oxygen in the water samples was 5.9737 mg/L. The lowest amount was 4.32 mg/L and the highest amount was 7.51 mg/L. Salinity has a high influence on the marine environment of the Bay of Bengal. The pH value of the sea water is slightly linked with the amount of salinity. The average salinity of the study area was identified as 3.60%. The average amount of total dissolved sediments was 27.14gm/L during the study period. The average amount of electric conductivity in the water samples of the study area in the Bay of Bengal was 54.26 mili Siemens per centimeter The values of electric conductivity varied from 39.00 to 60.80 mili Siemens per centimeter in the collected water samples .The study shows a strong positive linear correlation (R2 is 0.999) between electric conductivity and total dissolved solids in the
study area. This positive value indicates a relationship between electric conductivity and total dissolved solids which is very appropriate for sea water chemistry. In the study area, electric conductivity increases with increase of dissolved solids.
Ocean acidification resulting from human emissions of carbon dioxide has already lowered and will further lower pH of surface ocean water. The consequent decrease in calcium carbonate saturation potentially threatens calcareous marine organisms [3]. The present study examined chemical composition of shells and oysters of the study area which belong to the small zooplankton group of marine food web. The study found that the chemical composition of shells and oysters are reduced by 17% (range varied from (7-22%) from standard composition of those species. The result reveals that ocean acidification directly affects to the shell membrane of the oysters and shells, which is made of the calcium carbonate. Due to acidification, the shell membranes of the Mollusks are going to be weaker. The chemical bonding of the calcium carbonate is being destructed, and the amount of the CaCO3 in the shell membrane is being reduced. As a result other trace elements are intruded in the shell membrane of the Mollusks.
ConclusionAn initiative was taken by the study to investigate the acidification
in the Bay of Bengal and to analyse the impact of acidification on the calcified species of the study area which might make the marine
No Name of the Station Distance from Shoreline: Measured by Bangladesh NAVY Nautical miles Depth of Collected Sample Meter1. SA 15 nautical mile from kutubdia 0 and 102. SB 22 nautical mile from kutubdia 0 and 103. SC 25 nautical mile from Cox's Bazar 0 and 154. SD 27 nautical mile from Cox's Bazar 0 and 405. SE 34 nautical mile from Cox's Bazar 36.5 nautical mile from St. Martin 0,10 and 406. SF 22.5 nautical mile from St. Martin 0, 10 and 407. SG 11 nautical mile from St. Martin 0, 10 and 258. ST2 1.2 nautical mile from St. Martin 0 and 109. ST3 St. Martin Island Jeti 0 and 3.510. SH 5.5 nautical mile from ShahpuriIsland 0 and 1011. SI 14 nautical miles from Cox’s Bazar 0 and 1012. SJ Elephant Point (Mohesh Khali Channel) 0 and 1013. SK Karnafuli River Estuary 0
Table 1: The Sample Characteristics of the study area Field Survey, March 2012.
48%
32%
20%
Average Chemical Composition of the Biological Samples
% of CO3
% of Ca
% of Other Elements
Figure 12: Average Calcium and Carbonate of the biological samples of the study area.
Citation: Rashid T, Hoque S, Akter F (2013) Ocean Acidification in the Bay of Bengal. 2: 699 doi:10.4172/scientificreports.699
Page 6 of 6
Volume 2 • Issue 3 • 2013
food web vulnerable. The study showed that the decrease in pH (7.75) reduced the calcium carbonate of the Mollusks that belong to the trophic level 2 (Mollusks-shells and oyster). As these species are important ecosystem engineers in coastal ecosystems, the vulnerable trophic level may make the next trophic level such as the mesopelagics, small squids more vulnerable. Consequently, the next trophic level (Misc. Fish, large squids) might be affected as they are dependent on the previous trophic levels. And finally the top trophic level (the tuna, bill fish, and marine mammals) will be affected due to the ocean acidification. The decrease of calcification in response to ocean acidification will probably have an impact on coastal biodiversity and ecosystem functioning as well as potentially lead to significant economic loss in the Bay of Bengal.
SN Family Local Name English Name Scientific Name CO3(%) Ca (%) Total CaCO3(%) CaCO3 Reduced by (%)*1 Naticidae ChokhShamuk Elenae Shell Naticaalanae 51 34 85 102 Ranellidae KhoraShamuk Common Hairy Triton Cymatium picare 51 34 85 103 Bivalvia KanChilon/ Zhinuk Nicobar Yoldia Yoldianicobarica 46 30 76 194 Chamidae ShaktaChilon Dunkeri Jewel Box Chama dunkeri 45 30 75 205 Chamidae BakshoChilon Reflexed Jewel Box Chama reflexa 50 33 83 126 Cutellidae LombaChilon Winter’s Razor Clam Siliquawinteriana 47 31 78 177 Tellinidae PatlaChilon StrigoseTellin Tellinastrigosa 47 31 78 178 Donacidae NokhChilon CuneateDonax Donaxcuneatus 46 31 77 18
and Future Changes in a High-CO2 World, Oceanography, 22.
2. Feely RA, Kleypas JA, Fabry VJ, Langdon CS, Christopher L, et al. (2006) Impacts of Ocean Acidification on Coral Reefs and Other Marine Calcifiers: A Guide for Future Research. The National Oceanic and Atmospheric Administration (NOAA) and the U.S. Geological Survey USA.
3. Fre´de´ric G, Christophe Qr, Jeroen M, Gattuso JJ, Middelburg JJ, et al. (2007) Impact of elevated CO2 on shellfish calcification. Geographical Research Letter 34.
4. Frank FR, Ray E, Swanson MH (1964) The relationships among Shell Membrane, Selected Chemical properties, and the resistance to Shell Failure of Gallus Domesticus Eggs. Poul Sci Ass.
5. Royal Society (2005) Ocean Acidification Due to Increasing Atmospheric Carbon Dioxide. London The Clyvedon Press Ltd.