60
Ratchet up your investigation with statistics David Donald, The Center for Public Integrity Jennifer LaFleur, CIR
| Date post: | 16-Dec-2015 |
| Category: |
Documents |
| Upload: | kerry-ramsey |
| View: | 214 times |
| Download: | 0 times |

Ratchet up your investigation with statistics
David Donald, The Center for Public IntegrityJennifer LaFleur, CIR

These may all be nuts

But they do different thingsand need different tools
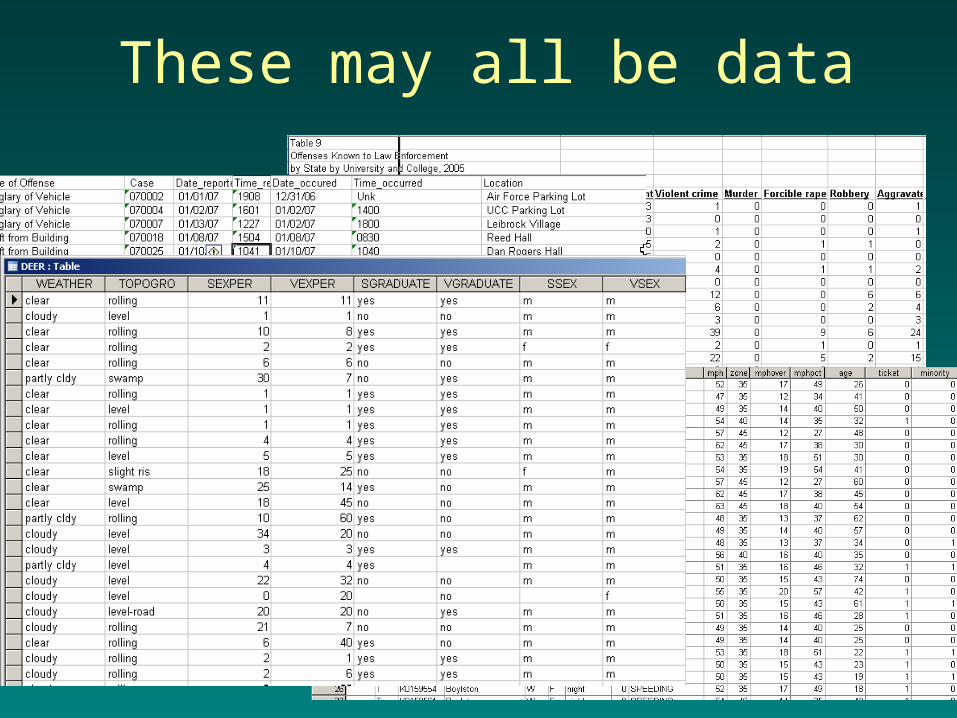
These may all be data
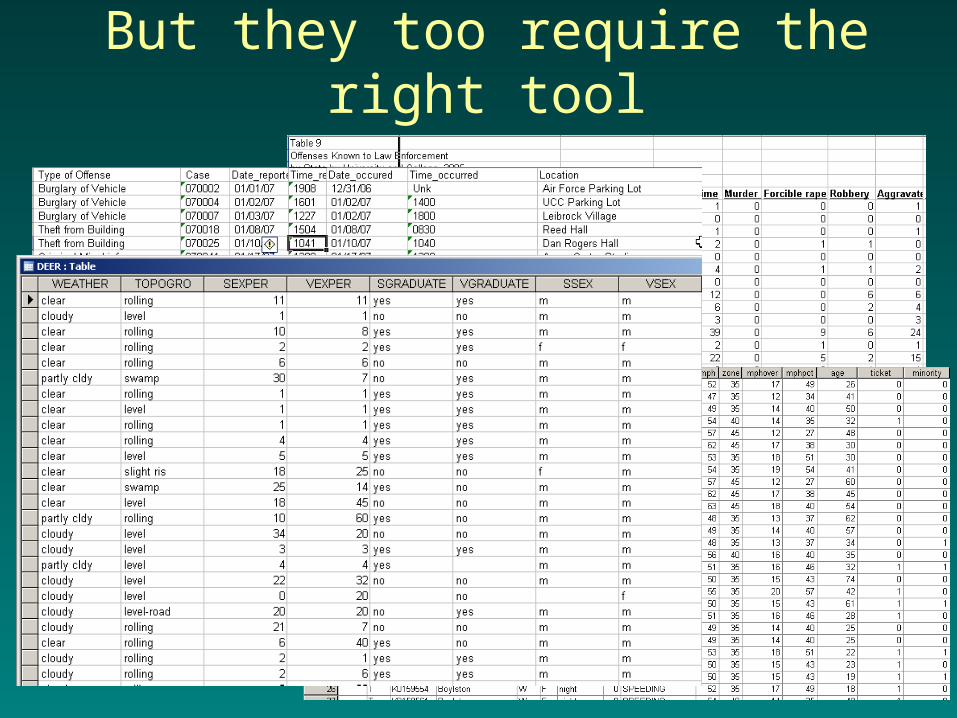
But they too require the right tool
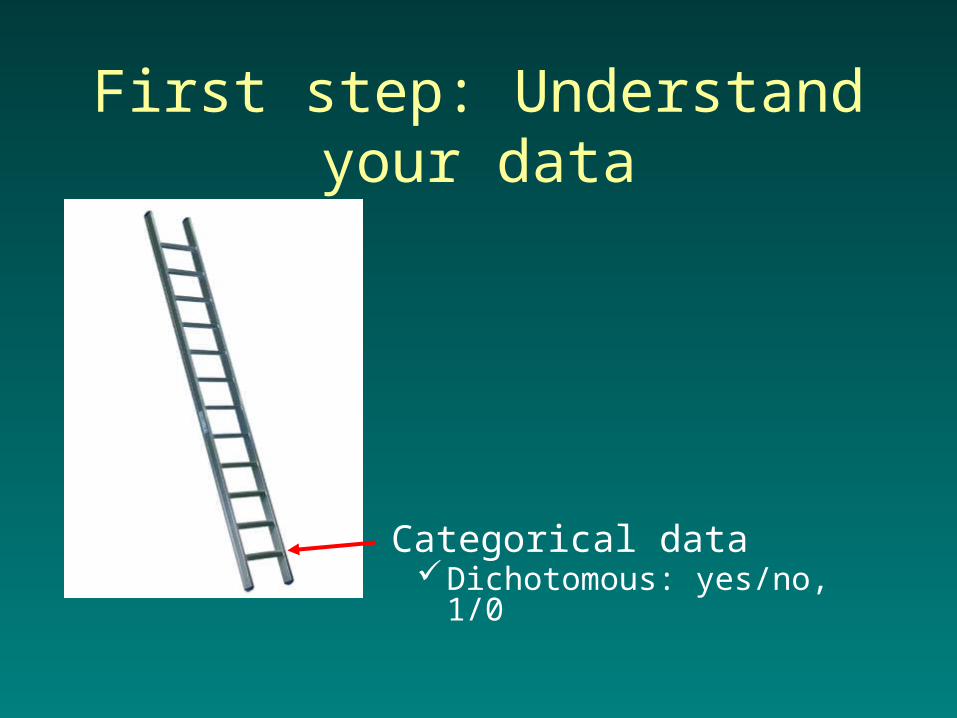
First step: Understand your data
Categorical dataDichotomous: yes/no, 1/0


OnOff
UP
DOWN

Next step: Know what you can do with it
Frequencies
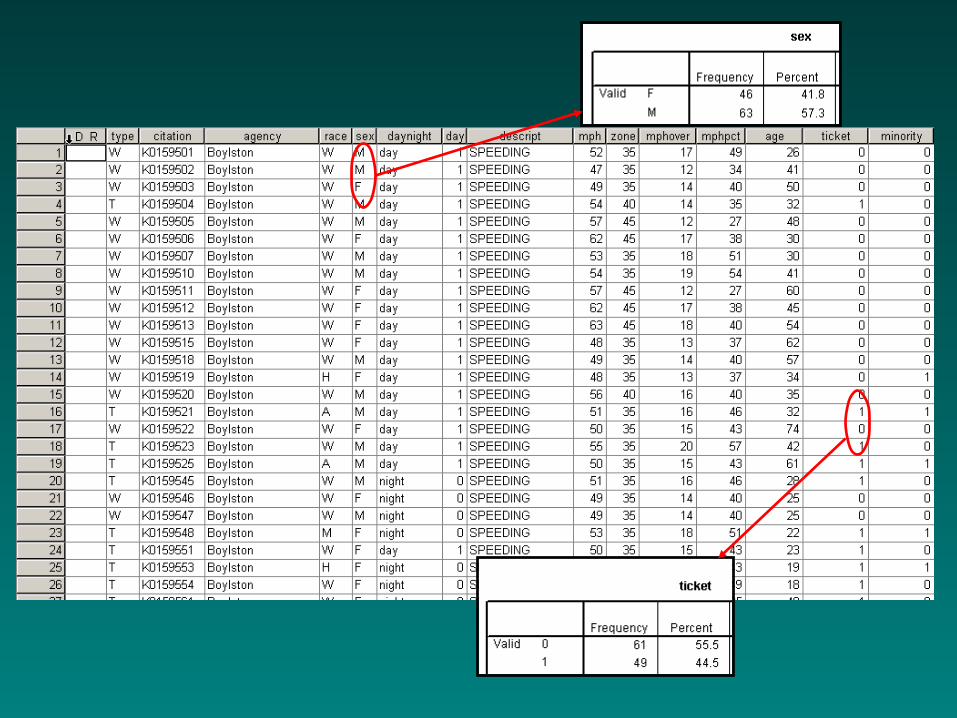

FrequenciesCross-tabs
Categorical Dichotomous


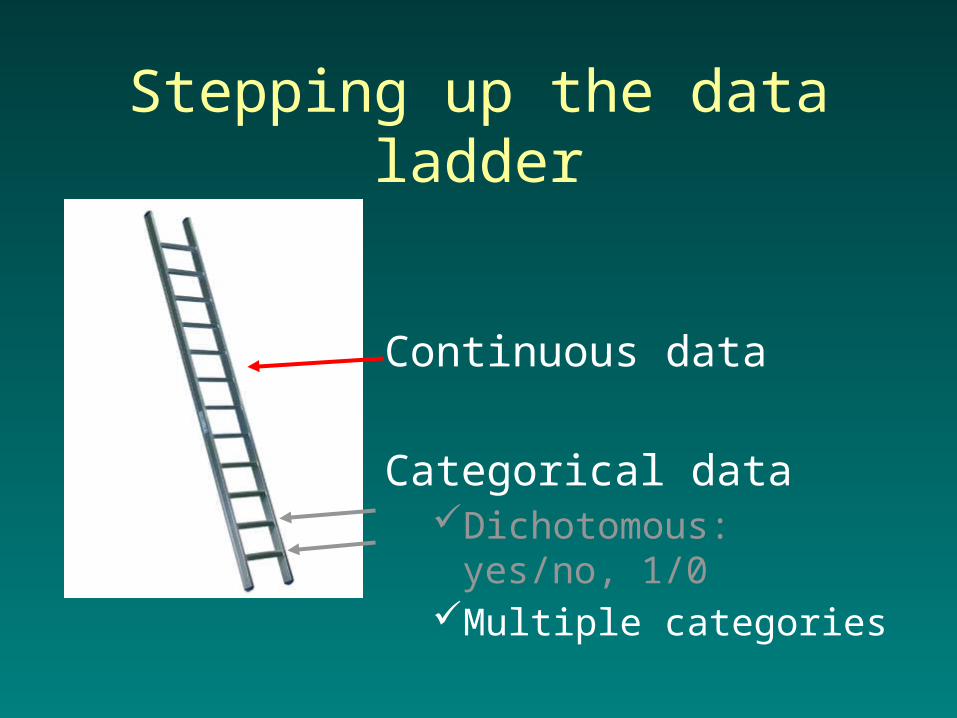
Stepping up the data ladder
Categorical dataDichotomous: yes/no,
1/0Multiple categories


Frequencies
Categorical Multi-categorical


FrequenciesCross-tabs
Categorical Multi-categorical


Stepping up the data ladder
Continuous data Categorical data
Dichotomous: yes/no, 1/0
Multiple categories


Continuous dataMeanMedianRangeRank
Working with continuous data

MPHMean: 54.63Median: 54.09


More with continuous data
N-tilesRatesCorrelationRegression
But wait! There’s more

Correlation


Distribution

Regression
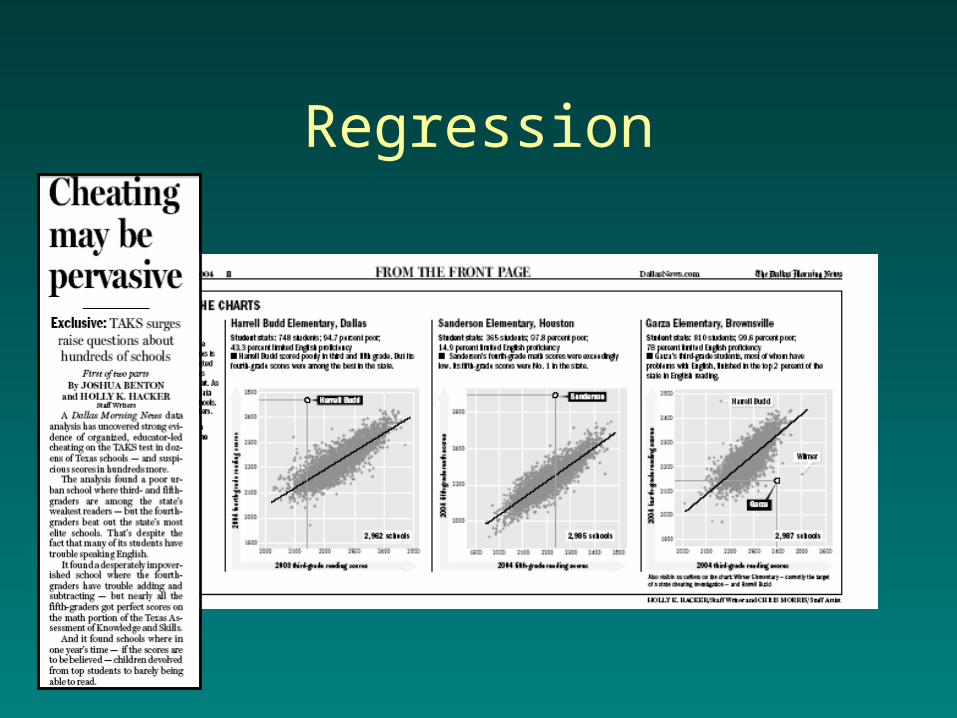
Regression

RegressionWhen you run a regression, you get a result called an R-square. That will help you see how much the independent variable predicts the dependent variable.
Model Summary
Model R R SquareAdjusted R
SquareStd. Error of the
Estimate
1.911(a) .830 .829 10.8330
83 percent of the variation in test scores is explained by change in poverty

Regression
Then use that information to “adjust” the data or to see if entities are doing better or worse than they should.


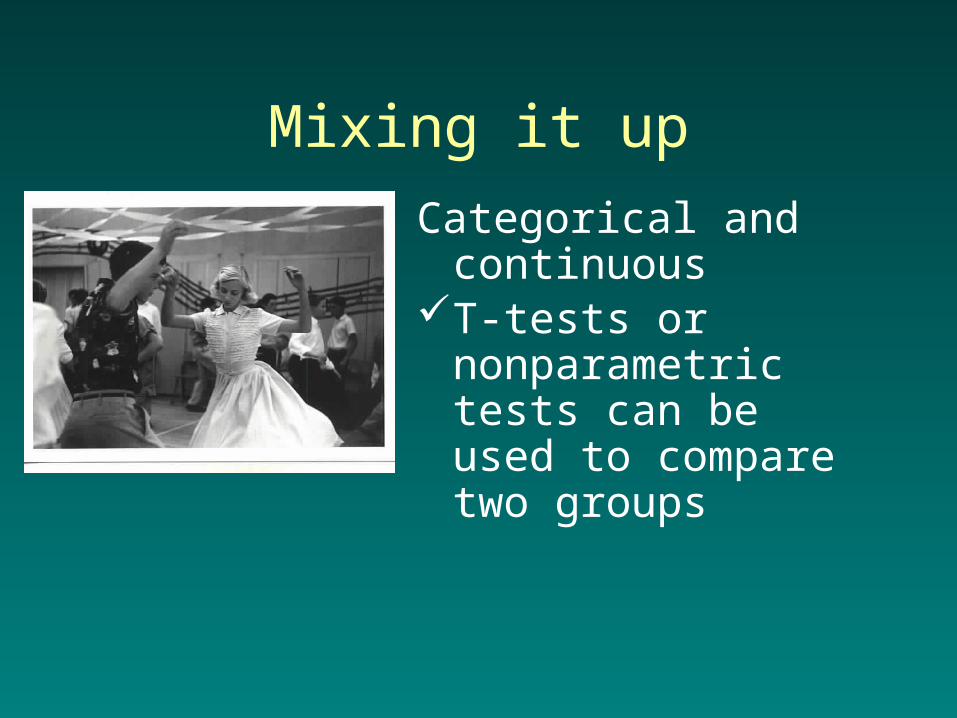
Mixing it up
Categorical and continuous
T-tests or nonparametric tests can be used to compare two groups

Mixing it up
Categorical and continuous
ANOVA – analysis of variance
Good for comparing more than 2 groups
Is variation across groups greater than within groups

Mixing it up
Categorical and continuous
AND your outcome variables is dichotomous
Logistic regression


Don’t reinvent the wheelKnow the tools (or find
them)

Index
A measurement of movement used to simplify or compare a set of numbers
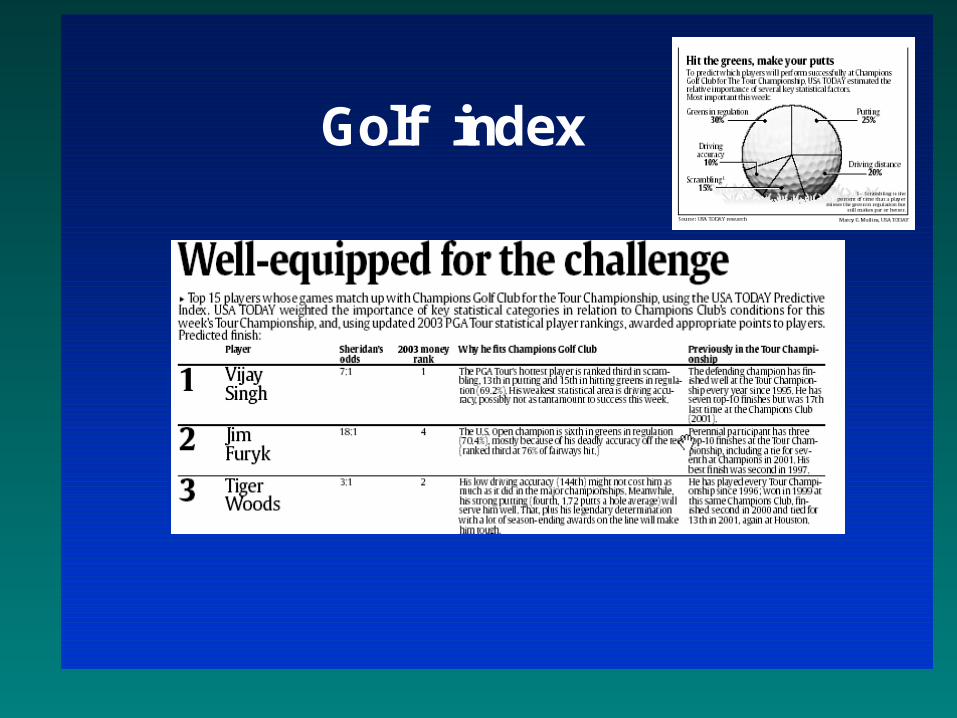
Golf index


IndexesFBI Crime index: total of seven
crimesDiversity Index: probability that
two people pulled out of a given area would be of the same race
Herfindahl-Hirshman Index: measures competition in a market
Gini Coefficient: measures income disparity


How to build your own index
Make sure what your index is valid. Here’s an example:
No index measures people’s attitudes toward pro-development versus pro-environment. And it’s hard to ask people up front, which are you?
One way is in a survey to ask a bunch of questions on a scale, such as whether more material consumption makes happier people. You ask on a scale of 1-5 if you agree or disagree with the statement.

Your own index
Say you ask questions along this line. Then you can see if they correlate.
You want some correlation but not too much. a Pearson “r” between .2 and .5
Run a test called Chronbach’s Alpha to examine affect each question has on the others. You want the score to be above .7 at least, .8 is better.
If you find that to be met, then you can average the scores on the seven questions (or however many correlate) and come up with one score that measures your difficult concept.

Your own index
Using a panel of questions and a statistical test known as Cronbach’s Alpha, David Donald, then with the Savannah Morning News , showed that those who are most pro-development were lower income people, those who had been left out of the American Dream. Material success apparently allows you to become more pro-environment.


Knowing all of these tools can get confusing

So when you’re not sure which tool to use, ask
someone.

Dos and Don’ts
• Put your findings in terms readers can understand
• Explain your methodology• Put complicated numbers in graphics• Duplicate your results• Duplicate your results

Dos and Don’ts
Watch your wording:
A farm city of 122,000 known as the "Salad Bowl of the World," Salinas had become a cornucopia of gang violence. The number of gangs more than tripled since 1990. In 1994, the per-capita murder rate in Salinas, largely attributed to warring gangs, surpassed that of San Jose, at 38 and 24 respectively.

Dos and Don’ts
• Bounce findings off experts/targets• Don’t say significant – when you don’t
really now (but you can test for that)• Beware the spurious correlation• While your analysis may generate lots of
Rs and Ps --- you may want to go back to descriptives in print.

Questions?


