1 Rate and Distortion Optimization for Reversible Data Hiding Using Multiple Histogram Shifting Junxiang Wang, Jiangqun Ni, Member, IEEE, Xing Zhang, Yun Qing Shi, Fellow, IEEE Abstract—Histogram-shifting (HS) embedding as a typical reversible data hiding scheme is widely investigated due to its high quality of stego-image. For HS based embedding, the selected side information, i.e., peak and zero bins, usually greatly affects the rate and distortion performance of the stego-image. Due to the massive solution space and burden in distortion computation, conventional HS based schemes utilize some empirical criterion to determine those side information, which generally could not lead to a globally optimal solution for reversible embedding. In this paper, based on the developed rate and distortion model, the problem of HS based multiple embedding is formulated as the one of rate and distortion optimization. Two key propositions are then derived to facilitate the fast computation of distortion due to multiple shifting and narrow down the solution space, respectively. Finally, an evolutionary optimization algorithm, i.e., genetic algorithm (GA) is employed to search the nearly optimal zero and peak bins. For a given data payload, the proposed scheme could not only adaptively determine the proper number of peak and zero bin pairs but also their corresponding values for HS based multiple reversible embedding. Compared with previous approaches, experimental results demonstrate the superiority of the proposed scheme in the terms of embedding capacity and stego-image quality. Index Terms—Reversible data hiding, histogram shifting (HS), rate and distortion optimization, genetic algorithm (GA). I. I NTRODUCTION I N recent years, data hiding techniques have found wide applications in copyright protection and content authen- tication of digital multimedia[1, 2]. The inherent defect of the conventional data hiding schemes is that they can usually not completely recover the original image after the image has been modified for data hiding. For some specific scenarios, such as military, medical and legal applications, even the slight This work was supported in part by the National Natural Science Foundation of China under Grants 61379156 and 61402209, in part by the National Research Foundation for the Doctoral Program of Higher Education of China under Grant 20120171110037, in part by the Key Program of Natural Science Foundation of Guangdong under Grant S2012020011114, in part by Invention Patent and Industrialization Technology Demonstration Project of Jiangxi Province (20143BBM26113). (Corresponding author: Jiangqun Ni). J.X. Wang is with the School of Information Science and Technology, Sun Yat-sen University, Guangdong, 510006, China, and is also with the School of Mechanical & Electronic Engineering, Jingdezhen Ceramic Institute, Jiangxi, China (e-mail: [email protected]). J.Q. Ni is with the school of Information Science and Technology, Sun Yat- Sen University, Guangdong 510006, China and is also with the State Key Lab- oratory of Information Security (Institute of Information Engineering, Chinese Academy of Sciences, Beijing 100093) (e-mail: [email protected]). X. Zhang is with the School of Information Science and Technolo- gy, Sun Yat-Sen University, Guangdong 510006, China (e-mail: zhangx- [email protected]). Y.Q. Shi is with the Department of Electronics and Computer Engineer- ing, New Jersey Institute of Technology, Newark, New Jersey, USA (e- mail:[email protected]). distortion in images is not tolerated. Therefore, reversible data hiding techniques are developed, which enable the decoder to not only extract the secret data as traditional schemes, but also perfectly reconstruct the original cover image without any distortion. Many reversible data hiding schemes have been reported in literature since Barton proposed his first reversible data hiding scheme [3] in 1997. In general, the existing reversible data hiding schemes explore the correlation among pixels in a cover image and can be mainly classified into three categories: i.e., lossless compression [4, 5], difference expansion (DE) [6– 12] and histogram shifting (HS) [13–23]. DE based scheme was first proposed by Tian et al. [6]. Later, several improved techniques for DE based embedding are put forward, which includes the prediction and sorting [7, 9], and location map re- duction [8, 10]. Histogram shifting (HS) based reversible data hiding was initially proposed by Ni et al. [13] in 2006, which selected a pair of peak and zero bins in histogram and then shifted the bins between the two bins by 1 towards zero bin for reversible data embedding. In principle, DE can be regarded as a special case of HS with peak and zero bins selected from the center and tail of the histogram, respectively. Therefore, we concentrate on the HS based approach throughout the paper. The rate and distortion performance of HS based reversible data hiding depends heavily on the sharpness of histogram and the way to determine the peak and zero bin pairs. To sharpen the histogram, integer digital wavelet transform coefficients [14], pixel differences [15, 16], prediction errors [9, 17, 18] and interpolation errors [19] have been successively employed to generate the carrier image (to distinguish the cover images, we use carrier images throughout the paper to refer to the ones into which data are directly embedded, e.g., prediction and interpolation errors of cover images, etc.) for HS based embedding and relatively high embedding capacity are ob- tained. Among them, by taking advantage of the four adjacent neighbors around current pixel, Sachnev et al.’s prediction model [9] gives the sharpest histogram of prediction errors. Recently, to further improve the embedding capacity of carrier image, the concepts of statistical quantity histogram [20] and two-dimensional difference-histogram [21] have also been introduced, and the later is shown to be very suitable for low payload reversible data hiding. In addition to the generation of carrier images and their histograms, the determination of peak and zero bins is also critical for HS based embedding. For the small payload, single pair of peak and zero bins is sufficient and the optimal solution could be obtained through brute-force search. When relatively large payload is required, however, multiple embedding scheme as mentioned in [16] should be
Transcript
1
Rate and Distortion Optimization for ReversibleData Hiding Using Multiple Histogram Shifting
Abstract—Histogram-shifting (HS) embedding as a typicalreversible data hiding scheme is widely investigated due to its highquality of stego-image. For HS based embedding, the selected sideinformation, i.e., peak and zero bins, usually greatly affects therate and distortion performance of the stego-image. Due to themassive solution space and burden in distortion computation,conventional HS based schemes utilize some empirical criterionto determine those side information, which generally could notlead to a globally optimal solution for reversible embedding. Inthis paper, based on the developed rate and distortion model,the problem of HS based multiple embedding is formulated asthe one of rate and distortion optimization. Two key propositionsare then derived to facilitate the fast computation of distortiondue to multiple shifting and narrow down the solution space,respectively. Finally, an evolutionary optimization algorithm,i.e., genetic algorithm (GA) is employed to search the nearlyoptimal zero and peak bins. For a given data payload, theproposed scheme could not only adaptively determine the propernumber of peak and zero bin pairs but also their correspondingvalues for HS based multiple reversible embedding. Comparedwith previous approaches, experimental results demonstrate thesuperiority of the proposed scheme in the terms of embeddingcapacity and stego-image quality.
Index Terms—Reversible data hiding, histogram shifting (HS),rate and distortion optimization, genetic algorithm (GA).
I. INTRODUCTION
IN recent years, data hiding techniques have found wideapplications in copyright protection and content authen-
tication of digital multimedia[1, 2]. The inherent defect ofthe conventional data hiding schemes is that they can usuallynot completely recover the original image after the image hasbeen modified for data hiding. For some specific scenarios,such as military, medical and legal applications, even the slight
This work was supported in part by the National Natural Science Foundationof China under Grants 61379156 and 61402209, in part by the NationalResearch Foundation for the Doctoral Program of Higher Education of Chinaunder Grant 20120171110037, in part by the Key Program of Natural ScienceFoundation of Guangdong under Grant S2012020011114, in part by InventionPatent and Industrialization Technology Demonstration Project of JiangxiProvince (20143BBM26113). (Corresponding author: Jiangqun Ni).
J.X. Wang is with the School of Information Science and Technology, SunYat-sen University, Guangdong, 510006, China, and is also with the School ofMechanical & Electronic Engineering, Jingdezhen Ceramic Institute, Jiangxi,China (e-mail: [email protected]).
J.Q. Ni is with the school of Information Science and Technology, Sun Yat-Sen University, Guangdong 510006, China and is also with the State Key Lab-oratory of Information Security (Institute of Information Engineering, ChineseAcademy of Sciences, Beijing 100093) (e-mail: [email protected]).
X. Zhang is with the School of Information Science and Technolo-gy, Sun Yat-Sen University, Guangdong 510006, China (e-mail: [email protected]).
Y.Q. Shi is with the Department of Electronics and Computer Engineer-ing, New Jersey Institute of Technology, Newark, New Jersey, USA (e-mail:[email protected]).
distortion in images is not tolerated. Therefore, reversible datahiding techniques are developed, which enable the decoderto not only extract the secret data as traditional schemes, butalso perfectly reconstruct the original cover image without anydistortion.
Many reversible data hiding schemes have been reportedin literature since Barton proposed his first reversible datahiding scheme [3] in 1997. In general, the existing reversibledata hiding schemes explore the correlation among pixels in acover image and can be mainly classified into three categories:i.e., lossless compression [4, 5], difference expansion (DE) [6–12] and histogram shifting (HS) [13–23]. DE based schemewas first proposed by Tian et al. [6]. Later, several improvedtechniques for DE based embedding are put forward, whichincludes the prediction and sorting [7, 9], and location map re-duction [8, 10]. Histogram shifting (HS) based reversible datahiding was initially proposed by Ni et al. [13] in 2006, whichselected a pair of peak and zero bins in histogram and thenshifted the bins between the two bins by 1 towards zero bin forreversible data embedding. In principle, DE can be regarded asa special case of HS with peak and zero bins selected from thecenter and tail of the histogram, respectively. Therefore, weconcentrate on the HS based approach throughout the paper.
The rate and distortion performance of HS based reversibledata hiding depends heavily on the sharpness of histogram andthe way to determine the peak and zero bin pairs. To sharpenthe histogram, integer digital wavelet transform coefficients[14], pixel differences [15, 16], prediction errors [9, 17, 18]and interpolation errors [19] have been successively employedto generate the carrier image (to distinguish the cover images,we use carrier images throughout the paper to refer to theones into which data are directly embedded, e.g., predictionand interpolation errors of cover images, etc.) for HS basedembedding and relatively high embedding capacity are ob-tained. Among them, by taking advantage of the four adjacentneighbors around current pixel, Sachnev et al.’s predictionmodel [9] gives the sharpest histogram of prediction errors.Recently, to further improve the embedding capacity of carrierimage, the concepts of statistical quantity histogram [20]and two-dimensional difference-histogram [21] have also beenintroduced, and the later is shown to be very suitable for lowpayload reversible data hiding. In addition to the generation ofcarrier images and their histograms, the determination of peakand zero bins is also critical for HS based embedding. For thesmall payload, single pair of peak and zero bins is sufficientand the optimal solution could be obtained through brute-forcesearch. When relatively large payload is required, however,multiple embedding scheme as mentioned in [16] should be
2
employed, which uses multiple pairs of different peak andzero bins from the histogram at a time, and performs multipleHS based embedding consecutively based on the resultinghistogram. Generally, with given data payload and carrierimage, the design of HS based multiple reversible embeddingcan be formulated as the optimization problem to find a setof optimal peak and zero bins while minimizing its distortion.To solve the optimization problem, however, several key issuesas follows should be addressed: (1) To develop the rate anddistortion model for HS based multiple embedding. (2) Tofast evaluate the distortion for multiple embedding. Note that,during multiple embedding, only one pair of peak and zerobins is selected for each embedding level, consequently theother peak and zero bins in the following embedding levelsmay be inevitably affected and changed to other values. Toevaluate the distortion, the actual multiple embedding shouldbe performed, which is heavily dependent on the relativelocation of the multiple peak and zero bins in the histogramand quite cumbersome and time-consuming. (3) To efficientlysolve the optimization problem, i.e., to determine the numberof optimal peak and zero bin pairs and their correspondingvalues. Due to the massive solution space, conventional HSbased schemes usually follow some empirical search paths tofind the peak and zero bin pairs, which generally do not ensureglobally optimal solution for multiple reversible embedding.
Ni et al. in [13] orderly selected the highest frequency binsand their closest zero frequency bins as the peak and zero binsfor HS based embedding. Based on the assumption that onepeak bin should be on the left of the corresponding zero bin,Yang et al.in [22] proposed a general model for the distortionestimation. Unfortunately, they did not provide an efficientsolution to find the optimal peak and zero bins. Moreover,the assumption itself may not always be true for practicalapplications. Xuan et al. in [23] proposed another HS basedscheme to find the appropriate peak and zero bin pairs, whichaimed to minimizing the possible histogram modification forgiven data payload. They utilized a pair of beginning and endthresholds to determine the interval around zero for successiveassignment of peak bins. Although considerable improvementin performance was obtained, their scheme could not alwaysguarantee the optimal peak bins be selected from the pre-determined interval. In addition, the scheme in [23] impliedthe zero bins be located at the tail of the histogram, whichmay lead to relatively large distortion due to histogram shiftingand further sacrifice the performance. To our best knowledge,no practical rate and distortion optimization scheme for HSbased multiple embedding has been reported in literature dueto the massive solution space and the burden of distortioncomputation.
This paper presents a systematic framework to design HSbased multiple reversible data hiding system with nearlyoptimal rate and distortion performance, which is independentof carrier images. And the contributions of the paper are asfollows. Firstly, we develop the rate and distortion modelfor HS based multiple embedding, then present Proposition1 for fast evaluation of the possible distortion due to HSbased multiple embedding without actually implementing theembedding process. We further provide the Proposition 2 to
significantly simplify the process of distortion evaluation whendifferent peak and zero bins are paired for given candidatepeak and zero bin sets. It is noted that there is no explicitexpression of the rate and distortion in terms of multiplepairs of peak and zero bins, consequently the conventionaloptimization algorithms, such as gradient descent method etc.,are not appropriate for application. In addition, the massivesolution space of peak and zero bins also prohibit the directuse of exhaustive search in the design of optimal HS basedmultiple embedding. In [24], the evolutionary optimizationalgorithm, i.e., genetic algorithm (GA) was utilized to designa robust steganographic scheme that can break the inspectionof steganalytic tools. In this paper, however, we also employthe GA with powerful global search capability and fast con-vergence, to automatically search the nearly optimal peak andzero bin pairs for HS based multiple embedding. Finally, therhombus prediction in [9] is also incorporated to generate thecarrier image for efficient reversible data embedding.
The rest of the paper is organized as follows. The rateand distortion model for HS based multiple embedding andthe associated fast algorithm for distortion computation aredeveloped in Section II. The specific GA is then designed tosolve the optimization problem in Section III. The proposedembedding and extraction schemes are described in SectionIV, which are followed by the experimental results and anal-ysis in Section V. Finally, the conclusions are summarized inSection VI.
II. THE RATE AND DISTORTION MODEL FOR HSBASED MULTIPLE EMBEDDING
In the section, the rate and distortion model and the associ-ated algorithm for fast distortion computation are developed.Based on these, the HS based multiple embedding is thenformulated as the rate and distortion optimization problem interms of multiple peak and zero bin pairs.
A. The rate and distortion model for HS based embedding
Histogram shifting (HS) algorithm is usually implementedon the histogram of grayscale values or predictive errors ofthe pixels. The precise rhombus predictor developed in [9] isemployed in our proposed scheme to generate a much shaperhistogram for efficient HS based embedding, which will beillustrated in Section IV. In the section, we concentrate on thedevelopment of the rate and distortion model for HS basedmultiple embedding.
1) HS embedding with single pair of peak and zero bins:Based on a histogram of predictive errors, HS is performed
to hide secret data. Before HS embedding, a peak bin withnon-zero frequency and a zero bin with zero frequency in thehistogram should be determined and denoted as (P1, Z1). HSthen shifts the histogram bins between P1 and Z1 towardsZ1 direction by one unit to create a vacant position nearP1. Finally, each predictive error is scanned to embed 1-bitmessage w when P1 is encountered. Let pe(r, s) and pe′(r, s)represent an original predictive error and the corresponding
3
marked one at (r, s), respectively. As illustrated in Fig.1, whenP1 < Z1, HS is performed by
In the case of P1 > Z1, HS is similarly implemented.For the histogram shifting process with (P1, Z1) as side
information, the embedding payload (rate) is calculated as
Payload = h(P1), (2)
where h(P ) denotes the frequency of occurrence for value Pin histogram.
For an 8-bit grayscale image, predictive errors are locatedin the range [−255, 255]. To compute the distortion due tohistogram shifting, the shift of each shifted bin for singleembedding denoted as ∆(i) should be evaluated. For the secretmessage w = {w} of length C, when P1 < Z1, the actual HSembedding can be well illustrated in Fig.1, where all the binslocated in the range [P1+1, Z1−1] are shifted towards positiveinfinity by 1. With the assumption that the ‘0’ and ‘1’ in themessage w are equally distributed, only half of the peak binsP1 are shifted by 1,we then have the average shift at peak binP1
δ(P1) = +1
2P1 < Z1. (3)
Therefore, when P1 < Z1, the shift for HS single embed-ding is
∆(i) =
δ(P1) i = P1
1 i ∈ [P1 + 1, Z1 − 1]0 otherwise
. (4-1)
Similarly, we have the shift evaluation for P1 > Z1
∆(i) =
−δ(P1) i = P1
−1 i ∈ [Z1 + 1, P1 − 1]0 otherwise
. (4-2)
Fig. 1. The HS embedding process in the case of P1 < Z1
With the evaluated shift ∆(i), it is readily seen that thedistortion D corresponding to the HS based single embeddingas shown in Fig.1 can be computed as
D=∑
i∈[P1,Z1−1]
h(i)×(∆(i))2 =∑
i∈[P1+1,Z1−1]
h(i)+1
2×C , (5)
where∑h(i) and 1
2 ×C in (5) denote the shifting distortionfor bins in the range [P1 +1, Z1−1] and embedding distortionat peak bin P1, respectively.
2) HS based multiple embedding:When data payload is large, multiple embedding method
is introduced, which utilizes several pairs of different peakand zero bins at a time and performs several levels of HSembedding consecutively based on the resulting histogramuntil all the selected peak and zero bin pairs are exhausted.For the several pairs of peak and zero bins involved in theHS based multiple embedding, each pair of peak and zerobins corresponds to one embedding level and affects oneanother, which should be taken into account and well trackedin distortion evaluation.
Fig.2 shows an example of HS based multiple em-bedding with two pairs of peak and zero bins. First-ly, two pairs of different peak and zero bins in thehistogram are determined at a time and defined as{(Pk, Zk) |k∈ [1, 2], P1 6=P2 and Z1 6=Z2}.Then one pair ofpeak and zero bins, i.e., (P1, Z1), is chosen to perform thefirst level embedding, which makes P2 shift to P ′2 = (P2 + 1)in that P2 locates in [P1+1, Z1−1]. Consequently, the peak binfor next embedding level should be replaced by P ′2 = (P2 +1)instead of P2, which is referred to as “peak-bin drift” in ourpaper. Similarly we have “zero-bin drift”. Based on (P ′2, Z2),the second level embedding is performed on the resultinghistogram.
Original:
Level 1:
Level 2:
Fig. 2. An example of multiple embedding with two pairs of peak and zerobins
It is observed that each bin including the peak and zero inthe histogram may experience several shifting for HS basedmultiple embedding, and the distortion introduced by eachshifting should be processed separately through tracking thecorresponding peak and zero bin “drift” caused by previousshifting. To compute the distortion with two-level embeddingas shown in Fig.2 (the same for m-level embedding, m > 2),however, the accumulated shifts of each shifted bin should beevaluated, which is defined as
∆bin = {∆bini | i ∈ [−255, 255]}, (6)
where ∆bini represents the accumulated shifts of the ith bin.By consecutively implementing two single HS embedding
with (P1, Z1) and (P2 +1, Z2), and taking into account of thebin shifts arising from each single HS embedding, we have
∆bini =
+δ(P1) i = P1
+1 i ∈ [P1 + 1, P2 − 1]+1 + δ(P2) i = P2
+1 + 1 i ∈ [P2 + 1, Z1 − 1]+1 i ∈ [Z1 + 1, Z2 − 1]0 otherwise
. (7)
It is noted that, to compute the accumulated shifts of eachbin, the “peak bin drift” for P2 is required to be tracked and
4
its effects should be taken into account. Thus the distortion Dcaused by the two-level embedding process is computed by
D =∑
i∈[−255,255]
h(i)×(∆bini)2 =
∑i∈[−255,255]
∆bini=Fix(∆bini)
h(i)×(∆bini)2+
∑∆bini 6=Fix(∆bini)
Di
=∑
i∈[−255,255]i/∈{P1,P2}
h(i)×(∆bini)2+(DP1 +DP2)
, (8)
where DPk(k = 1, 2) denotes the embedding distortion at the
peak bin Pk and Fix(•) is the round function that rounds itsinputs toward zero, e.g. Fix(3.6) = 3 and Fix(−3.6) = −3.With Fix(•), it is easy to identify bin i as peak bin if thecondition ∆bini 6= Fix(∆bini) is met (Note that accumulateshift in peak bin is not integer as shown in Equ.(7)). Withoutloss of generality, let d = Fix(∆bini), (i = Pk) for the peakbin Pk, DPk
(k = 1, 2) can be individually computed by
DPk=
{12×h(Pi)×(d)2+1
2×h(Pi)×(d+1)2, ∆bini>Fix(∆bini)12×h(Pi)×(d)2+1
2×h(Pi)×(d−1)2, ∆bini<Fix(∆bini),
(9)where k ∈ [1, 2].
For a HS based multiple embedding with m pairsof peak and zero bins as side information, i.e.,{(Pk, Zk) | 1 ≤ k ≤ m}, its embedding payload (rate) is
Payload =
m∑i=1
h(Pi). (10)
While the distortion for m-level multiple embedding can beevaluated based on its accumulated shift array ∆bin, i.e.,
D =∑
i∈[−255,255]
h(i)× (∆bini)2
=∑
i∈[−255,255]i/∈{Pk|k∈[1,m]}
h(i)× (∆bini)2 +
m∑k=1
DPk,
(11)
where the distortion DPk(k = 1, 2, . . . ,m) due to peak bin
shift can be similarly obtained as (9).According to aforementioned, to exactly evaluate the dis-
tortion for multiple embedding with fixed m pairs of peakand zero bins, the accumulated shifts for each bin, i.e., theshift array ∆bin should be computed, which is cumbersomeand time-consuming. The computation involves the trackingof both “peak-bin drift” and “zero-bin drift”, dynamicallyupdating the peak and zero bins for each embedding level andthe actual implementation of m-level multiple shifting. A closeobservation of the two-level embedding process as shown inFig.2, however, suggests that the accumulated shifts of eachbin for HS based multiple embedding looks like to be obtainedin a “de-coupled” way. Proposition 1 in next subsection willbe put forward to confirm the conjecture and the associatedfast algorithm will then be developed in next subsection tocompute the distortion for HS based multiple embedding. Forgiven m peak and zero bins, another important issue in rate anddistortion optimization is the evaluation of distortion when dif-ferent peak and zero bins are paired and sequentially arrangedin the process of multiple embedding. The problem is highly
challenging since the inherent combinatorial nature often bearsprohibitive computational complexity and renders the problemintractable. And Proposition 2 will also be proposed to tacklethe issue for rate and distortion optimization of HS basedmultiple embedding.
B. Main results of fast distortion computation for HS basedmultiple embedding
In this subsection, two propositions and the associated algo-rithms are presented to cope with the issues of fast distortioncomputation for HS based multiple embedding with fixed mpairs of peak and zero bins, and the fast distortion evaluationwhen different peak and zero bins are paired and sequentiallyarranged for given m peak and zero bins, respectively.
Proposition 1. For a HS based multiple embedding withhistogram H , and fixed m pairs of peak and zero bins as sideinformation, denoted as {(Pk, Zk)|1≤k≤m},Pi 6=Pj ,Zi 6=Zj ,i 6= j and i, j ∈ [1,m], the accumulated shifts ∆bini for bini after m-level embedding are equivalent to the sum of mindependent shift ∆k(i) due to HS single embedding withinitial histogram H and (Pk, Zk), i.e., ∆bini =
∑mk=1 ∆k(i),
where ∆k(i) denotes the shift of the kth-level embedding with(Pk, Zk) and is calculated with (4-1) or (4-2). �
In the interest of focused presentation, the strict mathemat-ical proof for Proposition 1 is included in the supplementaryfile (available at http://ieeexplore.ieee.org). Based on that, afast algorithm can be developed to evaluate the accumulatedshifts of each bin for HS based multiple embedding. Instead ofactually performing the multiple embedding and dynamicallytracking the “peak-bin drift” and “zero-bin drift”, our approachonly involves the computation of the bin shift for m indepen-dent HS single embedding with the same initial histogram Husing (4-1) or (4-2), and finally adds the shifts together toobtain the accumulated shifts. With the accumulated shifts,the overall distortion is then obtained using (11).
We then proceed to investigate the distortion computationfor HS based multiple embedding with given m peak andzero bins when different peak and zero bins are pairedand sequentially arranged, which is effectively resolved withProposition 2 below.
Proposition 2. Let P={P1,P2,. . .,Pm} and Z={Z1,Z2,. . .,Zm},Pi 6= Pj ,Zi 6= Zj ,i 6= j and i, j ∈ [1,m], be the given m peakand zero bins. For HS based multiple embedding with m pairsof peak and zero bins, different permutation of P and Z leadsto an identical distortion. �
Note that the P and Z above are ordered sets with theirelements in the set from left to right indicating the sequentialorder in the implementation of HS based multiple embedding.With Proposition 2, the computational complexity of distortionevaluation for the HS based multiple embedding with given mpeak and zero bins is substantially decreased by Am
m × Amm,
where Akn is the number of k permutations of n. Therefore, the
solution space is significantly reduced accordingly. Proposition2 itself can also be strictly proved using mathematical induc-tion. Since it is rather technical, the details are presented inthe supplementary file (available at http://ieeexplore.ieee.org).
5
C. Rate and distortion optimization
On the basis of the developed rate and distortion modelfor HS based multiple embedding, we have the rate anddistortion optimization for payload-limited embedding. Beforeformulating the optimization problem, the range for the tunableparameters, i.e., Pk, Zk, and m, should be defined. Let thenumber of peak and zero bin pairs m in the predefined range[1,Mmax]. For the histogram of a carrier image (predictionerrors) with bins located in the range [−255, 255], all thebins with zero frequency are candidates for zero bins, i.e.,Zero Set = {Zk | k ∈ [1, l]}, where l denotes the numberof the candidate zero bins in the histogram. While other binsexcept zero ones are considered as the candidates for peakbins and denoted as Peak Set = {Pk | k ∈ [1, 511− l]}.
Payload-limited embedding. In practice, the HS basedmultiple reversible data hiding can usually be formulated asthe payload-limited embedding, i.e.,
min{(Pk,Zk),m|k∈[1,m]}
D[(Pk, Zk)k=1,...,m]
Pk ∈ Peak Set, Zk ∈ Zero Set,m ∈ [1,Mmax]
s.t.m∑
k=1
h(Pk) ≥ C
Pi 6= Pj , Zi 6= Zj , i 6= j and i, j ∈ [1,m]
, (12)
where D is the distortion calculated with the Proposition 1(for accumulated shifts) and distortion model (11). The rateand distortion optimization problem in (12) is to determine thenumber of peak and zero bin pairs m among the predefinedrange [1,Mmax] and the corresponding values of peak andzero bins {(Pk, Zk)|k∈[1,m]} from Peak Set and Zero Setthat embeds a given payload C while minimizing the distortionD. Therefore, if m is fixed, the size of solution space for (12)is Am
l ×Am511−l. Take the predictive errors of Lena image as
example, where l = 92, the size of solution space is approxi-mately A10
92×A10511−92 = 3.0466×1032 in the case of m = 10. In
addition, to optimize the rate and distortion performance, it isdesirable to try all the possible pair number m among the range(m ∈ [1,Mmax]) and thus the size of total solution spaceis
∑Mmax
m=1 Aml ×Am
511−l. On the other hand, the combinatorialnature of the problem also makes the conventional approaches,such as gradient based or numerical search methods, fail toachieve good results. Therefore, the evolutionary optimizationalgorithm, such as genetic algorithm (GA), is adopted to solvethe rate and distortion optimization problem in (12) in nextsection. It is worth noting that, although other evolutionaryalgorithms, such as particle swarm optimization (PSO), couldalso be utilized, our simulation results indicate that both GAand PSO have comparable rate and distortion performance forHS based multiple reversible embedding. If a specific optimal(or sub-optimal) solution with given m pairs of peak and zerobins exists, then according to Proposition 2 and (10), differentcombinations between these peak and zero bins lead to thesame rate and distortion performance. Therefore, the chanceto find an optimal solution is substantially increased for GA, orequivalently the solution space size is reduced dramatically to∑Mmax
m=1 Cml ×Cm
511−l(Ckn is the number of k combinations of
n), which is more preferable for practical application of GA.By taking advantage of fast convergence and powerful global
search ability of GA, we could not only adaptively determinethe nearly optimal number of peak and zero bin pairs but alsotheir corresponding values for a given payload.
III. RATE AND DISTORTION OPTIMIZATIONUSING GENETIC ALGORITHM
A. The framework of the proposed genetic algorithm
Aiming to optimize the rate and distortion performancedescribed in (12), we design a genetic algorithm (GA) to au-tomatically determine the tunable parameters, i.e., the numberof peak and zero bin pairs m and their corresponding values.During the GA process, the two constraints on payload andassignment of peak and zero bins as shown in (12) should bespecially considered.
Our genetic algorithm follows the framework of convention-al genetic methodology as described in [25], which includesseveral problem oriented designs. Starting with an initialrandomly generated pool of population, into which somespecifically designed empirical chromosomes with good genesare added to ensure better convergence for GA implementa-tion. Let g,Gmax, N and Mmax denote the current generationnumber, the maximum generation number, the amount ofindividuals in the initial population and the predefined upperbound of peak and zero bin number m, respectively. Theoverall structure of the proposed genetic algorithm includes:1) initialization; 2) empirical chromosomes addition; 3) evalu-ation of the population; 4) parents’ selection for reproduction;5) crossover and mutation; and 6) selection for next generationconstruction, which is well illustrated in Fig.3. In the next sub-section, we will describe some problem oriented designs forour GA scheme different from the conventional ones.
B. Chromosome encoding
To solve the rate and distortion optimization problem de-scribed in (12) using GA, all the tunable parameters, i.e., thenumber of peak and zero bin pairs and the correspondingvalues of peak and zero bins should be represented withchromosome encoding. The chromosome vector consists of3Mmax elements (genes) and is defined as:
Ct = (It,Pt,Zt)It = {ik | ik ∈ {0, 1} and k ∈ [1,Mmax]}Pt = {Pk | Pk ∈ Peak Set and k ∈ [1,Mmax]}Zt = {Zk | Zk ∈ Zero Set and k ∈ [1,Mmax]}
, (13)
where Ct refers to the tth individual chromosome in apopulation. It is actually a composite chromosome consistingof three different types of chromosomes. The first section ofCt, i.e., It is designed for indicating bits, while Pt and Zt
each includes at most Mmax different peak and zero binschosen from the Peak Set and Zero Set , respectively.
The element ik =‘1’ in It indicates that kth pair of peakand zero bins (Pk, Zk) from Pt and Zt would be activated forHS based multiple embedding, otherwise, the pair (Pk, Zk)is ignored. With the adoption of indication bits It in thechromosome, the number of involved peak and zero bin pairsfor multiple embedding could be dynamically adjusted in therange [1,Mmax].
6
Fig. 3. Flowchart of the proposed GA scheme
C. Empirical chromosomes addition
We then proceed to investigate the way to improve the ca-pability of the proposed GA to find the nearly optimal solutionby introducing some empirical chromosomes with good genes.When the payload C is large, the constraint
∑mi=1h(Pi)≥C
specifies a relatively tiny feasible solution space comparedwith the entire solution space
∑Mmax
m=1 Cml ×Cm
511−l, it is usuallydifficult to find even the feasible solution, let alone the optimalone based on the randomly selected initial chromosomesthrough limited generations of evolution with GA. Let F Cdenote the feasible solution space size corresponding to theconstraint
∑mi=1h(Pi)≥C, the probability of reaching the
feasible solutions by randomly selected initial chromosomesis
prob =F C∑Mmax
m=1 Cml ×Cm
511−l, (14)
where the denominator∑Mmax
m=1 Cml ×Cm
511−l is the size of theentire solution space as mentioned in Section II-C. Accordingto our experiments, it is usually difficult for GA to find thefeasible solutions within finite generations of evolution withrandomly selected initial chromosomes when the payload isrelative large, e.g., C ≥ 2×105 bits for cover image Lena of512×512×8 bit.
To solve the problem, we manually construct a group of em-pirical individuals (chromosomes), which include the peak andzero bins determined using some existing criterion [13] andare adopted in the initial population. In our implementation,at most Mmax empirical individuals are introduced, where thechromosome Ct, t ∈ [1,Mmax] includes t different peak binswith highest frequency from Peak Set and t different zero
bins closest to the corresponding peak bins from Zero Set,respectively.
The adoption of empirical chromosomes shows some ad-vantages. One is that, rather than a completely random search,these chromosomes indicate the search direction towards thefeasible solutions space (i.e.,
∑mi=1 h(Pi) ≥ C) and ensure
stable convergence for GA when the payload is large. Next, theevolution mechanism of GA generally guarantees to achieve abetter performance than the ones with the empirical peak andzero bins in the initial population.
D. Fitness Evaluation
The objective of the proposed GA process is to find thenearly optimal solution in terms of multiple pairs of peakand zero bins associated with the minimal distortion D. Theinvolved selection scheme, such as roulette wheel selection,however, tends to choose the chromosome with higher fitnessvalue. Thus the distortion D itself cannot be taken directly asthe fitness value. Let Dmax be the possible maximal distortionfor the given HS based multiple embedding in one generation,a proper fitness value can be defined as follows
fitness = Dmax −D . (15)
In addition, to ensure the feasible output satisfying thepayload constraint
∑mi=1 h(Pi)≥C in (12), the penalty with
predefined large value, say 107, is assigned to the distortionD of the infeasible chromosomes, which makes them beeliminated with high probability during the selection process.
IV. EMBEDDING AND EXTRACTION PROCESSES
In general, our GA based rate and distortion optimizationscheme is independent of the carrier images, either in pixel orprediction domain. The accurate rhombus prediction proposedin [9] is incorporated in our work to generate the predictionerrors with much shaper histogram which would lead tosignificant performance improvement for HS based multipleembedding. To perform rhombus prediction, the pixels in animage are divided into two sets, i.e., the Cross set (X) and theRound set (O) as shown in Fig.4(a). Hereinafter, we denotethe pixels and prediction errors in these two sets as PZ andPEZ(Z = ‘X’ or ‘O’), respectively. Each pixel in Cross set ispredicted with its four neighboring pixels in Dot set as shownin Fig.4(b) and vice versa.
(16)where round(•) is the function that returns the nearest integerof the input. The corresponding prediction error PEX(i, j) iscomputed as follows
PEX(i, j) = PX(i, j)− PX(i, j) . (17)
As the performance of the proposed GA scheme dependsheavily on the carrier image, we also sort the predictionerrors in their local variances ascending order [9] and takethe top χ(%) of the prediction errors for HS based multipleembedding. According to our experiments, the optimum χ(%)is in the collections Λ1 = {10, 20, 30, 40, 50} for low data
7
(a) (b)
Fig. 4. The sketch of rhombus prediction
payload (< 0.1 bpp) and Λ2 = {50, 60, 70, 80, 90, 100} formedium to high payload applications (≥ 0.1 bpp), respectively.
A. Embedding Process
For a 8-bit grayscale cover image and the binary secretmessage w of length C, the embedding process is describedbriefly as follows.
1) Initialization. With the cover image in Cross and Roundsets as shown in Fig.4(a), assign half of the secretmessage of length 1/2 × C for Cross and Round setsembedding, respectively.
2) Rhombus prediction of the Cross set. As shown inFig.4(b), each pixel in the Cross set is predicted byits four neighboring pixels in Round set to obtain thePX(r, s) and then the prediction error PEX(r, s) in theCross set.
3) Optimal peak and zero bins selection. Based on thehistogram of prediction errors in the Cross set, i.e.,PEX ={PEX(r, s)}, the GA based rate and distortionoptimization is carried out to determine the nearlyoptimal number of peak and zero bin pairs and theircorresponding values for the payload of length 1
2C.4) Cross set embedding. To hide the message into
the prediction errors PEX , the accumulated shifts∆bin = {∆bini} for each bin after the multiple em-bedding are calculated by application of Proposition 1to generate the marked prediction errors in Cross set.Let PEX(r, s) = i, we have
PE′X(r,s)=
PEX(r,s)+∆bini, ∆bini=Fix(∆bini)
PEX(r,s)+Fix(∆bini)+w,∆bini>Fix(∆bini),
PEX(r,s)+Fix(∆bini)−w,∆bini<Fix(∆bini)(18)
where w denotes 1-bit secret data, ∆bini is the accu-mulated shifts of bin i.
5) Stego-pixels generation in the Cross set. With markedprediction errors, we have the stego-pixels in the cross set
P ′X(r, s) = PE′X(r, s) + PX(r, s) . (19)
6) Stego-pixels generation in the Round set. Utilize thegenerated stego-pixels in the Cross set to predict thepixels in Round set as mentioned in Step 2 and repeatStep 3-5 to generate the stego-pixels P ′O(r, s) in theRound set.
7) Stego image generation. Combine the stego-pixels inboth Cross and Round sets, i.e., P ′X and P ′O to obtainthe whole stego-image.
Note that, the above GA based multiple embedding shouldbe tested for the possible χ in Λ(Λ1 or Λ2) to determine theoptimum χopt in terms of rate and distortion performance. Fora given payload, we take the same percentage χ in both Crossand Round sets to simplify the implementation. Besides, theLuo’s method [19] is also employed in the embedding processto avoid the possible overflow/underflow for the generatedstego image, in which, a location map is introduced to indicatethe overflowed/underflowed pixels and then hidden in thecarrier images as the additional side information.
B. Extraction Process
Based on the received optimal χopt, peak and zero bins andthe stego-image, we extract the secret message and recoverthe original image in the inverse order as embedding process,namely the marked Round set is recovered and message isextracted first, which is then used to reconstruct the markedCross set and extract the corresponding hidden message.
V. EXPERIMENTAL RESULTS AND ANALYSIS
To evaluate the proposed rate and distortion optimizationscheme, we test several 512×512×8 bits grayscale imageswith different texture characteristics from SIPI database [26]and 100 512×512×8 bits grayscale images randomly selectedfrom Bossbase ver.1.01 [27]. By comparing the proposedscheme with some state-of-the-art reversible data hiding meth-ods, the superiority of our scheme is verified.
A. Parameters’ setting and empirical chromosomes additionfor Genetic Algorithm
Before comparing it to prior works, we first discuss theparameters’ setting of our GA based multiple embeddingscheme. To simplify the analysis, we set most of the GAparameters experimentally, e.g., population size, crossoverrate, mutation rate, maximum pair number Mmax and themaximum generation number Gmax, as shown in Table I. Inaddition, the effectiveness of empirical chromosomes additionis also investigated.
TABLE IPARAMETERS’ SETTING OF THE PROPOSED GENETIC ALGORITHM
Parameters ValuesPopulation size N 100
Maximal pair number Mmax 20Mutation rate m rate 0.1Crossover rate c rate 0.8
Maximum generation number Gmax 100
For a small payload of C/2 = 104 bits (i.e., 0.076 bit-s/pixel) embedded in the Cross set of Lena, Fig.5 givesthe convergence results when initial empirical chromosomes(good seeds) are not included /and included, respectively. TheMmax = 20 pairs of different peak and zero bins described
8
0 2 0 4 0 6 0 8 0 1 0 02
4
6
8
1 0
1 2
1 4
distor
tion(1
04 )
C o v e r i m a g e : L e n a
g e n e r a t i o n
p e r f o r m a n c e w i t h r a n d o m i n i t i a l c h r o m o s o m e sp e r f o r m a n c e w i t h e m p i r i c a l i n i t i a l c h r o m o s o m e s
Fig. 5. The distortion versus the number of generation for test image Lena atsmall payload (0.076 bits/pixel)
0 2 0 4 0 6 0 8 0 1 0 0 1 2 0
1 0 . 2
1 0 . 5
1 0 . 8
9 9
1 0 2
1 0 5C o v e r i m a g e : L e n a
distor
tion(1
05 )
g e n e r a t i o n
p e r f o r m a n c e w i t h r a n d o m i n i t i a l c h r o m o s o m e sp e r f o r m a n c e w i t h e m p i r i c a l i n i t i a l c h r o m o s o m e s
Fig. 6. The distortion versus the number of generation for test image Lena atlarge payload (0.763 bits/pixel)
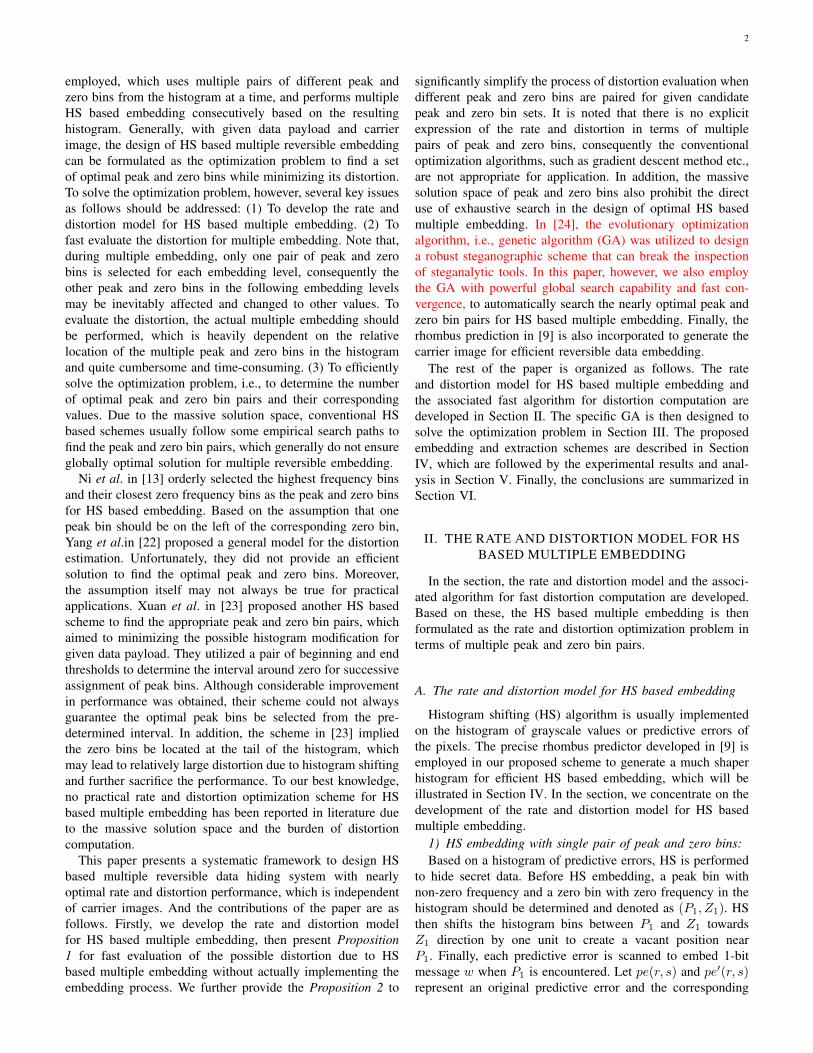
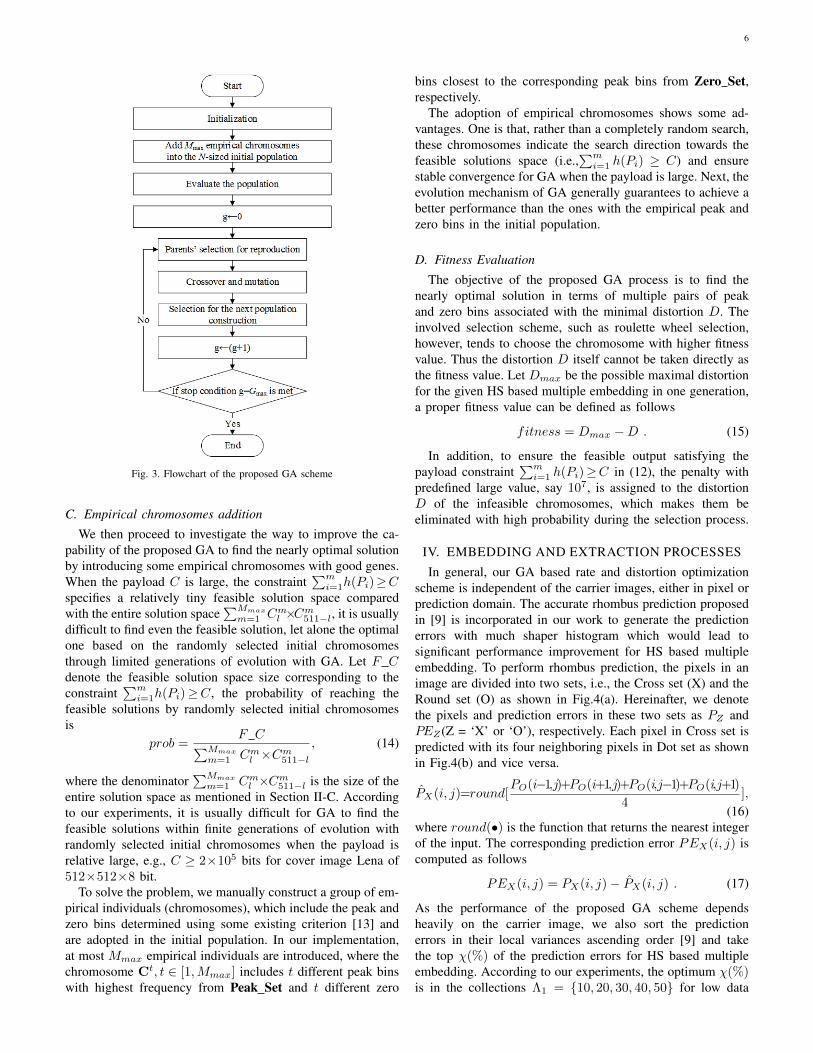
in III.C [13] are utilized as the initial “good” chromosomesin our implementation. It is observed that, whether the initialempirical chromosomes are included or not, the GA basedmultiple embedding scheme converges within a rather limitedgenerations of evolution. The adoption of some initial “good”seeds, however, would speed up considerably the convergenceand achieve a better performance in terms of distortion.This is because, compared with the randomly selected seeds(chromosomes), the introduction of those “good” seeds intothe initial population can provide better genes for evolutionand thus a better solution is easier to be reached withhigher probability. For a large payload, say C/2 ≥105(i.e.,0.763 bits/pixel), however, the implementation of the proposedscheme is heavily dependent on the help of some initial “good”seeds. The payload constraint itself, i.e.,
∑mi=1 h(Pi) ≥ C,
makes it difficult for the GA based scheme to find a payloadfeasible solution based on the randomly selected initial seedswithin limited generations of evolution. Fig.6 includes thecorresponding convergence performance, where the distortionsare consistently around the predefined penalty value, i.e.,107, even after 100 generations of evolution. In contrast, theaddition of specifically designed seeds in the initial populationcan not only meet the payload constraint but also quickly reachthe nearly optimal solution and ensure the stable convergenceas shown in Fig.6. Therefore, the effectiveness of empirical
chromosomes addition is verified. In addition, according toour experimental results, the maximum generation numberGmax=70 is sufficient to obtain the stable convergence formedium textured images, such as Lena. While Gmax is alittle bit larger in the range [70, 100] for other highly texturedimages, such as Baboon, owing to the slower convergence speed.
B. Comparison with other related schemes
We first compare our GA based multiple embedding schemewith three typical methods (Ni et al. [13], Xuan et al. [23] andSachnev et al. [9]) in terms of peak and zero bins selectionfor various payloads. In the interest of fair comparison, ourscheme (with χ(%) ∈ Λ1 ∪ Λ2) and other related methodsare implemented on the same Cross set of test images withrhombus prediction. Table II summarizes the rate (payload)and distortion performance of the involved schemes and thecorresponding values of peak and zero bins for image Lena.
It is noted that the distortion performance of our scheme inTable II is the average over 10 experiments for each payloadand represents in the form “Mean ± Standard Deviation”.While the listed peak and zero bins of our scheme correspondto the solution whose distortion is closest to the average onefor each payload.
It is demonstrated in Table II that our GA based schemeachieves the best rate and distortion performance for variousdata payloads. Compared with the proposed scheme, both themethods in [13] and [9] determine the peak bins based on someempirical rules. Ni et al. [13] uses in priority the peak binswith higher frequency, while the DE method in [9] is actuallya special case of HS with the peak bins fixedly selected froman interval [Tn, 0]∪ [0, Tp], (Tn < 0 and Tp ≥ 0) around zero,where Tn and Tp are pre-defined thresholds. Although themethod in [23] shows some adaptability in peak bin selection,the employed peak bins are also confined and successivelyassigned from an interval determined. Moreover, the peak binsemployed in [9], [13] and [23] are generally located around0 and the zero bins in [9] and [23] are selected from the tailof histogram, therefore the corresponding shifting distortion isfurther increased.
According to our understanding, the good rate and distortionperformance of our GA based multiple embedding can beachieved in two aspects. For one thing, instead of utilizing oneor two high frequency bins as peak bins which corresponds tohigh shifting distortions, several relatively low frequency binsmay be a better choice in the case of small data payload.For another, those two peak and zero bin pairs should bedetermined in priority, i.e.: (1) their associated shiftings arein the reverse direction with each other; (2) their associatedshiftings share as much overlapped bins with high frequencyas possible. For this example, the (P1, Z1) and (P2, Z2) asshown in Fig.7 are two peak and zero bin pairs shiftingin reverse direction. According to Proposition 1 in SectionII-B, the accumulated shifts in the overlapped bins between[P1, P2] can be eliminated, which gives rise to reduced shiftingdistortions. It is also observed in Table II that, for low datapayload (0.076bpp), rather than the high frequency bin 0, ourscheme selects two low frequency bins 3 and -3 as the peak
9
TABLE IITHE SELECTED PEAK AND ZERO BINS FOR INVOLVED SCHEMES IN THE CROSS SET OF IMAGE LENA WITH 512× 512× 8 BITS
Payload inbits (bpp) Schemes Selected peak and zero bins (P,Z) Distortion
bins and the bin shifts in reverse direction between [−3, 3]would offset each other. As the prediction errors of naturalimages are Laplacian distributed, and the highest frequencybins are located close to bin 0, the shifting distortions arethus significantly reduced. The same happened to the mediumpayload embedding (0.23bpp and 0.458bpp in Table II). Notethat, for the case of 0.076bpp and 0.23bpp, although the peakand zero bins in (-3,-136)1 and (6,81) are far apart from eachother, the bins in between each of these two peak and zero binpairs are sparse and have low frequency, which correspondsto much less shifting distortions.
Fig. 7. The illustration of bin shift cancellation
We then proceed to compare the comprehensive perfor-mance between our scheme and some state-of-the-art re-versible data hiding methods, which include two DE basedmethods in predictive errors (Sachnev et al. [9] and Li etal.[12]), three HS based methods (Wu et al. [18], Luo et al.[19] and Xuan et al. [23]). In our implementation of the GA
1The original peak and zero bin pair is (3,-136), and the shifts in [-3,3] arecanceled.
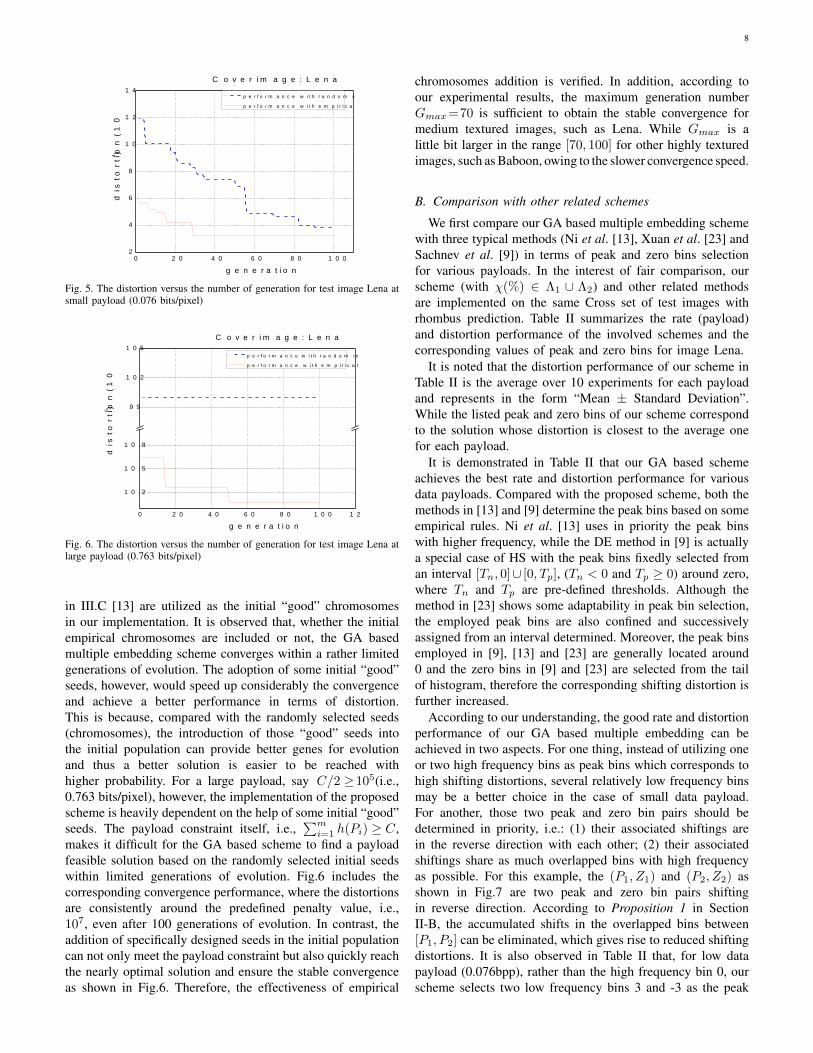
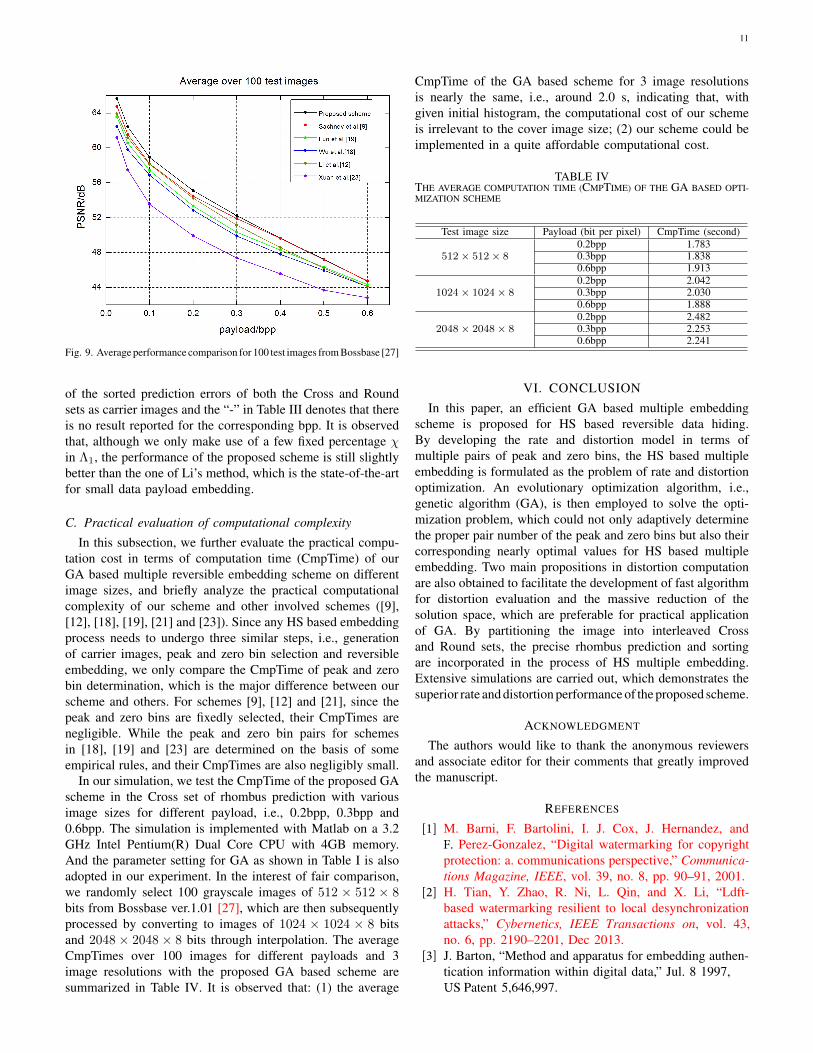
based embedding scheme, both the Cross and Round sets ofcover images are utilized with rhombus prediction and sortingto ensure the better rate and distortion performance (referto section IV-A). Note that the embedding payload is theeffective one except the location (boundary) map and multiplepeak and zero bins. For small to medium data payload, i.e.,ER(Embedding Rate)≤ 0.4 bpp, which is ideal for HS basedmultiple embedding and most commonly used in practicalapplications, our scheme achieves the best rate and distortionperformance among all the methods, for the test images Lena,Baboon, F16 and Peppers as shown in Fig.8. The samehappened to the average performance comparison with 100 testimages randomly selected from image database BOSSbase ver.1.01 [27], as illustrated in Fig.9. It is observed that, for largedata payload (ER>0.4 bpp), although our scheme outperformsconsistently the other three HS based methods [18, 23, 25], itsperformance tends to be similar to Sachnev et al.’s method [9].This is because the proposed scheme and the method in [9] areall implemented on the errors of rhombus prediction. At highembedding rate, the important bins with high frequency in thehistogram should be utilized by all the involved schemes tohide large payload. Under these circumstances, our schemecould not exemplify its advantage in peak and zero binselection. It is also observed that the proposed scheme cannotcompete Li et al’s method [12] for Pepper image at highdata payload. This is because the Pepper image has manypotentially overflowed/underflowed pixels located around bothsides of the histogram, i.e. 0 and 255. Instead of embeddingonly 1 bit at a pixel with our scheme, Li et al’s methodcould choose the appropriate smooth areas in images to hidemore than 1 bit data at a pixel, thus Li et al’s method mayutilize much less potentially overflowed/underflowed pixels
10
Fig. 8. Performance comparison between the proposed scheme and other related schemes
TABLE IIITHE COMPARISON BETWEEN OUR PROPOSED SCHEME AND LI et al’s METHOD [21] FOR SMALL PAYLOAD
Test images Algorithm 0.5× 104bits(0.019bpp)
1.0× 104bits(0.038bpp)
1.5× 104bits(0.057bpp)
2.5× 104bits(0.095bpp)
LenaLi et al’s method [21] (dB) 63.119 59.703 57.684 55.149
Proposed scheme (dB)Percentage (χ)
63.376(30%)
60.089(30%)
58.021(40%)
55.212(40%)
BaboonLi et al’s method [21] (dB) 58.684 53.924 - -
Proposed scheme (dB)Percentage (χ)
59.066(20%)
55.081(30%)
52.289(50%)
48.087(50%)
F16Li et al’s method [21] (dB) 66.587 63.161 60.940 57.923
Proposed scheme (dB)Percentage (χ)
65.909(10%)
62.959(20%)
60.768(30%)
57.945(50%)
PeppersLi et al’s method [21] (dB) 60.667 57.160 55.006 51.689
Proposed scheme (dB)Percentage (χ)
61.487(30%)
57.516(40%)
55.929(50%)
51.507(50%)
than our scheme, which leads to a less sized location map.Consequently, Li et al’s method may outperform ours for someimages with much more boundary pixels, such as Pepper, athigh data payload.
For small data payload (ER< 0.1bpp), we further comparethe performance of our GA based scheme with the one of Li’smethod [21], which is summarized in Table III. Note that, forsmall data payload embedding, we take the top χ(%)(χ ∈ Λ1)
11
Fig. 9. Average performance comparison for 100 test images from Bossbase [27]
of the sorted prediction errors of both the Cross and Roundsets as carrier images and the “-” in Table III denotes that thereis no result reported for the corresponding bpp. It is observedthat, although we only make use of a few fixed percentage χin Λ1, the performance of the proposed scheme is still slightlybetter than the one of Li’s method, which is the state-of-the-artfor small data payload embedding.
C. Practical evaluation of computational complexity
In this subsection, we further evaluate the practical compu-tation cost in terms of computation time (CmpTime) of ourGA based multiple reversible embedding scheme on differentimage sizes, and briefly analyze the practical computationalcomplexity of our scheme and other involved schemes ([9],[12], [18], [19], [21] and [23]). Since any HS based embeddingprocess needs to undergo three similar steps, i.e., generationof carrier images, peak and zero bin selection and reversibleembedding, we only compare the CmpTime of peak and zerobin determination, which is the major difference between ourscheme and others. For schemes [9], [12] and [21], since thepeak and zero bins are fixedly selected, their CmpTimes arenegligible. While the peak and zero bin pairs for schemesin [18], [19] and [23] are determined on the basis of someempirical rules, and their CmpTimes are also negligibly small.
In our simulation, we test the CmpTime of the proposed GAscheme in the Cross set of rhombus prediction with variousimage sizes for different payload, i.e., 0.2bpp, 0.3bpp and0.6bpp. The simulation is implemented with Matlab on a 3.2GHz Intel Pentium(R) Dual Core CPU with 4GB memory.And the parameter setting for GA as shown in Table I is alsoadopted in our experiment. In the interest of fair comparison,we randomly select 100 grayscale images of 512 × 512 × 8bits from Bossbase ver.1.01 [27], which are then subsequentlyprocessed by converting to images of 1024 × 1024 × 8 bitsand 2048 × 2048 × 8 bits through interpolation. The averageCmpTimes over 100 images for different payloads and 3image resolutions with the proposed GA based scheme aresummarized in Table IV. It is observed that: (1) the average
CmpTime of the GA based scheme for 3 image resolutionsis nearly the same, i.e., around 2.0 s, indicating that, withgiven initial histogram, the computational cost of our schemeis irrelevant to the cover image size; (2) our scheme could beimplemented in a quite affordable computational cost.
TABLE IVTHE AVERAGE COMPUTATION TIME (CMPTIME) OF THE GA BASED OPTI-MIZATION SCHEME
Test image size Payload (bit per pixel) CmpTime (second)
512× 512× 80.2bpp 1.7830.3bpp 1.8380.6bpp 1.913
1024× 1024× 80.2bpp 2.0420.3bpp 2.0300.6bpp 1.888
2048× 2048× 80.2bpp 2.4820.3bpp 2.2530.6bpp 2.241
VI. CONCLUSIONIn this paper, an efficient GA based multiple embedding
scheme is proposed for HS based reversible data hiding.By developing the rate and distortion model in terms ofmultiple pairs of peak and zero bins, the HS based multipleembedding is formulated as the problem of rate and distortionoptimization. An evolutionary optimization algorithm, i.e.,genetic algorithm (GA), is then employed to solve the opti-mization problem, which could not only adaptively determinethe proper pair number of the peak and zero bins but also theircorresponding nearly optimal values for HS based multipleembedding. Two main propositions in distortion computationare also obtained to facilitate the development of fast algorithmfor distortion evaluation and the massive reduction of thesolution space, which are preferable for practical applicationof GA. By partitioning the image into interleaved Crossand Round sets, the precise rhombus prediction and sortingare incorporated in the process of HS multiple embedding.Extensive simulations are carried out, which demonstrates thesuperior rate and distortion performance of the proposed scheme.
ACKNOWLEDGMENT
The authors would like to thank the anonymous reviewersand associate editor for their comments that greatly improvedthe manuscript.
REFERENCES
[1] M. Barni, F. Bartolini, I. J. Cox, J. Hernandez, andF. Perez-Gonzalez, “Digital watermarking for copyright protection: a. communications perspective,” Communica-tions Magazine, IEEE, vol. 39, no. 8, pp. 90–91, 2001.
[2] H. Tian, Y. Zhao, R. Ni, L. Qin, and X. Li, “Ldft-based watermarking resilient to local desynchronization attacks,” Cybernetics, IEEE Transactions on, vol. 43, no. 6, pp. 2190–2201, Dec 2013.
[3] J. Barton, “Method and apparatus for embedding authen-tication information within digital data,” Jul. 8 1997, US Patent 5,646,997.
12
[4] J. Fridrich, M. Goljan, and R. Du, “Invertible authenti-cation,” in Proc. SPIE Photonics West, vol. 3971, no. 2,2001, pp. 197–208.
[5] M. U. Celik, G. Sharma, A. M. Tekalp, and E. Saber,“Lossless generalized-lsb data embedding,” Image Pro-cessing, IEEE Transactions on, vol. 14, no. 2, pp. 253–266, 2005.
[6] J. Tian, “Reversible data embedding using a differenceexpansion,” IEEE Trans. Circuits Syst. Video Techn.,vol. 13, no. 8, pp. 890–896, 2003.
[7] L. Kamstra and H. J. Heijmans, “Reversible data embed-ding into images using wavelet techniques and sorting,”Image Processing, IEEE Transactions on, vol. 14, no. 12,pp. 2082–2090, 2005.
[8] D. M. Thodi and J. J. Rodrıguez, “Expansion embeddingtechniques for reversible watermarking,” Image Process-ing, IEEE Transactions on, vol. 16, no. 3, pp. 721–730,2007.
[9] V. Sachnev, H. J. Kim, J. Nam, S. Suresh, and Y. Q. Shi,“Reversible watermarking algorithm using sorting andprediction,” Circuits and Systems for Video Technology,IEEE Transactions on, vol. 19, no. 7, pp. 989–999, 2009.
[10] Y. Hu, H.-K. Lee, and J. Li, “De-based reversible datahiding with improved overflow location map,” Circuitsand Systems for Video Technology, IEEE Transactionson, vol. 19, no. 2, pp. 250–260, 2009.
[11] D. Coltuc, “Improved embedding for prediction-basedreversible watermarking,” Information Forensics and Se-curity, IEEE Transactions on, vol. 6, no. 3, pp. 873–882,2011.
[12] X. Li, B. Yang, and T. Zeng, “Efficient reversible wa-termarking based on adaptive prediction-error expansionand pixel selection,” Image Processing, IEEE Transac-tions on, vol. 20, no. 12, pp. 3524–3533, 2011.
[13] Z. Ni, Y.-Q. Shi, N. Ansari, and W. Su, “Reversible datahiding,” Circuits and Systems for Video Technology, IEEETransactions on, vol. 16, no. 3, pp. 354–362, 2006.
[14] G. Xuan, Q. Yao, C. Yang, J. Gao, P. Chai, Y. Q.Shi, and Z. Ni, “Lossless data hiding using histogramshifting method based on integer wavelets,” in DigitalWatermarking. Springer, 2006, pp. 323–332.
[15] C.-C. Lin, W.-L. Tai, and C.-C. Chang, “Multilevelreversible data hiding based on histogram modification ofdifference images,” Pattern Recognition, vol. 41, no. 12,pp. 3582–3591, 2008.
[16] W.-L. Tai, C.-M. Yeh, and C.-C. Chang, “Reversibledata hiding based on histogram modification of pixeldifferences,” Circuits and Systems for Video Technology,IEEE Transactions on, vol. 19, no. 6, pp. 906–910, 2009.
[17] D.-G. Yeo, H.-Y. Lee, and B. M. Kim, “High capaci-ty reversible watermarking using differential histogramshifting and predicted error compensation,” Journal ofElectronic Imaging, vol. 20, no. 1, pp. 013 001–013 001,2011.
[18] H.-T. Wu and J. Huang, “Reversible image watermarkingon prediction errors by efficient histogram modification,”Signal Processing, vol. 92, no. 12, pp. 3000–3009, 2012.
[19] L. Luo, Z. Chen, M. Chen, X. Zeng, and Z. Xiong, “Re-
versible image watermarking using interpolation tech-nique,” Information Forensics and Security, IEEE Trans-actions on, vol. 5, no. 1, pp. 187–193, 2010.
[20] X. Gao, L. An, Y. Yuan, D. Tao, and X. Li, “Lossless data embedding using generalized statistical quantity histogram,” Circuits and Systems for Video Technology, IEEE Transactions on, vol. 21, no. 8, pp. 1061–1070, 2011.
[21] X. Li, W. Zhang, X. Gui, and B. Yang, “A novel reversible data hiding scheme based on two-dimensional difference-histogram modification,” Information Foren-sics and Security, IEEE Transactions on, vol. 8, no. 7, pp. 1091–1100, 2013.
[22] B. Yang, M. Schmucker, C. Busch, X. Niu, and S. Sun, “Approaching optimal value expansion for reversible watermarking,” in Proceedings of the 7th workshop on Multimedia and security. ACM, 2005, pp. 95–102.
[23] G. Xuan, Y. Q. Shi, P. Chai, J. Teng, Z. Ni, andX. Tong, “Optimum histogram pair based image lossless data embedding,” in Transactions on Data Hiding and Multimedia Security IV. Springer, 2009, pp. 84–102.
[24] Y.-T. Wu and F. Y. Shih, “Genetic algorithm based methodology for breaking the steganalytic systems,” Sys-tems, Man, and Cybernetics, Part B: Cybernetics, IEEE Transactions on, vol. 36, no. 1, pp. 24–31, 2006.
[25] D. E. Goldberg, Genetic Algorithms in Search, Optimiza-tion and Machine Learning, 1st ed. Boston, MA, USA: Addison-Wesley Longman Publishing Co., Inc., 1989.
[26] [Online]. Available: http://sipi.usc.edu/database/[27] P. Bas, T. Filler, and T. Pevny, “ break our
steganographic system: The ins and outs of organizing boss,” in Information Hiding. Springer, 2011, pp. 59–70. [Online]. Available: http://www.agents.cz/boss/
Junxiang Wang received the M.S. and Ph.D. de-grees from the Harbin Institute of Technology andSun Yat-Sen University in 2008 and 2012, respec-tively. He is currently an Associate Professor withthe School of Mechanical and Electronic Engineer-ing, Jingdezhen Ceramic Institute (JCI), Jiangxi,China. His research interests include informationsecurity and image processing.
Jiangqun Ni (M’12) received the Ph.D. degreein electronic engineering from the University ofHong Kong, Hong Kong, in 1998. He worked asa Postdoctoral Fellow for a joint program betweenthe Sun Yat-sen University and the Guangdong In-stitute of Telecommunication Research during 1998through 2000. Since 2001, he has been with theschool of Information Science and Technology, SunYat-sen University, Guangzhou, China, where he iscurrently a Professor. His research interests includedata hiding and digital image forensics, image-based
modeling and rendering, and image/video processing. He has published morethan 50 papers in these areas.
13
Xing Zhang received the B.S. degree in Commu-nication Engineering from Sun Yat-Sen University,Guangzhou, China, in 2013. He is currently pursuingthe M.S. degree with the School of InformationScience and Technology, Sun Yat-Sen University,Guangzhou, China. His current research interestsinclude digital watermarking and image processing.
Yun-Qing Shi (M’88-SM’92-F’05) has joined NewJersey Institute of Technology, USA, since 1987. Heobtained his M.S. degree from Shanghai Jiao TongUniversity, China; his Ph.D. degree from Universityof Pittsburgh, USA. His research interests includedigital data hiding, forensics and information assur-ance, visual signal processing and communications.He is an author/coauthor of 300 papers, one book,five book chapters, and an editor of 10 books. Heholds 28 US patents. He obtained Innovators Award2010 by New Jersey Inventors Hall of Fame for
Innovations in Digital Forensics and Security. His US patent 7,457,341 entitled“System and Method for Robust Reversible Data Hiding and Data Recoveryin the Spatial Domain” won 2010 Thomas Alva Edison Patent Award byResearch and Development Council of New Jersey. He served as an associateeditor of IEEE Transactions on Signal Processing and IEEE Transactionson Circuits and Systems (II), and a few other journals; also served as thetechnical program chair of IEEE ICME07, co-technical chair of IWDW06, 07,09, 10, 11, 12, 13 and IEEE MMSP05, co-general chair of IEEE MMSP02,a Distinguished Lecturer of IEEE CASS. He is a member of a few IEEEtechnical committees, and a Fellow of IEEE since 2005.


![Optimization of Radial Distortion Self-Calibration for …...are used in SfM [13]. For simplicity, we formulate the radial distortion model as: f (r 2) = 1+ k1 r (1) where r denotes](https://static.documents.pub/doc/80x56/60ee202470977f34a93a4c96/optimization-of-radial-distortion-self-calibration-for-are-used-in-sfm-13.jpg)


