1 GWM/Edelweiss Investment Research Edelweiss Investment Research Jindal Stainless (Hisar) (JSHL), an entity carved out of the erstwhile Jindal Stainless (JSL), is a leading player in the domestic stainless steel market. With 0.8mt capacity, the company has cornered 40% market share along with group company JSL(0.8mt). Government’s sharpening focus on metro railway, airports, modernisation of Railways along with burgenong usage of cookware and consumer durables are envisaged to spur the next leg of stainless steel market’s growth at 8% CAGR between FY17-FY23E. We expect JSHL’s volumes to clock 11% CAGR over FY17-19E riding incremental market share gains as demand shifts to organised players triggered by GST and imposition of 18% CVD on Chinese imports. We are valuing the stock at par with European listed counterparts at 7x EV/EBIDTA, yeilding value of INR289/share and investments in JSL at INR41/share to arrive at target price of INR329. We recommend ‘BUY’ with an upside of 61% from current level. Burgeoning government infra spending and rising consumerism to sustain buoyant stainless steel demand Domestic stainless steel (SS) consumption clocked 7.6% CAGR over 2005-16 to 3.3mtpa while per capita consumption stands at a paltry 1.9kg compared to the 6kg global avg. However, we expect India to follow in China’s footsteps—per capita consumption catapulted from mere 1.5kg in early 2000 to 9kg in 2016—spurred by govt’s enhanced investments in infrastructure and burgeoning per capita GDP. While SS continues to remain an alternative to plastic in cookware, its under penetration in medical, industrial and infra applications is bound to sustain the strong underlying demand momentum. Market leadership in value additive products JSHL, along with JSL, effectively controls 60% of the value added products market and 40% of the overall SS market in India. Balance is controlled by unorganised players and imports (~5 lakh tons), which have been disrupted due to onslaught of GST and imposition of 18% CVD on Chinese imports (~2.8 lakh tons), respectively, throwing opportunity for JSHL to grab incremental market share. We believe the company’s leadership in specialised products like razor blades, mint coins, Series 300/400,and process industries will boost EBIDTA/ton to INR15,300 by FY19E comparable to global standards. Outlook and valuations: Attractive, underlying momentum to sustain; maintain ‘BUY’ We expect JSHL’s net sales/EBIDTA/PAT to grow at a CAGR of 15%/19%/46% respectively between FY17-19E We believe, higher RoCE of JSHL (22%) (even on WACC adjusted basis)compared to European players(8-10%), burnished demand prospects and market leadership should lead to at par/premium valuation for the company with respect to European players. We are valuing the stock at par with European listed counterparts at 7x EV/EBIDTA, yielding value of INR289/share. Additionally, we value the company’s investments in JSL (36.5% stake) at INR41/share to arrive at tar get price of INR 329. We recommend ‘BUY’ with an upside of 61% from current level. Year to March FY15 FY16 FY17 FY18E FY19E Revenues (INR Cr) 8,196 7,235 7,774 9,036 10,339 Rev growth (%) NA (11.7) 7.5 16.2 14.4 EBITDA (INR Cr) 741 862 980 1,131 1,383 Net Profit (INR Cr) -22.6 125.4 290 408 621 P/E (x) NA NA 16.7 11.9 7.8 EV/EBITDA (x) 7.8 7.6 7.9 6.8 5.6 RoACE (%) NA 26.3 20.0 18.6 22.0 RoAE (%) NA 6.4 38.6 37.2 38.5 Bloomberg: JSHL:IN 52-week range (INR): 211/74 Share in issue (cr): 23.6 M cap (INR cr): 4,842 Avg. Daily Vol. BSE/NSE :(‘000) 460 Promoter Holding (%) 57.67 Coverage Stock: Jindal Stainless (Hisar) Ltd. Embarking on a ‘stainless’ performance! CMP INR205 Target INR 329 Rating: BUY Upside: 61% Date: 17 th October 2017 Salil Utagi Research Analyst [email protected]Debashish Mazumdar Research Analyst [email protected]
Transcript
1 GWM/Edelweiss Investment Research
Edelweiss Investment Research
Jindal Stainless (Hisar) (JSHL), an entity carved out of the erstwhile Jindal Stainless (JSL), is a leading player in the domestic stainless steel market. With 0.8mt
capacity, the company has cornered 40% market share along with group company JSL(0.8mt). Government’s sharpening focus on metro railway, airports,
modernisation of Railways along with burgenong usage of cookware and consumer durables are envisaged to spur the next leg of stainless steel market’s
growth at 8% CAGR between FY17-FY23E. We expect JSHL’s volumes to clock 11% CAGR over FY17-19E riding incremental market share gains as demand
shifts to organised players triggered by GST and imposition of 18% CVD on Chinese imports. We are valuing the stock at par with European listed
counterparts at 7x EV/EBIDTA, yeilding value of INR289/share and investments in JSL at INR41/share to arrive at target price of INR329. We recommend
‘BUY’ with an upside of 61% from current level.
Burgeoning government infra spending and rising consumerism to sustain buoyant stainless steel demand
Domestic stainless steel (SS) consumption clocked 7.6% CAGR over 2005-16 to 3.3mtpa while per capita consumption stands at a paltry 1.9kg compared
to the 6kg global avg. However, we expect India to follow in China’s footsteps—per capita consumption catapulted from mere 1.5kg in early 2000 to 9kg
in 2016—spurred by govt’s enhanced investments in infrastructure and burgeoning per capita GDP. While SS continues to remain an alternative to plastic
in cookware, its under penetration in medical, industrial and infra applications is bound to sustain the strong underlying demand momentum.
Market leadership in value additive products
JSHL, along with JSL, effectively controls 60% of the value added products market and 40% of the overall SS market in India. Balance is controlled by
unorganised players and imports (~5 lakh tons), which have been disrupted due to onslaught of GST and imposition of 18% CVD on Chinese imports (~2.8
lakh tons), respectively, throwing opportunity for JSHL to grab incremental market share. We believe the company’s leadership in specialised products
like razor blades, mint coins, Series 300/400,and process industries will boost EBIDTA/ton to INR15,300 by FY19E comparable to global standards.
Outlook and valuations: Attractive, underlying momentum to sustain; maintain ‘BUY’
We expect JSHL’s net sales/EBIDTA/PAT to grow at a CAGR of 15%/19%/46% respectively between FY17-19E We believe, higher RoCE of JSHL (22%) (even
on WACC adjusted basis)compared to European players(8-10%), burnished demand prospects and market leadership should lead to at par/premium
valuation for the company with respect to European players. We are valuing the stock at par with European listed counterparts at 7x EV/EBIDTA, yielding
value of INR289/share. Additionally, we value the company’s investments in JSL (36.5% stake) at INR41/share to arrive at target price of INR 329. We
recommend ‘BUY’ with an upside of 61% from current level.
Market leadership in domestic stainless steel market with portfolio tilted towards value added products, JSHL is set to benefit out of government’s
focus on building infrastructure and overall increasing consumerism. We expect JSHL’s net sales, EBIDTA, and PAT to increase at a CAGR of 15%,
19%, and 46% respectively over FY17-19E. We are valuing the stock at FY19E EV/EBIDTA of 7x to arrive at fair value of INR 289 and valuing equity
investment in JSL at INR41. We recommend “Trading BUY” on JSHL with a target price of INR 329, upside of 61% from CMP
Market leadership in
domestic SS, diversified
portfolio, and strong
momentum in underlying
demand to drive the
volumes & profitability
Higher blended realisation
to led to OPM
improvement, further
improving return ratios
Focus on steady volume
growth with focus on value
added products will
improve profitability and
reduce deleverage
FY16 FY17 FY18E FY19E
Revenue 7235 7774 9036 10339
EBITDA 862 980 1131 1383
EBITDA Margin 11.9 12.6 12.5 13.4
PAT 125 290 408 621
FY16 FY17 FY18E FY19E
RoACE (%)
(ex cash)38.5 24.8 23.0 28.0
Debt to
Equity (x)3.3 3.8 2.5 1.7
Multiple Price Target
RMTL
8x EV/EBIDTA 388
6x EV/EBIDTA 271
Entry = INR 205
EBIDTA CAGR of
19% over FY17-
FY19E to lead to exit
multiple of 7x FY19E
EV/EBIDTA
Total Return of
61%
Jindal Stainless Ltd (Hisar)
3 GWM/Edelweiss Investment Research
Price Target INR 329
We value the stock at a 2 year forward EV/EBIDTA multiple of 7x at par with global players. We
recommend ‘BUY’ with a TP of INR 329
Bull
2 year forward EV/EBIDTA
multiple of 8x on FY19E
INR 388 We believe significant value accretion can happen if demand runs more than supply in India through
new infrastructure projects. Strong performance can result into a bull case multiple of 8x and price
target of INR 388, an upside of 89% from CMP
Base
2 year forward EV/EBIDTA
multiple of 7x on FY19E
INR 329 We value the stock at a 2 year forward EV/EBIDTA multiple of 7x at par with global players. We
recommend ‘BUY’ with a TP of INR 329
Bear
2 year forward EV/EBIDTA
multiple of 5x on FY19E
INR 212 Keeping the financial projections constant and valuing the stock on a 2 year forward EV/EBIDTA
multiple of 5x, the most bearish multiple for the commodity company gives target price of INR 212,
upside of just 3.5% from CMP
Jindal Stainless Ltd (Hisar)
4 GWM/Edelweiss Investment Research
Average Daily Turnover (INR cr) Stock Price (absolute) Relative to Sensex, absolute (%)
3 months 6 months 1 year 1 year Since
28/01/16 5 years 10 years 1 year
Since
28/01/16 5 years 10 years
3.35 2.3 2.24 137% 437% NA NA 118% 404% NA NA
Bu
sin
ess
Va
lue
Driv
ers
Nature of Industry Stainless steel is a specialised products industry having diverse applications; ranging from widely used cookware to high grade critical
application in process industries
Opportunity Size Global market is worth $75bn while Indian market size is worth $5-5.5bn. Global market is growing at a CAGR of ~5% while Indian market
is expected to grow at 8% for the next decade
Capital Allocation Under composite scheme of arrangement, long term debt of INR2600cr was transferred to JSHL. Moreover, JSHL has INR900cr of short
term debt.
Predictability High predictability as stainless steel market has grown at ~8% CAGR during the past decade despite up and down cycle in the
economy. Govt’s focus on creating world class infra projects like metro railway, airports, and investments in process industries, lends
high predictability to the demand.
Sustainability Volume growth is sustainable due to demand from diverse industries. Pricing and profitability will follow commodity cycles
Disproportionate Future Demand of stainless steel in India can go disproportionately in the near term if govt increases investments in underlying applications by
a large factor. Moreover, increase in CVD or anti dumping duty on Chinese goods can open up large opportunity for Indian players
Business Strategy &
Planned Initiatives JSHL is focusing on steady volume growth of 11-12% with focus on value added products. Margin preservation and balance sheet de-
leveraging will also be followed
Near Term Visibility Very high near term visibility as underlying demand is very strong from infra segments. CVD on Chinese products and impact of GST on
small players, has given JSHL a big opportunity to grab market share
Long Term Visibility If India follows path of China by creating world class infrastructure assets in the next decade then the market for stainless steel will have
good long term visibility
Jindal Stainless Ltd (Hisar)
5 GWM/Edelweiss Investment Research
Focus Charts – Story in a nutshell Growth in world Stainless Steel production Consumption of SS Indian consumption pattern to trend towards
Africa EU Americas China India Asia - Ex China Ex India Other Europe
EU
16%
Other
Europe
, CIS &
Africa
1%USA
5%
Other
Americ
as
1%Asia
ex-
China
22%
China
55%
Stainless Steel Melt Shop
Production by Region - 2016
China
51%
EU
16%Other
Europe
, CIS &
Africa
3%
USA
8%
Other
Americ
as
1%
Asia Ex-
China
21%
Stainless Steel Melt Shop
Capacity by region - 2016
Jindal Stainless Ltd (Hisar)
7 GWM/Edelweiss Investment Research
High supplier concentration: Leading to bargaining power
Sources: World Steel, ISSF (worldstainless.org), & Acerinox
Sources: World Steel, ISSF (worldstainless.org), & Acerinox
The stainless steel industry is far more concentrated in a few players compared
to the carbon steel industry. Top 10 players control almost 58% supply compared
to just 25% in the carbon steel market. Being a niche specialised products
industry, the number of operational plants is also less than 500 compared to
thousands of carbon steel plants across the world.
Top 10 players – JSL group’s position
Players Installed Capacity in
mn tons
1 Tsingshan, China 7.4
2 TISCO, China 4.5
3 Outokumpu, Finland 3.1
4 POSCO, South Korea 2.9
5 Acerinox, Spain 2.9
6 Baosteel, China 2.7
7 Aperam, Luxembourg 2.1
8 LISCO, China 2.0
9 JISCO, China 2.0
10 Beihei Chengde, China 2.0
13 JSL group 1.6
Source: Acerinox, Edelinvest Research
China has the highest number of large SS producers accounting for 6/10
top 10 SS producers in the world. Outokumpu, Aperam, and Acerinox are
European companies formed through multiple consolidations over last 15
years.
JSL group – JSL & JSHL combined has installed capacity of 1.6mn tons
making it the 13th largest player in the world.
Top 10
Producers
58%
Rest
42%
Concentration in the Stainless Steel Industry
Top 10
Producers
25%
Rest
75%
Concentration in Carbon Steel Industry
Jindal Stainless Ltd (Hisar)
8 GWM/Edelweiss Investment Research
II. Consumption of SS – India lags behind major economies,outlook remains bright
Source: Edelweiss Investment Research
Stainless steel consumption depends upon the stage of an economy’s development as higher usage happens through use of stainless steel for infrastructure and
for aesthetic purpose by end consumers. While per capita consumption in most developed countries is more than 10kg, China’s stands at 9kg (up from 4kg in 2005).
India woefully lags developed countries and large developing countries as well with per capita consumption at mere 1.9kg. Notably, it grown to current level from
Consumption of stainless steel through cookware, consumer goods and medical
instruments accounted for 48% of total global consumption in 2016. Demand
centres which have higher usage are primarily related to aesthetic usage in
architecture and building construction. In rapidly developing countries like China
the usage has grown rapidly in industrial applications including infrastructure and
process industries.
Indian consumption pattern to trend towards global
Source: Company, Edelweiss Investment Research
Over the past 2 decades, stainless steel consumption in India has moved
away from the most primary usage in cookware/durable to new value
added categories of architecture, buildings, infrastructure and process
industries. The change is following global pattern of countries where per
capita incomes of developing countries are catapulting in line with
developed countries. India’s per capita stainless steel consumption has
increased from 1.0kg in 2008 at per capita GDP of USD 1053 to 1.9kg in
2016 at a per capita GDP of USD 1700.
Consumer
Goods &
Medical,
48.00%
Chemical,
Petrochemical &
energy, 16.00%
Automotive &
heavy Industry,
10.00%
ABC &
Infrastructure,
15.00%
Industrial &
Heavy Industry,
8.00%
Others, 3.00%
2016
80%
57%
37.8%
6.7%
11.8%
16.9%
25.4%
0.9%1.6%
10.6%12.8%
20%
5.7% 7.3%
0%
10%
20%
30%
40%
50%
60%
70%
80%
90%
100%
1998 2015 2023
Cookware & Durables ABC
Process Industry & Power Engineering
Electro-Mechanical Industry ART
Others/Misc.
Jindal Stainless Ltd (Hisar)
10 GWM/Edelweiss Investment Research
Demand forecast: Strong inherent demand
Taking into consideration healthy growth in most underlying segments, stainless steel consumption in India is expected to clock 8-9% CAGR over the next decade.
•Cookware industry to grow at +12% based on volume growth expectation of Hawkins, prestige,etc
• Under penetration of consumer durables in India especially of washing machines
• Increasing no of hospitals and treatment centres t
Cookware, Consumer goods, and medical
• Demand for petrochemicals consistently growing at 6% CAGR in India leading to greenfield/brownfield capex leading to demand of high grade SS
• Investments related to BS6 standardsChemical , petrochemicals, and energy
• SS is extensively used in evironments exposed to chemicals to avoid corrosion resitance
•Under construction thermal power stations continue to drive demandProcess industry & Power
• Incrasing use of SS for aesthetic purpose in residential, commercial buildings like offices, hotels. Infra projects like metro railways, airports, bus stops driving demand for SS
Architecture, Building & Construction (ABC)
• Exhaust outlet of automobiles are made up of SS along with other critical parts
• Bodies of metro railway and buses. Higher usage of SS in new bogies /wagons of Indian Railways
Auto, Railway & Transportation (ART)
Jindal Stainless Ltd (Hisar)
11 GWM/Edelweiss Investment Research
III. High correlation between raw material and stainless steel prices:
Stainless steel is an iron alloy with a minimum of 10.5% chromium. Other alloying elements such as nickel, molybdenum, titanium and copper are added to enhance
their structure and properties of formability, strength and cryogenic toughness. Non-metals such as nitrogen and carbon are also added to enhance the same
properties. Stainless steel prices are highly dependent on raw material, especially nickel, as it is one of the most expensive metals on per ton basis.
Raw material prices, especially of nickel and ferrochrome (FeCr), are added onto the base price of stainless steel as a ‘surcharge’ which is passed on to customers.
Content and pricing of Series 304 stainless steel (approx)
Nickel FeCr Total Surcharge Base price of SS Total price of SS
% content 8% 16%
Current price $12,000/ton $2200/ton
Contribution to surcharge $960/ton $352/ton $1312/ton $1000/ton $2312/ton
Source: Edelweiss Investment Research
Price comparison of raw material and stainless steel
Final selling price of stainless steel has high correlation with prices of nickel as it constitutes minimum 40% and has accounted for 80% of stainless steel cost. Nickel
prices had a bull run over 2003-09; they peaked in 2008-09 at USD50,000/ton.
Source: APERAM, Edelweiss Investment Research
0
5000
10000
15000
20000
25000
30000
35000
Au
g-0
8
De
c-0
8
Ap
r-09
Au
g-0
9
De
c-0
9
Ap
r-10
Au
g-1
0
De
c-1
0
Ap
r-11
Au
g-1
1
De
c-1
1
Ap
r-12
Au
g-1
2
De
c-1
2
Ap
r-13
Au
g-1
3
De
c-1
3
Ap
r-14
Au
g-1
4
De
c-1
4
Ap
r-15
Au
g-1
5
De
c-1
5
Ap
r-16
Au
g-1
6
De
c-1
6
Ap
r-17
Au
g-1
7
Nickel - LME Cash (USD/t)
0
1000
2000
3000
4000
5000
Fe
b-0
8
Ju
n-0
8
Oc
t-08
Fe
b-0
9
Ju
n-0
9
Oc
t-09
Fe
b-1
0
Ju
n-1
0
Oc
t-10
Fe
b-1
1
Ju
n-1
1
Oc
t-11
Fe
b-1
2
Ju
n-1
2
Oc
t-12
Fe
b-1
3
Ju
n-1
3
Oc
t-13
Fe
b-1
4
Ju
n-1
4
Oc
t-14
Fe
b-1
5
Ju
n-1
5
Oc
t-15
Fe
b-1
6
Ju
n-1
6
Oc
t-16
Fe
b-1
7
Ju
n-1
7
Chinese versus Euopean CR 304 2B 2mm coil transaction
price*
Chinese price European price
Jindal Stainless Ltd (Hisar)
12 GWM/Edelweiss Investment Research
A. Slide in nickel prices has led to higher usage of stainless in past 7-8 years
Post touching peak in 2009, nickel prices have dipped over the past 6-7 years, primarily due to mass production on nickel pig iron (NPI) in China. NPI is a low grade
ferronickel invented in China as a cheaper alternative to pure nickel for the production of stainless steel. The NPI production process utilises laterite nickel ores
containing just 4-10% nickel content instead of pure nickel.
During the commodity prices bull run over 2005-09, world stainless steel production clocked CAGR of –ve 1% while post 2009, it posted CAGR of 9.1%. On the other
hand, stainless steel production in China grew at a CAGR of 29% between 2005-09 and 16% CAGR between 2009-16.
Production process of NPI is highly polluting in nature as it releases high amount of carbon dioxide. The China government’s recent policies of curbing polluting
industries has resulted in lower imports of ferronickel from Indonesia/Philippines and increasing imports of refined nickel.
We believe, balanced production of stainless steel in China through refined nickel and NPI is the key to stable prices of nickel in the near future, which should be
conducive for healthy growth of global stainless steel production.
Chinese reduced NPI production leading to increased Ferrornickel imports
Source: Aperam
0
50
100
150
200
250
300
350
400
450
500
2013 2014 2015 2016 H1'17
(in
kt)
Chinese NPI production Ferronickel imports (Ni content)
Jindal Stainless Ltd (Hisar)
13 GWM/Edelweiss Investment Research
IV. JSL group: Market leader by huge margin
Jindal Stainless (JSL) and Jindal Stainless (Hisar) (JSHL) were carved out of a single entity in April 2015 under a composite scheme of arrangement with the lenders
of the erstwhile company. Now, JSL and JSHL are operated as two different legal entities of the same promoter group.
At the combined level, the JSL Group is the market leader in domestic stainless steel production with a consistent ~40% share over the past 15 years. Of India’s
total 3.3mt capacity, the JSL Group accounts for 1.6mt, i.e., ~50% of installed capacity.
Considering India is a net exporter of only 4 lakh tons, we are considering installed capacity in India to be same as actual consumption.
Source: Company, Edelweiss Investment Research
Stainless Steel types – flats find higher no of applications than longs
Type of stainless
steel Available as Applications
Flat SS Sheets, plates Household products, cookware, consumer durables,
industrial applications, coins, razor blades
Long SS Bars, rods, wires, Door handles, bathroom fittings, mesh, aircraft landing
gears, medical instruments,
Currently, while flat products account for 71% of overall stainless steel consumption, long products account for balance 29%. The same ratio in case of the JSL
Group stands at 90:10. Amongst flat stainless steel producers, the JSL Group is the leading player with 60% market share. The group has limited competition in
production of flats as the only other large player is SAIL’s Salem plant with 280,000 tpa capacity. SAIL has not been able to use this capacity effectively; the plant
has been incurring huge losses for the past several years. Rest of the competition is from unorganised single location players which are highly inefficient and face
the risk of closing of operations post demonetisation and GST.
1.6
1.55
.18
1.73
Installed Capacity – 3.3 Million tons
JSL
Unorganised
Salem
Group
Flats,
71%
Longs,
29%
Production by Type
Jindal Stainless Ltd (Hisar)
14 GWM/Edelweiss Investment Research
A. Journey of JSL group – Dominating the market, building incremental market share despite rising imports
Source: JSL, JSHL, Edelweiss Investment Research
Despite up-down cycles in the underlying economy during the past decade, stainless steel demand has remained strong throughout. While stainless steel
production in India posted 7.49% CAGR between FY06 and FY17, the JSL Group’s production increased at 8.84% during the same period. Thus, the company
captured incremental market share. Organised large peers which added capacities are Viraj Profiles (6 lakh tons of long products) and SAIL’s Salem plant 1 lakh
ton (to reach 2.8 lakh ton of flat products).
CVD on imports from China: Curtailing competition
Imports have registered CAGR of 17% over FY13-16 (FY17 data not available, but likely to be closer to 3 lakh tons), hurting domestic manufacturers. Almost half of
the imports were from China, which were at substantially lower prices than realistic prices.
To address this issue, in September 2017, the Government of India imposed CVD of 18% on most dumped stainless steel products from China. This is expected to
Size of Indian market consumption Total Jindal Production India GDP Growth Rate
3L
4.5L
Imports
3L
4.8L
Jindal Stainless Ltd (Hisar)
15 GWM/Edelweiss Investment Research
JSL group* capacity addition and utilisation remains strong
Source: *-JSL+JSHL,
Over the previous decade, the JSL Group has expanded capacity substantially via greenfield route in Jajpur, Odisha by adding 0.8mt (expandable up to 1mt).
Post commissioning of the Odisha plant in FY12, the group’s capacity utilisation catapulted from 50% to ~85% in FY17, indicating higher market share. The Group’s
share in the total domestic market has remained closer to 40% over the past decade.
Total Jindal Production Total Jindal Capacity Capacity Utilization % of Market Share Attributable to Jindal
Jindal Stainless Ltd (Hisar)
16 GWM/Edelweiss Investment Research
B. Diversified players, no threat of direct aggressive competitors in flat products
JSHL does not have a comparable peer in the stainless steel segment. Viraj Steel is an unlisted player focusing on the segment, but only in long products. Hence, it
does not directly compete with the JSL Group. Mukand is also a player in stainless steel products, but it is present in other segments of steel alloys production as
well. SAIL has a plant in Salem dedicated to stainless steel production, but the plant is highly inefficient, incurring losses consistently. Sunflag Iron is present in the
alloy steel space and not exactly in stainless steel production.
C. Grades of SS and applications Source: Edelweiss Investment Research
Source: Edelweiss Investment Research
Stainless steel is graded depending upon the chemical composition of chromium, nickel, molybdenum, nitrogen, etc. Due to its inherent properties of formability
and corrosion resistance, Series 300 is the most widely used grade globally, accounting for almost 54% of total usage. Applications of Series 300 vary from cookware,
medical equipment, food processing equipment to car/bus bodies, and other infrastructure applications.
Price of nickel plays a major role in determining alloy surcharge over base price of stainless steel. Nickel, even though used anywhere between 8% and16% in 300
series, has accounted for minimum 40% to maximum 80% of stainless steel prices in the past decade as the metal’s prices fluctuated between USD8000 and
USD50,000/ton.
Stainless Steel
Family Description Composition Typical Applications
Martensitic Group
400 Series
Capable of being heat treated to a wide range
of hardness and strength level
Carbon: 0.11%
Chromium: 12%
Bolts, nuts, screws, cutlery, scissors, surgical
equipment
Ferritic Group
400 series
Used for corrosion resistance and resistance to
sealing at high temperature.
Always magnetic
Carbon: 0.05%
Chromium: 16.5%
Vehicle mufflers, containers, vehicle trim, kitchen trim
and equipment, drums and tubs for washing
machine, heat exchangers, oil burner parts
Austenitic Group
200 and 300 series
Have excellent formability and corrosion
resistance
Non-hardenable by heat treating, non magnetic
in normal condition and composition.
Becomes slightly magnetic when cold rolled
Carbon: 0.04%
Chromium: 18.2%
Nickel: 8.7%
Architectural trim, vehicle wheel cover, railroad car
and ferritic in their structure, nitrogen added to
improve corrosion resistance and strength
Carbon: 0.02%
Chromium: 22%
Nickel: 5.5%
Molybdenum: 3%
Nitrogen: 0.14%
Pipe and tube applications, petro-chemical
equipment, pulp and paper processing machinery
and equipment
Jindal Stainless Ltd (Hisar)
18 GWM/Edelweiss Investment Research
D. Stainless steel output by grade – Higher the value addition, better control over margins
Source: Industry
Volatility and consistently high prices of Nickel have led to the development of Series 200, especially in developing countries China and India. Nickel helps maintain
stainless steel’s austenitic structure, which can also be managed by adding manganese and nitrogen to very low content of nickel (<4%) to the alloy. Thus, Series
200 can be developed at a much lower cost for applications where corrosion resistance is not the essential criteria, in a way limiting its applications.
Series 200 accounted for as much as 70% of total consumption in India in FY08, which dipped to 57% in FY16 as usage of stainless steel grew faster and wider in the
past decade. Rising per capita incomes and development of infra/process industries/food processing units in the past decade has led to higher usage of higher
quality Series of 300 and 400.
JSL Hisar - Break up by series (volumes)
Source: JSHL
300 Series
(Austenitic)
54%
400 Series
(Ferretic &
Martensitic)
27%
200 Series
(Austentic)
18%
Duplex
1%
Global Stainless Steel Output by Grade - 2016
70%57%
23%
28%
7%14%
0% 1%
FY08 FY16
Indian production by series
200 300 400 Duplex/alloys
200
30%
300 &
Duplex/all
oys
50%
400
20%
Even though JSHL is the pioneer in developing Series 200 in India, Series 300 constitutes almost
half of its production. According to our estimate, the company, along with group company
JSL, dominates the domestic Series 300 market, accounting for as much 70% share (combined
production of 7 lakh tons of total 9 lakh tons market) in FY17. Also, JSHL has been a leading
player in indigenous production of duplex stainless steel in India, which was entirely imported
a decade ago. The company’s duplex stainless steel is extensively used in welded pipes in
refineries, thermal power plants and other process industries.
We believe, current dominant market share in Series 300 will help JSHL sustain higher than
Nickel is used in lithium ion batteries, which should lead to higher optimism on stronger prices in the near future. Due to high correlation between nickel and stainless
steel prices, historical cycles of stocking and de-stocking of stainless steel have followed nickel prices. We believe, consensus on nickel price remaining stable to
higher from current USD12,000/ton over the next 3-5 years will result in strong upcycle in stainless steel production.
Operating margins which are measured in terms of EBIDTA/ton have also been impacted by currency exchange rate. Post the 2008-09 financial crisis, margins have
improved from the lowest point in 2009 to a respectable USD200-250/ton for most players (except Outokumpu in FY16. In FY17, margins corrected due to
unfavourable exchange rates). We estimate operating margins of JSL and JSHL, which are predominantly domestic sector focused with high market shares &
portfolio of value additive products, to trend towards USD250-300/ton over the next 3 years.
Operating costs of Indian players are lower than European players in terms of labour and most importantly due to backward integration/assured domestic supply
of FeCr in India. We believe, further strengthening of backward integration by JSL, like acquisition of chrome ore mines in India, will led to margin expansion in the
near future.
Jindal Stainless Ltd (Hisar)
20 GWM/Edelweiss Investment Research
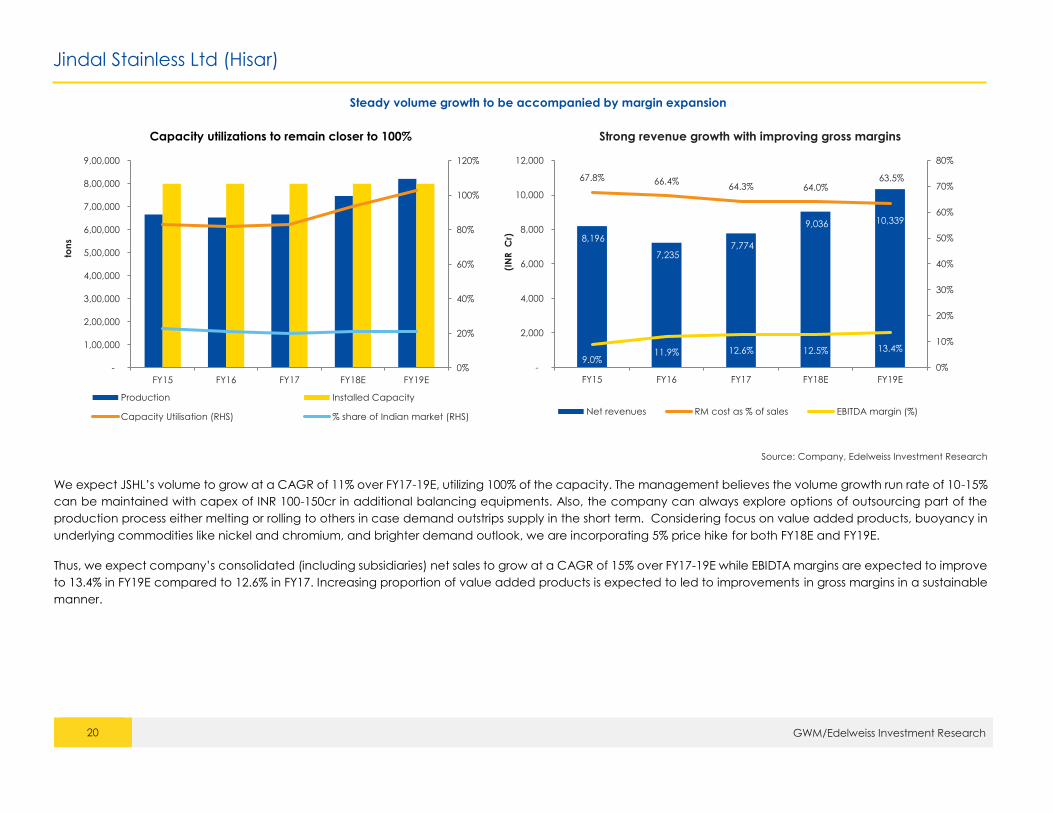
Steady volume growth to be accompanied by margin expansion
Capacity utilizations to remain closer to 100% Strong revenue growth with improving gross margins
Source: Company, Edelweiss Investment Research
We expect JSHL’s volume to grow at a CAGR of 11% over FY17-19E, utilizing 100% of the capacity. The management believes the volume growth run rate of 10-15%
can be maintained with capex of INR 100-150cr in additional balancing equipments. Also, the company can always explore options of outsourcing part of the
production process either melting or rolling to others in case demand outstrips supply in the short term. Considering focus on value added products, buoyancy in
underlying commodities like nickel and chromium, and brighter demand outlook, we are incorporating 5% price hike for both FY18E and FY19E.
Thus, we expect company’s consolidated (including subsidiaries) net sales to grow at a CAGR of 15% over FY17-19E while EBIDTA margins are expected to improve
to 13.4% in FY19E compared to 12.6% in FY17. Increasing proportion of value added products is expected to led to improvements in gross margins in a sustainable
manner.
0%
20%
40%
60%
80%
100%
120%
-
1,00,000
2,00,000
3,00,000
4,00,000
5,00,000
6,00,000
7,00,000
8,00,000
9,00,000
FY15 FY16 FY17 FY18E FY19E
ton
s
Production Installed Capacity
Capacity Utilisation (RHS) % share of Indian market (RHS)
8,196
7,235 7,774
9,036 10,339
67.8% 66.4%64.3% 64.0%
63.5%
9.0%11.9% 12.6% 12.5% 13.4%
0%
10%
20%
30%
40%
50%
60%
70%
80%
-
2,000
4,000
6,000
8,000
10,000
12,000
FY15 FY16 FY17 FY18E FY19E
(IN
R
Cr)
Net revenues RM cost as % of sales EBITDA margin (%)
Jindal Stainless Ltd (Hisar)
21 GWM/Edelweiss Investment Research
Bargaining power through market leadership has resulted in lower working capital:
Source: Edelweiss Investment Research
JSHL continues to maintain healthy net working capital days of ~60. Higher market share in India and widespread distribution network through the subsidiary (Jindal
Steelway) have imparted bargaining power to the JSL Group, which we expect to sustain in the foreseeable future. The Group’s receivable days too have always
remained under control at around 30 days, while creditor days have been higher than 60 days throughout, going even beyond 100 days in few years.
Inventory days have remained higher than 100 as the company has to stock expensive raw material nickel for at least 2 months and finished goods for a month.
We believe, management’s cautious view in maintaining buffer of 2 months of nickel bodes well for production planning and insulating against volatile price
movement and supply deficits.
-
10
20
30
40
50
60
70
80
90
(250)
(200)
(150)
(100)
(50)
-
50
100
150
200
250
FY15 FY16 FY17 FY18e FY19e Da
ys
Da
ys
Inventory Days Debtor Days Creditor Days Cash Conversion Dats
Jindal Stainless Ltd (Hisar)
22 GWM/Edelweiss Investment Research
Improving profitability and efficient asset turnover to boost return ratios Dupont Analysis
ROCE
FY17 FY18E FY19E
JSL 8.9% 11.7% 13.1%
JSHL 22.2% 20.2% 23.5%
Acerinox 5.6% 3.6% 5.9%
Aperam 10.6% 10.3% 11.1%
Outokumpu 1.57% 6.2% 7.4%
Source: Company, Edelweiss Investment Research
Improving profitability and lower equity base are estimated to propel JSHL’s RoE from mere 14% in FY16 to 35% in FY19. RoCE is estimated to remain above 20% for
FY18-19 as all the underlying determinants, especially margins and asset turnover, are expected to improve from FY17 levels. JSHL’s RoCE stands much higher than
European counterparts, but adjusted for cost of capital (WACC), the premium reduces to only a few percentage points.
We believe, higher RoCE (even on WACC adjusted basis), burnished demand prospects and market leadership should lead to at par/premium valuation for JSHL
with respect to European players.
FY16 FY17 FY18E FY19E
Tax Burden 91% 80% 77% 77%
Interest Burden 15% 43% 60% 70%
EBIT Margin 8% 10% 10% 11%
Asset Turnover 0.88 0.90 0.99 1.06
Equity Multiplier 14.22 11.52 8.31 6.03
RoE (%) 14.0 34.8 37.2 38.5
Jindal Stainless Ltd (Hisar)
23 GWM/Edelweiss Investment Research
Subsidiary companies - Improving profitability
Source: Company
Name Description Turnover (2017) PAT (2017)
Jindal Stainless Steelway Ltd.
Jindal Stainless Steelway is the service arm of Jindal Stainless and offers just-
in-time service. The company is in the business of processing and distribution
of stainless steel.
INR 1395 Cr INR 14.2 Cr
JSL Lifestyle Ltd. JSL Lifestyle covers the manufacturing of modular kitchen equipments. INR 205 Cr INR 1.0 Cr
# - we have considered non current loan of INR 485cr as investments by JSHL as it recoverable in definite time frame
Jindal Stainless Ltd (Hisar)
28 GWM/Edelweiss Investment Research
Key Management
Name Age Experience Designation Qualification Other Directorship
Ratan Jindal 60 Promoter Chairman
MBA, University of Pennsylvania -
The Wharton School
Jindal Stainless
Abhyuday Jindal 28 Promoter Vice Chairman
Economics & business
management from Boston
university
Jindal Stainless
Ashok Kumar Gupta 61 35 years Wholetime director MSC electronics, MBA from MDI,
Gurgaon APL Apollo
Source: Company
In the past 3 years, there have been 2 major inductions in the top management.
a) Mr Abhyuday Jindal, joined the family business as Vice Chairman of JSL and JSHL
b) Mr Ashok Kumar Gupta, who is also Managing Director of APL Apollo Tubes Ltd, has joined the company as wholetime director. Mr Gupta has been
instrumental in making APL the market leader in ERW tubes within the space of 5 years with capacity and volume additions of more than 30% CAGR. Currently,
Mr Gupta is involved in APL only on the strategic level.
Risks and Concerns:
Business cyclicality
Raw material price volatility
Slowdown in economy
Dumping from China
Jindal Stainless Ltd (Hisar)
29 GWM/Edelweiss Investment Research
Business Overview
Company Brief
Jindal Stainless (Hisar) Ltd, is part of Jindal Stainless group having 0.8mtpa capacity in Hisar, Haryana. JSHL manufactures variety of products with 50%
contribution from value added products. JSHL’s products are widely used in applications starting from cookware to industrial applications.
Business Model The company manufactures stainless steel from its facility in Hisar. JSHL has melting capacity of 0.8mtpa and ferrochrome facility of 40,000tpa.
Strategic Positioning
JSHL along with group company has been a market leader in India for past 30 years with long term relationships with customers and pre-
qualifications most of the leading applications in India. JSL group has been driving force behind development of stainless steel industry in
India, giving it unparallel advantage over other players.
Competitive Edge
JSHL has 30 years of experience in the field with bouquet of products in the value added range. JSHL derives 50-70% of its revenues from high
value added range controlling 60-70% market share in the space. The company’s long term relationships with the customers and suppliers
gives company edge over smaller competitors
Financial Structure
JSHL has undertaken long term debt of INR 2600cr as part of composite scheme of arrangement, making debt to equity at 3.8x. Adjusted for
loans given to JSL, net debt to equity stands at 3.2x. Given the strong profitability profile and operating cash flow generation in next 2-3 years,
debt repayments should not pose a challenge
Key Competitors No large competitor in flats products except for the risk of imports from China. Long products which is just 10% of company’s volumes faces
competition from Viraj and Mukand
Industry Revenue Drivers Increasing penetration of cookware and consumer durables. Investments in infrastructure like metro rail, bus transport, airports, railway
coaches, process industries, etc
Shareholder Value
Proposition
We believe volume of 11% CAGR in FY17-19E would be accompanied by margin expansion to 13.4% in FY19E from 12.6% in FY17. We are
valuing the stock at EV/EBIDTA of 7x at par with European players due to its market leadership status in India coupled with strong growth of
market. We are valuing the investment in JSL at INR 41, to arrive at a fair value of INR 329, an upside of 66% from the current levels.
Jindal Stainless Ltd (Hisar)
30 GWM/Edelweiss Investment Research
Financials
Income statement (Consolidated) (INR cr)
Year to March FY15 FY16 FY17 FY18E FY19E
Income from operations 8196 7235 7774 9036 10339
Direct costs 6396 5426 5635 6607 7506
Employee costs 181 176 176 210 219
Other expenses 1059 947 1159 1297 1450
Total operating expenses 7455 6373 6794 7905 8956
EBITDA 741 862 980 1131 1383
Depreciation and amortisation 313 305 285 300 311
EBIT 428 557 695 831 1072
Interest expenses 475 493 431 355 350
Profit before tax -1 89 328 528 804
Provision for tax 5 7 117 185 281
Core profit -6 82 211 343 523
Extraordinary items 17 -44 28 0 0
Profit after tax -23 127 240 343 523
Share from associates 0 -1 50 65 98
Net profits (incl share of associates) -23 125 290 408 621
Buy appreciate more than 15% over a 12-month period
Hold appreciate between 5-15% over a 12-month period
Reduce Return below 5% over a 12-month period
0
100
200
300
400
500
600
Jan
-16
Ma
r-1
6
Ma
y-1
6
Jul-1
6
Se
p-1
6
No
v-1
6
Jan
-17
Ma
r-1
7
Ma
y-1
7
Jul-1
7
Se
p-1
7
(In
de
xe
d)
Jindal Stainless (Hisar) Sensex
Disclaimer
32 GWM/Edelweiss Investment Research
Edelweiss Broking Limited (“EBL” or “Research Entity”) is regulated by the Securities and Exchange Board of India (“SEBI”) and is licensed to carry on the business of broking, depository services and related activities. The business of EBL and its
Associates (list available on www.edelweissfin.com) are organized around five broad business groups – Credit including Housing and SME Finance, Commodities, Financial Markets, Asset Management and Life Insurance.
Broking services offered by Edelweiss Broking Limited under SEBI Registration No.: INZ000005231; Name of the Compliance Officer: Mr. Brijmohan Bohra, Email ID: [email protected] Corporate Office: Edelweiss House, Off
This Report has been prepared by Edelweiss Broking Limited in the capacity of a Research Analyst having SEBI Registration No.INH000000172 and distributed as per SEBI (Research Analysts) Regulations 2014. This report does not constitute an offer
or solicitation for the purchase or sale of any financial instrument or as an official confirmation of any transaction. The information contained herein is from publicly available data or other sources believed to be reliable. This report is provided
for assistance only and is not intended to be and must not alone be taken as the basis for an investment decision. The user assumes the entire risk of any use made of this information. Each recipient of this report should make such investigation
as it deems necessary to arrive at an independent evaluation of an investment in the securities of companies referred to in this document (including the merits and risks involved), and should consult his own advisors to determine the merits and
risks of such investment. The investment discussed or views expressed may not be suitable for all investors.
This information is strictly confidential and is being furnished to you solely for your information. This information should not be reproduced or redistributed or passed on directly or indirectly in any form to any other person or published, copied, in
whole or in part, for any purpose. This report is not directed or intended for distribution to, or use by, any person or entity who is a citizen or resident of or located in any locality, state, country or other jurisdiction, where such distribution, publication,
availability or use would be contrary to law, regulation or which would subject EBL and associates / group companies to any registration or licensing requirements within such jurisdiction. The distribution of this report in certain jurisdictions may
be restricted by law, and persons in whose possession this report comes, should observe, any such restrictions. The information given in this report is as of the date of this report and there can be no assurance that future results or events will be
consistent with this information. This information is subject to change without any prior notice. EBL reserves the right to make modifications and alterations to this statement as may be required from time to time. EBL or any of its associates / group
companies shall not be in any way responsible for any loss or damage that may arise to any person from any inadvertent error in the information contained in this report. EBL is committed to providing independent and transparent
recommendation to its clients. Neither EBL nor any of its associates, group companies, directors, employees, agents or representatives shall be liable for any damages whether direct, indirect, special or consequential including loss of revenue
or lost profits that may arise from or in connection with the use of the information. Our proprietary trading and investment businesses may make investment decisions that are inconsistent with the recommendations expressed herein. Past
performance is not necessarily a guide to future performance .The disclosures of interest statements incorporated in this report are provided solely to enhance the transparency and should not be treated as endorsement of the views expressed
in the report. The information provided in these reports remains, unless otherwise stated, the copyright of EBL. All layout, design, original artwork, concepts and other Intellectual Properties, remains the property and copyright of EBL and may not
be used in any form or for any purpose whatsoever by any party without the express written permission of the copyright holders.
EBL shall not be liable for any delay or any other interruption which may occur in presenting the data due to any reason including network (Internet) reasons or snags in the system, break down of the system or any other equipment, server
breakdown, maintenance shutdown, breakdown of communication services or inability of the EBL to present the data. In no event shall EBL be liable for any damages, including without limitation direct or indirect, special, incidental, or
consequential damages, losses or expenses arising in connection with the data presented by the EBL through this report.
We offer our research services to clients as well as our prospects. Though this report is disseminated to all the customers simultaneously, not all customers may receive this report at the same time. We will not treat recipients as customers by virtue
of their receiving this report.
EBL and its associates, officer, directors, and employees, research analyst (including relatives) worldwide may: (a) from time to time, have long or short positions in, and buy or sell the securities thereof, of company(ies), mentioned herein or (b)
be engaged in any other transaction involving such securities and earn brokerage or other compensation or act as a market maker in the financial instruments of the subject company/company(ies) discussed herein or act as advisor or
lender/borrower to such company(ies) or have other potential/material conflict of interest with respect to any recommendation and related information and opinions at the time of publication of research report or at the time of public
appearance. EBL may have proprietary long/short position in the above mentioned scrip(s) and therefore should be considered as interested. The views provided herein are general in nature and do not consider risk appetite or investment
objective of any particular investor; readers are requested to take independent professional advice before investing. This should not be construed as invitation or solicitation to do business with EBL.
EBL or its associates may have received compensation from the subject company in the past 12 months. EBL or its associates may have managed or co-managed public offering of securities for the subject company in the past 12 months. EBL
or its associates may have received compensation for investment banking or merchant banking or brokerage services from the subject company in the past 12 months. EBL or its associates may have received any compensation for products
or services other than investment banking or merchant banking or brokerage services from the subject company in the past 12 months. EBL or its associates have not received any compensation or other benefits from the Subject Company or
third party in connection with the research report. Research analyst or his/her relative or EBL’s associates may have financial interest in the subject company. EBL, its associates, research analyst and his/her relative may have other
potential/material conflict of interest with respect to any recommendation and related information and opinions at the time of publication of research report or at the time of public appearance.
Participants in foreign exchange transactions may incur risks arising from several factors, including the following: ( i) exchange rates can be volatile and are subject to large fluctuations; ( ii) the value of currencies may be affected by numerous
market factors, including world and national economic, political and regulatory events, events in equity and debt markets and changes in interest rates; and (iii) currencies may be subject to devaluation or government imposed exchange
controls which could affect the value of the currency. Investors in securities such as ADRs and Currency Derivatives, whose values are affected by the currency of an underlying security, effectively assume currency risk.
Research analyst has served as an officer, director or employee of subject Company: No
EBL has financial interest in the subject companies: No
EBL’s Associates may have actual / beneficial ownership of 1% or more securities of the subject company at the end of the month immediately preceding the date of publication of research report.
Research analyst or his/her relative has actual/beneficial ownership of 1% or more securities of the subject company at the end of the month immediately preceding the date of publication of research report: No
EBL has actual/beneficial ownership of 1% or more securities of the subject company at the end of the month immediately preceding the date of publication of research report: No
Subject company may have been client during twelve months preceding the date of distribution of the research report.
There were no instances of non-compliance by EBL on any matter related to the capital markets, resulting in significant and material disciplinary action during the last three years.
Disclaimer
33 GWM/Edelweiss Investment Research
A graph of daily closing prices of the securities is also available at www.nseindia.com
Analyst Certification:
The analyst for this report certifies that all of the views expressed in this report accurately reflect his or her personal views about the subject company or companies and its or their securities, and no part of his or her compensation was, is or will
be, directly or indirectly related to specific recommendations or views expressed in this report.
Additional Disclaimer for U.S. Persons
Edelweiss is not a registered broker – dealer under the U.S. Securities Exchange Act of 1934, as amended (the“1934 act”) and under applicable state laws in the United States. In addition Edelweiss is not a registered investment adviser under the
U.S. Investment Advisers Act of 1940, as amended (the "Advisers Act" and together with the 1934 Act, the "Acts), and under applicable state laws in the United States. Accordingly, in the absence of specific exemption under the Acts, any
brokerage and investment services provided by Edelweiss, including the products and services described herein are not available to or intended for U.S. persons.
This report does not constitute an offer or invitation to purchase or subscribe for any securities or solicitation of any investments or investment services and/or shall not be considered as an advertisement tool. "U.S. Persons" are generally defined
as a natural person, residing in the United States or any entity organized or incorporated under the laws of the United States. US Citizens living abroad may also be deemed "US Persons" under certain rules.
Transactions in securities discussed in this research report should be effected through Edelweiss Financial Services Inc.
Additional Disclaimer for U.K. Persons
The contents of this research report have not been approved by an authorised person within the meaning of the Financial Services and Markets Act 2000 ("FSMA").
In the United Kingdom, this research report is being distributed only to and is directed only at (a) persons who have professional experience in matters relating to investments falling within Article 19(5) of the FSMA (Financial Promotion) Order 2005
(the “Order”); (b) persons falling within Article 49(2)(a) to (d) of the Order (including high net worth companies and unincorporated associations); and (c) any other persons to whom it may otherwise lawfully be communicated (all such persons
together being referred to as “relevant persons”).
This research report must not be acted on or relied on by persons who are not relevant persons. Any investment or investment activity to which this research report relates is available only to relevant persons and will be engaged in only with
relevant persons. Any person who is not a relevant person should not act or rely on this research report or any of its contents. This research report must not be distributed, published, reproduced or disclosed (in whole or in part) by recipients to
any other person.
Additional Disclaimer for Canadian Persons
Edelweiss is not a registered adviser or dealer under applicable Canadian securities laws nor has it obtained an exemption from the adviser and/or dealer registration requirements under such law. Accordingly, any brokerage and investment
services provided by Edelweiss, including the products and services described herein, are not available to or intended for Canadian persons.
This research report and its respective contents do not constitute an offer or invitation to purchase or subscribe for any securities or solicitation of any investments or investment services.
Disclosures under the provisions of SEBI (Research Analysts) Regulations 2014 (Regulations)
Edelweiss Broking Limited ("EBL" or "Research Entity") is regulated by the Securities and Exchange Board of India ("SEBI") and is licensed to carry on the business of broking, depository services and related activities. The business of EBL and its
associates are organized around five broad business groups – Credit including Housing and SME Finance, Commodities, Financial Markets, Asset Management and Life Insurance. There were no instances of non-compliance by EBL on any matter
related to the capital markets, resulting in significant and material disciplinary action during the last three years. This research report has been prepared and distributed by Edelweiss Broking Limited ("Edelweiss") in the capacity of a Research
Analyst as per Regulation 22(1) of SEBI (Research Analysts) Regulations 2014 having SEBI Registration No.INH000000172.