+ All Categories
Home > Education > Ratio analysis in bhel

Ratio analysis in bhel

Date post: 25-Jul-2015
Category:
Upload: sareddybhaskarreddy
View: 78 times
Download: 1 times
Share this document with a friend
Popular Tags:
65
A STUDY ON RATIO ANALYSIS INTRODUCTION Finance is viewed as the most important factor in every enterprise and it is provision of money at the time when it is required. Every enterprise whether big, medium or small needs finance to carry on its operations and to achieve its targets. Finance is so indispensable today that it is rightly said that it is the lifeblood of an enterprise. Without adequate finances, no enterprise can possibly accomplish its objectives. Capital required for a business can be classified under two main categories i.e., fixed capital and working capital. Fixed capital stands for the amount of capital which is required for long term to create production facilities through purchase of fixed assets such as plant, machinery, land and buildings etc, working capital refers to that part of the firms capital which is needed for financing short terms or current assets such as marketable securities, debtors and inventories etc, working capital in brief, is the amount of funds necessary to cover the cost of operating the enterprise. Just as circulation of blood is essential in the human body for maintaining life of a person, working capital is very essential to maintain the smooth running of a business. G.K.C.E, SULLURPET 1
Transcript

A STUDY ON RATIO ANALYSIS

INTRODUCTION

Finance is viewed as the most important factor in every enterprise and it is

provision of money at the time when it is required. Every enterprise whether big,

medium or small needs finance to carry on its operations and to achieve its targets.

Finance is so indispensable today that it is rightly said that it is the lifeblood of an

enterprise. Without adequate finances, no enterprise can possibly accomplish its

objectives.

Capital required for a business can be classified under two main categories

i.e., fixed capital and working capital. Fixed capital stands for the amount of capital

which is required for long term to create production facilities through purchase of

fixed assets such as plant, machinery, land and buildings etc, working capital refers to

that part of the firms capital which is needed for financing short terms or current

assets such as marketable securities, debtors and inventories etc, working capital in

brief, is the amount of funds necessary to cover the cost of operating the enterprise.

Just as circulation of blood is essential in the human body for maintaining life of a

person, working capital is very essential to maintain the smooth running of a business.

The modern thinking in financial management gives greater importance to

management decision making and policy. Today, the financial manager is not in a

passive role of score keeper of the accounting information and arranging funds.

Whenever directed to do so. Rather, he occupies a key role in solving the complex

management problems. He is not responsible for shaping the fortunes of the enterprise

and is involved in the most vital management decision of allocation of resource

G.K.C.E, SULLURPET 1

A STUDY ON RATIO ANALYSIS

INDUSTRY PROFILE

ELECTRONIC INDUSTRY

Electronics is a branch of technology dealing with the motion and behavior

of electrons. Although the term derives vacuum tube technology, it now encompasses

the sold state circuits and devices used in computing and communications.

HISTORY IN INDIA

The Electronics Industry in India was nucleated in the late forties with the

setting up of production base for radio receivers by a few private firms using foreign

collaborations. In the initial stages, the production activities were mainly in the fields

of consumer electronics and certain type of components. Two public sector units,

namely BHEL and Indian Institute of Technology (IIT) both at Bangalore, were also

manufacturing professional electronic items to meet the requirements of P&T.

Introduction of transistor radio I early 60’s led to phase which witnessed steady

growth in production of import substitutions, diversification of product range and

entry into export market.

Production of electronic equipment and components has come a long way

since the days of radio receivers in the 1950’s. the electronics industry in India has

grown with domestic demand, as a result of import substitution effort.

During the 1970’s electronics industry in the country derived its strength as

a labor-intensive industry. Production techniques had large manual labor content.

Dispersal of industry was given an important place in the promotional policy

framework and industry capacities were approved based on the estimated demand

over the next five years. In the growth and development of this industry, emphasis

was placed on indigenization of applications of electrons.

While on the one hand, this had enabled development of largely decision

consumer electronics industry (except from 1982 onwards when policy decision was

taken to introduce color TV and resulted in import of CTV tubes and semiconductors

G.K.C.E, SULLURPET 2

A STUDY ON RATIO ANALYSIS

required for assembly), it is has generated enough demand of components to enable

mass production using some degree of automation.

PRODUCTION AND DEFENSE UNDERTAKING

A substantial part of the defense stores needed by the services is now being

developed and produced in the country. The responsibility for this has been entrusted

to the Department of Defense Production and supplies, which organizes, directs and

coordinates production of material and equipment required by the Armed Forces. It

carries our its responsibility through the Directorate of standardization, Defense

Research and Development (DRDO) and eight public sector undertakings.

There are 36 ordinances, factories whose main thrust is aimed at meeting the

twin objectives of modernization of the factories and increasing productivity. The

need for self-reliance under lines the existence of ordinance factories. The factories

widely dispersed over the length and breadth of the country on strategic consideration,

necessarily function interdependently. The spectrum of technology leading to self

reliance. The range of products in these factories include armored vehicles,

sophisticated anti tank guns, anti-aircraft guns, field guns, self propelled guns,

mounted guns, motors, small arms and their related ammunitions. In addition software

items combat clothing, high attitude clothing, parachutes, and mountaineering

equipment are also being manufacturing.

There are Eight Public Sector enterprises under the department of defense

production and supplies. These are

1. Hindustan Aeronautics Limited (HAL).

2. Bharat Electronic Limited(BHEL)

3. Bharat Earth Movers Limited(BEML)

4. Mozagan Dock Limited(MDL)

5. Garden Reach Ship Builders & Engineers Limited(GRS&E)

6. Goa Ship Yard Limited (GSL)

7. Bharat Dynamics Limited (BDL)

8. Misra Dhatu Nigam Limited (MIDHANI)

G.K.C.E, SULLURPET 3

A STUDY ON RATIO ANALYSIS

The BHEL was established in 1954 with a single unit at Jalahalli,

Bangalore to develop the indigenous electronic industry. Since then, it has gone into

leader in professional electronics with its eight more units.

G.K.C.E, SULLURPET 4

A STUDY ON RATIO ANALYSIS

COMPANY PROFILE

BHEL is one of the pioneers in engineering industries in the world. The vital

role played by BHEL today in the country is the mark of its continuous efforts to

improve the service in the nation by consultancy, manufacturing and offering services

in power sector.

The success story of BHEL however goes back in 1956 when its first plant

was setup in Bhopal. The three major plants in HARIDWAR, HYDERABAD AND

THRICHIRAPALLI followed this. These plants have been the core of BHEL’S

efforts to grow, diversify, and become one of the most integrated power and industrial

equipment manufacturers in the world. The company now has 14 manufacturing units,

8 service centers and 4 power sectors regional centers, besides project sites spread all

over India and abroad.

BHEL manufactures over 180 products under 30 major product groups and

caters to core sectors of the Indian Economy viz., Power Generation & Transmission,

Industry, Transportation, Telecommunication, Renewable Energy, oil business etc.

Its products have been established an enviable reputation for high quality and

reliability. This is due to the emphasis placed all along on design, engineering and

manufacturing to international standards by acquiring and adopting some of the best

technologies developed in its own R&D centers. BHEL has acquired ISO 9000

certification for quality management and ISO 14001 certification for environment

management. BHEL caters to the needs of different sectors by designing and

manufacturing according to the needs of its clientele in power sector.

ABOUT B.H.E.L RAMACHANDRAPURAM UNIT

As a member of the prestigious “BHEL” family”, BHEL – Hyderabad has

earned a reputation as one of its most important manufacturing units, contributing its

lion’s share in BHEL Corporation’s overall business operation.

G.K.C.E, SULLURPET 5

A STUDY ON RATIO ANALYSIS

The Hyderabad unit was setup in 1963 and started its operations with manufacture

of turbo-generator sets and auxiliaries for 60 and 110 MW thermal utility sets.

Over the years it has increased its capacity range and diversified its operations to

many other areas. Today, a wide range of products are manufactured in this unit,

catering to the needs of variety of industries like fertilizers & chemicals,

petrochemicals & refineries, paper, sugar, steel, etc.,

BHEL – Hyderabad unit has collaborations with world renowned MNCs like

M/S General Electric, USA, M/S Nuovo pignone, etc.

COMPANY’S VISION, MISSION AND VALUES

VISION

A world class, innovative, competitive and profitable engineering enterprise providing

total business solutions.

MISSION

To be the leading engineering enterprise providing quality

Products systems and services in the field of energy, transportation industry,

infrastructure and other potential areas.

VALUES

Meeting commitment made to external & internal customers.

Fosters learning, creativity & speed of response.

Respect for dignity & potential of individuals.

Loyalty and pride in the company.

Team playing.

Zeal to excel.

Integrity and fairness in all matters.

History of Bharat Heavy Electricals Ltd.

G.K.C.E, SULLURPET 6

A STUDY ON RATIO ANALYSIS

Bharat Heavy Electricals Ltd - Comp. was set up at Bhopal in the name of M/s Heavy

electrical Indias limited in collaboration with AEI, UK. Subsequently, three more

plants were set up at Hyderabad, Hardwar & Trichy. The Bhopal Unit was controlled

by company, the other three were under the control of Bharat Hevey Electricals Ltd.

- The Company object is to manufacture of heavy electrical equipments. ---1972

- In July the Operations of all the four plants were integrated. ----1974

- In January Heavy electrical [Indias] Ltd was merged with BHEL.

- For the manufacture of wide variety of products, the Comp. has developed

technological infrastructure, skills & quality to meet the stringent requirements of

power plants, transportation, petro chemicals, oil etc.

- BHEL has entered into collaboration which are technical in nature. Under these agreements, the collaborators have transferred, furnished the information, documentation, including know-how relating to design, engineering, manufacturing assembly etc.

captive power plant at a steel plant in West Bengal.

-Bharat Heavy Electricals Ltd [BHELs]has informed that a Joint Venture agreement between the Comp. & NTPC Ltd has been singed on December 17, 2007 for Establishment & Operation of Joint Venture Comp. for taking up EPC business.

2008 - 2010

- Bharat Heavy Electricals Limited [BHELs], Trichy, has secured orders worth Rs

15,000 crore, its all-time high. BHEL, said the recent MoU with the TNEB for setting

up two 800 Mw thermal power stations near Chennai had resulted in the power plant

major bagging orders.

-Bharat Heavy Electricals Ltd [BHELs] has informed that pursuant to order dated

March 04, 2008 issued by Ministry of Heavy Industries & Public Enterprises,

Department of Heavy Industry, Shri. K Ravi Kumar Director [Powers]/BHEL has

been entrusted with additional charge of post of Chairman & Managing

Director/BHEL w.e.f. March 01, 2008.

G.K.C.E, SULLURPET 7

A STUDY ON RATIO ANALYSIS

- BHEL ties up with AP Genco for Vizag unit.

SWOT ANALYSIS

The strengths, weakness, opportunities and threats which are experienced by

BHEL as a growing concern, have been summed up in the following lines.

Strengths

Vast pool of trained manpower.

Excellent state of all factors.

Good working condition.

Rapport between management and union.

Products manufactured to international standards.

Low labor cost and low manufacturing cost.

Weakness

Excess manpower.

System implementation inadequate.

No financial parlage.

Inadequate compensation payable to employees.

Opportunities

Growing power sector machinery.

Liberalizations has opened up the market.

Navaratna company status.

Dominate players in domestic market.

Export potential growing.

Threats

G.K.C.E, SULLURPET 8

A STUDY ON RATIO ANALYSIS

Liberalizations – Entry of MNC’s / private sector – More compensation.

MNC wearing away good employees with

good attractive salaries.

Govt. Taxation policy – against

manufacturing sectors.

Dumping of goods.

Attractive credit policy by FFI and MNC.

PRODUCT PROFILE

BHEL manufactures a wide range of Power plant equipments and also caters to the industry sector.

THE PRODUCTS PROFILE INCLUDES

Gas Turbines

Turbo generators

Pumps

Solar Water Heating Systems

Electrics for Urban Transportation System

G.K.C.E, SULLURPET 9

Figure-1

A STUDY ON RATIO ANALYSIS

GAS TURBINES

BHEL - the largest Gas Turbine manufacturer in India, with the state-of-art

facilities in all areas of Gas Turbine manufacture provide complete engineering in-

house for meeting specific customer requirement. 

With over 100 machines and cumulative fired hours of over four million hours,

BHEL has supplied gas turbines for variety of applications in India and abroad.

BHEL also has the world’s largest experience of firing highly volatile naphtha fuel on

heavy duty gas turbines.

TURBO GENERATORS

G.K.C.E, SULLURPET 10

Figure-2

A STUDY ON RATIO ANALYSIS

BHEL presently has manufactured Turbo-Generators of ratings upto 560 MW

and is in the process of going up to 660 MW. It has also the capability to take up the

manufacture of ratings up to 1000 MW suitable for thermal power generation, gas

based and combined cycle power generation as-well-as for diverse industrial

applications like Paper, Sugar, Cement, Petrochemical, Fertilizers, Rayon Industries,

etc. Based on proven designs and know-how backed by over three decades of

experience and accreditation of ISO 9001, the Turbo-generator is a product of high-

class workmanship and quality. Adherence to stringent quality-checks at each stage

has helped BHEL to secure prestigious global orders in the recent past from Malaysia,

Malta, Cyprus, Oman, Iraq, Bangladesh, Sri Lanka and Saudi Arabia. The successful

completion of the various export projects in a record time is a testimony of BHEL's

performance.

PUMPS

Figure-4

BHEL started manufacture of Pumps during the mid-sixties under technical

collaboration with M/s Sigma Latin, Czechoslovakia, to meet the requirements of 60

MW, 110 MW and 210 MW thermal power stations, the scope of which was widened

to meet the requirements of power plants up to 500 MW, with the help of another

collaboration with M/s Weir Pumps, U.K. BHEL has also made some in-house

G.K.C.E, SULLURPET 11

Figure

A STUDY ON RATIO ANALYSIS

product development to gain spin off benefits from the above collaboration as well as

to develop new pumps to meet the requirements of Combined Cycle Power plants.

BHEL has undertaken a design up-gradation and retrofit of the existing 200 KHI

Boiler Feed pumps Inside Stators with energy efficient hydraulics and cartridge

design internals under technical tie-up with M/s Sulzer Pumps, Germany; and

recommended the upgraded 200 KHI-S Boiler Feed pump to all customers of 110

MW & 210 MW Power Stations operating with the earlier Czech design for increase

of pump availability and reliability and also considerable reduction in operational

costs.

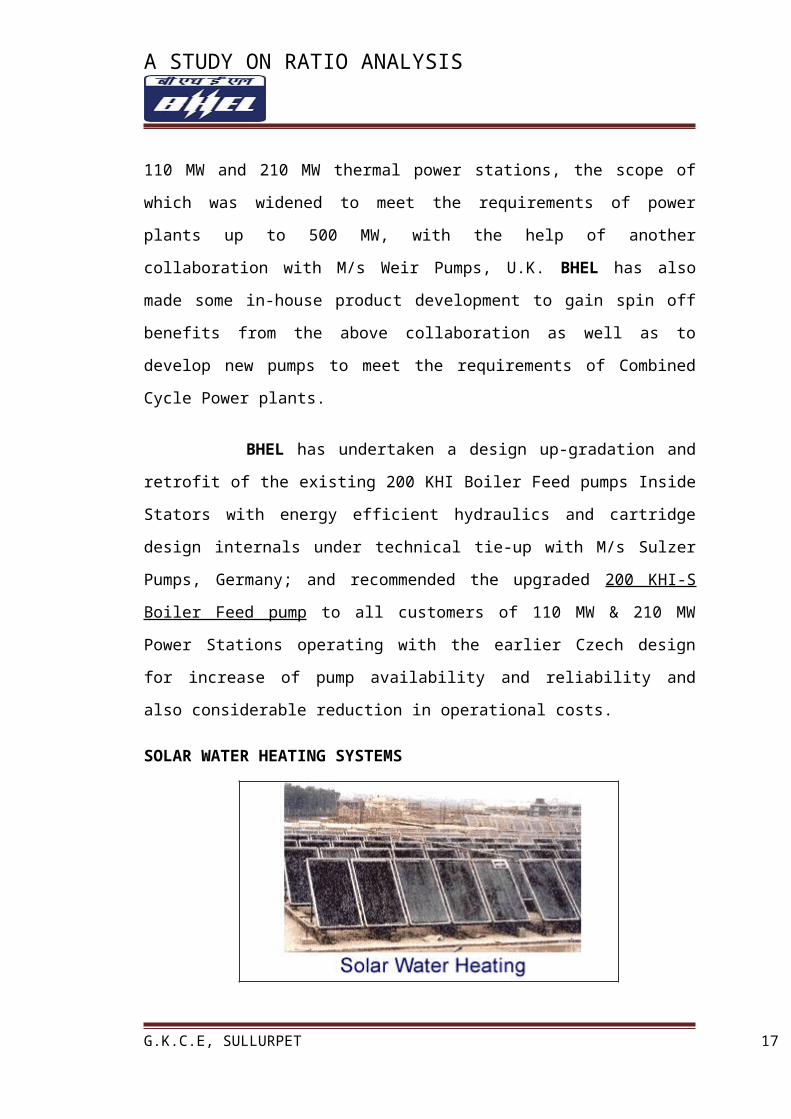
SOLAR WATER HEATING SYSTEMS

Figure-5

BHEL a pioneer in the field of design manufacturing and installation of solar

water heating systems (SWHS) in the country till date have installed systems covering

more than 74,000 m2 of absorber area of capacity over 37 Lakh liters per day. The

largest over SWHS of 40000 LPD for space heating is in use at Dr. Willmar Schwab

India Pvt. Ltd. Noida.

Solar water heating systems are environmental friendly, pollution free equipments,

harnessing the abundantly available Sun's energy. They find application at homes,

hostels, hotels, and hospitals (swimming pool, bathing, washing, cleaning and

cooking); in industrial process heating (Textile, Food processing, Pharmaceutical,

G.K.C.E, SULLURPET 12

A STUDY ON RATIO ANALYSIS

Dyeing, Breweries, Metal Plating industries); Milk dairies and chilling plants; space

heating in central air conditioning systems; pre-heating of boiler feed water. 

In the BHEL make Solar Collector, stabilized efficiency values up to 65% is assured

under normal circumstances over a long period without degradation.

ELECTRICS FOR URBAN TRANSPORTATION SYSTEM

Figure-6

25 KV AC, 50 HZ, single phase, broad gauge/meter gauge, Electrical Multiple

Units with DC Drives.

1500V DC, broad gauge/meter gauge, Electric Multiple Units with DC Drives.

25 KV AC/1500 VDC broad gauge Electrical Multiple Units with 3 phase

drive. 

Diesel Electric at Multiple Units

Metro Railway.

Tram Cars

G.K.C.E, SULLURPET 13

A STUDY ON RATIO ANALYSIS

Some of the other products manufactured by BHEL are:

THERMAL POWER PLANT

Steam turbines, boilers and generators of up to 500 MW capacities to manufacture

boilers and steam turbines with super critical steam cycle parameters and matching

generators up 660 MW unit facilities available for 1000MW size.

HYDRO POWER PLANT

Mini/Micro hydro sets

Spherical, butterfly, rotary values auxiliaries for hydro station.

BOILERS

Heat recovery steam generators, pressure vessels chemical recovery boilers for paper

industry ranging from capacity of 100 to 100t/day of dry solids.

POWER DEVICES

High power capacity silicon diodes, Thyristor devices and solar Photovoltaic cells.

SYSTEM AND SERVICES

Power generation system

Transmission system

Transportation system

Industrial system

PIPING SYSTEM

G.K.C.E, SULLURPET 14

A STUDY ON RATIO ANALYSIS

Constant load hangers clamp and hanger components, variable, spring hanger for

power station up to 850 MW capacities combined cycle plants, industrial boilers and

process industries.

TRANSFORMERS

Power transformers for voltage up to 400 KV

HVDC transformers and reactors of up to + or – 500 KV

CAPACITORS

Power capacitors for industrial and power systems of up to 250 KVA rating for

application up to 400 KV

Coupling/CVVT capacitors for voltages up to 400 KV

STUDY OBJECTIVES OF THE

• To find out the cash fluctuations of liquidity,profitability position in the BHEL

• To find out the different types of ratios in the BHEL company

• To find out the financial performance & financial distributions of the BHEL

• To examine the feasibility of present system of managing Working Capital

turnover ratios in the Company

• To find out the working capital turnover ratios to analyze from 2007 – 08 to

2011-12.

SCOPE OF THE STUDY :

The study is confirmed to the management of RATIO ANALYSIS in

BHEL. Hyderabad. The main aim of the study is to asses the necessary of

managing Current Assets and Current liabilities.

NEED FOR STUDY

G.K.C.E, SULLURPET 15

A STUDY ON RATIO ANALYSIS

The most important functions of the business firm are production, marketing

finance. It is very difficult to separate finance functions from production, marketing

and other functions. The functions of raising funds, investing them in assets and

distributing returns earned from assets to share holders are respectively known as

financing, investing and dividend decisions. In doing so, a firm attempts to balance

cash inflow and outflows. Finance function call for skillful planning control and

execution of firm’s activities.

Hence, the study is taken to analyze the firm’s activities through “RATIO

ANALYSIS”

RESEARCH METHODOLOGY

The methodology to be followed here is –

Preparation of numeric data tables with data of accounting year wise

factors of ratios with calculated ratios.

Graphical presentation of the ratios indicating changes.

Interpretation with the help of numeric and graphical presentation.

Opinion based on result on result of the analysis with conclusion.

DATA COLLECTION

Primary Data:

Personal Interview was held with key personnel of finance

department.

Secondary Data:

G.K.C.E, SULLURPET 16

DATA COLLECTION METHODS

PRIMARY DATA SECONDARY DATA

A STUDY ON RATIO ANALYSIS

Secondary data are those data, which were already prepared by some others. I

have collected some more data from the following data

i. From the Balance sheets and P&L accounts.

ii. Published and unpublished manuals, records and files.

Other information is gathered from the books mentioned in bibliography

LIMITATIONS

As the time span of the study is only eight weeks gathering total information is

not possible.

There is very less scope of gathering the confidential data as we are only

vocational trainees.

During the project period as some executives were busy with their work they

could not afford to give full information.

The analysis and interpretation of collected data is restricted to necessary

information.

Working Capital standards pertains to relevant industry is also a limiting

factor for comparative analysis.

The members of financial department are very busy with the audit work; hence

they are not being able to spend more time for me.

G.K.C.E, SULLURPET 17

A STUDY ON RATIO ANALYSIS

THEORETICAL FRAME WORK

RATIO ANALYSIS

Financial ratios are useful indicators of a firm's performance and financial

situation. Financial ratios can be used to analyze trends and to compare the firm's

financials to those of other firms. Ratio analysis is the calculation and comparison of

ratios which are derived from the information in a company's financial statements.

Financial ratios are usually expressed as a percent or as times per period. Ratio

analysis is a widely used tool of financial analysis. It is defined as the systematic use

of ratio to interpret the financial statements so that the strength and weaknesses of a

firm as well as its historical performance and current financial condition can be

determined. The term ratio refers to the numerical or quantitative relationship between

two variables. With the help of ratio analysis conclusion can be drawn regarding

several aspects such as financial health, profitability and operational efficiency of the

undertaking. Ratio points out the operating efficiency of the firm i.e. whether the

management has utilized the firm’s assets correctly, to increase the investor’s wealth.

It ensures a fair return to its owners and secures optimum utilization of firm’s assets.

Ratio analysis helps in inter-firm comparison by providing necessary data. An inter

firm comparison indicates relative position. It provides the relevant data for the

comparison of the performance of different departments. If comparison shows a

variance, the possible reasons of variations may be identified and if results are

negative, the action may be initiated immediately to bring them in line. Yet another

dimension of usefulness or ratio analysis, relevant from the View point of

G.K.C.E, SULLURPET 18

A STUDY ON RATIO ANALYSIS

management is that it throws light on the degree efficiency in the various activity

ratios measures this kind of operational efficiency.

Significance or Importance of Ratio Analysis

It helps in evaluating the firms performance

With the help of ratio analysis conclusion can be drawn regarding several

aspects such as financial health, profitability and operational efficiency of the

undertaking. Ratio points out the operating efficiency of the firm i.e. whether the

management has utilized the firm’s assets correctly, to increase the investor’s wealth.

It ensures a fair return to its owners and secures optimum utilization of firms assets.

It helps in inter-firm comparison

Ratio analysis helps in inter-firm comparison by providing necessary data. An

inter firm comparison indicates relative position. It provides the relevant data for the

comparison of the performance of different departments. If comparison shows a

variance, the possible reasons of variations may be identified and if results are

negative, the action may be initiated immediately to bring them in line.

It simplifies financial statement

The information given in the basic financial statements serves no useful

Purpose unless it s interrupted and analyzed in some comparable terms. The ratio

analysis is one of the tools in the hands of those who want to know something more

from the financial statements in the simplified manner.

It helps in determining the financial position of the concern

Ratio analysis facilitates the management to know whether the firms financial

position is improving or deteriorating or is constant over the years by setting a trend

with the help of ratios The analysis with the help of ratio analysis can know the

direction of the trend of strategic ratio may help the management in the task of

planning, forecasting and controlling.

G.K.C.E, SULLURPET 19

A STUDY ON RATIO ANALYSIS

It is helpful in budgeting and forecasting

Accounting ratios provide a reliable data, which can be compared, studied and

analyzed. These ratios provide sound footing for future prospectus. The ratios can also

serve as a basis for preparing budgeting future line of action.

Liquidity position

With help of ratio analysis conclusions can be drawn regarding the Liquidity

position of a firm. The liquidity position of a firm would be satisfactory if it is able to

meet its current obligation when they become due. The ability to met short term

liabilities is reflected in the liquidity ratio of a firm.

Long term solvency:

Ratio analysis is equally for assessing the long term financial ability of the

Firm. The long term solvency is measured by the leverage or capital structure and

profitability ratio which shows the earning power and operating efficiency, Solvency

ratio shows relationship between total liability and total assets.

Operating efficiency:

Yet another dimension of usefulness or ratio analysis, relevant from the View

point of management is that it throws light on the degree efficiency in the various

activity ratios measures this kind of operational efficiency.

Ratio analysis is a widely used tool of financial analysis. It is defined as the

systematic use of ratio to interpret the financial statements so that the strength and

weaknesses of a firm as well as its historical performance and current financial

condition can be determined. The term ratio refers to the numerical or quantitative

relationship between two variables.

There are four important categories of ratios related to the RATIO

ANALYSIS of the firms. They are

1. Liquidity ratios

2. Leverage ratios

G.K.C.E, SULLURPET 20

A STUDY ON RATIO ANALYSIS

3. Profitability ratios

4. Activity ratios

1. LIQUIDITY RATIOS

It is extremely essential for a firm to be able to meet its obligations as they

become due. Liquidity ratios measure the ability of the firm to meet its current

obligations.

The most common ratios, which indicate the extent of liquidity, are

1.A. Current ratio

1.B.Quick ratio

1.A.CURRENT RATIO

The current ratio is calculated as per the following formula

Current ratio = Current assets

Current liabilities

Current assets include cash and those assets, which can be converted into cash

within a year. All obligations maturing within a year are included in current

liabilities.

As a conventional rule, a current ratio of 2:1 or more is considered

satisfactory. The higher the current ratio, the greater the margin of safety.

1.B.QUICK RATIO

An asset is quick or liquid if it can be converted into cash immediately without

a loss of value. Cash is the most liquid asset. Other assets which are considered to be

relatively liquid and included in quick assets are debtors and bills receivables and

marketable securities.

The ratio can be calculated by using the following formula

G.K.C.E, SULLURPET 21

A STUDY ON RATIO ANALYSIS

Quick ratio = Quick assets

Current liabilities

Generally a quick ratio of 1:1 is considered to represent a satisfactory current

financial position.

2.LEVERAGE RATIOS

The short term creditors like bankers and suppliers of raw material are more

concerned with the firm’s current debt paying ability. On the other hand, long term

creditors, like debenture holders, financial institutions etc., are more concerned with

the firm’s long term financial strength.

To judge the long term financial position of the firm, financial leverage or

capital structure ratios are calculated.

Leverage ratios may be calculated form the balance sheet items to determine

the proportion of debt in total financing.

The leverage ratios are calculated in two methods. Such as

2.A. Total debt ratio

2.B.Debt equity ratio

2.A. TOTAL DEBT RATIO

Debt ratio is used to analyze the long term solvency of a firm. The firm may

be interested in knowing the proportion of the interest bearing debt in the capital

structure. It may, therefore, compute the debt ratio by using following formula

Debt Ratio = Total debt

Total debt+Net worth

2.B. DEBT EQUITY RATIO

G.K.C.E, SULLURPET 22

A STUDY ON RATIO ANALYSIS

From the total debt ratio which clears the percentage of lenders contribution to

owner’s contribution or the relationship describing the lender’s contribution for each

rupee of the owner’s contribution is called debt equity ratio. It can be calculated by

using the following formula

Debt equity ratio = Total debt

Net worth

3.PROFITABILITY RATIOS

The profitability ratios are calculated to measure the operating efficiency of

the company.

A company should earn profits to survive and grow over a long period of time.

Profit is the difference between revenues and expenses over a period of time. We

should continuously evaluate the efficiency of its company in terms of profit.

Generally, two major types of profitability ratios are calculated

1. Profitability in relation to sales

2. Profitability in relation to investment

3.A. GROSS PROFIT MARGIN

The first profitability ratio in relation to sales is the gross profit margin. It can

be calculated as

Gross profit margin = Sales – Cost of goods sold

Sales

This ratio indicates the average spread between the cost of goods sold and

sales revenue.

G.K.C.E, SULLURPET 23

A STUDY ON RATIO ANALYSIS

A high gross profit margin ratio is a sign of goods management. It is relative

to the industry average implies the firm able to produce at relatively lower cost. A

low gross profit margin may reflect higher cost of goods sold due to the firm’s

inability to purchase raw materials at favorable terms, inefficient utilization of plant

and machinery or over investment in fixed assets resulting higher cost of production.

3.B. NET PROFIT MARGIN

Net profit is obtained when operating expenses, interest and taxes are

subtracted form the gross profit. The ratio is measured by using the following formula

Net profit margin = Profit after tax (PAT)

Sales

This ratio is establishes a relationship between net profit and sales and

indicates management’s efficiency in manufacturing, administering and selling the

products. This ratio is the overall measure of the firm’s ability to turn each rupee

sales into net profit.

3.C. RETURN ON INVESTMENT

The term investment may refer to total assets or net assets. The conventional

approach of calculating return on investment is to divide profit after tax by

investment.

ROI = EBIT (I-T)

Net assets

4.ACTIVITY RATIOS

Activity ratios are employed to evaluate the efficiency with which the firm

manages and utilizes its assets. These ratios are also called turnover ratios because

they indicate the speed with which assets are being converted or turnover into sales.

Following are the different activity ratios

4.A. Inventory turnover ratio

G.K.C.E, SULLURPET 24

A STUDY ON RATIO ANALYSIS

4.B. Debtors turnover ratio

4.C. Assets turnover ratio

4.D. Fixed assets turnover ratio

4.A. INVENTORY TURNOVER RATIO

This ratio indicates the efficiency of the firm in producing and selling its product. It

is calculates as

Inventory turnover ratio = Cost of goods sold

Average work-in-progress

4.B DEBTORS TURNOVER RATIO

Debtors are expected to be converted into cash over a short period and

therefore are included in current assets. The liquidity position of the firm depends on

the quality of debtors to a great extent. Debtors turnover ratio is calculated by using

the following formula

Debtors turnover ratio = Credit Sales

Average debtors

4.C. ASSETS TURNOVER RATIOS

Net assets turnover ratio = Sales

Net assets

Net assets include net fixed assets and net current assets minus current

liabilities.

A firm’s ability to produce a large volume of sales for a given amount of net

assets is the most important aspect of its operating performance.

Total assets turnover ratio = Sales

G.K.C.E, SULLURPET 25

A STUDY ON RATIO ANALYSIS

Total assets

4.D) FIXED ASSETS TURNOVER RATIO:

The numerator of this ratio is the sales for the period and the denominator is

the balance in the net fixed assets account at the end of the year. This ratio is

supposed to measure the efficiency with which fixed assets are employed. A high

ratio indicates a high degree of efficiency in assets utilization and a low ratio reflects

inefficient use of assets. It is calculated by dividing sales with fixed assets. It is used

to highlight the extent of utilization of the company’s plant equipment.

Fixed assets turnover ratio = Sales

Fixed assets

DATA ANALYSIS & INTERPRETATION

Current ratio:-

The current ratio is calculated by dividing current assets by current liabilities.

Current

assets include cash and those assets, which can be

converted into cash within a year, such as marketable

securities, debtors and inventories.

Current liabilities include creditors, bills payable, accrued expenses, short

term bank loans etc.

CURRENT RATIO = CURRENT ASSETS

CURRENT LIABILITIES

Table 1:-

G.K.C.E, SULLURPET 26

A STUDY ON RATIO ANALYSIS

YEAR CURRENT ASSETS CURRENT LIABILITIES RATIO

2007-08 174043233.6 80007395.82 2.17

2008-09 119472334.5 89258186.27 1.338

2009-10 85350227.24 81488065.33 1.047

2010-11 145292000 117086000 1.24

2011-12 158329780 78980214.39 2.01

Graph no.1:-

Interpretation:-

The normal standard of current ratio is 2:1. The company’s current ratio is

more than the standard ratio in 2007-08, i.e. 1.24, 2008-09(2.01). in the remaining

G.K.C.E, SULLURPET 27

A STUDY ON RATIO ANALYSIS

years 2007-08 (2.17), 2008-09(1.33) ,2009-10(1.04) the current ratio is lower than

the standard ratio.

2. Quick ratio:-

This ratio establishes a relationship between quick or liquid assets and

current liabilities. An asset is liquid if it can be converted into cash immediately or

reasonably soon without a loss of value cash is the most liquid assets, other assets

are bills receivables, debtors and marketable securities. Inventories are considered

to be less liquid.

The ratio shows the assets which are immediately converted into cash to

meet the short term obligations of the firm.

QUICK RATIO = CURRENT ASSETS-(STOCK+PREPAID EXPENCES)

CURRENT LIABILITIEs

Table no. 2:-

G.K.C.E, SULLURPET 28

A STUDY ON RATIO ANALYSIS

YEAR QUICK ASSETS CURRENT LIABILITIES RATIO

2007-08 101406887.1 80007395.82 1.267

2008-09 112520280.53 89258186.27 1.261

2009-10 65172524.29 81488065.33 0.799

2010-11 134132000 117086000 1.145

2011-12 93876746.86 78980214.39 1.188

Graph no.2:-

Interpretation:-

G.K.C.E, SULLURPET 29

A STUDY ON RATIO ANALYSIS

The normal standard of Quick Ratio is 1:1. In only one year the ratio

decreased than the standard ratio, i.e. 0.799 in 2009-10. In remaining years 2008-

09(1.26),2008-09(1.21),2010-11(1.14),2011-12(1.18) the quick ratio maintains the

ratio higher than the standard ratio. So the quick ratio is in a satisfied manner.

3. Inventory turnover ratio:-

The inventory turnover ratio measures how quickly the stock

is converted into sales. It is the test of efficient inventory

management. To measure the efficient, the ratio should be

compared on the basis of trend analysis or with the level of other

firms. The higher the ratio, the better is the performance of the

company. A low ratio may indicate a slow moving inventory.

INVENTORY TURNOVER RATIO = COST OF GOODS SOLD

AVERAGE INVENTOR

Table no.3:-

YEARCOST OF GOOD SOLD AVERAGE INVENTORY RATIO

2007-08 227335354 45831224.04 4.96

G.K.C.E, SULLURPET 30

A STUDY ON RATIO ANALYSIS

2008-09 277429458 24784534.25 11.19

2009-10 296868782.6 12932762.7 22.95

2010-11 478057802.39 15046401.2 31.77

2011-12 70274871.73 37806516.57 1.85

Graph no.3:-

Interpretation:-

The above graph indicates the increasing trend of inventory

turnover ratio from the years 2007-08(4.96),2008-09(11.19),2009-

010(22.5),2010-11(31.77). It indicates the inventory is effectively

G.K.C.E, SULLURPET 31

A STUDY ON RATIO ANALYSIS

converted into sales. But in the last year the inventory turnover

ratio is decreased to 1.85

4. Fixed assets turnover ratio:-

This ratio is supposed to measure the efficiency with which fixed assets are

employed. A high ratio indicates a high degree of efficiency in assets utilization and a

low ratio reflects inefficient use of assets. It is calculated by dividing sales with fixed

assets. It is used to highlight the extent of utilization of the company’s plant

equipment.

FIXED ASSETS TURNOVER RATIO = SALES

FIXED ASSETS

Table no.4:-

YEAR SALES FIXED ASSETS RATIO

2007-08 281649206 177111306.4 1.59

2008-09 256485255 179168799.9 1.43

2009-10 307770938.7 181315968 2.22

2010-11 567778000 190266000 2.98

2011-12 378800000 196150122.87 1.93

G.K.C.E, SULLURPET 32

A STUDY ON RATIO ANALYSIS

Graph no.4:-

Interpretation:-

The fixed assets turnover ratio is higher in 2008-09, i.e. 2.3. And in the

remaining years, the ratios are 1.377, 1.277, 1.432 and 1.616 for the years 2007-08,

2008-09, 2009-10 and 2010-11 respectively.

G.K.C.E, SULLURPET 33

A STUDY ON RATIO ANALYSIS

5. Total assets turnover ratio: -

Assets are used to generate sales. A firm should manage its assets efficiently

to maximize sales. The relationship between sales and assets is called assets

turnover ratio. Assets turnover ratio is computed by dividing sales with total assets.

TOTAL ASSETS TURNOVER RATIO = SALES

TOTAL ASSETS

Table no.5:-

YEAR SALES TOTAL ASSETS RATIO

2007-08 281649206 582554034.19 0.48

2008-09 256485255 602597207.23 0.42

2009-10 307770938.7 636378314.37 0.62

2010-11 567778000 644256581.33 0.88

2011-12 378800000 656875754.81 0.57

G.K.C.E, SULLURPET 34

A STUDY ON RATIO ANALYSIS

Graph no.5:-

Interpretation:-

The total assets turnover ratio is high in the year 2007-08, i.e. 1.036. In the

remaining years it is 0.655 in 2008-09, 0.592 in 2010-11, 0.633 in 2011-12 and 0.729

in 2010-11. It is better to improve the ratio by converting the total assets into sales.

G.K.C.E, SULLURPET 35

A STUDY ON RATIO ANALYSIS

6. Working capital turnover ratio:-

This ratio indicates whether or not working capital has been

effectively utilized in making sales. In case a company can achieve higher volume of

sales with relative small amount of working capital, it is an indication of the

operating efficiency of the company.

WORKING CAPITAL TURNOVER RATIO:- SALES

NET WORKING CAPITAL

Table no.6:-

YEAR SALES NET WORKING CAPITAL RATIO

2007-08 281649206.8 94035837.79 2.95

2008-09 256485255.3 30214148.3 11.798

2009-10 402770938.7 3862161.91 104.286

2010-11 567778000 28206000 25.21

2011-12 378800000 79349565.61 6.034

G.K.C.E, SULLURPET 36

A STUDY ON RATIO ANALYSIS

Graph no.6:-

Interpretation:-

The working capital turnover ratio is very peak in the year

2007-08, i.e. 104.28. and in the remaining years 2008-

09(2.95),2009-10(11.7),2010-11(25.2),2011-12(6.0) the working

capital ratio is in the normal position. High turnover indicates the

sign of over trading and puts the firm into financial difficulties.

7. Interest coverage ratio:-

G.K.C.E, SULLURPET 37

A STUDY ON RATIO ANALYSIS

This ratio is very important for the lenders point of view. It indicates whether

the business would earn sufficient profits to pay periodically the interest charges.

The higher the number, the more secure the lender is in respect of his periodical

interest income. It is calculated as follows:

REST COVERAGE RATIO = EBIT

INTEREST CHARGE

Table no.7:-

YEAR EBIT INTEREST RATIO

2007-08 -16602435 2195337.51 -0.8

2008-09 4175100 3007655 0.2

2009-10 -11935835.310552222.9

8-0.2

2010-11 55738197 8001000 0.6

2011-12 25993471510552222.9

20.8

Graph no.7:-

G.K.C.E, SULLURPET 38

A STUDY ON RATIO ANALYSIS

Interpretation:-

Interest coverage ratio should not decrease more than 1.5

times. If it decreases more than this it may cause the financial risk,

and the ideal one is six to seven times. The interest coverage ratio

of Sai global yarntex, ltd is negative in 2007-08 and 2008-09. It is

0.2in 2009-10 and 0.2 in 2011-12, 0.8 in 2009-10. The company

should maintain the ratio in a standard manner to avoid the problem

of financial risk.

8. Gross profit ratio:-

It is calculated by dividing the gross profit with sales. This ratio shows the

profits relative to sales after the direct production costs are deducted. This ratio

G.K.C.E, SULLURPET 39

A STUDY ON RATIO ANALYSIS

establishes the relationship between operating profit and sales to measure the

relative operating efficiency of the company.

GROSS PROFIT RATIO= GROSS PROFIT*100

NET SALES


(Gross Profit = Net Sales - Cost of Goods Sold)

Table no.8:-

YEAR GROSS PROFIT OR LOSS SALES RATIO

2007-08 646651 281649206.8 0.016

2008-09 -24709650.88 256485255.3 -6.93

2009-10 100875904.7 402770938.7 0.20

2010-11 61725000 567778000 9.24

2011-12 65438368.28 378800000 13.66

Graph no.8:-

G.K.C.E, SULLURPET 40

A STUDY ON RATIO ANALYSIS

Interpretation:-

The firm incurred gross loss in 2007-08 i.e.-6.93. And it got profits in 2008-

09(0.016), 2009-10(0.217), 2010-11(9.24) and 2011-12(13.66). The gross profit ratio

of the firm is not satisfactory due to the fluctuations in the gross profit ratio.

9. Net profit ratio:-

This ratio is measured by dividing profit after tax by sales. It indicates

management’s efficiency in manufacturing, administering and selling the products.

The ratio is the overall measure of the firm’s ability.

G.K.C.E, SULLURPET 41

A STUDY ON RATIO ANALYSIS

NET PROFIT RATIO= NET PROFIT BEFORE TAX*100

NET SALES

Table no.9:-

YEAR NET PROFIT/LOSS SALES RATIO

2007-08 -24132675.02 281649206.8 -6.323

2008-09 1107655.17 256485255.3 0.310

2009-10 72425688.91 402770938.7 0.144

2010-11 19742000 567778000 2.95

2011-12 25814892.16 378800000 5.391

Graph no.9:-

G.K.C.E, SULLURPET 42

A STUDY ON RATIO ANALYSIS

Interpretation:-

The company incurred net losses in 2007-08(-6.323) and 2008-09(5.637) and

got profits in 2009-10(0.31), 2010-11(2.95) and 2009-10(5.391). Hence it is

satisfactorily in the year 2011-12 only.

FINDINGS

G.K.C.E, SULLURPET 43

A STUDY ON RATIO ANALYSIS

The efficiency of management at financial position of BHEL is good in 2007-2008 and

2008-09.

In 2007-08 there is increase in net working capital (75,136) compare with the

previous year. It mean increasing the debt long-term source investing in current

assets which leads to increase the expenditure i.e. interest, financial charges.

The overall liquidity position of BHEL is satisfactory.

BHEL securing the long-term debts through the issue of non convertible vidyut

bonds.

The percentage of current assets, loans and advances to current liabilities increase

from 115% in 2009-10 to 124% in 2010-11 and further increased to 170% in 2011-12.

SUGGESTIONS

G.K.C.E, SULLURPET 44

A STUDY ON RATIO ANALYSIS

Company should make efforts to utilize its fixed assets in an optimum manner.

The company should adopt effective operation research techniques to reduce cost

of production.

The company should maintain enough reserves to expand the business.

The company must try for maintenances of proper current assets to possess the

short time solvency.

The company has already taken action to reduce expenditure. Yet some more

necessary steps need to be taken to reduce expenditure by the company head.

The company cash position is low. It is better to increase cash levels.

CONCLUSION

G.K.C.E, SULLURPET 45

A STUDY ON RATIO ANALYSIS

Though the finance play the vital role in versatile field. Once should have

enough conscious on each operation.

Different operating year shows the different growth in different areas. Hence each in

flow and out flow of the company shows the efficiency of the management and

maximum utilization of limited resources in an economical way.

It was a great experience in this company. According to my experience, it is a well

established organization with entire production is undertaken with highest quality

machinery’s.

It is a well build organization with great opportunity, good facilities, very well

organized environmental control and most important safely measures for safety of

employees.

However the success can be achieved through proper utilization of financial

resources, more inventory turnover, and high liquidity, less cost of production and

last but not least making a high volume of sales.

G.K.C.E, SULLURPET 46

A STUDY ON RATIO ANALYSIS

G.K.C.E, SULLURPET 47

A STUDY ON RATIO ANALYSIS

G.K.C.E, SULLURPET 48


Recommended