31
Rational Functions
| Date post: | 23-Dec-2015 |
| Category: |
Documents |
| Upload: | bernice-gilbert |
| View: | 214 times |
| Download: | 1 times |

Rational Functions

Warm-up
Complete the table and use the points to graph the rational function
f(x) =
X -4 -2 -1 -.1 0 .1 1 2 4
y
What do you notice about f(x) = ?

What do you notice about f(x) = ?
• As the absolute value of x approaches infinity (gets large), f(x) approaches zero.
• As the absolute value of x approaches zero, the absolute value of f(x) approaches infinity.
• The graph has two pieces. All rational functions have multiple pieces.
• No x or y intercepts. Gets very close to each axis, but never crosses an axis.

x-intercepts/zeros
• A rational function will only have an x-intercept or zero at an x value that makes the numerator equal zero. – That is why f(x) = has no x-intercepts.
y-intercepts
• How do you find a y intercept for each type of function?– Linear (ex: y = 3x +7)– Quadratic (ex: f(x) = x2 + 3x + 8)– Circle (x2 + y2 = 25)
How do you find y-intercepts in general?

y-intercepts
• How do you find a y intercept for each type of function?– Linear (ex: y = 3x +7)– Quadratic (ex: f(x) = x2 + 3x + 8)– Circle (x2 + y2 = 25)
How do you find y-intercepts in general?Just plug in 0 for x since the y-axis is the line x=0.

• Find the x and y intercepts of each rational function. Then graph it on your calculator to check.
Keep track of this information so we can graph these at the end of class.
Vertical Asymptotes
• What were the vertical asymptotes of f(x) = ?• What would cause this vertical asymptote to
appear in our graph?

• The line x = a is a vertical asymptote if the graph increases or decreases without bound on one or both sides of the line as x moves in closer and closer to x = a.
• A graph will have a vertical asymptote at x = a if the denominator equals zero at x = a and the numerator does not.
Finding vertical asymptotes
• Set the denominator equal to zero and solve for x. The line x = ‘those values that make your denominator equal zero’ are your vertical asymptotes.
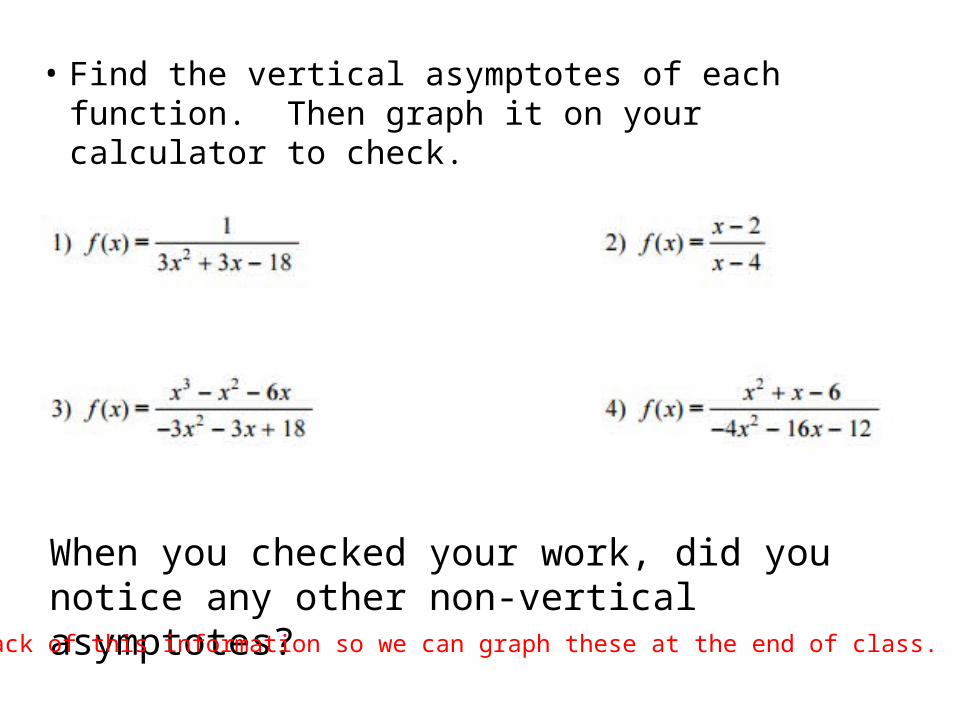
• Find the vertical asymptotes of each function. Then graph it on your calculator to check.
When you checked your work, did you notice any other non-vertical asymptotes?
Keep track of this information so we can graph these at the end of class.
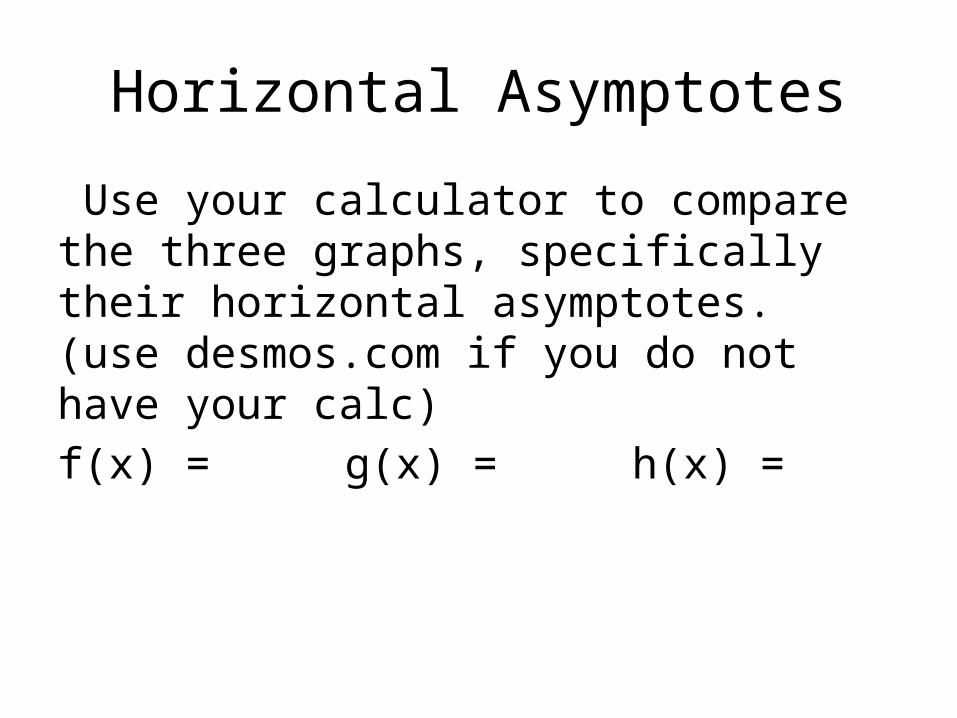
Horizontal Asymptotes
Use your calculator to compare the three graphs, specifically their horizontal asymptotes.(use desmos.com if you do not have your calc)f(x) = g(x) = h(x) =

Do it again
Use your calculator to compare the three graphs, specifically their horizontal asymptotes.(use desmos.com if you do not have your calc)f(x) = g(x) = h(x) =

Horizontal Asymptote Rules
Given:
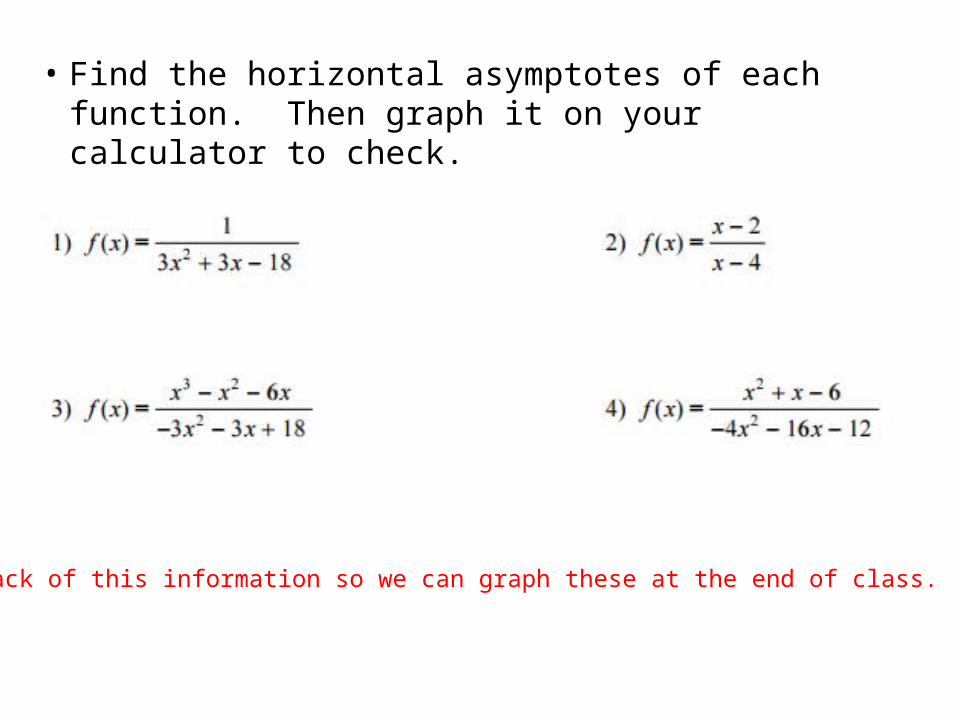
• Find the horizontal asymptotes of each function. Then graph it on your calculator to check.
Keep track of this information so we can graph these at the end of class.

Recall • A graph will have a vertical asymptote at x = a
if the denominator equals zero at x = a and the numerator does not.
• So what happens at x values when the numerator and denominator both equal zero?

Holes(x, undefined) but not an asymptote. Compare the two graphs, then compare their reciprocals.f(x) = g(x) =
How to find holes
1) Factor the numerator and denominator. 2) Set any factor that cancels out equal to zero.
Solve for x. There will be a hole at that x-value.

• Find the holes (if any) for each function. Then graph it on your calculator to check.
Keep track of this information so we can graph these at the end of class.

Steps to graphing rational functions
1) Find and plot any x & y intercepts. (slides 5,6) 2) Find and graph vertical asymptotes (slide 10)3) Find and graph horizontal asymptotes, if any
(slide 14)4) Find holes and plot with an open circle (slide 18)5) Plot at least one point in each region created by
the vertical asymptotes to see if the graph is above or below the horizontal asymptotes. The more points you plot, the more accurate/better your graph will be.

• Graph each rational function.

How to find y-values of holes
1) Cancel out common factors. 2) Plug in x value of hole.


Slant Asymptotes
Slant asymptotes will occur when n = m + 1
Do long division with the rational function. The quotient sans remainder is the slant asymptote.

• Find the slant asymptote.
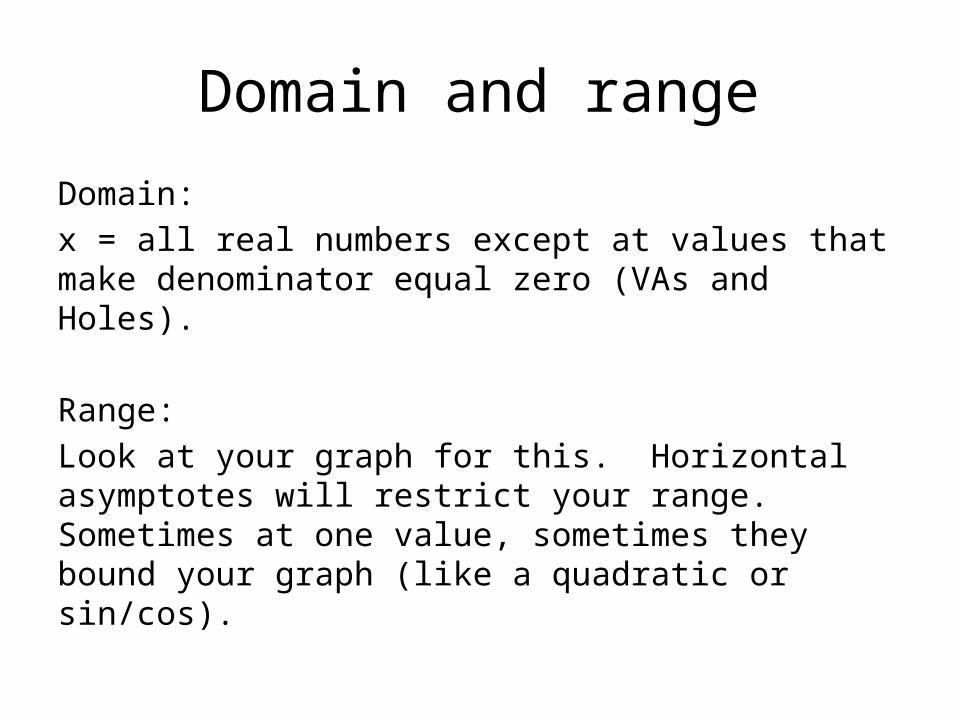
Domain and range
Domain: x = all real numbers except at values that make denominator equal zero (VAs and Holes).
Range:Look at your graph for this. Horizontal asymptotes will restrict your range. Sometimes at one value, sometimes they bound your graph (like a quadratic or sin/cos).
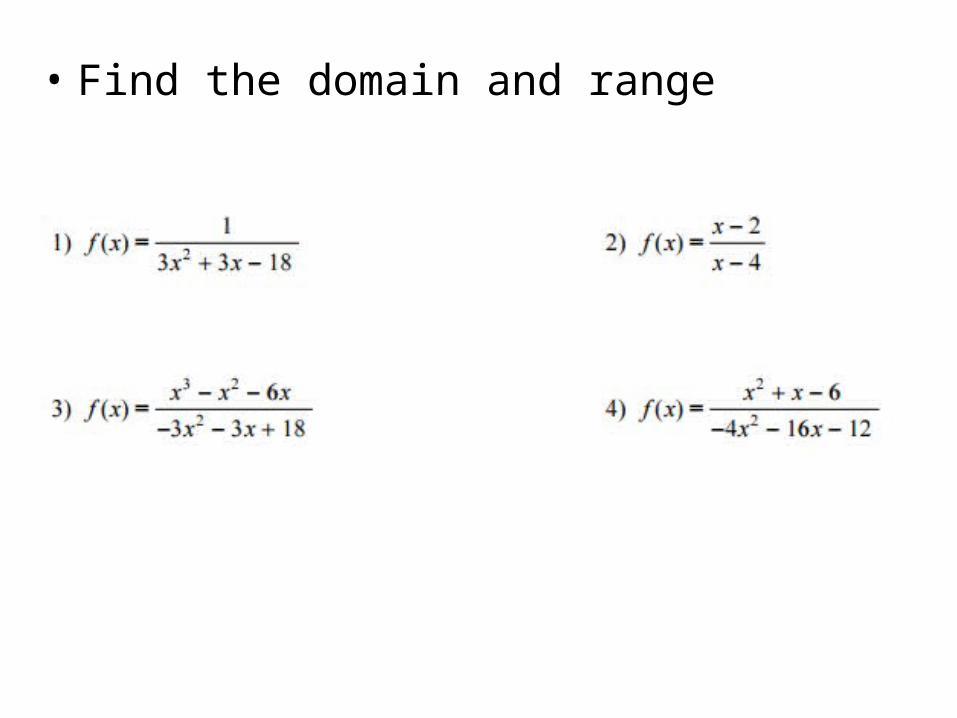
• Find the domain and range

Three types of discontinuity
Removable discontinuity – When the graph is continuous except for a hole. Jump discontinuity – When the left and right side limits are different. (does not happen in rational functions)Infinite discontinuity – Created by vertical asymptotes.

Also, categorize any discontinuity.


