+ All Categories
Home > Documents > Ratios of per Home: Single Family Units - · PDF file11B The Place at Fall Creek 1 ... 7B...

Ratios of per Home: Single Family Units - · PDF file11B The Place at Fall Creek 1 ... 7B...

Date post: 23-Mar-2018
Category:
Upload: doquynh
View: 212 times
Download: 0 times
Share this document with a friend
19
          While the common assumption is that every home contains an average of two students, in reality this ratio of students per home is actually much lower. Most suburban Districts average about 0.5 to 0.75 students per home overall, but more importantly, some specific neighborhoods have much higher and much lower ratios. It is important for PASA to understand which neighborhoods are more studentoriented and which neighborhoods house more emptynest families so that comparable ratios can be applied to the projected new housing. Ratios of Students per Home:  SingleFamily Units  The first map and chart in this chapter show ratios of students for singlefamily units within major subdivisions.  These ratios were gathered through field work to analyze the number of currently occupied homes on each street for representative subdivisions throughout the District.  The ratios of students per home ranged from 0.00 to 1.83 in specific subdivisions.  The weighted average of students per home throughout the District is 0.62.   Other subdivisions have higher ratios at present, but they have fewer than 10 students occupied, and are not shown here, as the sample size is too small to be relied upon.   The highest ratios of students per occupied home were found in the following subdivisions:                11A Atascocita Village 1.83 20 Countryside Village 4plexes 1.50 3B Deer Creek 1.42 3A El  Dorado 1.33 9B Meadowbrook 1.27 11E Classic Pines Estates 1.19 12D Sunset Ridge West 1.12 15K Beringer Place 1.10 50B River Bend 1.10 Planning Unit Subdivision Ratio Population & Survey Analysts - Demographic Update - February 2016 148
Transcript

          While the common assumption is that every home contains an average of two students, in reality this ratio of students per home is actually much lower.  Most suburban Districts average about 0.5 to 0.75 students per home overall, but more importantly, some specific neighborhoods have much higher and much lower ratios.  It is important for PASA to understand which neighborhoods are more student‐oriented and which neighborhoods house more empty‐nest families so that comparable ratios can be applied to the projected new housing.   

Ratios of Students per Home:  Single‐Family Units   The first map and chart in this chapter show ratios of students for single‐family units within major subdivisions.  These ratios were gathered through field work to analyze the number of currently occupied homes on each street for representative subdivisions throughout the District.  

The ratios of students per home ranged from 0.00 to 1.83 in specific subdivisions.  The weighted average of students per home throughout the District is 0.62.   Other subdivisions have higher ratios at present, but they have fewer than 10 students occupied, and are not shown here, as the sample size is too small to be relied upon.   The highest ratios of students per occupied home were found in the following subdivisions:                

11A Atascocita Village 1.83

20 Countryside Village 4‐plexes 1.50

3B Deer Creek 1.42

3A El Dorado 1.33

9B Meadowbrook 1.27

11E Classic Pines Estates 1.19

12D Sunset Ridge West 1.12

15K Beringer Place 1.10

50B River Bend 1.10

Planning 

Unit Subdivision Ratio

Population & Survey Analysts - Demographic Update - February 2016 148

 The lowest ratios were found in the following subdivisions:                Such data are helpful in understanding why students are more dense in specific locations, and which neighborhoods are empty‐nest areas.  They also point to neighborhoods that are disproportionately oriented to older students or to young students.  The ratios help to estimate the grade‐groups that will live in these neighborhoods over time, and, most importantly, assist in establishing the potential ratio of students per grade‐group for comparable new subdivisions and new apartment complexes.    Although these ratios are utilized to obtain projections of added students for all new subdivisions and Planning Units, it is necessary to continue evaluating long‐term trends in the ratios, as they will change as a subdivision or apartment complex ages. 

Ratios of Students per Home:  Multi‐Family Units    

In multi‐family apartment complexes, the ratios of students per unit ranged from 0.09 to 1.13in specific complexes, and the weighted average throughout the District was 0.36 students per apartment unit.  There are approximately 10,234 units in the District, with 3,557 students residing in those.  PASA could determine occupancy rates for 9,632 units, of which 8,987 were occupied, with 3,240 students residing in those apartments.    The highest ratios of students per occupied unit were found in the following complexes:          

21 Barrington Court 1.13

11B The Place at Fall Creek 1.01

11C Atascocita Pines 0.88

10A Waterchase 0.79

7B North Lake Manor 0.75

16A Timber Lake 0.67

Ratio

Apartment 

Complex

Planning 

Unit

24A Barefoot I 0.00

45 Village Falls 0.00

45 Brownstone Square 0.04

6 Northshire 0.04

42b Kings Crossing I 0.05

53A Kings Crossing III 0.05

15K Arbor Heights 0.05

50A Dogwood Acres 0.06

29B Kings Crossing IV 0.06

52A Kings Crossing II 0.06

22 Village at Tour 18 0.09

Planning 

Unit Subdivision Ratio

Population & Survey Analysts - Demographic Update - February 2016 149

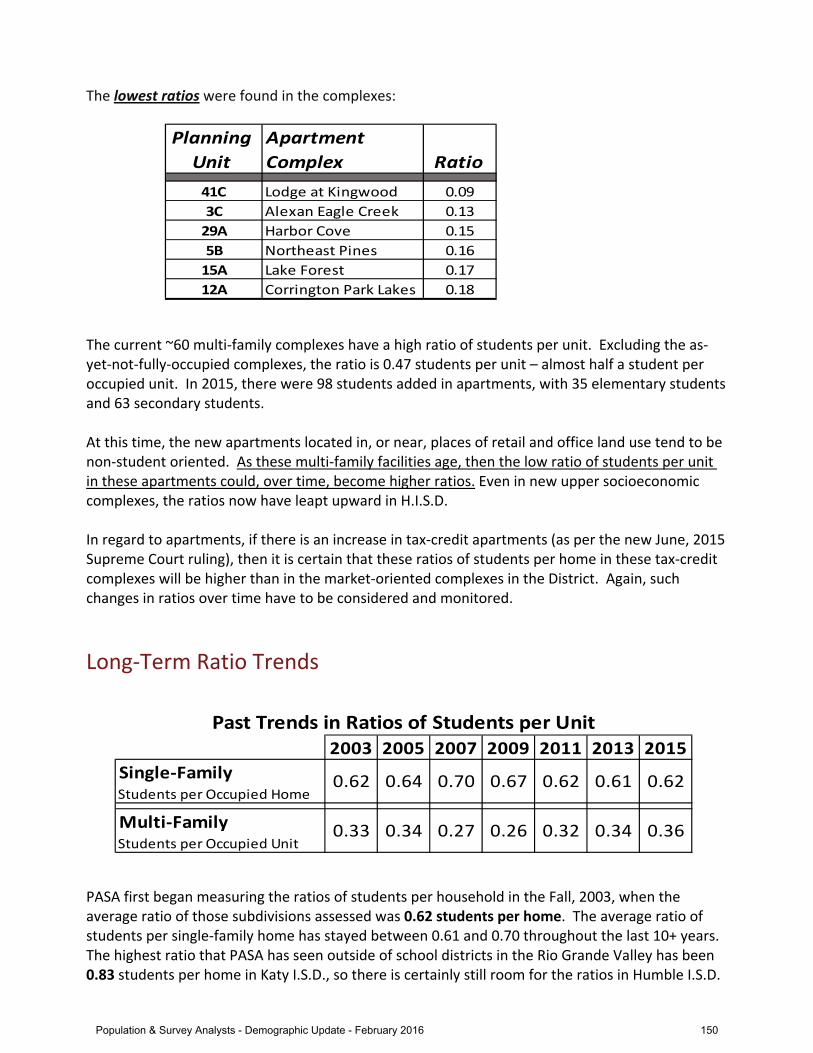
2003 2005 2007 2009 2011 2013 2015

Single‐FamilyStudents per Occupied Home

Multi‐Family Students per Occupied Unit

0.33 0.360.340.320.260.270.34

Past Trends in Ratios of Students per Unit

0.620.610.620.670.700.640.62

 The lowest ratios were found in the complexes:             The current ~60 multi‐family complexes have a high ratio of students per unit.  Excluding the as‐yet‐not‐fully‐occupied complexes, the ratio is 0.47 students per unit – almost half a student per occupied unit.  In 2015, there were 98 students added in apartments, with 35 elementary students and 63 secondary students.    At this time, the new apartments located in, or near, places of retail and office land use tend to be non‐student oriented.  As these multi‐family facilities age, then the low ratio of students per unit in these apartments could, over time, become higher ratios. Even in new upper socioeconomic complexes, the ratios now have leapt upward in H.I.S.D.    In regard to apartments, if there is an increase in tax‐credit apartments (as per the new June, 2015 Supreme Court ruling), then it is certain that these ratios of students per home in these tax‐credit complexes will be higher than in the market‐oriented complexes in the District.  Again, such changes in ratios over time have to be considered and monitored.   

Long‐Term Ratio Trends

PASA first began measuring the ratios of students per household in the Fall, 2003, when the average ratio of those subdivisions assessed was 0.62 students per home.  The average ratio of students per single‐family home has stayed between 0.61 and 0.70 throughout the last 10+ years.   The highest ratio that PASA has seen outside of school districts in the Rio Grande Valley has been 0.83 students per home in Katy I.S.D., so there is certainly still room for the ratios in Humble I.S.D. 

41C Lodge at Kingwood 0.09

3C Alexan Eagle Creek 0.13

29A Harbor Cove 0.15

5B Northeast Pines 0.16

15A Lake Forest 0.17

12A Corrington Park Lakes 0.18

Ratio

Apartment 

Complex 

Planning 

Unit

Population & Survey Analysts - Demographic Update - February 2016 150

to creep upward.  It should be noted, however, that several subdivisions are beginning to see declines in ratios of students per home, as the residents in these homes are aging in place. 

Far more difficult than projecting future housing is the estimate of how many students, on the average, will live in each existing home and apartment unit.  These ratios change each year by subdivision and apartment complex, but they also change significantly as a Districtwide average.    Such data are helpful in understanding why students are more dense in specific locations and which neighborhoods are empty‐nest areas.  They also point to neighborhoods that are disproportionately oriented to older students or to young students.  The ratios help to estimate the grade‐groups that will live in these neighborhoods over time, and, most importantly, assist in establishing the potential ratio of students per grade‐group for comparable new subdivisions and new apartment complexes.    Although these ratios are utilized to obtain projections of added students for all new subdivisions and Planning Units, it is necessary to continue evaluating long‐term trends in the ratios, as they will change as a subdivision or apartment complex ages.  Additionally, in regard to apartments, if there is an increase in tax‐credit apartments (as per the June, 2015 Supreme Court ruling), then it is certain that these tax‐credit unit ratios will be higher than the new market‐oriented complexes in Humble I.S.D.  Again, such changes in ratios over time have to be considered and monitored.         

Population & Survey Analysts - Demographic Update - February 2016 151

Upper

Lake

Dr

Tree Ln

Laure

l Sprin

gs Ln

Ch

estn

utR

idg

eD

r

Tim

ber F

orest Dr

High Valley Dr

Kings River Dr

Hamblen Rd

Kings Par

kW

ayBelleauW

oo

dD

r

Pinehurst Trail Dr

WLake Houston

Pkwy

Kings Lake Estates Blvd

Woodland H

ills Dr

Trailwoo

d Village Dr

FM 1960 Bypass

Woodridge Pkwy

E.T

ow

nse

nB

lvd

.

Upper Lake Dr.

Wo

odla

nd

Hill

sD

r.

Mills Branch Dr.

FM 1960

FM 1960

Eas

tex

Free

way

WTo

wns

en

Blvd

W.L

akeH

ousto

nP

kwy

Hamblen Rd Hamblen

Rd

Northpark Dr.

North

park

Dr.W

. Lak

e H

ous

ton

Pkw

y

W. Lake Houston Pkwy

Kingwood Dr.

Kingwood Dr.

Kingwood Dr.

King

woo

d Dr.

47A

46

48

3943

44

47B

4954B

29B

52B

29A

26B

25

15F

24B

47C

47D

27B

27A

42B42A

30B

30A

34

35

40

36

50C

31

45

33A

32

26A

15A

5B

26C

26D

41B

41C

26E

50A

41D

41A

33B

33C

28

23

24A

6

37

38

54A

52A

53A

51

53C

52C

54C

53B

50B

27C

27D

WoodspringForest

0.86

North KingwoodForest

0.86

Riverchase I0.96

Kings LakeEstates

0.88

Royal Shores- Regal Point

1.05

RiverBend

1.1

Kings RiverEstates North

1.07

Kings PointVillage - Pointe

0.89

Kings RiverVillage II

0.99

Rivergrove3.29

Woodstream0.83

SherwoodTrails III

0.74

Deer Cove0.73

LakewoodCove0.84

AtascocitaNorth0.79

Kings PointVillage - Cove

0.75 Kings PointVillage - Pointe

0.73

Kings Point Village- Landing

0.73

RiverpointVillage

0.81

Duplexes0.75

Riverchase II0.75

Sand CreekVillage II

0.78

Bear BranchVillage IV

0.76

AtascocitaPines II

0.74

Mills BranchVillage II

0.62

Sand CreekVillage III

0.61

Lakes at KingsRiver Estates

0.68

Kings RiverVillage I

0.69

Kingwood GlenVillage

0.63

Oaks ofAtascocita I

0.69Atascocita

West III0.66

Kings PointVillage

- Reserve0.7

RegentSquare

0.64

MittagManor0.63

Mills BranchVillage I

0.63

Green TreeVillage II

0.63

Green TreeVillage IV

0.66

Woodland HillsVillage III

0.64

Bear BranchVillage III

0.68

Hunters RidgeVillage II

0.66

Hunters RidgeVillage III

0.69

AtascocitaWest II

0.69

Waterview0.64

Elm GroveVillage I

0.54

Green TreeVillage I

0.52

Oak Manor0.58

FostersMill

Village0.5

KingsForestEstates

0.5

Hunters RidgeVillage I

0.58

Woodland HillsVillage II

0.57

ForestCove0.49

AtascocitaShores South

0.58

Elm GroveVillage II

0.53

Green TreeVillage III

0.57

Green TreeVillage V

0.51

Sand CreekVillage I

0.52

SherwoodTrails I

0.52

SherwoodTrails IV

0.49

Woodland HillsVillage I

0.54

Bear BranchVillage V

0.51

Bear BranchVillage II

0.57

Bear BranchVillage I

0.53

Pinehurst ofAtascocita III

0.48

Pinehurst ofAtascocita IV

0.56Oaks ofAtascocita III

0.57

IslandGreens

0.58

WaldenWoods

0.32

KingwoodGreens Village

0.31

KingsForest

0.43

TrailwoodVillage I

0.42

Deer RidgeEstates

0.39

Forest CoveCountry Club I

0.31

Hamblen RoadEstates

0.41

KingwoodPlace Village

0.43

Pinehurst ofAtascocita II

0.4

KingwoodGlen Manor

0.38Parkside

at KingwoodGlen0.4

AtascocitaPines I

0.42

Northshire0.4

Ramblewood0.37

Villas, The0.31

TrailwoodVillage

0.32

KingsCrownEstates

0.4

Sir DainPlace0.43

FairwayForest

0.32

Elm GroveVillage III

0.47SherwoodTrails II

0.43

TrailwoodVillage II

0.41

Forest Cove II0.34

Oaks ofAtascocita II

0.46

AtascocitaWest I0.41

Pinehurst ofAtascocita I

0.36

DogwoodAcres0.06

Barringtonat Kingwood

0.29

Kingwood LakesVillage I

0.27

ForestCove I0.29

BelleauWoods

0.27

Atasca OaksEstates

0.25

AtascocitaShores

0.28

WorleyAcres0.21

Villas atKings Harbor

0.17

BrownstoneSquare

0.04

VillageFalls

0

KingwoodPlace0.16

Royal Shores- The Courts

0.13

KingsCrossing IV

0.06

KingsCrossing II

0.06

KingsCrossing I

0.05

AtascocitaPoint0.26

Elm GroveVillage

0.24

FourSeason

0Northshire0.04

Pinehurst ofAtascocita

0.25

KingsCrossing III

0.05

Kingwood LakesVillage II

0.21

Forest CoveCountry Club II

0.26

Retreat, The0.15

BarefootI0

Ratios of Students per Occupied UnitRatios of Students per Occupied UnitRatios of Students per Occupied UnitRatios of Students per Occupied Unit [0 0.5 10.25

MilesBy Subdivision, Humble I .S .D. - NorthBy Subdivision, Humble I .S .D. - NorthBy Subdivision, Humble I .S .D. - NorthBy Subdivision, Humble I .S .D. - North

Map Layers

District Boundary

Planning Units

Streets

Subdivisions0.00 - 0.30

0.31 - 0.47

0.48 - 0.58

0.59 - 0.70

0.71 - 0.84

0.85 - 3.29

Population & Survey Analysts - Demographic Update - February 2016 152

Farmingham Dr

Ti mb

e r Fo

r est Dr

Seagler Springs Ln

Will Clayton Pkwy

Aerobic Ave

Kin

gs

Par

kW

a y

Ralston

Rd

S H

ou

sto

n A

ve

Dorylee Ln

Tim

ber

Fore

stD

r

WLa

keHou

st

onPkw

y

Eag

leSho

reTrl

Bender Rd

FM 1960 Bypass

FM 1960

Wi ll Clayton Pkwy

Bel

low

sF

alls

Ln

Lockw

ood

1st Street

Rankin Road

Silver Lake Rd

WL

ake

Ho

ust

on

Pkw

y

Eag

le

Springs

Mesa Dr.

Sm

it h R

oad

Wo

od

l and

Hil ls

Dr.

Mes

aD

r.

Beltway 8

Wo

odland

Hil ls D

r

Deussen

Pkwy.

Old H

umble

Rd.

Beltway 8

Lakeside Terrace Dr

N. Sam Houston Pkwy. E.

Eas

tex

Free

way

Ho

ust

on

Ave

.

Ho

ust

on

Av

e.

Will Clayton Pkwy Will Clayton Pkwy

FM 1960FM 1960 FM 1960 FM 1960

Wilso

n R

d.

Wils

on

Rd .

Wi lso

n R

d.

Wilso

nR

d.

Atascocita Rd .

Atascocit

a Rd.

Atascocita Rd.

Atascocita Rd.

W. Lake Houston Pkwy

W.L

a ke

Ho

ust

on

Pkw

y

W. Lake

Housto

nP

kwy

W. L

ak e

Ho

ust

on

Pkw

y

26B

18

15F

24B24C

13B

7C

11E

11D

55D

2

15B

16B

19A

19B

20

5A

5B

17A

17B

8A

8B

21

1A

12C

9C

3A

10B

11B

26C

26D

9A

11A

11C

7B

26E

16A

15G

55C

12B

14A

14B

2823 24A6

55E

15H

15D

15I

55A

15C

13A

13C

12A

55G

55B

55F

15K

9B

15J

3B

1B

22

3D

3C

15L

4

3E

12E12D

9D

15E

7A

10A

ClaytonsCorner

1.08

AtascocitaMeadows

1.04

Timberhills0.86

North BeltForest

0.96

ClassicPines Estates

1.19

Oak KnollEsts.2.11

El Dorado1.33

AtascocitaVillage

1.83

Meadowbrook1.27

SunsetRidge West

1.12

WoodlandPines0.91

DeerCreek1.42

Sutters Creek0.85

BeringerPlace

1.1

ValleyCreek0.85

LakewoodPines

1

LaurelWoods

0.93

LoganRidge0.94 Sierra

Bridge0.86

Yukon Forest0.97

CadesCrossing

0.89

MontecitoPointe

1.05

MeridianCove1.08

CrescentRidge0.85

HuntersGrove0.98

Sumrwood GreenwoodMeadow Est

0.86

TH's2.17

Morrison1

CountrysideVillage4plexes

1.5

ChandlerCrossing

0.87

Houston AveDuplexes

1.17

AudubonPark I0.92

HawthorneRidge0.85

LegacyPoint0.86

SunsetRidge East

1

Bend, The1.5

AtascocitaPark0.71

AtascocitaTimbers

0.73

AtascocitaSouth I

0.77

AtascaWoods

0.83

AudubonPark III

0.83

Timberwood0.72

HumbleRoad Place

0.8

J. L.Ranchland

0.73

AtascocitaTrace0.78

PrestonVillage

0.79

Lake ParkVillage

0.71

OakwoodGlen0.81

TimberlakeEstates

0.81

LaurelOaks0.73

Wynnwood0.71 Forest

Glen0.71

MapleCreek0.82

WhisperingPines0.79

RoseCreek0.76

ClaytonsPark0.84

PineOak Glen

0.72

MeadowLake0.81

ArlingtonPark0.76

BartonRidge0.77

SterlingCreek0.76

AspenGlen0.82

Hunters RidgeEstates

0.71

Summerwood -Section 32

0.71

Duplex I0.75

Duplex II0.71

AtascocitaForest II

0.83

AtascocitaPines II

0.74

AudubonPark II0.84

KingwoodGlen Village

0.63

Oaks ofAtascocita I

0.69

AtascocitaWest III

0.66

AtascocitaTrails0.65

TimberForest

0.7

AtascocitaAcres0.61

Eastex OaksVillage

0.69

Summer LakeRanch

0.69

LaurelRidge0.63

HeatherGlen0.65

Lake ForestVillage

0.65WhisperingPines0.62

EdgewaterVillage

0.63

SuncrestVillage

0.67

ForestGlade0.68

Lakeshore0.59

Canyon Villageat Park Lakes

0.67

AutumnFalls0.6

BiscayneBend0.61

CrossCreek0.66

MeadowLodge0.64

KendallHollow

0.59CaliterraChase

0.7

GolfersVillage

0.59

KingstonVillage

0.67

SprintersVillage

0.7Sportsman

Village0.6

ChampionsVillage

0.68

OlympicVillage

0.59

CedarMeadows

0.68

Colony, The0.64

AtascocitaSouth II

0.66

HuntersRidge Court

0.62

Park at AtascocitaForest

0.56

AtascocitaForest I

0.5

Lakeland0.54

IntercontinentalVillage

0.55

BlackstoneCreek0.58

Harbor, The0.53

WoodsEdge0.53

ShadowBrook0.53

RustlingOaks0.53

CottageGrove0.58

Summerwood -Section 35

0.48

Oak Hollow0.56

Pinecrest0.53

Wood ShadowPointe

0.55StoneyBrook0.57

Canyon Gate atPark Lakes

0.53

MarathonVillage

0.55 TrophyVillage

0.51

MemorialGlen0.53

Bay, The0.52

Shores, The0.53 Preserve, The

0.56

Sound, The0.48

Pinehurstof Atascocita IV

0.56

AudubonPark IV

0.57

Oaks ofAtascocita III

0.57

Parkside atKingwood

Glen0.4

BelleauWood East I

0.35

Ramblewood0.37

Waterhaven0.41

HuntersCrossing

0.47

SoaringPines0.47

South PointeVillage

0.39

ForestPointe

0.42

LakesideTerrace

0.35

PineyPoint0.42 Serrano

Creek0.31

FutureResidential

0.43LakePoint0.35

PrincetonPark0.34

WaldenGreen0.41

Summerwood- Section 23

0.4

Summerwood -Section 33

0.47

CedarPond0.43

Summerwood -Section 34

0.45

O SunPark0.33

Pointe, The0.32

Cove, The0.42

Sir DainPlace0.43

Belleau WoodEast II0.35

WildwoodSprings

0.33

NorthHollowEstates

0.3

IntercontinentalVillage

0.18

WaterCrest0.28

AmberWood0.15

PineGrove0.26

TangleCreek0.23

Estates atSerrano Creek

0.16

Villagesat Tour 18

0.09

Grand IsleEstates

0.18

NewfieldPark0.23

ArborHeights

0.05

LaurelCrossing

0.12

Bluffs,The0.3

PhillipDuplexes

0.12

Wilson Rd.Duplexes

0.17

Clayton'sPark

Sec. 6+0.3

Strand, The0.25

Groves,The I0.27

Ratios of Students per Occupied UnitRatios of Students per Occupied UnitRatios of Students per Occupied UnitRatios of Students per Occupied Unit [0 0.5 10.25

MilesBy Subdivision, Humble I .S .D. - SouthBy Subdivision, Humble I .S .D. - SouthBy Subdivision, Humble I .S .D. - SouthBy Subdivision, Humble I .S .D. - South

Map Layers

District Boundary

Planning Units

Streets

Subdivisions0.00 - 0.30

0.31 - 0.47

0.48 - 0.58

0.59 - 0.70

0.71 - 0.84

0.85 - 3.29

Population & Survey Analysts - Demographic Update - February 2016 153

Humble I.S.D.Ratios of Students per Single-Family Home by Subdivision

Planning Total # of # ofUnit Ratio Students Homes Ratio Students Ratio Students Ratio Students3B Amber Wood Fall Creek Townhome Existing 0.15 10 68 0.07 5 0.04 3 0.03 2

15K Arbor Heights Eagle Springs Subdivision Existing 0.05 60 1173 0.03 33 0.01 13 0.01 14

15J Arlington Park Eagle Springs Subdivision Existing 0.76 179 235 0.38 89 0.18 42 0.20 48

15D Aspen Glen Eagle Springs Subdivision Existing 0.82 74 90 0.44 40 0.23 21 0.14 13

26B Atasca Oaks Estates Subdivision Developing 0.25 5 20 0.05 1 0.05 1 0.15 3

15H Atasca Woods Subdivision Existing 0.83 759 909 0.33 298 0.22 198 0.29 263

12C Atascocita Acres Subdivision Existing 0.61 65 107 0.31 33 0.12 13 0.18 19

13A Atascocita Forest I Subdivision Existing 0.50 554 1107 0.24 264 0.12 130 0.14 160

13A Atascocita Forest II Subdivision Developing 0.83 588 705 0.38 265 0.19 133 0.27 190

16A Atascocita Meadows Subdivision Existing 1.04 197 190 0.46 88 0.24 46 0.33 63

25 Atascocita North Subdivision Existing 0.79 592 746 0.35 259 0.19 142 0.26 191

16A Atascocita Park Subdivision Existing 0.71 96 136 0.33 45 0.15 20 0.23 31

15A Atascocita Pines I Walden on Lake Houston Subdivision Existing 0.42 105 250 0.18 46 0.11 28 0.12 31

15F Atascocita Pines II Walden on Lake Houston Subdivision Existing 0.74 137 184 0.33 60 0.17 32 0.24 45

27B Atascocita Point Kingwood Subdivision Developing 0.26 21 82 0.12 10 0.06 5 0.07 6

27B Atascocita Shores Subdivision Existing 0.28 89 322 0.10 32 0.08 25 0.10 32

15A Atascocita Shores South Subdivision Existing 0.58 41 71 0.27 19 0.13 9 0.18 13

15C Atascocita South I Walden on Lake Houston Subdivision Existing 0.77 626 810 0.34 273 0.18 144 0.26 209

14B Atascocita South II Walden on Lake Houston Subdivision Existing 0.66 445 677 0.30 203 0.16 111 0.19 131

16B Atascocita Timbers Subdivision Existing 0.73 162 221 0.32 71 0.14 30 0.28 61

12C Atascocita Trace Subdivision Developing 0.78 256 327 0.48 158 0.14 46 0.16 52

16B Atascocita Trails Subdivision Existing 0.65 513 786 0.27 216 0.12 93 0.26 204

11A Atascocita Village MHP Existing 1.83 305 167 0.97 162 0.44 73 0.42 70

25 Atascocita West I Subdivision Existing 0.41 24 58 0.17 10 0.05 3 0.19 11

26B Atascocita West II Subdivision Existing 0.69 72 105 0.27 28 0.15 16 0.27 28

26E Atascocita West III Subdivision Existing 0.66 74 112 0.29 32 0.14 16 0.23 26

10B Audubon Park I Subdivision Existing 0.92 137 149 0.44 66 0.18 27 0.30 44

11C Audubon Park II Subdivision Existing 0.84 168 200 0.31 62 0.26 51 0.28 55

10A Audubon Park III Subdivision Existing 0.83 290 351 0.40 141 0.19 66 0.24 83

11B Audubon Park IV Subdivision Existing 0.57 72 127 0.22 28 0.15 19 0.20 25

3C Autumn Falls Fall Creek Subdivision Existing 0.60 79 132 0.30 39 0.14 19 0.16 21

15E Balmoral Parke Lakes Balmoral Parke Lakes Subdivision Developing 0 0 0 0

24A Barefoot I MHP Existing 0.00 0 21 0.00 0 0.00 0 0.00 0

32 Barrington at Kingwood Kingwood Subdivision Developing 0.29 72 248 0.10 26 0.08 19 0.11 27

15K Barton Ridge Eagle Springs Subdivision Existing 0.77 167 218 0.39 86 0.19 42 0.18 39

55E Bay, The Waters Edge Subdivision Existing 0.52 68 130 0.33 43 0.08 10 0.12 15

44 Bear Branch Village I Kingwood Subdivision Existing 0.53 174 326 0.24 78 0.12 40 0.17 56

45 Bear Branch Village II Kingwood Subdivision Existing 0.57 176 308 0.28 85 0.12 38 0.17 53

43 Bear Branch Village III Kingwood Subdivision Existing 0.68 51 75 0.25 19 0.20 15 0.23 17

42A Bear Branch Village IV Kingwood Subdivision Existing 0.76 64 84 0.35 29 0.20 17 0.21 18

46 Bear Branch Village V Kingwood Subdivision Existing 0.51 151 298 0.18 55 0.14 41 0.18 55

16A Belleau Wood East I Subdivision Existing 0.35 47 135 0.13 18 0.04 6 0.17 23

24C Belleau Wood East II Subdivision Existing 0.35 7 20 0.15 3 0.15 3 0.05 1

24A Belleau Woods Subdivision Existing 0.27 14 51 0.10 5 0.14 7 0.04 2

55E Bend, The Waters Edge Subdivision Developing 1.50 18 12 1.08 13 0.33 4 0.08 1

15K Beringer Place Eagle Springs Subdivision Existing 1.10 74 67 0.54 36 0.25 17 0.31 21

15K Biscayne Bend Eagle Springs Subdivision Existing 0.61 63 103 0.38 39 0.13 13 0.11 11

12C Blackstone Creek Subdivision Developing 0.58 129 223 0.29 65 0.13 29 0.16 35

55E Bluffs, The Waters Edge Subdivision Developing 0.30 10 33 0.18 6 0.09 3 0.03 1

45 Brownstone Square Kingwood Townhome Existing 0.04 1 28 0.04 1 0.00 0 0.00 0

15D Cades Crossing Eagle Springs Subdivision Existing 0.89 95 107 0.41 44 0.20 21 0.28 30

15D Caliterra Chase Eagle Springs Subdivision Existing 0.70 104 148 0.37 55 0.16 23 0.18 26

12A Canyon Gate at Park Lakes Subdivision Developing 0.53 404 757 0.25 187 0.11 86 0.17 131

12A Canyon Village at Park Lakes Subdivision Existing 0.67 527 791 0.34 265 0.13 99 0.21 163

15K Cedar Meadows Eagle Springs Subdivision Existing 0.68 50 73 0.44 32 0.15 11 0.10 7

8A Cedar Pond Subdivision Developing 0.43 3 7 0.29 2 0.00 0 0.14 1

15F Champions Village Walden on Lake Houston Subdivision Developing 0.68 335 490 0.30 149 0.18 87 0.20 99

15I Chandler Crossing Eagle Springs Subdivision Existing 0.87 144 165 0.55 90 0.18 29 0.15 25

11E Classic Pines Estates MHP Existing 1.19 101 85 0.58 49 0.25 21 0.36 31

15B Claytons Corner Subdivision Existing 1.08 442 410 0.51 208 0.24 100 0.33 134

13C Claytons Park Subdivision Existing 0.84 370 440 0.45 196 0.19 82 0.21 92

15D Clayton's Park Sec. 6+ Subdivision Developing 0.30 12 40 0.20 8 0.08 3 0.03 1

2 Colony, The MHP Existing 0.64 44 69 0.30 21 0.14 10 0.19 13

16A Continental Plaza (Abandoned) Subdivision Existing 0

15I Cottage Grove Eagle Springs Subdivision Existing 0.58 63 109 0.31 34 0.14 15 0.13 14

20 Countryside Village 4plexes Subdivision Existing 1.50 42 28 1.07 30 0.25 7 0.18 5

55E Cove, The Waters Edge Subdivision Existing 0.42 17 40 0.18 7 0.10 4 0.15 6

3C Creekwood Fall Creek Subdivision Developing 0 0 0 0

15D Crescent Ridge Eagle Springs Subdivision Existing 0.85 85 100 0.41 41 0.18 18 0.26 26

15G Cross Creek Eagle Springs Subdivision Existing 0.66 164 248 0.38 95 0.14 35 0.14 34

35 Deer Cove Kingwood Subdivision Existing 0.73 19 26 0.31 8 0.27 7 0.15 4

3B Deer Creek Fall Creek Subdivision Existing 1.42 37 26 0.85 22 0.27 7 0.31 8

36 Deer Ridge Estates Subdivision Developing 0.39 12 31 0.10 3 0.10 3 0.19 6

50A Dogwood Acres Subdivision Existing 0.06 2 36 0.06 2 0.00 0 0.00 0

20 Duplex I Subdivision Existing 0.75 9 12 0.00 0 0.00 0 0.75 9

20 Duplex II Subdivision Existing 0.71 17 24 0.38 9 0.25 6 0.08 2

24A Duplexes Subdivision Existing 0.75 18 24 0.42 10 0.08 2 0.25 6

15G Eagle Springs ‐ Sec. 51 Eagle Springs Subdivision Developing 0 0 0 0

1B Eastex Oaks Village Subdivision Existing 0.69 266 388 0.34 132 0.15 57 0.20 77

55C Edgewater Village Summerwood Subdivision Existing 0.63 81 128 0.26 33 0.16 21 0.21 27

3A El Dorado MHP Existing 1.33 308 231 0.77 177 0.29 67 0.28 64

48 Elm Grove Village Kingwood Townhome Existing 0.24 8 34 0.03 1 0.09 3 0.12 4

6th‐8th 9th‐12thName MPC Class Phase

EE‐5th

Population & Survey Analysts - Demographic Update - February 2016 154

Humble I.S.D.Ratios of Students per Single-Family Home by Subdivision

Planning Total # of # ofUnit Ratio Students Homes Ratio Students Ratio Students Ratio Students

6th‐8th 9th‐12thName MPC Class Phase

EE‐5th

47A Elm Grove Village I Kingwood Subdivision Existing 0.54 376 702 0.21 150 0.13 91 0.19 135

49 Elm Grove Village II Kingwood Subdivision Existing 0.53 337 636 0.19 123 0.14 92 0.19 122

48 Elm Grove Village III Kingwood Subdivision Existing 0.47 38 81 0.25 20 0.07 6 0.15 12

3B Estates at Serrano Creek Fall Creek Subdivision Developing 0.16 18 113 0.13 15 0.01 1 0.02 2

3C F.C.‐Future Fall Creek Fall Creek Subdivision Developing 0 0 0 0

37 Fairway Forest Townhome Existing 0.32 9 28 0.11 3 0.11 3 0.11 3

38 Forest Cove Townhome Existing 0.49 39 79 0.20 16 0.14 11 0.15 12

37 Forest Cove Country Club I Subdivision Existing 0.31 135 432 0.11 48 0.07 30 0.13 57

36 Forest Cove Country Club II Subdivision Existing 0.26 28 106 0.16 17 0.06 6 0.05 5

36 Forest Cove I Subdivision Existing 0.29 96 331 0.09 31 0.08 27 0.11 38

38 Forest Cove II Subdivision Existing 0.34 53 158 0.11 17 0.08 12 0.15 24

3B Forest Glade Fall Creek Subdivision Existing 0.68 53 78 0.28 22 0.19 15 0.21 16

55G Forest Glen Summerwood Subdivision Developing 0.71 223 314 0.37 117 0.16 49 0.18 57

55G Forest Pointe Summerwood Subdivision Existing 0.42 127 301 0.24 72 0.10 29 0.09 26

29A Fosters Mill Village Kingwood Subdivision Existing 0.50 273 547 0.21 117 0.10 56 0.18 100

27B Four Season Townhome Existing 0.00 0 11 0.00 0 0.00 0 0.00 0

24A Fut. Artesian Lakes MHP Existing 0 0 0 0 0

24A Fut. Barefoot II MHP Existing 0 0 0 0 0

55E Fut. Bridges on Lake Houston II Subdivision Developing 27 17 3 7

55C Future Residential Summerwood Subdivision Existing 0.43 20 47 0.28 13 0.06 3 0.09 4

14A Golfers Village Walden on Lake Houston Subdivision Existing 0.59 120 203 0.25 50 0.16 33 0.18 37

55E Grand Isle Estates Subdivision Developing 0.18 4 22 0.18 4 0.00 0 0.00 0

53A Green Tree Village I Kingwood Subdivision Existing 0.52 207 396 0.23 91 0.12 49 0.17 67

54B Green Tree Village II Kingwood Subdivision Existing 0.63 168 267 0.26 69 0.13 34 0.24 65

54A Green Tree Village III Kingwood Subdivision Existing 0.57 232 404 0.22 89 0.14 55 0.22 88

53B Green Tree Village IV Kingwood Subdivision Existing 0.66 325 492 0.26 130 0.14 67 0.26 128

52C Green Tree Village V Kingwood Subdivision Existing 0.51 104 204 0.24 48 0.12 24 0.16 32

18 Groves, The I The Groves Subdivision Developing 0.27 20 73 0.22 16 0.03 2 0.03 2

15L Groves, The II The Groves Subdivision Developing 0 0 0 0

37 Hamblen Road Estates Subdivision Existing 0.41 29 70 0.19 13 0.07 5 0.16 11

55E Harbor, The Waters Edge Subdivision Developing 0.53 18 34 0.38 13 0.12 4 0.03 1

15K Hawthorne Ridge Eagle Springs Subdivision Existing 0.85 44 52 0.60 31 0.13 7 0.12 6

3D Heather Glen Fall Creek Subdivision Existing 0.65 122 187 0.39 73 0.12 23 0.14 26

21 Houston Ave Duplexes Subdivision Existing 1.17 14 12 0.67 8 0.25 3 0.25 3

2 Humble Road Place Subdivision Existing 0.80 86 108 0.44 48 0.10 11 0.25 27

3B Hunters Crossing Fall Creek Subdivision Existing 0.47 49 104 0.25 26 0.17 18 0.05 5

15D Hunters Grove Eagle Springs Subdivision Existing 0.98 81 83 0.49 41 0.25 21 0.23 19

55G Hunters Ridge Court Summerwood Subdivision Existing 0.62 5 8 0.50 4 0.13 1 0.00 0

55G Hunters Ridge Estates Summerwood Subdivision Existing 0.71 42 59 0.36 21 0.20 12 0.15 9

43 Hunters Ridge Village I Kingwood Subdivision Existing 0.58 313 539 0.22 119 0.17 92 0.19 102

42A Hunters Ridge Village II Kingwood Subdivision Existing 0.66 196 296 0.29 87 0.19 55 0.18 54

42B Hunters Ridge Village III Kingwood Subdivision Existing 0.69 135 195 0.33 65 0.19 37 0.17 33

50A Idle Glen Subdivision Existing 0.30 6 20 0.10 2 0.15 3 0.05 1

50A Idle Wild Subdivision Existing 0.00 0 11 0.00 0 0.00 0 0.00 0

20 Intercontinental Village Subdivision Existing 0.55 40 73 0.25 18 0.15 11 0.15 11

20 Intercontinental Village Townhome Existing 0.18 29 159 0.09 14 0.04 6 0.06 9

27B Island Greens Subdivision Developing 0.58 7 12 0.17 2 0.25 3 0.17 2

8A J. L. Ranchland Subdivision Existing 0.73 52 71 0.32 23 0.15 11 0.25 18

15K Kendall Hollow Eagle Springs Subdivision Existing 0.59 162 275 0.38 105 0.11 29 0.10 28

42B Kings Crossing I Kingwood Subdivision Existing 0.05 3 57 0.04 2 0.02 1 0.00 0

52A Kings Crossing II Kingwood Subdivision Existing 0.06 11 182 0.03 6 0.01 2 0.02 3

53A Kings Crossing III Kingwood Subdivision Existing 0.05 4 75 0.03 2 0.00 0 0.03 2

29B Kings Crossing IV Kingwood Subdivision Existing 0.06 10 165 0.02 3 0.02 4 0.02 3

27A Kings Crown Estates Kingwood Subdivision Developing 0.40 6 15 0.20 3 0.13 2 0.07 1

45 Kings Forest Kingwood Subdivision Existing 0.43 114 264 0.20 53 0.10 26 0.13 35

45 Kings Forest Estates Kingwood Subdivision Existing 0.50 8 16 0.31 5 0.13 2 0.06 1

25 Kings Lake Estates Subdivision Developing 0.88 79 90 0.41 37 0.22 20 0.24 22

30A Kings Point Village ‐ Cove Kingwood Subdivision Existing 0.75 244 327 0.30 98 0.20 64 0.25 82

30A Kings Point Village ‐ Landing Kingwood Subdivision Existing 0.73 175 239 0.18 44 0.19 46 0.36 85

31 Kings Point Village ‐ Pointe Kingwood Subdivision Existing 0.89 178 200 0.35 69 0.19 38 0.36 71

30B Kings Point Village ‐ Pointe Kingwood Subdivision Existing 0.73 421 576 0.27 156 0.19 111 0.27 154

30A Kings Point Village ‐ Reserve Kingwood Subdivision Existing 0.70 174 250 0.30 75 0.16 41 0.23 58

27B Kings River Estates North Kingwood Subdivision Developing 1.07 16 15 0.27 4 0.33 5 0.47 7

27A Kings River Village I Kingwood Subdivision Existing 0.69 664 966 0.30 289 0.16 155 0.23 220

27C Kings River Village II Kingwood Subdivision Existing 0.99 185 186 0.37 68 0.28 52 0.35 65

55G Kingston Village Summerwood Subdivision Existing 0.67 64 95 0.33 31 0.14 13 0.21 20

26C Kingwood Glen Manor Subdivision Existing 0.38 65 171 0.15 26 0.12 20 0.11 19

26D Kingwood Glen Village Subdivision Existing 0.63 217 343 0.29 98 0.15 51 0.20 68

33C Kingwood Greens Village Kingwood Subdivision Existing 0.31 67 218 0.12 26 0.08 17 0.11 24

32 Kingwood Lakes Village I Kingwood Subdivision Existing 0.27 54 200 0.10 20 0.09 17 0.09 17

33A Kingwood Lakes Village II Kingwood Subdivision Existing 0.21 15 71 0.13 9 0.04 3 0.04 3

36 Kingwood Place Kingwood Townhome Existing 0.16 10 62 0.05 3 0.02 1 0.10 6

36 Kingwood Place Village Kingwood Subdivision Existing 0.43 145 340 0.14 47 0.09 30 0.20 68

55B Lake Forest Village Summerwood Subdivision Existing 0.65 174 269 0.35 95 0.15 40 0.14 39

55F Lake Park Village Summerwood Subdivision Existing 0.71 199 279 0.42 117 0.17 47 0.13 35

3C Lake Point Fall Creek Subdivision Developing 0.35 39 111 0.21 23 0.07 8 0.07 8

20 Lakeland Subdivision Existing 0.54 106 198 0.25 50 0.12 24 0.16 32

27A Lakes at Kings River Estates Kingwood Subdivision Developing 0.68 34 50 0.18 9 0.18 9 0.32 16

55E Lakeshore Subdivision Existing 0.59 687 1169 0.32 372 0.12 142 0.15 173

55B Lakeside Terrace Subdivision Existing 0.35 24 69 0.13 9 0.10 7 0.12 8

37 Lakewood Cove Subdivision Developing 0.84 202 240 0.43 104 0.16 39 0.25 59

55A Lakewood Pines Subdivision Developing 1.00 3 3 0.33 1 0.00 0 0.67 2

Population & Survey Analysts - Demographic Update - February 2016 155

Humble I.S.D.Ratios of Students per Single-Family Home by Subdivision

Planning Total # of # ofUnit Ratio Students Homes Ratio Students Ratio Students Ratio Students

6th‐8th 9th‐12thName MPC Class Phase

EE‐5th

55G Laurel Crossing Summerwood Townhome Existing 0.12 9 77 0.08 6 0.01 1 0.03 2

3B Laurel Oaks Fall Creek Subdivision Existing 0.73 128 175 0.49 85 0.13 23 0.11 20

9D Laurel Ridge Subdivision Existing 0.63 180 287 0.31 89 0.14 40 0.18 51

15G Laurel Woods Eagle Springs Subdivision Existing 0.93 155 167 0.41 68 0.20 33 0.32 54

50A Lazy Creek Estates Subdivision Existing 0.00 0 1 0.00 0 0.00 0 0.00 0

15K Legacy Point Eagle Springs Subdivision Existing 0.86 71 83 0.41 34 0.23 19 0.22 18

15G Logan Ridge Eagle Springs Subdivision Existing 0.94 146 156 0.44 69 0.19 30 0.30 47

3B Maple Creek Fall Creek Subdivision Existing 0.82 89 109 0.49 53 0.20 22 0.13 14

15F Marathon Village Walden on Lake Houston Subdivision Existing 0.55 108 196 0.17 33 0.13 26 0.25 49

15G Meadow Lake Eagle Springs Subdivision Existing 0.81 43 53 0.40 21 0.17 9 0.25 13

15G Meadow Lodge Eagle Springs Subdivision Existing 0.64 35 55 0.27 15 0.18 10 0.18 10

9B Meadowbrook MHP Existing 1.27 449 353 0.76 268 0.27 95 0.24 86

21 Memorial Glen Subdivision Existing 0.53 66 125 0.27 34 0.10 12 0.16 20

15D Meridian Cove Eagle Springs Subdivision Existing 1.08 111 103 0.50 51 0.23 24 0.35 36

47B Mills Branch Village I Kingwood Subdivision Existing 0.63 261 415 0.31 128 0.13 53 0.19 80

54B Mills Branch Village II Kingwood Subdivision Existing 0.62 498 797 0.26 207 0.18 145 0.18 146

24A Mittag Manor MHP Existing 0.63 22 35 0.40 14 0.11 4 0.11 4

15D Montecito Pointe Eagle Springs Subdivision Existing 1.05 69 66 0.56 37 0.24 16 0.24 16

2 Morrison MHP Existing 1.00 35 35 0.40 14 0.37 13 0.23 8

15J Newfield Park Eagle Springs Subdivision Existing 0.23 15 65 0.08 5 0.08 5 0.08 5

11D North Belt Forest MHP Existing 0.96 408 425 0.51 216 0.22 92 0.24 100

8B North Hollow Estates Subdivision Existing 0.30 56 185 0.15 27 0.07 13 0.09 16

47A North Kingwood Forest Subdivision Developing 0.86 156 182 0.29 53 0.24 43 0.33 60

6 Northshire Subdivision Existing 0.40 181 453 0.19 88 0.10 45 0.11 48

6 Northshire Townhome Existing 0.04 16 416 0.02 9 0.01 4 0.01 3

22 O Sun Park MHP Existing 0.33 8 24 0.17 4 0.08 2 0.08 2

3B Oak Hollow Fall Creek Subdivision Existing 0.56 53 94 0.43 40 0.06 6 0.07 7

3A Oak Knoll Ests. Subdivision Existing 2.11 19 9 1.00 9 0.78 7 0.33 3

54C Oak Manor Kingwood Subdivision Existing 0.58 22 38 0.39 15 0.08 3 0.11 4

26B Oaks of Atascocita I Subdivision Existing 0.69 305 443 0.31 137 0.15 67 0.23 101

25 Oaks of Atascocita II Subdivision Existing 0.46 160 348 0.20 68 0.12 41 0.15 51

26E Oaks of Atascocita III Subdivision Existing 0.57 111 196 0.25 49 0.11 22 0.20 40

55G Oakwood Glen Summerwood Subdivision Existing 0.81 151 186 0.35 65 0.22 40 0.25 46

15F Olympic Village Walden on Lake Houston Subdivision Developing 0.59 317 534 0.27 142 0.14 73 0.19 102

13B Park at Atascocita Forest Subdivision Existing 0.56 114 205 0.25 52 0.08 17 0.22 45

26D Parkside at Kingwood Glen Subdivision Existing 0.40 57 142 0.18 26 0.10 14 0.12 17

55E Peninsula Waters Edge Subdivision Developing 18 13 4 1

20 Phillip Duplexes Subdivision Existing 0.12 1 8 0.00 0 0.13 1 0.00 0

3B Pine Grove Fall Creek Subdivision Existing 0.26 17 65 0.20 13 0.03 2 0.03 2

55C Pine Oak Glen Summerwood Subdivision Existing 0.72 81 112 0.35 39 0.16 18 0.21 24

50A Pine Valley Estates Subdivision Existing 0.00 0 1 0.00 0 0.00 0 0.00 0

3B Pinecrest Fall Creek Subdivision Existing 0.53 20 38 0.34 13 0.11 4 0.08 3

27B Pinehurst of Atascocita Townhome Existing 0.25 7 28 0.18 5 0.04 1 0.04 1

27D Pinehurst of Atascocita I Subdivision Existing 0.36 26 73 0.15 11 0.10 7 0.11 8

27B Pinehurst of Atascocita II Subdivision Existing 0.40 213 531 0.17 91 0.09 48 0.14 74

28 Pinehurst of Atascocita III Subdivision Existing 0.48 300 619 0.22 136 0.12 73 0.15 91

26C Pinehurst of Atascocita IV Subdivision Existing 0.56 182 323 0.17 55 0.13 42 0.26 85

3B Piney Point Fall Creek Subdivision Existing 0.42 61 146 0.25 37 0.08 12 0.08 12

55E Pinnacle, The Waters Edge Subdivision Developing 18 0 13 4 1

22 Plaza East Subdivision Developing 0 0 0 0

55E Pointe, The Waters Edge Subdivision Existing 0.32 12 37 0.19 7 0.05 2 0.08 3

55E Preserve, The Waters Edge Subdivision Existing 0.56 34 61 0.31 19 0.15 9 0.10 6

15I Preston Village Eagle Springs Subdivision Existing 0.79 95 120 0.38 46 0.17 20 0.24 29

15K Princeton Park Eagle Springs Subdivision Existing 0.34 18 53 0.15 8 0.08 4 0.11 6

24A Ramblewood Subdivision Existing 0.37 50 134 0.21 28 0.08 11 0.08 11

29A Regent Square Kingwood Subdivision Developing 0.64 7 11 0.55 6 0.00 0 0.09 1

52A Retreat, The Kingwood Townhome Existing 0.15 6 39 0.10 4 0.03 1 0.03 1

50B River Bend Kingwood Subdivision Existing 1.10 243 220 0.55 121 0.24 53 0.31 69

50B Riverchase I Kingwood Subdivision Existing 0.96 296 309 0.29 90 0.24 73 0.43 133

31 Riverchase II Kingwood Subdivision Existing 0.75 119 159 0.26 41 0.17 27 0.32 51

26A Rivergrove Subdivision Developing 3.29 79 24 1.54 37 0.83 20 0.92 22

54C Riverpoint Village Kingwood Subdivision Developing 0.81 25 31 0.42 13 0.19 6 0.19 6

3B Rose Creek Fall Creek Subdivision Existing 0.76 32 42 0.45 19 0.12 5 0.19 8

50A Royal Brook @ Kingwood Subdivision Developing 0 0 0 0 0

30B Royal Shores ‐ Regal Point Kingwood Subdivision Developing 1.05 163 155 0.32 50 0.30 47 0.43 66

30B Royal Shores ‐ The Courts Kingwood Subdivision Existing 0.13 10 77 0.01 1 0.00 0 0.12 9

3B Rustling Oaks Fall Creek Subdivision Existing 0.53 111 210 0.33 70 0.09 19 0.10 22

52B Sand Creek Village I Kingwood Subdivision Existing 0.52 232 442 0.23 102 0.12 53 0.17 77

53C Sand Creek Village II Kingwood Subdivision Existing 0.78 93 120 0.33 39 0.13 16 0.32 38

51 Sand Creek Village III Kingwood Subdivision Existing 0.61 332 543 0.27 144 0.15 84 0.19 104

3B Serrano Creek Fall Creek Subdivision Existing 0.31 45 146 0.17 25 0.06 9 0.08 11

3B Shadow Brook Fall Creek Subdivision Existing 0.53 54 102 0.37 38 0.05 5 0.11 11

47C Sherwood Trails I Kingwood Subdivision Existing 0.52 117 225 0.24 53 0.14 32 0.14 32

47A Sherwood Trails II Kingwood Subdivision Existing 0.43 77 181 0.21 38 0.09 17 0.12 22

47D Sherwood Trails III Kingwood Subdivision Existing 0.74 199 268 0.34 92 0.16 44 0.24 63

48 Sherwood Trails IV Kingwood Subdivision Existing 0.49 129 261 0.25 65 0.11 28 0.14 36

55E Shores, The Waters Edge Subdivision Developing 0.53 50 95 0.39 37 0.05 5 0.08 8

15G Sierra Bridge Eagle Springs Subdivision Existing 0.86 226 264 0.49 130 0.17 46 0.19 50

24A Sir Dain Place Subdivision Developing 0.43 3 7 0.14 1 0.14 1 0.14 1

3B Soaring Pines Fall Creek Subdivision Existing 0.47 30 64 0.28 18 0.08 5 0.11 7

55E Sound, The Waters Edge Subdivision Existing 0.48 25 52 0.19 10 0.21 11 0.08 4

55F South Pointe Village Summerwood Subdivision Existing 0.39 148 376 0.22 83 0.07 25 0.11 40

Population & Survey Analysts - Demographic Update - February 2016 156

Humble I.S.D.Ratios of Students per Single-Family Home by Subdivision

Planning Total # of # ofUnit Ratio Students Homes Ratio Students Ratio Students Ratio Students

6th‐8th 9th‐12thName MPC Class Phase

EE‐5th

15F Sportsman Village Walden on Lake Houston Subdivision Developing 0.60 319 534 0.26 137 0.14 75 0.20 107

15F Sprinters Village Walden on Lake Houston Subdivision Existing 0.70 98 140 0.31 44 0.16 22 0.23 32

15D Sterling Creek Eagle Springs Subdivision Existing 0.76 142 188 0.46 86 0.14 27 0.15 29

55A Stillwater on Lake Houston Subdivision Developing 0 0 0 0 0

3B Stoney Brook Fall Creek Subdivision Existing 0.57 12 21 0.43 9 0.10 2 0.05 1

55E Strand, The Waters Edge Subdivision Developing 0.25 2 8 0.13 1 0.13 1 0.00 0

55A Summer Lake Ranch Subdivision Developing 0.69 101 147 0.29 42 0.19 28 0.21 31

55C Summerwood ‐ Section 23 Summerwood Subdivision Existing 0.40 19 47 0.23 11 0.04 2 0.13 6

55G Summerwood ‐ Section 32 Summerwood Subdivision Existing 0.71 12 17 0.47 8 0.18 3 0.06 1

55G Summerwood ‐ Section 33 Summerwood Subdivision Developing 0.47 17 36 0.33 12 0.08 3 0.06 2

55G Summerwood ‐ Section 34 Summerwood Subdivision Existing 0.45 5 11 0.45 5 0.00 0 0.00 0

55G Summerwood ‐ Section 35 Summerwood Subdivision Existing 0.48 21 44 0.18 8 0.09 4 0.20 9

55G Sumrwood Greenwood Meadow Est Summerwood Subdivision Existing 0.86 54 63 0.43 27 0.22 14 0.21 13

55F Suncrest Village Summerwood Subdivision Existing 0.67 210 314 0.36 114 0.13 41 0.18 55

15E Sunset Ridge East Subdivision Developing 1.00 540 539 0.43 231 0.23 123 0.35 186

12D Sunset Ridge West Subdivision Developing 1.12 240 214 0.53 114 0.27 57 0.32 69

12E Sunset Ridge West Sec. 5, 7 Subdivision Developing 0 0 0 0

15I Sutters Creek Eagle Springs Subdivision Existing 0.85 95 112 0.40 45 0.21 24 0.23 26

3B Tangle Creek Fall Creek Subdivision Developing 0.23 5 22 0.14 3 0.09 2 0.00 0

20 TH's Townhome Existing 2.17 13 6 1.00 6 0.33 2 0.83 5

13B Timber Forest Subdivision Existing 0.70 330 472 0.35 164 0.16 77 0.19 89

12E Timberhills Subdivision Existing 0.86 413 479 0.40 191 0.18 85 0.29 137

55G Timberlake Estates Summerwood Subdivision Existing 0.81 30 37 0.35 13 0.24 9 0.22 8

7A Timberwood Subdivision Developing 0.72 673 933 0.35 322 0.16 146 0.22 205

34 Trailwood Village Kingwood Townhome Existing 0.32 14 44 0.16 7 0.09 4 0.07 3

34 Trailwood Village I Kingwood Subdivision Existing 0.42 210 501 0.16 79 0.11 54 0.15 77

35 Trailwood Village II Kingwood Subdivision Existing 0.41 119 287 0.14 39 0.09 27 0.18 53

15F Trophy Village Walden on Lake Houston Subdivision Existing 0.51 73 143 0.16 23 0.13 19 0.22 31

15K Valley Creek Eagle Springs Subdivision Existing 0.85 73 86 0.44 38 0.19 16 0.22 19

45 Village Falls Kingwood Subdivision Existing 0.00 0 26 0.00 0 0.00 0 0.00 0

22 Villages at Tour 18 Subdivision Developing 0.09 7 80 0.01 1 0.03 2 0.05 4

29A Villas at Kings Harbor Kingwood Subdivision Developing 0.17 1 6 0.00 0 0.00 0 0.17 1

29B Villas, The Kingwood Subdivision Developing 0.31 25 80 0.08 6 0.10 8 0.14 11

15F Walden Green Walden on Lake Houston Subdivision Existing 0.41 16 39 0.23 9 0.13 5 0.05 2

50A Walden Woods Subdivision Existing 0.32 8 25 0.08 2 0.16 4 0.08 2

3B Water Crest Fall Creek Subdivision Developing 0.28 18 64 0.08 5 0.08 5 0.13 8

3D Water Oak Fall Creek Subdivision Developing 0 0 0 0

15F Waterhaven Walden on Lake Houston Subdivision Existing 0.41 45 110 0.21 23 0.08 9 0.12 13

41A Waterview Subdivision Developing 0.64 7 11 0.36 4 0.00 0 0.27 3

3B Whispering Pines  Fall Creek Subdivision Existing 0.79 37 47 0.47 22 0.13 6 0.19 9

55C Whispering Pines  Summerwood Subdivision Existing 0.62 243 389 0.25 97 0.16 61 0.22 85

55E Wildwood Springs Subdivision Developing 0.33 23 70 0.19 13 0.04 3 0.10 7

21 Wilson Rd. Duplexes Subdivision Existing 0.17 1 6 0.00 0 0.17 1 0.00 0

55C Wood Shadow Pointe Summerwood Subdivision Existing 0.55 46 84 0.30 25 0.13 11 0.12 10

39 Woodland Hills Village I Kingwood Subdivision Existing 0.54 319 588 0.24 143 0.13 74 0.17 102

40 Woodland Hills Village II Kingwood Subdivision Existing 0.57 493 869 0.23 198 0.14 118 0.20 177

41A Woodland Hills Village III Kingwood Subdivision Existing 0.64 95 149 0.26 39 0.11 17 0.26 39

9C Woodland Pines Subdivision Existing 0.91 637 701 0.43 300 0.23 162 0.25 175

3B Woods Edge Fall Creek Subdivision Existing 0.53 38 72 0.39 28 0.06 4 0.08 6

50C Woodspring Forest Kingwood Subdivision Existing 0.86 296 346 0.39 135 0.21 74 0.25 87

50A Woodstream Kingwood Subdivision Existing 0.83 576 695 0.33 232 0.20 141 0.29 203

50A Worley Acres MHP Existing 0.21 6 28 0.07 2 0.11 3 0.04 1

3B Wynnwood Fall Creek Subdivision Existing 0.71 68 96 0.53 51 0.15 14 0.03 3

15D Yukon Forest Eagle Springs Subdivision Existing 0.97 110 113 0.48 54 0.25 28 0.25 28

Weighted Ratio: 0.62 36,236 58,107 0.29 16,771 0.14 8,359 0.19 11,106

l Students by Grade Group: 46% 23% 31%

Population & Survey Analysts - Demographic Update - February 2016 157

HarborCove0.15

Lodgeat Kingwood

0.09

WoodlandHills0.18

NortheastPines0.16

LakeForest

0.17

AlexanEagle Creek

0.13

CorringtonPark Lakes

0.18

Elm Creek0.22

DeerbrookGarden

0.24

Parkside0.19

Sierra atFall Creek

0.24

Lake ShoreVillas0.19

KingsCove0.22

Cascade atFall Creek

0.23

HarborView0.24

TownCenter

0.27

Verandah atLake Point

0.27

Woods on theFairway

0.34

Timbers atDeerbrook

0.26

AltaPine Forest

0.33

Ten Pines atSummerwood

0.28

Arium FallCreek0.27

Camden WoodsonPark0.45

WoodlandHills Village

0.54

KingwoodLake0.45

TrailwoodVillage

0.54

EagleCrest0.38

BenderHollow

0.38

Meadowbrook0.46

CountrysideVillage

0.54

Elm Grove0.59

Sunrise atAtascocita

0.55

TimberLake0.67

Pines atHumble Park

0.61Township

0.61

Colonyof Humble

0.55

AtascocitaPines0.88

BarringtonCourt1.13

Waterchase0.79

Place at FallCreek, The

1.01NorthLake Manor

0.75

Kingwood Dr.

Kingwood Dr.

FM 1960

Woodridge

Pkwy

Sm

i t h Road

Lockwood

1st Street

Rankin Road

Upper Lake Dr.

Woo

d land

Hills

Dr.

Lakeside Terr aceD

r

Woo

dland H

i ll s Dr

Old H

umbl

e Rd.

Mills Branch Dr.

N. Sam Houston Pkwy. E.

WTo

wns

enB

lvd

Hamblen Rd

Northpark Dr.

Eas

tex

Fre

eway

Will Clayton PkwyWill Clayton Pkwy

Wils

onR

d.

FM 1960

Atascocit

a Rd.

W. Lake Houston Pkwy

W.

Lak

eH

oust

onP

kwy

Eag

leSp

ring s

Mesa Dr.

W. Lake

Housto

nP

kwy

Hou

ston

Ave

.

47A

46

48

39 43

44

47B

4954B

29B

52B

29A

26B

25

18

15F

24B

24C

47C

47D

27B

27A

42B

13B

42A

7C

11E

11D

55D

30B

30A

34

35

40

2

36

50C

31

45

33A

32

26A

15A

15B

16B

19A

19B

20

5A

5B

17A

17B

8A

8B

21

1A

12C

9C

3A

10B

11B

26C

26D

9A

11A11C

7B

41B41C

26E

50A

41D

41A

33B

33C

16A

15G

55C

12B

14A

14B

28

23

24A

6

37

38

54A

52A

53A

51

53C

52C

54C

53B

55E

15H

15D

15I

55A

15C

13A

13C

50B

27C

27D

12A

55G

55B

55F

15K9B

15J

3B

1B

22

3D

3C

15L

4

3E

12E12D

9D

15E

7A

10A

Ratios of Students per Occupied UnitRatios of Students per Occupied UnitRatios of Students per Occupied UnitRatios of Students per Occupied UnitBy Apartment ComplexBy Apartment ComplexBy Apartment ComplexBy Apartment Complex

Map Layers

District Boundary

Planning Units

Streets

Apartment Ratios0.09 - 0.18

0.19 - 0.24

0.25 - 0.34

0.35 - 0.54

0.55 - 0.67

0.68 - 1.13

[0 1 20.5

Miles

Population & Survey Analysts - Demographic Update - February 2016 158

Humble I.S.D.Ratio of Students per Household:

Multi-Family Units

PU Apartment Street Total Total Occupied % Students perComplex Name Notes Students Units Units Occ. Occ. Unit Students Percentage Students Percentage Students Percentage

PU Name RAddresses RNotesIncluded TotStu Units OccUnits RPrcOcc StuPerOccUnit G1 PRC1 G2 PRC2 G3 PRC3

55C  Ten Pines at Summerwood 14700 Woodson Park Dr 61 240 218 91% 0.28 13 21% 22 36% 26 42%

20 110‐118 Hirsch*not included in total, no 

information available13 0 12 92% 0 0% 1 7%

20 182 Willow*not included in total, no 

information available16 0 10 62% 2 12% 4 25%

23 5th and 6th*not included in total, no 

information available3 0 2 66% 0 0% 1 33%

20 604 Wilson*not included in total, no 

information available2 0 1 50% 0 0% 1 50%

20 605 Wilson*not included in total, no 

information available1 0 0 0% 0 0% 1 100%

20 608 Wilson*not included in total, no 

information available7 0 3 42% 0 0% 4 57%

19B 708 Staitti*not included in total, no 

information available5 0 2 40% 1 20% 2 40%

3C Alexan Eagle Creek 9702 N. Sam Houston Pkwy E. 51 412 379 92% 0.13 26 50% 12 23% 13 25%

12D Alta Pine Forest 10373 N. Sam Houston Pkwy E. 80 256 243 95% 0.33 32 40% 23 28% 25 31%

1A Arium Fall Creek 7800 N Sam Houston Pkwy E. 69 264 253 96% 0.27 34 49% 15 21% 20 28%

11C Atascocita Pines 230 Atascocita Rd 160 192 182 95% 0.88 62 38% 32 20% 66 41%

10A Audobon Park Condos 15115 Mesa *individually owned 80 0 47 58% 9 11% 24 30%

21 Barrington Court 1002‐1022 Memorial Glen (evens) 103 96 91 95% 1.13 43 41% 31 30% 29 28%

17B Bender Hollow 424 S Bender 36 102 94 92% 0.38 12 33% 5 13% 19 52%

55C Camden Woodson Park 14633 Woodson Park Dr. 103 248 228 92% 0.45 41 39% 30 29% 32 31%

20 Carolyn Court  1200 Carolyn Ct. *fmr Kay Lynn 26 26 0 5 19% 8 30% 13 50%

3B Cascade at Fall Creek 8330 N. Sam Houston Pkwy 115 514 493 96% 0.23 58 50% 31 26% 26 22%

20 Colony of Humble 831 Wilson Rd*same management as 

Countryside VIllage107 200 194 97% 0.55 71 66% 20 18% 16 14%

12A Corrington Park Lakes 4475 Wilson Rd 45 252 244 97% 0.18 26 57% 7 15% 12 26%

20 Countryside Village 615 & 625 Wilson Rd*same management as Colony 

of Humble98 182 182 100% 0.54 63 64% 15 15% 20 20%

19A Deer Springs *senior 0 0 0 0 0

23 Deerbrook Garden 1230 FM 1960 35 162 147 91% 0.24 20 57% 6 17% 9 25%

16A Eagle Crest 5303 Atascicita Rd 72 200 188 94% 0.38 27 37% 14 19% 31 43%

55E Echelon on West Lake Houston*will have 280 units, finished 

Jan 20170 0 0 0 0

48 Elm Creek 2911 Sycamore Springs Dr 35 168 161 96% 0.22 19 54% 5 14% 11 31%

48 Elm Grove 2921 Sycamore Springs Dr 76 136 128 94% 0.59 41 53% 15 19% 20 26%

20 Ferguson Place *no information available 4 0 1 25% 1 25% 2 50%

15A Fut. Lodge @ Westlake 0 0 0 0 0

15G Fut. Riverbrook Village ‐ TDHCA 0 0 0 0 0

29A Harbor Cove 4630 Magnolia Cove Dr 44 300 288 96% 0.15 22 50% 12 27% 10 22%

29A Harbor View 4855 Magnolia Cove Dr. 57 250 243 97% 0.24 29 50% 12 21% 16 28%

19B Humble Healthcare Center 0 0 0 0 0

5B Humble Mem. Gardens 9850 JM Hester *senior 0 0 0 0 0

29A Kings Cove 4920 Magnolia Cove Dr 41 192 186 97% 0.22 17 41% 13 31% 11 26%

52B Kings Crossing ‐ Demolished 4545 Kingwood Dr*Demolished but still has 12 

students coded to it.12 0 0 9 75% 2 16% 1 8%

33B Kingwood Lake 3700 Kingwood Dr

undergoing some renovations 

to the community as well as the 

units

139 394 311 79% 0.45 56 40% 31 22% 52 37%

29B Kingwood Village *senior 0 0 0 0 0

15A Lake Forest 19780 Atascocita Shores Dr 41 240 235 98% 0.17 18 43% 9 21% 14 34%

15A Lake Shore Villas 19800 Atascocita Shores Dr 69 359 355 99% 0.19 34 49% 11 15% 24 34%

22 Lakes of Tour 18 0 0 0 0 0

41C Lodge at Kingwood 938 Kingwood Dr*total units represent units in 

Humble ISD only26 312 303 97% 0.09 6 23% 7 26% 13 50%

17B Meadowbrook 510 & 515 S. Bender 113 260 247 95% 0.46 59 52% 24 21% 30 26%

7B North Lake Manor 6910 Old North Belt Dr 91 126 121 96% 0.75 47 51% 25 27% 19 20%

5B Northeast Pines 18839 S. Memorial Dr 22 136 136 100% 0.16 8 36% 5 22% 9 40%

46 Oaks of Kingwood 3415 Havenbrook Dr 21 152 0 7 33% 6 28% 8 38%

5B Park at Deerbrook 19700 Whitaker Dr 5 152 0 3 60% 0 0% 2 40%

PK-5th 6th-8th 9th-12th

Population & Survey Analysts - Demographic Update - February 2016 159

Humble I.S.D.Ratio of Students per Household:

Multi-Family Units

PU Apartment Street Total Total Occupied % Students perComplex Name Notes Students Units Units Occ. Occ. Unit Students Percentage Students Percentage Students Percentage

PK-5th 6th-8th 9th-12th

21 Parkside 8455 Will Clayton Pkwy 29 160 149 93% 0.19 16 55% 5 17% 8 27%

17B Pines at Humble Park 412 S. Bender Ave 99 170 163 96% 0.61 46 46% 23 23% 30 30%

11B Place at Fall Creek, The 15116 Mesa Dr *fmr. The Park at Stone Creek 106 115 105 91% 1.01 50 47% 25 23% 31 29%

8A Rankin Country*number disconnected, 32 

units12 0 7 58% 4 33% 1 8%

20 Riverbench Apts *no information available 21 0 9 42% 6 28% 6 28%

3B Sierra at Fall Creek 14951 Bellows Falls Ln 54 252 227 90% 0.24 31 57% 12 22% 11 20%

12A Sierra Meadows *senior living 0 0 0 0 0

15F Sunrise at Atascocita 7850 Fm 1960 77 141 140 99% 0.55 29 37% 18 23% 30 38%

20 Talon *no information available 5 0 4 80% 0 0% 1 20%

16A Timber Lake 18551 Timber Forest Dr 193 312 287 92% 0.67 76 39% 49 25% 68 35%

5B Timbers at Deerbrook 9814 FM 1960 W. 57 260 218 84% 0.26 30 52% 10 17% 17 29%

33C Town Center 2611 & 2727 Bens Branch Dr 128 518 471 91% 0.27 58 45% 32 25% 38 29%

17B Township 401 & 411 S. Bender Ave 159 300 261 87% 0.61 80 50% 37 23% 42 26%

35 Trailwood Village 2200 Lake VIllage Dr 92 178 171 96% 0.54 50 54% 12 13% 30 32%

15A Verandah at Lake Point 8300 FM 1960 56 208 204 98% 0.27 30 53% 14 25% 12 21%

19B Victoria *no information available 4 0 1 25% 2 50% 1 25%

47C Village At Hickory Glen  (MHMRA) 0 15 0

15E Villages at Sunset Ridge, The 14807 Woodland Hills Dr 70 257 0 31 44% 12 17% 27 38%

10A Waterchase 15100 Golden Eagle Dr 87 118 110 93% 0.79 49 56% 15 17% 23 26%

16B Wentworth *senior living 2 0 1 50% 0 0% 1 50%

21 Wilson Apartments Wilson Rd*not included in total, no 

information available8 0 3 37% 3 37% 2 25%

13B Woodland Hills 3918 Atascocita Rd 47 282 265 94% 0.18 26 55% 6 12% 15 31%

40 Woodland Hills Village 2135 & 2139 Lake Hills Dr 114 260 211 81% 0.54 50 43% 32 28% 32 28%

27B Woods on the Fairway 8311 FM 1960 53 165 155 94% 0.34 21 39% 16 30% 16 30%

15A 0 0 0 0 0

Totals: 3557 10234 1684 794 1079

Units with Occupancy Data 

Available:3240 9632 8987 93% 1526 47% 738 23% 976 30%

0.36Average Weighted Ratio:

Population & Survey Analysts - Demographic Update - February 2016 160

Humble I.S.D.: Trends in Ratios of Students per Household

Planning Unit Subdivision

March 2005 Ratio

Oct 2007 Ratio

May 2009 Ratio

Jan. 2012 Ratio

April. 2014 Ratio

Dec. 2015 Ratio

26B Atasca Oaks Estates 0.00 0.25

15H Atasca Woods 0.70 0.30 0.63 0.85 0.85 0.83

12C Atascocita Acres 0.56 0.53 0.53 0.61

13A Atascocita Forest I 0.68 0.64 0.57 0.56 0.50

13A Atascocita Forest Sections II 0.68 0.64 0.80 0.79 0.83

9C Atascocita Heights 0.00

16A Atascocita Meadows 0.85 1.15 0.78 0.94 0.85 1.04

25 Atascocita North 0.94 0.78 1.20 0.75 0.77 0.79

16A Atascocita Park 1.03 0.72 0.71 0.65 0.60 0.7127B Atascocita Shores 0.41 0.41 0.45 0.36 0.30 0.28

15A Atascocita Shores South 0.38 0.58

16B Atascocita Timbers 0.81 0.93 0.62 0.72 0.68 0.73

12C Atascocita Trace 0.73 0.77 0.77 0.78

16B Atascocita Trails 0.71 0.96 0.50 0.66 0.66 0.65

11A Atascocita Village MHP 1.76 1.83

25 Atascocita West I 0.93 0.97 1.06 0.69 0.66 0.41

26B Atascocita West II 0.93 0.97 1.06 0.69 0.71 0.69

26E Atascocita West III 0.93 0.97 1.06 0.69 0.55 0.66

10B Audubon Park I 1.59 1.04 0.86 0.82 0.92

11C Audubon Park II 1.59 1.04 0.86 0.54 0.84

10A Audubon Park III 1.59 1.04 0.86 0.87 0.83

11B Audubon Park IV 1.59 1.04 0.86 0.90 0.57

15E Balmoral Parke Lakes 0.00

24A Barefoot I MHP 0.00

16A Belleau Woods East I 0.60 0.65 0.39 0.34 0.35

24C Belleau Woods East II 0.60 0.65 0.39 0.35 0.35

24A Belleau Woods 0.35 0.50 0.45 0.31 0.27

12C Blackstone Creek 0.62 1.05 0.65 0.58

55E Bridges on Lake Houston - Grand Isle Estates 0.18

55E Bridges on Lake Houston - Wildwood Springs 0.70

12A Canyon Gate at Park Lakes 0.21 0.00 0.57 0.60 0.53

12A Canyon Village at Park Lakes 0.59 0.58 0.65 0.67

8A Cedar Pond 0.71 0.86 0.43

11E Classic Pines Estates MHP 0.85 0.89 0.87 1.16 1.19

15B Claytons Corner 0.97 0.97 1.01 1.12 1.08

13C Claytons Park 1.04 0.70 0.68 0.84

15D Clayton's Park Sec. 6+ 0.30

20 Countryside Village 4-plexes 1.36 1.50

36 Deer Ridge Estates 0.90 0.35 0.31 0.39

50A Dogwood Acres 0.06

20 Duplexes I 0.63 0.75

20 Duplexes II 0.92 0.71

24A Duplexes 1.08 0.75

15K Eagle Springs - Arbor Heights 0.08 0.50 0.26 0.04 0.05

15J Eagle Springs - Arlington Park 1.05 0.63 0.65 0.76

15D Eagle Springs - Aspen Glen 0.97 0.76 0.81 0.82

15K Eagle Springs - Barton Ridge 1.07 0.68 0.60 0.77

15K Eagle Springs - Beringer Place 0.60 0.54 1.10

15K Eagle Springs - Biscayne Bend 0.46 0.57 0.61

15D Eagle Springs - Cades Crossing 0.96 0.90 0.93 0.89

15D Eagle Springs - Caliterra Chase 0.46 0.55 0.59 0.70

15D Eagle Springs - Cedar Meadows 0.47 0.52 0.68

Green highlighted subdivisions indicate recent increases in the number of students per home. Yellow highlighted subdivisions show areas where student density is declining.

Population & Survey Analysts - Demographic Update - February 2016 161

Humble I.S.D.: Trends in Ratios of Students per Household

Planning Unit Subdivision

March 2005 Ratio

Oct 2007 Ratio

May 2009 Ratio

Jan. 2012 Ratio

April. 2014 Ratio

Dec. 2015 Ratio

15I Eagle Springs - Chandler Crossing 0.29 0.68 0.68

15I Eagle Springs - Cottage Grove 0.61 0.64 0.69 0.58

15D Eagle Springs - Crescent Ridge 0.42 0.61 0.65 0.81 0.85

15G Eagle Springs - Cross Creek 0.38 0.52 1.03 0.64 0.55 0.66

15K Eagle Springs - Hawthorne Ridge 0.47 0.85

15D Eagle Springs - Hunters Grove 0.50 0.64 0.88 0.92 0.98

15K Eagle Springs - Kendall Hollow 0.34 0.59

15G Eagle Springs - Laurel Woods 0.41 0.98 0.82 0.95 0.87 0.93

15K Eagle Springs - Legacy Point 0.86

15G Eagle Springs - Logan Ridge 0.55 0.92 0.83 0.94 0.94

15G Eagle Springs - Meadow Lake 0.67 1.20 0.75 0.64 0.91 0.81

15G Eagle Springs - Meadow Lodge 1.31 1.46 1.02 1.02 0.71 0.64

15D Eagle Springs - Meridian Cove 0.71 0.89 1.06 1.08

15D Eagle Springs - Montecito Pointe 0.89 0.84 0.86 1.05

15J Eagle Springs - Newfield Park 0.00 0.88 0.13 0.23

15I Eagle Springs - Preston Village 0.00 0.57 0.54 0.68 0.79

15K Eagle Springs - Princeton Park 0.09 0.38 0.34

15I Eagle Springs - Sierra Bridge 0.00 0.79 0.86

15D Eagle Springs - Sterling Creek 0.56 0.52 0.66 0.76

15I Eagle Springs - Sutters Creek 0.56 0.66 0.76 0.85

15K Eagle Springs - Valley Creek 0.44 0.64 0.85

15D Eagle Springs - Yukon Forest 0.52 0.96 0.97 0.97

1B Eastex Oaks Village 0.70 0.69

3A El Dorado MHP 1.17 1.33

37 Fairway Forest TH 0.32

3B Fall Creek - Amber Wood TH 0.60 0.75 0.13 0.15

3C Fall Creek - Autumn Falls 0.19 0.48 0.60

3C Fall Creek - Creekwood 0.00 0.00

3B Fall Creek - Deer Creek 0.96 1.00 0.92 1.42

3B Fall Creek - Estates at Seranno Creek 0.00 0.11 0.16

3B Fall Creek - Forest Glade 0.27 0.56 0.58 0.55 0.68

3C Fall Creek - Future 0.00 0.00

3B Fall Creek - Heather Glen 0.43 0.45 0.58 0.65

3B Fall Creek - Hunters Crossing 0.52 0.50 0.63 0.44 0.47

3C Fall Creek - Lake Point 0.13 0.18 0.35

3B Fall Creek - Laurel Oaks 0.29 0.49 0.61 0.73

3B Fall Creek - Maple Creek 0.26 0.64 0.61 0.82

3B Fall Creek - Oak Hollow 0.11 0.38 0.43 0.56

3B Fall Creek - Pine Grove 0.00 0.04 0.26

3B Fall Creek - Pinecrest 0.36 0.61 0.61 0.53

3B Fall Creek - Piney Point 0.06 0.18 0.23 0.42

3B Fall Creek - Rose Creek 0.00 0.43 0.59 0.76

3B Fall Creek - Rustling Oaks 0.12 0.40 0.24 0.45 0.50 0.53

3B Fall Creek - Serrano Creek 0.54 0.46 0.43 0.31

3B Fall Creek - Shadow Brook 0.40 0.53 0.39 0.45 0.51 0.53

3B Fall Creek - Soaring Pines 0.33 0.48 0.61 0.42 0.47

3B Fall Creek - Stoney Brook 0.47 0.52 0.48 0.57

3B Fall Creek - Tangle Creek 0.00 0.60 0.23

3B Fall Creek - Water Crest 0.03 0.30 0.33 0.28

3C Fall Creek - Water Oak 0.00 0.00

3B Fall Creek - Whispering Pines 0.28 0.20 0.49 0.66 0.79

3B Fall Creek - Woods Edge 0.41 0.30 0.28 0.44 0.53

Green highlighted subdivisions indicate recent increases in the number of students per home. Yellow highlighted subdivisions show areas where student density is declining.

Population & Survey Analysts - Demographic Update - February 2016 162

Humble I.S.D.: Trends in Ratios of Students per Household

Planning Unit Subdivision

March 2005 Ratio

Oct 2007 Ratio

May 2009 Ratio

Jan. 2012 Ratio

April. 2014 Ratio

Dec. 2015 Ratio

3B Fall Creek - Wynnwood 0.25 0.33 0.42 0.71

36 Forest Cove I 0.26 0.37 0.30 0.29

38 Forest Cove II 0.37 0.34

38 Forest Cove THs 0.43 0.49

37 Forest Cove Country Club Estates I 0.27 0.30 0.23 0.31

36 Forest Cove Country Club Estates II 0.32 0.26

27B Four Season TH 0.00

37 Hamblen Road Estates 0.40 0.41

21 Houston Ave Duplexes 0.75 1.17

2 Humble Road Place 0.88 0.79 0.86 0.80

50A Idle Glen 0.25 0.30

50A Idle Wild 0.00

20 Intercontinental Village 0.60 0.53 0.67 0.38 0.55

20 Intercontinental Village THs 0.11 0.25 0.18

27B Island Greens 0.20 0.00 0.00 0.58

8A J.L. Richland 0.47 0.30 0.40 0.63 0.62 0.73

27A Kings Crown Estates 0.00 0.80 0.40

26A Kings Lake Estates 0.70 0.70

27A,27C Kings River Village 0.39 0.80 0.70

24B Kingsbrooke 0.00

27B Kingwood - Atascocita Point 0.49 0.35 0.26

32 Kingwood - Barrington at Kingwood 0.05 0.29 0.20 0.26 0.24 0.29

44 Kingwood - Bear Branch Village I 1.44 0.54 0.64 0.53

45 Kingwood - Bear Branch Village II 1.44 0.54 0.64 0.57

43 Kingwood - Bear Branch Village III 1.44 0.54 0.57 0.68

42A Kingwood - Bear Branch Village IV 1.44 0.54 0.55 0.76

46 Kingwood - Bear Branch Village V 1.44 0.54 0.49 0.51

45 Kingwood - Brownstone Square TH 0.11 0.04

35 Kingwood - Deer Cove 0.50 0.71 0.75 0.81 0.54 0.73

48 Kingwood - Elm Grove Village TH 0.57 0.69 0.53 0.52 0.24

47A Kingwood - Elm Grove Village I 0.57 0.69 0.53 0.18 0.54

49 Kingwood - Elm Grove Village II 0.57 0.69 0.53 0.54 0.53

48 Kingwood - Elm Grove Village III 0.57 0.69 0.53 0.58 0.47

29A Kingwood - Fosters Mill Village 0.44 0.51 0.54 0.48 0.49 0.50

53A Kingwood - Gren Tree Village I 0.67 0.63 0.74 0.52

54B Kingwood - Gren Tree Village II 0.67 0.63 0.48 0.63

54A Kingwood - Gren Tree Village III 0.67 0.63 0.65 0.57

53B Kingwood - Gren Tree Village IV 0.67 0.63 0.57 0.66

52C Kingwood - Gren Tree Village V 0.67 0.63 0.52 0.51

54C Kingwood - Hannover Estates 0.00

43 Kingwood - Hunters Ridge Village I 1.37 0.65 0.63 0.58

42A Kingwood - Hunters Ridge Village II 1.37 0.65 0.62 0.66

42B Kingwood - Hunters Ridge Village III 1.37 0.65 0.67 0.69

42B Kingwood - Kings Crossing I 0.03 0.05 0.07 0.05

52A Kingwood - Kings Crossing II 0.03 0.05 0.09 0.06

53A Kingwood - Kings Crossing III 0.03 0.05 0.04 0.05

29B Kingwood - Kings Crossing IV 0.03 0.05 0.05 0.06

27A Kingwood - Crown Estates 0.60

45 Kingwood - Kings Forest 0.97 0.39 0.37 0.43

45 Kingwood - Kings Forest Estates 0.25 0.50

30A Kingwood - Kings Point Village - Cove 0.98 0.77 0.98 0.79 0.73 0.75

30A Kingwood - Kings Point Village - Landing 1.10 1.14 0.78 0.72 0.73

Green highlighted subdivisions indicate recent increases in the number of students per home. Yellow highlighted subdivisions show areas where student density is declining.

Population & Survey Analysts - Demographic Update - February 2016 163

Humble I.S.D.: Trends in Ratios of Students per Household

Planning Unit Subdivision

March 2005 Ratio

Oct 2007 Ratio

May 2009 Ratio

Jan. 2012 Ratio

April. 2014 Ratio

Dec. 2015 Ratio

31 Kingwood - Kings Point Village - Pointe 0.82 0.59 0.69 0.78 0.86 0.89

30B Kingwood - Kings Point Village - Pointe 0.82 0.59 0.69 0.78 0.74 0.73

30A Kingwood - Kings Point Village - Reserve 0.64 0.67 0.74 0.64 0.70 0.70

27B Kingwood - Kings River Estates North 0.79 1.07

27A Kingwood - Kings River Village I 0.69 0.69

27C Kingwood - Kings River Village II 0.89 0.99

33C Kingwood Greens Village 0.35 0.49 0.36 0.34 0.31

32 Kingwood - Kingwood Lakes Village I 0.31 0.27

33A Kingwood - Kingwood Lakes Village II 0.21 0.21

36 Kingwood - Kingwood Place 0.10 0.16

36 Kingwood - Kingwood Place Village 0.49 0.47 0.44 0.43

27A Kingwood - Lakes at King River Estates 1.11 0.62 0.68

47B Kingwood - Mills Branch Village I 0.62 0.68 0.72 0.63

54B Kingwood - Mills Branch Village II 0.62 0.68 0.64 0.62

54C Kingwood - Oak Manor 0.29 0.58

29A Kingwood - Regent Square 0.27 0.64

50B Kingwood - River Bend 0.95 1.10

50B Kingwood - Riverchase I 1.09 1.23 1.48 1.03 0.71 0.96

31 Kingwood - Riverchase II 1.09 1.23 1.48 1.03 0.96 0.75

54C Kingwood - Riverpoint Village 0.81

30B Kingwood - Royal Shores - Regal Point 0.41 1.14 1.12 1.05

30B Kingwood - Royal Shores - Lake Ridge 0.41 0.00

30B Kingwood - Royal Shores - The Courts 0.41 0.10 0.10 0.13

52B Kingwood - Sand Creek Village I 0.71 0.43 0.56 0.69 0.52

53C Kingwood - Sand Creek Village II 0.71 0.43 0.56 0.62 0.78

51 Kingwood - Sand Creek Village III 0.71 0.43 0.56 0.49 0.61

47C Kingwood - Sherwood Trails I 0.56 0.52 0.40 0.52

47A Kingwood - Sherwood Trails II 0.56 0.52 0.45 0.43

47D Kingwood - Sherwood Trails III 0.56 0.52 0.57 0.74

48 Kingwood - Sherwood Trails IV 0.56 0.52 0.46 0.49

52A Kingwood - The Retreat 0.10 0.15

29B Kingwood - The Villas 0.06 0.31

34 Kingwood - Trailwood Village I 0.27 0.32

34 Kingwood - Trailwood Village II 0.40 0.42

35 Kingwood - Trailwood Village III 0.39 0.41

45 Kingwood - Village Falls 0.15 0.00

50B Kingwood - Villages of Riverchase 0.98 1.04

29A Kingwood - Villas at Kings Harbor 0.17

39 Kingwood - Woodland Hills Village I 0.52 0.54

40 Kingwood - Woodland Hills Village II 0.54 0.57

41A Kingwood - Woodland Hills Village III 0.54 0.64

50C Kingwood - Woodspring Forest 0.69 0.88 1.83 0.83 0.81 0.86

50A Kingwood - Woodstream 0.90 0.83

26C Kingwood Glen Manor 0.39 0.40 0.49 0.51 0.38

26B,26D Kingwood Glen Village 0.44 0.73 0.61 0.66 0.63

20 Lakeland 0.49 0.50 0.45 0.54 0.54

55E Lakeshore 0.43 0.64 0.55 0.57 0.59

55B Lakeside Terrace 0.43 0.35

22 Lakes of Tour 18 0.00

37 Lakewood Cove 0.88 0.81 0.75 0.84

55A Lakewood Pines 1.00

9C Laurel Place 1.02 0.45

Green highlighted subdivisions indicate recent increases in the number of students per home. Yellow highlighted subdivisions show areas where student density is declining.

Population & Survey Analysts - Demographic Update - February 2016 164

Humble I.S.D.: Trends in Ratios of Students per Household

Planning Unit Subdivision

March 2005 Ratio

Oct 2007 Ratio

May 2009 Ratio

Jan. 2012 Ratio

April. 2014 Ratio

Dec. 2015 Ratio

9C Laurel Ridge 0.73

50A Lazy Creek Estates 0.00

9B Meadowbrook MHP 1.30 1.27

21 Memorial Glen Ph1 0.70 0.53 0.63 0.64 0.68 0.53

24A Mittag Manor MHP 0.51 0.63

2 Morrison MHP 0.89 1.00

11D North Belt Forest MHP 0.94 0.96

8B North Hollow Estates 0.32 0.37 0.45 0.35 0.33 0.30

47A North Kingwood Forest 0.52 0.66 1.17 1.26 0.64 0.86

6 Northshire 0.93 0.42 0.38 0.40

6 Northshire TH 0.02 0.04

22 O Sun Park MHP 0.08 0.33

3A Oak Knolls Estates 2.33 2.11

26B Oaks of Atascocita I 0.58 1.26 0.69 0.57 0.48 0.69

25 Oaks of Atascocita II 0.63 0.46

26E Oaks of Atascocita III 0.44 0.57

13B Park at Atascocita Forest 0.78 0.53 0.48 0.56

26D Parkside at Kingwood Glen 0.76 0.33 0.42 0.40

20 Phillip Duplexes 0.38 0.13

50A Pine Valley Estates 0.00

27B Pinehurst at Atascocita TH 0.34 0.25

27D Pinehurst at Atascocita I 0.37 0.72 1.65 0.44 0.47 0.36

27B Pinehurst at Atascocita II 0.37 0.72 1.65 0.44 0.34 0.40

28 Pinehurst at Atascocita III 0.37 0.72 1.65 0.44 0.61 0.48

26C Pinehurst at Atascocita IV 0.37 0.72 1.65 0.44 0.07 0.56

24A Ramblewood 0.31 0.25 0.49 0.34 0.33 0.37

29A Regent Square 0.00

38 Riverview TH of Forest Cove 0.38

22 Rustic Pines 0.00

24A Sir Dain Place 0.57 0.43

55A Summer Lake Ranch 0.66 0.69

55C Summerwood - Edgewater Village 0.59 0.78 0.55 0.77 0.73 0.6355G Summerwood - Forest Glen 0.59 0.74 0.7155G Summerwood - Forest Pointe 0.45 0.55 0.51 0.60 0.41 0.42

55C Summerwood - Future Residential 0.32 0.4355G Summerwood - Greenwood Meadow Estates 0.79 0.73 0.89 0.86

55G Summerwood - Hunters Lake Estates 0.67 0.65

55G Summerwood - Hunters Ridge Court 0.38 0.63

55G Summerwood - Hunters Ridge Estates 0.58 0.71

55G Summerwood - Kingston Village 0.27 1.00 0.60 0.67

55B Summerwood - Lake Forest Village 0.71 0.86 0.69 0.68 0.65

55F Summerwood - Lake Park Village 0.42 1.74 0.57 0.59 0.70 0.71

55G Summerwood - Laurel Crossing 0.15 0.18 0.12

55G Summerwood - Oakwood Glen 0.49 0.70 0.72 0.81

55C Summerwood - Pine Oak Glen 0.69 0.81 1.04 0.72

55G Summerwood - Section 23 0.27 0.49 0.40

55G Summerwood - Section 32 0.29 0.71 0.71

55G Summerwood - Section 33 0.00 0.47

55G Summerwood - Section 34 0.00 0.09 0.45

55G Summerwood - Setion 35 0.00 0.48

55F Summerwood - South Pointe Village 0.33 0.45 0.40 0.39

55F Summerwood - Suncrest Village 0.45 0.55 0.75 0.67

Green highlighted subdivisions indicate recent increases in the number of students per home. Yellow highlighted subdivisions show areas where student density is declining.

Population & Survey Analysts - Demographic Update - February 2016 165

Humble I.S.D.: Trends in Ratios of Students per Household

Planning Unit Subdivision

March 2005 Ratio

Oct 2007 Ratio

May 2009 Ratio

Jan. 2012 Ratio

April. 2014 Ratio

Dec. 2015 Ratio

55G Summerwood - Timberlake Estates 0.53 0.50 0.58 0.70 0.68 0.81

55C Summerwood - Whispering Pines 0.62

55C Summerwood - Wood Shadow Pointe 0.60 0.62 0.67 0.55

55A Summer Lake Ranch 0.77 0.76 0.80 0.69

15E Sunset Ridge East 0.40 0.55 0.84 0.95 1.00

12D Sunset Ridge West 0.87 1.24 0.89 0.90 1.12

2 The Colony MHP 0.54 0.64

18 The Groves I 0.27

18L The Groves II 0.00

2 THs 2.33 2.17

13B Timber Forest 1.09 0.92 0.71 0.65 0.68 0.70

12D Timberhills 0.84 0.77 0.81 0.86

7A Timberwood 0.85 0.92 1.09 0.69 0.68 0.72

34,35 Trailwood Village 1.93 0.52 0.38

27B Tuscan Village 0.00

22 Villages at Tour 18 0.06 0.05 0.09

50B Villages of Riverchase 1.04

29A Villas at Kings Harbour 0.00

15A Walden on Lake Houston - Atascocita Pines I 0.00 0.52 0.42

15F Walden on Lake Houston - Atascocita Pines II 0.00 0.71 0.74

15C Walden on Lake Houston - Atascocita South I 0.50 0.31 0.70 0.67 0.77

14B Walden on Lake Houston - Atascocita South II 0.50 0.31 0.70 0.74 0.66

15F Walden on Lake Houston - Champions Village 0.50 0.31 0.51 0.69 0.75 0.68

15F Walden on Lake Houston - Golfers Village 0.50 0.31 0.25 0.59 0.57 0.59

15F Walden on Lake Houston - Marathon Village 0.56 0.55

15F Walden on Lake Houston - Olympic Village 0.50 0.31 0.79 0.65 0.60 0.59

15F Walden on Lake Houston - Sportsman Village 0.50 0.31 0.54 0.69 0.55 0.60

15F Walden on Lake Houston - Sprinters Village 0.60 0.70

15F Walden on Lake Houston - Trophy Village 0.50 0.31 0.48 0.71 0.60 0.51

15F Walden on Lake Houston - Walden Green 0.50 0.31 0.41 0.23 0.41

15F Walden on Lake Houston - Waterhaven 0.50 0.31 0.05 0.22 0.41

50A Walden Woods 0.28

55E Waters Edge - The Bay 0.14 0.36 0.39 0.52

55E Waters Edge - The Bluffs 0.14 1.00 0.22 0.30

55E Waters Edge - The Cove 0.14 0.38 0.39 0.50 0.43

55E Waters Edge - The Pointe 0.14 0.00 0.27 0.32

55E Waters Edge - The Preserve 0.14 0.27 0.49 0.54 0.56

55E Waters Edge - The Shores 0.14 0.00 0.17 0.53

55E Waters Edge - The Sound 0.14 0.07 0.34 0.38 0.48

55E Waters Edge - The Strand 0.25

41A Waterview 0.64

21 Wilson Road Duplexes 0.17

9C Woodland Pines 0.49 0.81 0.90 0.91

50A Worley Acres 0.43 0.21

0.64 0.70 0.67 0.62 0.61 0.62Districtwide Ratio:

Green highlighted subdivisions indicate recent increases in the number of students per home. Yellow highlighted subdivisions show areas where student density is declining.

Population & Survey Analysts - Demographic Update - February 2016 166


Recommended