34Centrum Equity Research is available on Bloomberg, Thomson Reuters and FactSet Plenty in store in this pipeline We initiate coverage on Ratnamani Metals & Tubes (RMTL) with Buy on the back of proven track record of superior earnings trajectory - best in industry, robust margins and strong return ratios driven by sustainable competitive strength of its niche business of stainless steel (SS) pipes and tubes. RMTL is poised to benefit from a pick-up in domestic investment cycle and significant entry barriers and expertise required in SS business puts it in a sweet spot. Superior capital allocation record and a proactive management provide the icing on the cake and make RMTL an attractive investment for long term growth investors. Competition-beating capabilities in niche business of SS pipes and tubes: RMTL is the market leader (~45% market share) in the niche business of SS pipes and tubes. Its sustainable competitive strengths, developed painstakingly over the past three decades, help it command sector-beating margins of ~25%. SS tubes are used in critical applications and RMTL focuses on high-end application products. We expect ~Rs12bn annual business opportunity in the SS segment for RMTL (vs. current annual revenues of ~Rs8bn) from the domestic market over the next five years led by pickup in investments in user industries, with segment revenues expected to grow at a CAGR of 15.3% during FY14-17E. Carbon steel pipes business to gain from operating leverage: RMTL’s carbon steel (CS) business is compact in size with 0.35mtpa capacity spread across various sub-segments and though low on margins, complements the SS business and accounts for 45-50% of RMTL’s revenues. Capital allocated to the business has been limited on account of prudence followed by the management on expansion and focus on operating leverage. Order inflow has been gradually increasing in CS business and we expect capacity utilization of 50% in FY17E, led by a pick-up in orders from both domestic and export markets. Consistently strong return ratios through efficient capital allocation: While RMTL’s gross block expanded by 6.7x during FY05-14, revenue, EBITDA and PAT rose 7.3x, 8.8x and 10.8x respectively. With sensible capital allocation for expansion of its niche business, strengthening quality checks, developing new products and building an efficient supply chain, the strong growth has come along with margins and return ratios rising by 200-300bps. A commendable combination of strong growth and increase in margins makes RMTL fall under the club of small but well-run companies focussed on creating shareholder value. Valuation and risks: We expect EBITDA/PAT CAGR of 17.3%/17.4% during FY14- 17E led by strong traction in SS segment and operating leverage from CS business. We value the stock at 20x FY17E EPS of Rs49.5 and believe that implied PEG of 1.2x is justified on account of well managed business delivering strong growth and returns, strong track record with EBITDA/PAT CAGR of 27%/30% in last 10 years. This is one of the better options in the otherwise debt-ridden industrial pipes segment and a key beneficiary of likely capex revival. Key risks are a slow pick up in capex in user industries and margin pressure due to raw material volatility. The stock has limited institutional sell side coverage. Target Price Rs990 Key Data Bloomberg Code RMT IN CMP* Rs767 Curr Shares O/S (mn) 46.7 Diluted Shares O/S(mn) 46.7 Upside 29.1% Mkt Cap (Rsbn/USDmn) 35.7/570.8 Price Performance (%)* 52 Wk H / L (Rs) 806.3/162.3 1M 6M 1Yr 5 Year H / L (Rs) 806.3/76.6 RMT IN 7.0 71.8 371.5 Daily Vol. (3M NSE Avg.) 30395 Nifty 1.1 8.3 36.8 *as on 9 March 2015; Source: Bloomberg, Centrum Research Shareholding pattern (%) * Dec-14 Sep-14 Jun-14 Mar-14 Promoter 59.9 59.9 59.9 59.9 FIIs 12.3 13.1 13.1 13.0 DIIs 0.5 0.1 0.3 0.3 Others 27.3 26.9 26.7 26.8 Source: BSE, *as on 9 March 2015 Superior capital allocation drives strong growth Source: Company, Centrum Research ROCE well above peers Source: Company, Centrum Research, * CY07 = FY08 Read the inside pages for: Sustainable strengths of SS business – entry barriers, strong margins – comparison with peers Strong domestic business opportunity for SS segment (exhibits 9-12) Efficient capital allocation – past track record of strong growth coupled with increase in margins Abhisar Jain, CFA, [email protected]; 91 22 4215 9928 Kaushik Krishnan, [email protected]; 91 22 4215 9756 Y/E Mar(Rs mn) Rev YoY (%) EBITDA EBITDA (%) PAT YoY (%) EPS (Rs) RoE (%) RoCE (%) P/E (x) EV/EBITDA (x) FY13 12,011 (1.7) 2,379 19.8 1,360 44.1 29.3 21.0 17.5 26.2 15.2 FY14 13,261 10.4 2,567 19.4 1,428 5.0 30.6 18.6 16.7 25.1 13.9 FY15E 16,533 24.7 3,227 19.5 1,799 26.0 38.5 19.7 18.4 19.9 11.0 FY16E 18,068 9.3 3,525 19.5 1,952 8.5 41.8 18.1 17.4 18.4 10.0 FY17E 21,515 19.1 4,147 19.3 2,313 18.5 49.5 18.3 17.6 15.5 8.6 Source: Company, Centrum Research Estimates 1111 1970 3018 3385 4704 5010 5293 5887 6536 7494 1.6 1.6 1.9 2.5 2.0 1.7 1.5 2.1 1.8 1.8 1.2 1.4 1.6 1.8 2.0 2.2 2.4 2.6 0 2000 4000 6000 8000 10000 12000 14000 FY05 FY06 FY07 FY08 FY09 FY10 FY11 FY12 FY13 FY14 (Rs mn) Net Sales Gross Block NS/GB (x) FY05-14: Net Sales - 7.3x Gross Block- 6.7x -5 0 5 10 15 20 25 30 35 40 FY10 FY11 FY12 FY13 FY14 (%) RMTL Prakash Steelage Remi Edelstahl Suraj Stainless Welspun Corp Jindal Saw Man Inds Metals Buy Initiating Coverage 10 March 2015 INDIA Ratnamani Metals & Tubes Footer Page 1 of 27.
Transcript
34Centrum Equity Research is available on Bloomberg, Thomson Reuters and FactSet
Plenty in store in this pipeline We initiate coverage on Ratnamani Metals & Tubes (RMTL) with Buy on the back of proven track record of superior earnings trajectory - best in industry, robust margins and strong return ratios driven by sustainable competitive strength of its niche business of stainless steel (SS) pipes and tubes. RMTL is poised to benefit from a pick-up in domestic investment cycle and significant entry barriers and expertise required in SS business puts it in a sweet spot. Superior capital allocation record and a proactive management provide the icing on the cake and make RMTL an attractive investment for long term growth investors.
� Competition-beating capabilities in niche business of SS pipes and tubes: RMTL is the market leader (~45% market share) in the niche business of SS pipes and tubes. Its sustainable competitive strengths, developed painstakingly over the past three decades, help it command sector-beating margins of ~25%. SS tubes are used in critical applications and RMTL focuses on high-end application products. We expect ~Rs12bn annual business opportunity in the SS segment for RMTL (vs. current annual revenues of ~Rs8bn) from the domestic market over the next five years led by pickup in investments in user industries, with segment revenues expected to grow at a CAGR of 15.3% during FY14-17E.
� Carbon steel pipes business to gain from operating leverage: RMTL’s carbon steel (CS) business is compact in size with 0.35mtpa capacity spread across various sub-segments and though low on margins, complements the SS business and accounts for 45-50% of RMTL’s revenues. Capital allocated to the business has been limited on account of prudence followed by the management on expansion and focus on operating leverage. Order inflow has been gradually increasing in CS business and we expect capacity utilization of 50% in FY17E, led by a pick-up in orders from both domestic and export markets.
� Consistently strong return ratios through efficient capital allocation: While RMTL’s gross block expanded by 6.7x during FY05-14, revenue, EBITDA and PAT rose 7.3x, 8.8x and 10.8x respectively. With sensible capital allocation for expansion of its niche business, strengthening quality checks, developing new products and building an efficient supply chain, the strong growth has come along with margins and return ratios rising by 200-300bps. A commendable combination of strong growth and increase in margins makes RMTL fall under the club of small but well-run companies focussed on creating shareholder value.
� Valuation and risks: We expect EBITDA/PAT CAGR of 17.3%/17.4% during FY14-17E led by strong traction in SS segment and operating leverage from CS business. We value the stock at 20x FY17E EPS of Rs49.5 and believe that implied PEG of 1.2x is justified on account of well managed business delivering strong growth and returns, strong track record with EBITDA/PAT CAGR of 27%/30% in last 10 years. This is one of the better options in the otherwise debt-ridden industrial pipes segment and a key beneficiary of likely capex revival. Key risks are a slow pick up in capex in user industries and margin pressure due to raw material volatility. The stock has limited institutional sell side coverage.
Target Price Rs990 Key Data
Bloomberg Code RMT IN
CMP* Rs767 Curr Shares O/S (mn) 46.7
Diluted Shares O/S(mn) 46.7
Upside 29.1% Mkt Cap (Rsbn/USDmn) 35.7/570.8
Price Performance (%)* 52 Wk H / L (Rs) 806.3/162.3
Competition beating capabilities in niche business of SS pipes & tubes ............................. 3
Sustainable competitive strength of SS pipes & tubes business ......................................................................... 3
Entry barriers in SS pipes & tubes business .................................................................................................................. 3
RMTL is market leader with ~45% share; focus on high end products, quality, customization & quick delivery are its key hallmarks ............................................................................................................................................. 4
High margin business – beats domestic peers by a long way .............................................................................. 4
Business opportunity remains large in SS segment, capex revival key............................................................. 5
Exports account for ~40% share in SS segment; global opportunity remains strong ................................ 8
Envious growth track record, mean reversion on the cards in next 5 years ................................................... 9
Carbon steel business to gain from operating leverage ................................................... 10
Well distributed asset base with limited capacity ................................................................................................... 10
Utilization between 25-30%, revenue share at 40-45% ........................................................................................ 10
Large opportunity likely but strong competition to limit benefits .................................................................. 11
Consistently strong return ratios through efficient capital allocation ............................ 13
Efficient capital allocation – key hallmark of management ................................................................................ 13
Delivered strong growth coupled with margin expansion => great company run by good management ......................................................................................................................................................................... 13
Return ratios well ahead of peers’ ................................................................................................................................. 14
Free cash flow generation to remain strong ............................................................................................................. 14
Competition beating capabilities in niche business of SS pipes & tubes
Sustainable competitive strength of SS pipes & tubes business
RMTL is the leading domestic producer of stainless steel (SS) pipes & tubes with a capacity of 28ktpa and has been in the business for 3 decades. SS segment accounts for ~50% revenue share and has grown at a CAGR of 24.4% during FY04-14. SS pipes & tubes are mainly used for critical applications with requirements of low failure rate and long life in key industries like oil & gas, petrochemicals, refineries and power (see annexure on page 21 for details on SS pipes & tubes). RMTL has been able to establish sustainable competitive strength in this business which helps it in generating strong margins of 25%+ and it is a market leader with focus on high end application products.
Exhibit 1: SS business revenue share at ~52% (FY14) Exhibit 2: Strong revenue growth
Source: Company, Centrum Research Source: Company, Centrum Research
Entry barriers in SS pipes & tubes business
RMTL’s competitive advantage over its peers is partly driven by huge entry barriers in the form of:
� High initial capital outlay required to set up the business: Stainless steel pipes & tubes manufacturing business is capital intensive. The cost of setting up a Greenfield SS plant similar to that of RMTL (30,000 MTPA) is ~Rs12bn. RMTL has spent the past three decades in progressively building its asset base in the SS segment. For a new entrant high capex coupled with long payback period is a major deterrent.
� Superior technology requirement: Investment in hi-tech machines and expertise in developing customized products are key requirements of the business.
� Requisite customer approvals & EPC contract approvals: RMTL’s products have gone through a time consuming approval process. This is required as customers & EPC contractors verify quality & other features of the product which has to match stiff standards set by customers/ EPC contractors.
� Development of strong relationships with clients: RMTL caters to a diverse network of clients ranging from private entities like Reliance Industries, Essar, L&T to PSU companies like BHEL, IOCL, BPCL & HPCL. In the past 3 decades, RMTL has managed to build and develop its relationship with key clients by producing customized & superior quality products. The time taken to build & develop strong relationships with clients is a major entry barrier.
� Critical applications & low failure rate require focus on quality: Stringent standards needed to produce SS pipes & tubes free of any errors and with a very low failure rate serves as a barrier to entry as it is quite challenging to maintain high product quality standards and conform to a client’s customized requirement. The product has to go through rigorous quality checks as it finds application in critical production processes of various industries.
� Customization and quick delivery key requirements: The need to produce customized SS pipes & tubes as per client specifications on a consistent basis without compromising on quality and the task of delivering goods on time to clients also serve as a barrier to entry.
Sustainable competitive advantage of SS pipes business leads to higher & consistent EBITDA margins for RMTL.
Footer Page 3 of 27.
4 Ratnamani Metals & Tubes
RMTL is market leader with ~45% share; focus on high end products, quality, customization & quick delivery are its key hallmarks
RMTL is the largest player in the domestic market in the stainless steel pipes & tubes segment with ~45% market share. SS segment also accounts for ~50% of RMTL’s revenues. Company focuses on delivering high quality products to its customers with a high level of customization (as per customer’s requirements and project related needs) and ensures quick delivery times through efficient operational processes. This helps RMTL to stand out vis-à-vis its peers and coupled with strong relationships and approvals acquired over the years, the company has been able to maintain its leadership position in the market. RMTL focuses largely on high end application products vis-à-vis its peers which supply low end products which are easier to make and have lower margins.
High margin business – beats domestic peers by a long way
The stated entry barriers provide significant protection to RMTL’s SS business from competition and coupled with the company’s high end application product basket, leaves enough room for it to command higher premiums for its stainless steel products which earn an EBITDA margin of 25%+. The resultant effect of this is clearly evident in consistent & higher EBITDA margins the company has reported in the past. Compared to its peers, overall margins for RMTL are consistently higher in the range of 16-19%.
Exhibit 3: SS business drives strong margins for RMTL… Exhibit 4: …as SS business has margins of 25%+
Source: Company, Centrum Research Source: Company, Centrum Research
Exhibit 5: RMTL EBITDA margins well above SS peers… Exhibit 6: …as well as CS peers
Source: Company, Centrum Research Source: Company, Centrum Research
RMTL’s margins (despite including carbon steel business which has lower margin) are well above that of its peers in the SS pipes & tubes and this is mainly on account of benefits of scale, strong relationships and better product basket as other domestic SS pipe producers offer products for low end applications. RMTL’s margins remain well above those of peers in the CS pipes like Welspun, Jindal Saw and Man Inds on account of contribution from high margin niche segment of SS pipes & tubes. Large CS players did not enter the SS business in the past due to entry barriers, lower scale of opportunity and high initial capex with long payback period. Also, balance sheets of large CS players are already stretched due to overcapacity & past expansions in the line pipe segment.
51.6 39.4 47.4 45.1 55.1 51.910
15
20
25
30
35
40
20
30
40
50
60
FY09 FY10 FY11 FY12 FY13 FY14
(%)
(%)
SS Revenue share (LHS) RMTL Gross Margins
RMTL EBITDA Margins Avg gross margins
Avg EBITDA margins
25
15
10
12
14
16
18
20
22
24
26
28
30
SS Pipes & Tubes - Mgn % CS Pipes & Tubes - Mgn %
Indicative margins in each segment
0
4
8
12
16
20
24
FY09 FY10 FY11 FY12 FY13 FY14
(EBITDA Margin -%)
RMTL Prakash Steelage
Suraj Stainless Remi Edelstahl
4
8
12
16
20
24
FY09 FY10 FY11 FY12 FY13 FY14
(EBITDA Margin -%)
RMTL Welspun corp
Jindal Saw Man Inds
Margins in SS business are ~25% and well above peers due to high end product basket of RMTL.
Footer Page 4 of 27.
5 Ratnamani Metals & Tubes
Business opportunity remains large in SS segment, capex revival key
RMTL’s business opportunity remains large in the niche segment of SS pipes & tubes but would depend on quick revival of capex in key industries like refineries, thermal and nuclear power plants and chemicals & fertiliser units.
Refineries & petchem, power plants account for the majority of demand for SS pipes & tubes
SS pipes & tubes produced by RMTL find application in various critical industries like Oil & Gas exploration, Power (Nuclear & Thermal), Refineries, Petrochemicals, Fertilizers, Chemicals, Sugar, Pharma and other small industries. Although, in value terms SS pipes & tubes form a very small portion of the total investment made (cost of SS pipes and tubes in proportion to the total capex cost is quite low and varies between 4-6% of the total expansion cost), they form an integral part of the whole production process and are used in critical conversion processes.
Exhibit 7: SS pipes & tubes demand driven by capex in various industries
Project/Sector Capacity Capex (Rs
bn) Stainless steel pipes &
tubes (% share) Carbon Steel
pipes (% share) Total Pipes
(% share)
Refinery 1 mtpa 15 4-5 4-5 9-10
Thermal Power Plant 100 MW 6 2-3 2 4-5
Nuclear Power Plant 100 MW 8 3-4 1-2 5-6
Fertiliser 1 mtpa 50 2-3 2-3 4-5
Source: Company, Centrum Research Estimates
Exhibit 8: User industry share in SS revenues of RMTL (FY14)
Source: Company, Centrum Research
Oil & Gas, Refineries & Petrochem ,
34.6%
Power Plants, 43.8%
Chemicals, 6.1%
Fertiliser, 9.3%
Sugar & Dairy, 4.9%
Others, 1.4%
SS pipes & tubes are used in refineries and power plants set up and account for 4-5% of overall capex
Footer Page 5 of 27.
6 Ratnamani Metals & Tubes
Upcoming project capex in user industries remains large
Capex in upcoming projects in user industries remains large with i) ~74 mtpa of refinery capacity expected to be added in the next five years, ii) ~25GW of thermal power capacity addition by FY17E and ~10GW+ annual addition thereafter, iii) 4.5GW of nuclear power capacity addition in next five years and iv) 6 mtpa capacity addition in fertiliser industry in next five years.
Exhibit 9: Under implementation capex in Refineries
Company Project Name Capacity (mtpa) Capex (Rs bn) Commissioning Date
HPCL
Mumbai plant 3.5 170
By FY18-end Vizag plant 6.7
Rajasthan, Barmer 9 370
BPCL Bina 9 230 By FY18-end
Kochi 6 142.2 By FY18-end
IOCL Gujarat 4.3 50
Paradip 15 350 From FY16 onwards
RIL Refining
10.3 155 By FY16-end
5.4 80.6 By FY16-end
0.8 12.4 By FY17-end
Essar Oil Vadinar 4 60
Total
74.0 1,620.2
Source: Companies annual reports, Centrum Research
Exhibit 10: Under implementation capex in other user industries
Industry Capacity (MW) Capex (Rs bn) Period of completion
Thermal Power 25,000 1,500 FY15-17
Nuclear Power 4,500 360 FY15-17
Fertilizer (mtpa) 6 300 FY15-20
Source: Industry sources, Centrum Research
Domestic business opportunity for SS segment at ~Rs134bn during FY16-20E
We estimate domestic business opportunity for SS pipes & tubes at ~Rs134bn during FY16-20E based on already announced capacity addition plans from producers in various user industries. We have assumed that ~70% of the announced capex would be implemented over FY16-20E for our calculations. As RMTL enjoys ~45% market share in the SS pipes & tubes business, we expect business opportunity of ~Rs60bn for RMTL (~Rs12bn annually). This provides huge scope for RMTL’s niche business of SS pipes & tubes in which the company is currently generating annual revenues of ~Rs8bn and where it enjoys sustainable competitive advantages. Business opportunity remains large (~Rs8bn annually) even in our worst case scenario.
Exhibit 11: Business opportunity for SS pipes & tubes at ~Rs134bn during FY16-20E
Base Case FY16-20E Business Opportunity - FY16-20E
Project/Sector Planned Capacity Addition*
Capex (Rs bn)
SS pipes & tubes
(% share)
Stainless steel pipes (Rs bn)
Ratnamani's SS business opportunity - @45% mkt
share (Rs bn)
Refinery (MTPA) 54.8 822.5 4 32.9 14.8
Petrochem
313.5 3 9.4 4.2
Thermal Power Plant (MW) 40000 2400 3 72.0 32.4
Nuclear Power Plant (MW) 4300 344 4 13.8 6.2
Fertiliser (MTPA) 4 200 3 6.0 2.7
Total
134.1 60.3
Source: Company, Centrum Research Estimates, *assuming 70% of planned capex is spent
Capacity addition of ~74mtpa expected in refineries, 60GW+ in power during FY15-20
Planned capex in user industries points towards large domestic opportunity for SS segment of RMTL
Footer Page 6 of 27.
7 Ratnamani Metals & Tubes
Exhibit 12: Business opportunity for SS pipes & tubes during FY16-20E under various scenarios
Business Opportunity - FY16-20E Capex spent by user industries
(% vs planned) Stainless steel pipes
(Rs bn) Ratnamani's SS business opportunity
- @45% mkt share (Rs bn)
Best Case 188.1 84.6 100%
Base Case 134.1 60.3 70%
Worst Case 90.7 40.8 50%
Source: Company, Centrum Research Estimates
Capacity addition implementation has remained strong in refining, increased in power
Analysis of the capacity addition in the refining sector and thermal power sector in last few five year plan documents reveal that the execution of planned capacity additions in refining has remained strong at 104% (9th plan) & 83.8%(10th plan). Targeted capacity additions in the 11th & 12th plans have been quite aggressive in refining with an implementation rate of 70% in 11th plan which we expect to continue in the 12th plan as well. This will lead to a capacity addition of ~70mt over the next 4-5 years which is closer to our estimate of 74mt (refer exhibit 9). In the thermal power sector, the targeted capacity additions & corresponding execution rate have increased materially, planned addition in capacity has gone up ~ 2.5x (from 9th plan to 12th plan) and the implementation rate, which was quite low at 46-48% (9th & 10th plan) increased to 81% in 11th plan and is 95%+ in the 12th plan. All this augurs well for the demand of SS pipes & tubes segment.
Exhibit 13: High implementation rate in refining capacity addition during five year plans
Exhibit 14: Power capacity implementation rate has increased materially over last two five year plans
s
Source: Planning commission, Centrum Research Estimates Source: Planning commission, Centrum Research Estimates
Upgradation of refineries could be a big opportunity
GoI has indicated in the recent past that existing refineries need to upgrade to be able to produce Euro V-type fuels from CY19 in order to reduce the carbon footprint and emissions. Capex of ~US$13bn could be spent for this upgradation of existing refineries in India over the next 5 years for installation of new secondary units like desulphurisers, hydrotreaters etc. There is also need for some very old PSU refineries to upgrade their plants for competing better with private players. Though no concrete announcements have been made for plant upgradations by any major PSU refiners we believe the likelihood of the same in near future could provide a big opportunity for players like RMTL who would be key suppliers of various high end application products and equipment for up gradation of refineries. We have currently not factored in refinery upgradation capex in our estimates for demand opportunity for RMTL.
52.4 37 92 10054.5 31 64 70
104.0
83.8
69.6 70.0
0
20
40
60
80
100
120
0
20
40
60
80
100
120
9th Plan 10th Plan 11th Plan 12th PlanE
(mtp
a)
Target Capacity Addition Actual Capacity Addition
% achieved (RHS)
29
54
5
25
41
7
59
69
3
72
34
0
13
59
7
12
11
4
48
54
0
70
00
0
46.0 47.7
81.3
96.8
0
20
40
60
80
100
120
0
20000
40000
60000
80000
9th Plan 10th Plan 11th Plan 12th PlanE
(MW
)
Target Capacity Addition Actual Capacity Addition
% achieved (RHS)
Aggressive planned capacity additions in refining & thermal sector coupled with higher execution rate to boost demand for SS pipes & tubes.
Footer Page 7 of 27.
8 Ratnamani Metals & Tubes
Demand for underlying petroleum products expected to increase, could spur capex
According to Petroleum planning and analysis cell, the demand for petroleum products in domestic market is expected to grow at a CAGR of 5.7% during FY14-20E (vs 3.5% during FY08-14). Similarly, supply of natural gas is also expected to grow at a fast pace. Though we note that natural gas supply is plagued by pricing issues and refining capacity for petroleum products is already in excess of demand, we expect higher demand growth to spur capex in key user industries of oil & gas and refineries & petchem which in turn would drive the demand for steel pipes.
Exhibit 15: Higher demand of underlying products could spur capex in user industries
Source: PPAC, Centrum Research
Exports account for ~40% share in SS segment; global opportunity remains strong
Exports account for ~40% share of revenues in SS pipes & tubes segment for RMTL. Korea, Asia and Middle-east account for the majority of exports as refining and power capacity set-up has been strong at these locations. RMTL has been mainly supplying high end application products in the export market like LP heater tubes, instrumentation tubes, ASTM grade pipes and has been focussing on value addition. The market for such high end products is dominated by a few large players globally including RMTL and thus the company has a strong growth trajectory in the same.
Exhibit 16: Exports in SS segment have grown at a fast clip Exhibit 17: Geography wise SS export share - % (FY14)
Source: Company, Centrum Research Source: Company, Centrum Research
3.5
5.7
4.9
7.9
0
1
2
3
4
5
6
7
8
9
FY08-14 FY14-20E
(De
man
d C
AG
R -
%)
Petroleum Products demand Natural Gas supply
294
1,325
2,698 2,458
2,246
-
500
1,000
1,500
2,000
2,500
3,000
FY11 FY12 FY13 FY14 9MFY15
(Rs
mn
)
Middle-East, 12.6%
South Korea, 29.0%
Europe, 15.5%America,
3.4%
Asia , 25.4%
Others, 14.0%
Underlying products demand expected to be higher going forward
RMTL exports its high end application products to Korea and Middle-east and has achieved strong growth in exports
Footer Page 8 of 27.
9 Ratnamani Metals & Tubes
Envious growth track record, mean reversion on the cards in next 5 years
RMTL’s revenues from SS pipes & tubes segment have grown at a CAGR of 24.4% during FY04-14 but growth has been moderate during FY09-14 with CAGR of 6.8% as domestic demand has been impacted by slower growth and subdued capex spends in user industries. We expect the revenue from SS segment to start showing mean reversion going ahead with expected pick up in capex in user industries which in turn would be driven by higher GDP growth, lower interest rates and revival of investment cycle. We expect SS segment revenues to grow at a CAGR of 15.3% during FY14-17E.
Exhibit 18: SS segment revenue trend – CAGR of 15.3% expected during FY14-17E
Source: Company, Centrum Research Estimates
Capacity expansion targeted in seamless tubes in SS segment
RMTL is expected to increase capacity in seamless stainless steel tubes from 8ktpa to 28ktpa in two phases at a capex of ~Rs4bn over the next 4 years. The capex is expected to be funded by internal accruals and capacity expansion is expected to take place at its facility in Chhatral where existing 8ktpa line is functioning. The company plans to set-up a hot extrusion line of 20ktpa for seamless tubes in the next two years at a capex of ~Rs2bn which would provide integration for manufacturing seamless tubes and also allow manufacturing of higher diameter tubes (up to 8” from current 2”). Post expansion, company’s SS pipes & tubes capacity would get enhanced to 48ktpa by FY18E (from current 28ktpa).
Exhibit 19: Capacity expansion plans in seamless tubes in SS segment
(tpa) Current Capacity Expansion Location Capex (Rs mn) Completion Date
Welded 20,000 Kutch
Seamless 8,000 20,000 Chhatral 4,000 Hot Extrusion Phase1 by FY17E
We expect SS segment revenue CAGR of 15.3% during FY14-17E vs 6.8% during FY09-14 and 24.4% during FY04-14
Capacity expansion of 20ktpa planned in seamless stainless steel tubes to be completed in two phases by FY19
Footer Page 9 of 27.
10 Ratnamani Metals & Tubes
Carbon steel business to gain from operating leverage
Well distributed asset base with limited capacity
Apart from manufacturing stainless steel tubes & pipes, RMTL is also present in the carbon steel pipes business producing LSAW, HSAW, ERW and coated pipes mainly catering to the Oil & Gas, Power, water and other small industries. RMTL’s total capacity in CS business is 3.5 lakh tpa and is spread across various product segments.
Exhibit 20: RMTL’s carbon steel pipes portfolio
Pipe Type Capacity (tpa) Dia Range Thickness Range Applications Expansion Completion date
LSAW 30,000 12" to 48" 5mm to 28mm Line pipe - water, oil&gas, city gas distribution
20,000 H1FY16
HSAW 180,000 16" to 142" 4mm to 20mm Line pipe - water, oil&gas, city gas distribution
ERW 70,000 4" to 18" 3.2mm to 12.7mm Oil & gas transportation, plumbing, water supply
LCSSAW 60,000 32" to 150" 5mm to 65mm Water distribution, drainage
Source: Company, Centrum Research
LSAW segment caters to customized demand, enjoys strong margins
RMTL has its LSAW manufacturing unit in Ahmedabad, Chhatral with a limited capacity of (30,000 MTPA) catering to customized demand of its clients. LSAW pipes are more robust and command a premium as compared to HSAW and ERW pipes and are used purely in industrial applications. RMTL enjoys 20-25% EBITDA margins in the LSAW segment, and given the high margins in this segment RMTL has plans to increase its LSAW capacity by 20ktpa at a capex of Rs120mn by H1FY16E.
Mobile pipe plant
RMTL ventured into manufacturing pipes at the site by way of mobile plant with a production capacity of 24,000 MTPA. The mobile plant caters to customer requirement on location. This plant can be dismantled and re-erected within a short span of time. This unique feature helps in easy handling of pipes at site, meeting delivery schedules and cut down transportation cost thus making the project economical and viable. At site the mobile plant can produce HSAW pipes having diameter in excess of 18" up to 150" in various thicknesses, in single random length or double random length depending upon project requirements.
Utilization between 25-30%, revenue share at 40-45%
RMTL’s carbon steel business has seen capacity utilization in the range of 25-30% and accounts for 40-45% of overall revenues (excluding coating revenues which is another 5-6%). Margins in the business are in the range of 14-15% and remain subdued due to high competition. The business is largely driven by order book and company won a large order of ~Rs4.3bn from Gujarat govt. in FY14 related to its ‘Saumi Yojna’ which pushed up the order book as well as revenues from CS segment for RMTL in FY15E. Management expects another order for phase 2 of the same scheme in FY16E which can help it to maintain revenue traction in FY16E.
Exhibit 21: CS revenue and utilization trend Exhibit 22: CS order book trend
Source: Company, Centrum Research Estimates Source: Company, Centrum Research
8.613.2
20.5 20.6 22.7
32.2
24.529.9
23.8
31.7
40.0
32.8
52.5 49.8
39.4
46.9
58.9
43.937.3
29.7
37.6
45.0
0
10
20
30
40
50
60
70
0
1000
2000
3000
4000
5000
6000
7000
8000
9000
FY
05
FY
06
FY
07
FY
08
FY
09
FY
10
FY
11
FY
12
FY
13
FY
14
FY
15
E
(Rs
mn
)
Revenue Capacity Utilization-% % Share(LHS)
1000
2000
3000
4000
5000
6000
7000
8000
9000
Q2
FY
13
Q3
FY
13
Q4
FY
13
Q1
FY
14
Q2
FY
14
Q3
FY
14
Q4
FY
14
Q1
FY
15
Q2
FY
15
Q3
FY
15
(Rs
mn
)
Rs4.3bn order inflow from Gujarat govt.'s "Saumi Yojna"
CS business has capacity of 3.5 lakh tpa and is well distributed with various product offerings
CS business has seen increase in utilizations due to better order inflow
Footer Page 10 of 27.
11 Ratnamani Metals & Tubes
Large opportunity likely but strong competition to limit benefits
Low penetration of pipes in the various sectors like oil and gas transportation coupled with new discoveries currently provides a huge scope for the growth of the pipe industry. The Indian pipe industry is one of the top three manufacturing zones after Europe and Japan. There are four major sectors – oil & gas transportation, sewerage and plumbing, water distribution and irrigation.
Opportunity from future global pipeline projects remains strong
According to Simdex’s projections of CY14, 776 global pipeline projects are planned which involves setting up of more than 2.7 lakh kms of pipelines. This is expected to generate business opportunity of ~80 MT and ~US$70bn over the next five years. More than 30% of the opportunity is expected in Asia and Middle-east and thus provides good scope of line pipe orders for Indian line pipe players. In addition, replacement demand from USA & Europe is likely to be a big demand driver over the next 5-10 years.
Exhibit 23: Future global pipeline projects
Region No of Projects Total Length (Kms) Tonnage (MT)* Value (US$ bn)#
North America 257 58,000 17.4 14.8
Latin America 65 39,000 11.7 9.9
Europe 129 40,000 12 10.2
Africa 87 29,000 8.7 7.4
Middle-East 108 31,000 9.3 7.9
Asia 76 53,000 15.9 13.5
Australasia 54 21,000 6.3 5.4
Total 776 271,000 81.3 69.1
Source: SIMDEX, Centrum Research, *Ikm=300 tonnes, #Realization/t=US$850
Spending on building gas and water distribution infrastructure in India on the rise
Spending on building pipeline infrastructure for distribution of gas as well as water is on the rise and various projects are being planned. For gas distribution, major players like GAIL, GSPL and RGTIL have announced projects for building pipelines with a total length of ~14000kms.
Exhibit 24: Major gas pipeline projects
Company/Project Length (Kms) Appx. Tonnage (MT)
GAIL
Jagdishpur-Haldia 1,860 0.6
Surat-Paradip 2,112 0.6
Kochi-Mangalore-Bangalore 1,104 0.3
Dhabhol-Bangalore 1,414 0.4
RGTIL
Kakinada-Haldia 928 0.3
Kakinada-Chennai 577 0.2
Chennai-Tuticorin 585 0.2
Chennai-Banglore-Mangalore 538 0.2
GSPL
Mallavaram-Bhopal-Bhilwara-Vijaipur 2,042 0.6
Mehsana-Bhatinda 2,052 0.6
Bhatinda-Jammu-Srinaagar 725 0.2
APGDC
Kakinada-Srikakulam 391 0.1
Total 14,328 4.3
Source: PPAC, PNGRB, Centrum Research, 1km=300 tonne
Opportunity from global pipeline projects remains large at ~81 MT over the next 5-10 years
Footer Page 11 of 27.
12 Ratnamani Metals & Tubes
Low pipeline penetration in India provides huge potential
Indian pipeline network is one of the least penetrated in the world. The current gas pipeline in India is ~15,000 km, while that of United States is 1.83 million kms and even Pakistan has pipelines of 56,000 km, which is nearly three and half times more than that of India. The current status of pipelines offers a huge scope for the pipe industry to grow at a faster rate, considering the investments that Oil and Gas sector is attracting. With the setting up of the Petroleum & Natural Gas Regulatory Board (PNGRB) and new gas finds on India’s eastern coast, heavy investment is being lined up for laying pipelines across the country. With the GoI focusing on providing increased drinking water supply and irrigation for agriculture across India, there is a huge scope for growth for water pipelines also.
Overcapacity in industry makes competitive landscape weak
The carbon steel pipes business is flooded with many domestic and overseas players and currently there is oversupply of these pipes from RMTL’s nearest competitors in the organised sector as well as unorganised sector. Competitive landscape remains weak due to overcapacity and considering the same, RMTL has strategically built a small capacity base for HSAW & LSAW pipes.
Exhibit 25: Domestic carbon steel producers
(in ktpa) HSAW LSAW ERW Seamless Total
Welspun Corp 700 700 200 1,600
Jindal SAW 550 1,100
1,650
Maharashtra Seamless
200 550 750
Man Inds 500 500
1,000
RMTL 180 100 70 350
Source: Company, Centrum Research
Higher operational efficiencies targeted
RMTL’s CS pipes capacity has remained largely stagnant as utilization levels have been quite low at ~ 25%, which is partly explained by low order inflows on the back of slow build-up of pipe line network in India and severe competition from both organised & un-organised players. However, in the last 3-4 years utilization levels have gone up in the range of 30-35% suggesting a spike in the pipeline activity and inflow of water pipeline orders. With enough capacity available RMTL is all set to gain from any increase in pipeline network in India and thereby improve its utilizations through increase in operating leverage.
We expect capacity utilization in company’s CS business to increase to 50% by FY17E. On account of overcapacity in the carbon steel pipe industry and less than 50% capacity utilization for RMTL, the company has no plans to expand significantly, but to just do some modification to its LSAW facility in Chattral, Ahmedabad. This would take the existing capacity of its LSAW pipes from 30,000 MT to 50,000 MT. The company has enough capacity in place to cater to the new demand and hence has not chalked out any plan to increase its present capacity for SAW pipes.
Exhibit 26: Capacity utilization in CS business picking up Exhibit 27: User industry share in CS revenues (FY14)
Source: Company, Centrum Research Estimates Source: Company, Centrum Research
79
35
1
11
25
62
85
69
5
10
47
16
83
27
6
11
09
25
14
00
00
15
96
00
19
00
00
22.7
32.2
24.529.9
23.8
31.7
40.0 42.0
50.0
0.0
10.0
20.0
30.0
40.0
50.0
60.0
0
50000
100000
150000
200000
250000
300000
350000
400000
FY09 FY10 FY11 FY12 FY13 FY14 FY15EFY16EFY17E
(to
nn
e)
Capacity Production Utilization - % (RHS)
Oil & Gas transportation,
53.2%
Water transportation,
34.4%
Others, 12.4%
CS business has seen increase in capacity utilization led by better order inflow and is expected to see further increase driven by operating leverage
Footer Page 12 of 27.
13 Ratnamani Metals & Tubes
Consistently strong return ratios through efficient capital allocation
Efficient capital allocation – key hallmark of management
Efficient capital allocation by RMTL management has been one of the key contributors of superlative growth delivered by the company. We note that gross block has expanded by 6.7x in last 10 years (FY05-14) while revenue, EBITDA and PAT have expanded by 7.3x, 8.8x and 10.8x respectively (all of them well above the expansion in gross block). Incremental capital allocated by the management has not only led to expansion of net sales/gross block ratio but also resulted in higher margins and return ratios. We believe that this indicates superior capital allocation capabilities of the management over long periods of time.
Exhibit 28: Net sales growth led by gross block expansion Exhibit 29: Margins and ROCE improvement shown
Source: Company, Centrum Research Source: Company, Centrum Research
Delivered strong growth coupled with margin expansion => great company run by good management
On account of efficient capital allocation for expansion of its niche business, strengthening quality checks, developing new products and building efficient supply chain, RMTL has been successful in delivering superlative EBITDA/PAT CAGR of 27%/30% during FY05-14. Also, the margin profile has improved by 200-300bps during this period thus signalling higher operational efficiency. We believe that the combination of strong growth and increase in margins is generally very rare to find and is a key attribute of great companies run by extremely good managements and RMTL falls under this category.
Exhibit 30: Strong EBITDA/PAT growth Exhibit 31: Coupled with expansion in margins
Source: Company, Centrum Research Source: Company, Centrum Research
11
11
19
70
30
18
33
85
47
04
50
10
52
93
58
87
65
36
74
94
1.6 1.6 1.9
2.5
2.0
1.7
1.5
2.1
1.81.8
1.2
1.4
1.6
1.8
2.0
2.2
2.4
2.6
0
2000
4000
6000
8000
10000
12000
14000
FY05 FY06 FY07 FY08 FY09 FY10 FY11 FY12 FY13 FY14
(Rs
mn
)
Net Sales Gross Block NS/GB (x)
FY05-14: Net Sales - 7.3xGross Block - 6.7x
16.1
21.319.4
21.5
36.9
25.1
12
16
20
24
28
32
36
40
FY05 FY06 FY07 FY08 FY09 FY10 FY11 FY12 FY13 FY14
Margin % ROCE (pre tax)
0
500
1000
1500
2000
2500
3000
FY05 FY14
(Rs
mn
)
EBITDA PAT
FY05-14 CAGR:EBITDA - 27.3%PAT - 30.2% 16.1
19.4
13.715.9
7.3
10.8
0.0
5.0
10.0
15.0
20.0
25.0
FY05 FY14
(%)
EBITDA mgn EBIT mgn PAT mgn
Sales/EBITDA/PAT has expanded by 7.3x/8.8x/10.8x on the back of gross block expansion of 6.7x during FY05-14
RMTL has achieved strong growth coupled with margin expansion which is rare to find
Footer Page 13 of 27.
14 Ratnamani Metals & Tubes
Return ratios well ahead of peers’
RMTL surpasses peers in terms of return ratios due to presence in niche business of SS pipes, superior capital allocation and strong margins in its product segment. While ROE for RMTL is ~20% and has remained well above 15% consistently in the last 10 years, other domestic peers lag far behind with figures below 15%. In terms of ROCE also, RMTL stands out with pre-tax ROCE at ~25% while domestic peers have ROCE in the range of 5-15%.
Exhibit 32: ROE well above peers Exhibit 33: ROCE (pre-tax) much higher than peers
Source: Company, Centrum Research Source: Company, Centrum Research
Free cash flow generation to remain strong
RMTL has been a consistent free cash flow generating company and we expect the trend to continue with free cash flow generation going forward despite capex for expansion in SS pipes & tubes segment. We expect free cash flow yield of 1.2% in FY17E.
Exhibit 34: FCF to remain positive despite higher capex Exhibit 35: Free cash flow yield and FCF/EBITDA
Source: Company, Centrum Research Estimates Source: Company, Centrum Research Estimates
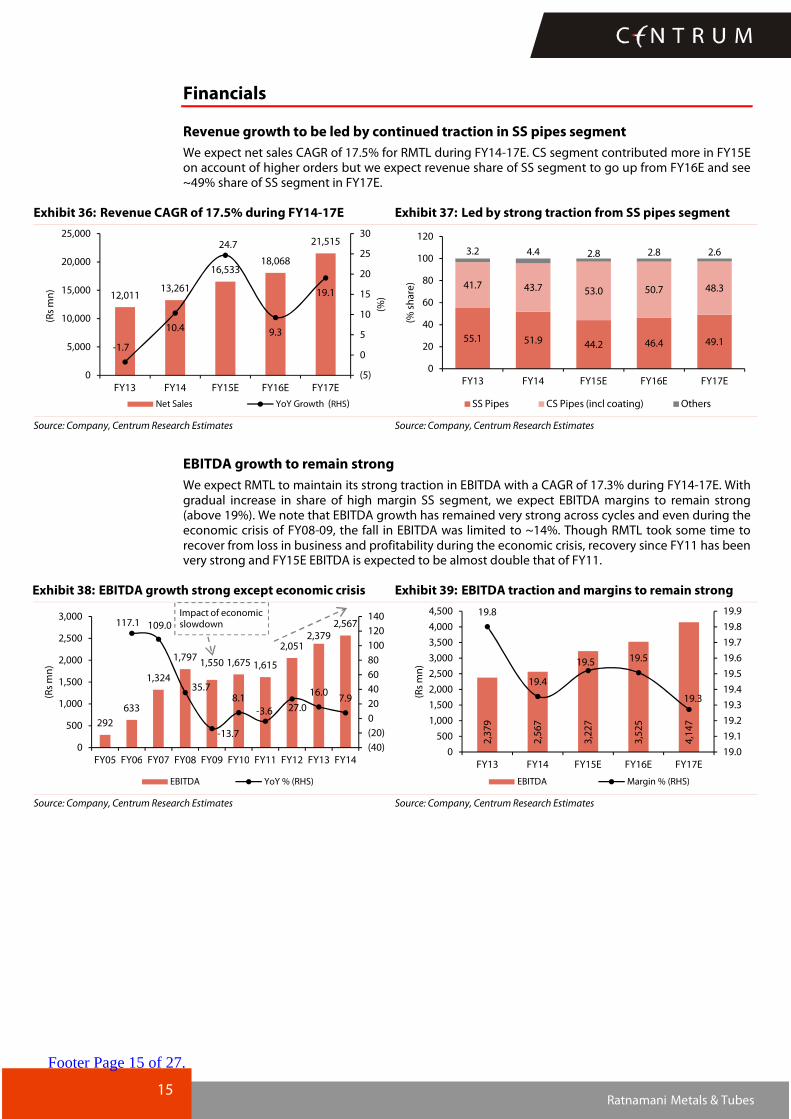
Revenue growth to be led by continued traction in SS pipes segment
We expect net sales CAGR of 17.5% for RMTL during FY14-17E. CS segment contributed more in FY15E on account of higher orders but we expect revenue share of SS segment to go up from FY16E and see ~49% share of SS segment in FY17E.
Exhibit 36: Revenue CAGR of 17.5% during FY14-17E Exhibit 37: Led by strong traction from SS pipes segment
Source: Company, Centrum Research Estimates Source: Company, Centrum Research Estimates
EBITDA growth to remain strong
We expect RMTL to maintain its strong traction in EBITDA with a CAGR of 17.3% during FY14-17E. With gradual increase in share of high margin SS segment, we expect EBITDA margins to remain strong (above 19%). We note that EBITDA growth has remained very strong across cycles and even during the economic crisis of FY08-09, the fall in EBITDA was limited to ~14%. Though RMTL took some time to recover from loss in business and profitability during the economic crisis, recovery since FY11 has been very strong and FY15E EBITDA is expected to be almost double that of FY11.
Exhibit 38: EBITDA growth strong except economic crisis Exhibit 39: EBITDA traction and margins to remain strong
Source: Company, Centrum Research Estimates Source: Company, Centrum Research Estimates
We initiate coverage on RMTL with a Buy rating and target price of Rs990 based on 20x FY17E EPS of Rs49.5. The valuation multiple assigned by us implies a PEG of 1.2x which is justified according to us on account of the following:-
� RMTL is a very well-managed company which has a strong track record of delivering high growth and strong return ratios. We expect EBITDA/PAT CAGR of 17.3%/17.4% during FY14-17E and continuation of strong return rations (post tax ROCE of ~18%).
� RMTL has been a consistent high tax paying company with average tax rate of 33.7% during FY07-14. This demonstrates MNC type of character and is generally very hard to find in industrial/metal companies. We see parallel to companies like Vesuvius/Orient Refractories in the metals space for RMTL in terms of its tax payments. Needless to mention but RMTL would also be one of the biggest beneficiaries of corporate tax reduction over the next four years as announced in the budget.
� Management compensation at RMTL has been linked to company’s performance and this has remained one of the powerful drivers of superior performance.
� In the domestic pipes & tubes space, other listed companies are not comparable enough to be recognised as investment alternatives due to poor track records, stretched balance sheets, corporate governance issues and inferior return metrics.
We note that the P/E multiple ascribed by us is well ahead of RMTL’s historical average and also well above that of domestic peers but is justified on account of superior fundamentals, future growth opportunity and strong management capabilities. We believe that the stock has largely remained undiscovered and out of radar of institutional investors for long and this could be one of the reasons for low valuations in the past.
Exhibit 43: P/E band for RMTL Exhibit 44: EV/EBITDA band for RMTL
Source: Bloomberg, Company, Centrum Research Estimates Source: Bloomberg, Company, Centrum Research Estimates
Source: Bloomberg Estimates, #Centrum Research Estimates, *FY14=CY13 and so on for global peers, NA-Not available on bbg
0
3
6
9
12
15
18
May
-06
De
c-0
6
Jun
-07
Jan
-08
Jul-
08
Feb
-09
Sep
-09
Mar
-10
Oct
-10
Ap
r-1
1
No
v-1
1
May
-12
De
c-1
2
Jul-
13
Jan
-14
Au
g-1
4
Feb
-15
P/E Mean
Mean + Std Dev Mean - Std Dev
0
2
4
6
8
10
May
-06
No
v-0
6
Jun
-07
De
c-0
7
Jul-
08
Jan
-09
Au
g-0
9
Mar
-10
Sep
-10
Ap
r-1
1
Oct
-11
May
-12
No
v-1
2
Jun
-13
De
c-1
3
Jul-
14
Feb
-15
EV/EBITDA Mean
Mean + Std Dev Mean - Std Dev
PEG of 1.2x for RMTL is appropriate on account of high growth profile, strong management, MNC type character in various aspects and market leadership position with performance well above peers
Footer Page 17 of 27.
18 Ratnamani Metals & Tubes
Key risks to our thesis
� Lower than expected pick up in capex: Capex spends in some key user industries (especially Refineries and petchem) of RMTL has slowed down in the last few years and we expect a pick up ahead on account of pricing deregulation and higher demand. However, lower than expected pick up in capex could lead to lower volumes and revenues from the SS segment for RMTL. According to our calculations, if only 50% of the planned capex is spent in user industries, growth in company’s SS segment would be affected materially.
� Margin pressure due to higher competition from global peers: RMTL has been able to maintain high margins in SS business led by sustainable competitive advantages. Though we don’t expect any change to that situation, higher aggression by global players for gaining market share could lead to lower than expected margins.
� High volatility in raw material prices: RMTL’s key raw materials are stainless steel and carbon steel coils & plates. Though the company enters into back to back arrangement for its input requirements, any major volatility in raw material prices may have some impact on its gross margins and profitability.
Footer Page 18 of 27.
19 Ratnamani Metals & Tubes
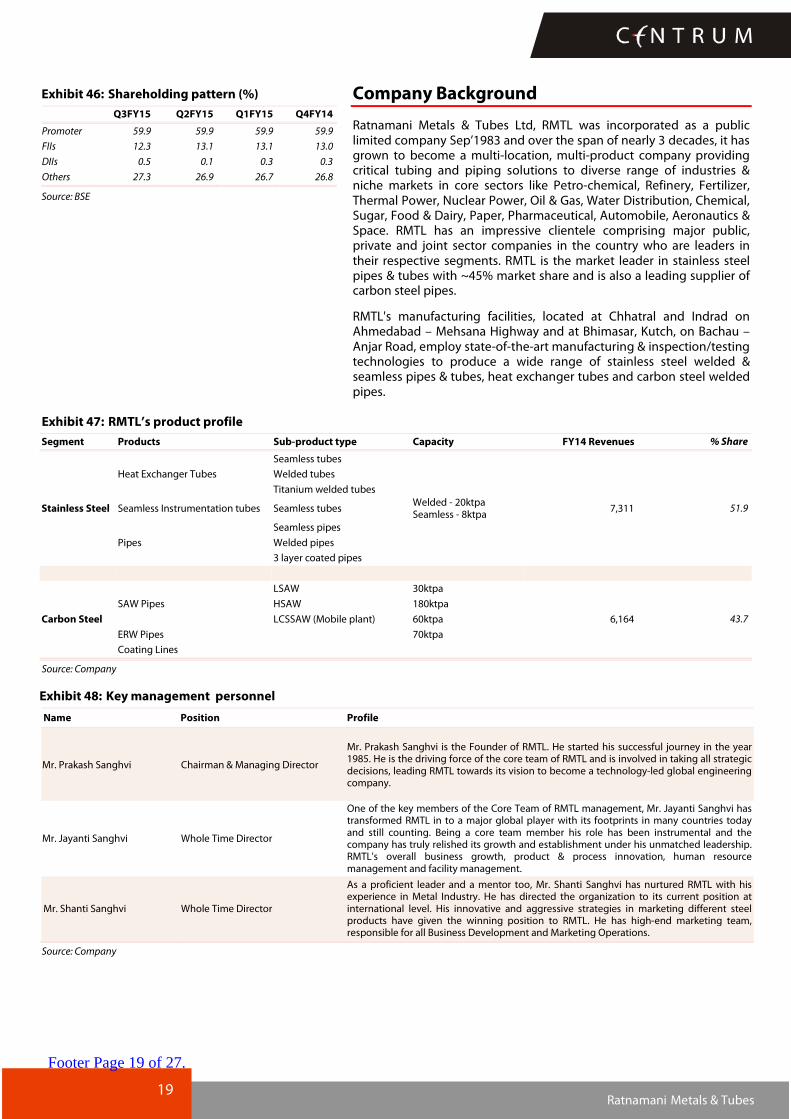
Exhibit 46: Shareholding pattern (%)
Q3FY15 Q2FY15 Q1FY15 Q4FY14
Promoter 59.9 59.9 59.9 59.9
FIIs 12.3 13.1 13.1 13.0
DIIs 0.5 0.1 0.3 0.3
Others 27.3 26.9 26.7 26.8
Source: BSE
Company Background
Ratnamani Metals & Tubes Ltd, RMTL was incorporated as a public limited company Sep’1983 and over the span of nearly 3 decades, it has grown to become a multi-location, multi-product company providing critical tubing and piping solutions to diverse range of industries & niche markets in core sectors like Petro-chemical, Refinery, Fertilizer, Thermal Power, Nuclear Power, Oil & Gas, Water Distribution, Chemical, Sugar, Food & Dairy, Paper, Pharmaceutical, Automobile, Aeronautics & Space. RMTL has an impressive clientele comprising major public, private and joint sector companies in the country who are leaders in their respective segments. RMTL is the market leader in stainless steel pipes & tubes with ~45% market share and is also a leading supplier of carbon steel pipes.
RMTL's manufacturing facilities, located at Chhatral and Indrad on Ahmedabad – Mehsana Highway and at Bhimasar, Kutch, on Bachau – Anjar Road, employ state-of-the-art manufacturing & inspection/testing technologies to produce a wide range of stainless steel welded & seamless pipes & tubes, heat exchanger tubes and carbon steel welded pipes.
Exhibit 47: RMTL’s product profile
Segment Products Sub-product type Capacity FY14 Revenues % Share
Stainless Steel
Heat Exchanger Tubes
Seamless tubes
Welded - 20ktpa Seamless - 8ktpa
7,311 51.9
Welded tubes
Titanium welded tubes
Seamless Instrumentation tubes Seamless tubes
Pipes
Seamless pipes
Welded pipes
3 layer coated pipes
Carbon Steel
SAW Pipes
LSAW 30ktpa
6,164 43.7
HSAW 180ktpa
LCSSAW (Mobile plant) 60ktpa
ERW Pipes
70ktpa
Coating Lines
Source: Company
Exhibit 48: Key management personnel
Name Position Profile
Mr. Prakash Sanghvi Chairman & Managing Director
Mr. Prakash Sanghvi is the Founder of RMTL. He started his successful journey in the year 1985. He is the driving force of the core team of RMTL and is involved in taking all strategic decisions, leading RMTL towards its vision to become a technology-led global engineering company.
Mr. Jayanti Sanghvi Whole Time Director
One of the key members of the Core Team of RMTL management, Mr. Jayanti Sanghvi has transformed RMTL in to a major global player with its footprints in many countries today and still counting. Being a core team member his role has been instrumental and the company has truly relished its growth and establishment under his unmatched leadership. RMTL's overall business growth, product & process innovation, human resource management and facility management.
Mr. Shanti Sanghvi Whole Time Director
As a proficient leader and a mentor too, Mr. Shanti Sanghvi has nurtured RMTL with his experience in Metal Industry. He has directed the organization to its current position at international level. His innovative and aggressive strategies in marketing different steel products have given the winning position to RMTL. He has high-end marketing team, responsible for all Business Development and Marketing Operations.
Q3FY15 witnessed healthy growth with revenue up by 45.7% YoY led by execution of carbon steel order received from Gujarat govt. earlier. EBITDA went up by 47% YoY and margins remained strong at 19% despite higher proportion of lower margin carbon steel sales. PAT growth was also strong at 46.1%.
Footer Page 20 of 27.
21 Ratnamani Metals & Tubes
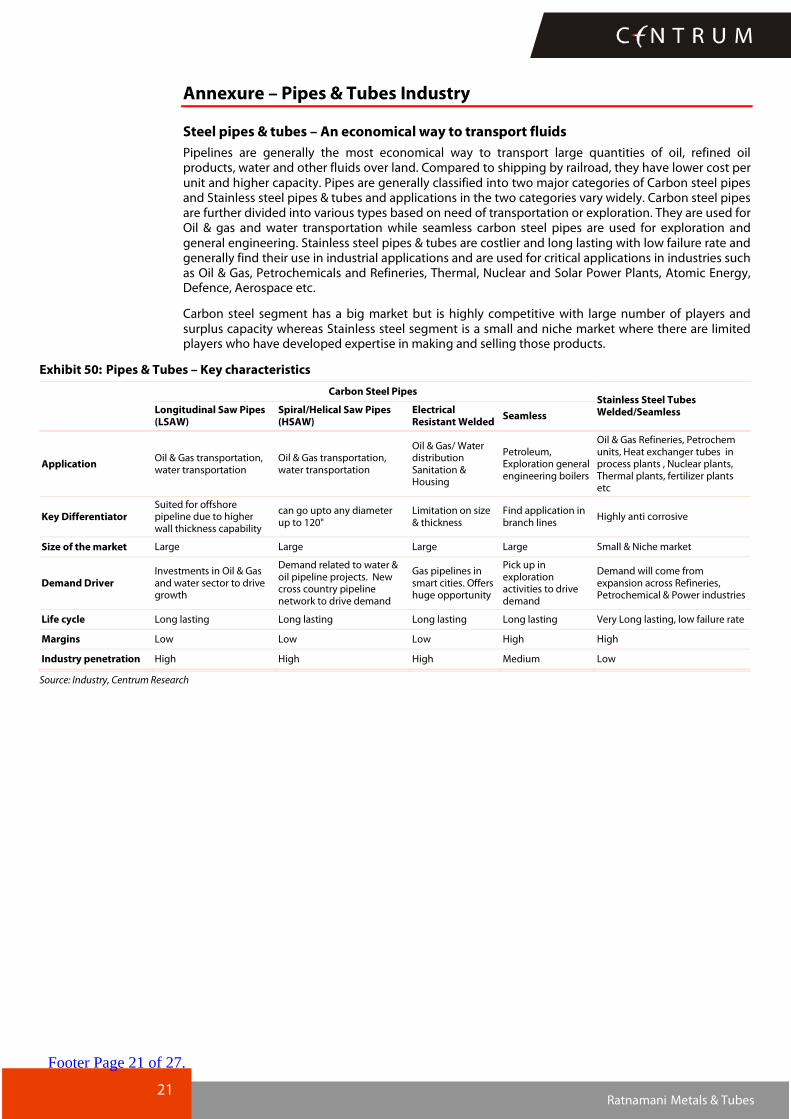
Annexure – Pipes & Tubes Industry
Steel pipes & tubes – An economical way to transport fluids
Pipelines are generally the most economical way to transport large quantities of oil, refined oil products, water and other fluids over land. Compared to shipping by railroad, they have lower cost per unit and higher capacity. Pipes are generally classified into two major categories of Carbon steel pipes and Stainless steel pipes & tubes and applications in the two categories vary widely. Carbon steel pipes are further divided into various types based on need of transportation or exploration. They are used for Oil & gas and water transportation while seamless carbon steel pipes are used for exploration and general engineering. Stainless steel pipes & tubes are costlier and long lasting with low failure rate and generally find their use in industrial applications and are used for critical applications in industries such as Oil & Gas, Petrochemicals and Refineries, Thermal, Nuclear and Solar Power Plants, Atomic Energy, Defence, Aerospace etc.
Carbon steel segment has a big market but is highly competitive with large number of players and surplus capacity whereas Stainless steel segment is a small and niche market where there are limited players who have developed expertise in making and selling those products.
Application Oil & Gas transportation, water transportation
Oil & Gas transportation, water transportation
Oil & Gas/ Water distribution Sanitation & Housing
Petroleum, Exploration general engineering boilers
Oil & Gas Refineries, Petrochem units, Heat exchanger tubes in process plants , Nuclear plants, Thermal plants, fertilizer plants etc
Key Differentiator Suited for offshore pipeline due to higher wall thickness capability
can go upto any diameter up to 120"
Limitation on size & thickness
Find application in branch lines
Highly anti corrosive
Size of the market Large Large Large Large Small & Niche market
Demand Driver Investments in Oil & Gas and water sector to drive growth
Demand related to water & oil pipeline projects. New cross country pipeline network to drive demand
Gas pipelines in smart cities. Offers huge opportunity
Pick up in exploration activities to drive demand
Demand will come from expansion across Refineries, Petrochemical & Power industries
Life cycle Long lasting Long lasting Long lasting Long lasting Very Long lasting, low failure rate
Margins Low Low Low High High
Industry penetration High High High Medium Low
Source: Industry, Centrum Research
Footer Page 21 of 27.
Stainless steel pipes & tubes Stainless steel pipes and tubes are used for a variety of reasons: to resist corrosion and oxidation, to resist high temperatures, for cleanliness and low maintenance costs, and to maintain the purity of materials which come in contact with stainless steel. The inherent characteristics of stainless steel permit the design of thin wall piping systems without fear of early failure due to corrosion. The use of fusion welding to join such piping eliminates the need for threading.
SS pipes & tubes are further divided into three major types:-
Shareholders' fund 6,467 7,665 9,149 10,759 12,666
Total debt 1,355 811 511 261 211
Deferred tax liabilities 400 467 467 467 467
Total Liabilities 8,222 8,943 10,126 11,486 13,343
Gross block 6,536 7,494 8,214 9,834 11,454
Less: accumulated depreciation
2,631 3,076 3,610 4,249 4,994
Net block 3,905 4,418 4,604 5,585 6,461
Capital work in progress 229 130 210 390 570
Goodwill 0 0 0 0 0
Investments 291 541 341 341 341
Inventories 2,327 2,517 3,171 3,465 4,126
Trade Receivables 2,512 2,781 3,624 3,960 4,716
Cash & cash equivalents 601 434 558 349 235
Loans & advances 405 637 770 842 1,002
Trade payables 1,006 1,531 1,812 1,980 2,358
Other current liabilities 728 656 906 990 1,179
Provisions 331 346 453 495 589
Total Assets 8,222 8,943 10,126 11,486 13,343
Source: Company, Centrum Research Estimates
Exhibit 61: Cash Flow
Y/E Mar(Rs mn) FY13 FY14 FY15E FY16E FY17E
PBT 2,015 2,142 2,706 2,935 3,479
Interest 90 58 103 77 62
Depreciation 425 459 534 639 745
Increase in debtors (234) (303) (843) (336) (755)
Increase in inventories 511 (190) (654) (294) (661)
Increase in current liab & payables
51 525 281 168 378
Tax 547 648 906 983 1,165
Cash flow from operations 2,359 1,595 1,442 2,260 2,204
Change in fixed assets (577) (796) (800) (1,800) (1,800)
Cash flow from investments (629) (1,085) (600) (1,800) (1,800)
Change in debt (1,595) (591) (300) (250) (50)
Dividends paid (162) (217) (316) (343) (406)
Interest paid (79) (60) (103) (77) (62)
Cash flow from financing (1,836) (852) (719) (669) (518)
Net cash flow (106) (342) 124 (209) (114)
Opening cash balance 706 600 250 373 164
Closing cash balance 600 250 373 164 50
Free Cash Flow 1,787 804 642 460 404
Source: Company, Centrum Research Estimates
Footer Page 24 of 27.
25 Ratnamani Metals & Tubes
Appendix A
Disclaimer
Centrum Broking Limited (“Centrum”) is a full(service, Stock Broking Company and a member of The Stock Exchange, Mumbai (BSE) and National Stock Exchange of India Ltd. (NSE). Our holding company, Centrum Capital Ltd, is an investment banker and an underwriter of securities. As a group Centrum has Investment Banking, Advisory and other business relationships with a significant percentage of the companies covered by our Research Group. Our research professionals provide important inputs into the Group's Investment Banking and other business selection processes.
Recipients of this report should assume that our Group is seeking or may seek or will seek Investment Banking, advisory, project finance or other businesses and may receive commission, brokerage, fees or other compensation from the company or companies that are the subject of this material/report. Our Company and Group companies and their officers, directors and employees, including the analysts and others involved in the preparation or issuance of this material and their dependants, may on the date of this report or from, time to time have "long" or "short" positions in, act as principal in, and buy or sell the securities or derivatives thereof of companies mentioned herein. Centrum or its affiliates do not own 1% or more in the equity of this company Our sales people, dealers, traders and other professionals may provide oral or written market commentary or trading strategies to our clients that reflect opinions that are contrary to the opinions expressed herein, and our proprietary trading and investing businesses may make investment decisions that are inconsistent with the recommendations expressed herein. We may have earlier issued or may issue in future reports on the companies covered herein with recommendations/ information inconsistent or different those made in this report. In reviewing this document, you should be aware that any or all of the foregoing, among other things, may give rise to or potential conflicts of interest. We and our Group may rely on information barriers, such as "Chinese Walls" to control the flow of informaion contained in one or more areas within us, or other areas, units, groups or affiliates of Centrum. Centrum or its affiliates do not make a market in the security of the company for which this report or any report was written. Further, Centrum or its affiliates did not make a market in the subject company’s securities at the time that the research report was published.
This report is for information purposes only and this document/material should not be construed as an offer to sell or the solicitation of an offer to buy, purchase or subscribe to any securities, and neither this document nor anything contained herein shall form the basis of or be relied upon in connection with any contract or commitment whatsoever. This document does not solicit any action based on the material contained herein. It is for the general information of the clients of Centrum. Though disseminated to clients simultaneously, not all clients may receive this report at the same time. Centrum will not treat recipients as clients by virtue of their receiving this report. It does not constitute a personal recommendation or take into account the particular investment objectives, financial situations, or needs of individual clients. Similarly, this document does not have regard to the specific investment objectives, financial situation/circumstances and the particular needs of any specific person who may receive this document. The securities discussed in this report may not be suitable for all investors. The securities described herein may not be eligible for sale in all jurisdictions or to all categories of investors. The countries in which the companies mentioned in this report are organized may have restrictions on investments, voting rights or dealings in securities by nationals of other countries. The appropriateness of a particular investment or strategy will depend on an investor's individual circumstances and objectives. Persons who may receive this document should consider and independently evaluate whether it is suitable for his/ her/their particular circumstances and, if necessary, seek professional/financial advice. Any such person shall be responsible for conducting his/her/their own investigation and analysis of the information contained or referred to in this document and of evaluating the merits and risks involved in the securities forming the subject matter of this document.
The projections and forecasts described in this report were based upon a number of estimates and assumptions and are inherently subject to significant uncertainties and contingencies. Projections and forecasts are necessarily speculative in nature, and it can be expected that one or more of the estimates on which the projections and forecasts were based will not materialize or will vary significantly from actual results, and such variances will likely increase over time. All projections and forecasts described in this report have been prepared solely by the authors of this report independently of the Company. These projections and forecasts were not prepared with a view toward compliance with published guidelines or generally accented accounting principles. No independent accountants have expressed an opinion or any other form of assurance on these projections or forecasts. You should not regard the inclusion of the projections and forecasts described herein as a representation or warranty by or on behalf of the Company, Centrum, the authors of this report or any other person that these projections or forecasts or their underlying assumptions will be achieved. For these reasons, you should only consider the projections and forecasts described in this report after carefully evaluating all of the information in this report, including the assumptions underlying such projections and forecasts.
The price and value of the investments referred to in this document/material and the income from them may go down as well as up, and investors may realize losses on any investments. Past performance is not a guide for future performance. Future returns are not guaranteed and a loss of original capital may occur. Actual results may differ materially from those set forth in projections. Forward (looking statements are not predictions and may be subject to change without notice. Centrum does not provide tax advice to its clients, and all investors are strongly advised to consult regarding any potential investment. Centrum and its affiliates accept no liabilities for any loss or damage of any kind arising out of the use of this report. Foreign currencies denominated securities are subject to fluctuations in exchange rates that could have an adverse effect on the value or price of or income derived from the investment. In addition, investors in securities such as ADRs, the value of which are influenced by foreign currencies effectively assume currency risk. Certain transactions including those involving futures, options, and other derivatives as well as non(investment(grade securities give rise to substantial risk and are not suitable for all investors. Please ensure that you have read and understood the current risk disclosure documents before entering into any derivative transactions.
This report/document has been prepared by Centrum, based upon information available to the public and sources, believed to be reliable. No representation or warranty, express or implied is made that it is accurate or complete. Centrum has reviewed the report and, in so far as it includes current or historical information, it is believed to be reliable, although its accuracy and completeness cannot be guaranteed. The opinions expressed in this document/material are subject to change without notice and have no obligation to tell you when opinions or information in this report change.
This report or recommendations or information contained herein do/does not constitute or purport to constitute investment advice in publicly accessible media and should not be reproduced, transmitted or published by the recipient. The report is for the use and consumption of the recipient only. This publication may not be distributed to the public used by the public media without the express written consent of Centrum. This report or any portion hereof may not be printed, sold or distributed without the written consent of Centrum.
The distribution of this document in other jurisdictions may be restricted by law, and persons into whose possession this document comes should inform themselves about, and observe, any such restrictions. Neither Centrum nor its directors, employees, agents or representatives shall be liable for any damages whether direct or indirect, incidental, special or consequential including lost revenue or lost profits that may arise from or in connection with the use of the information.
This document does not constitute an offer or invitation to subscribe for or purchase or deal in any securities and neither this document nor anything contained herein shall form the basis of any contract or commitment whatsoever. This document is strictly confidential and is being furnished to you solely for your information, may not be distributed to the press or other media and may not be reproduced or redistributed to any other person. The distribution of this report in other jurisdictions may be restricted by law and persons into whose possession this report comes should inform themselves about, and observe any such restrictions. By accepting this report, you agree to be bound by the fore going limitations. No representation is made that this report is accurate or complete.
Footer Page 25 of 27.
26 Ratnamani Metals & Tubes
The opinions and projections expressed herein are entirely those of the author and are given as part of the normal research activity of Centrum Broking and are given as of this date and are subject to change without notice. Any opinion estimate or projection herein constitutes a view as of the date of this report and there can be no assurance that future results or events will be consistent with any such opinions, estimate or projection.
This document has not been prepared by or in conjunction with or on behalf of or at the instigation of, or by arrangement with the company or any of its directors or any other person. Information in this document must not be relied upon as having been authorized or approved by the company or its directors or any other person. Any opinions and projections contained herein are entirely those of the authors. None of the company or its directors or any other person accepts any liability whatsoever for any loss arising from any use of this document or its contents or otherwise arising in connection therewith.
Centrum and its affiliates have not managed or co(managed a public offering for the subject company in the preceding twelve months. Centrum and affiliates have not received compensation from the companies mentioned in the report during the period preceding twelve months from the date of this report for service in respect of public offerings, corporate finance, debt restructuring, investment banking or other advisory services in a merger/acquisition or some other sort of specific transaction.
As per the declarations given by them, Mr. Abhisar Jain, research analyst and and/or any of his family members do not serve as an officer, director or any way connected to the company/companies mentioned in this report. Further, as declared by him, he has not received any compensation from the above companies in the preceding twelve months. He does not hold any shares by him or through his relatives or in case if holds the shares then will not to do any transactions in the said scrip for 30 days from the date of release such report. Our entire research professionals are our employees and are paid a salary. They do not have any other material conflict of interest of the research analyst or member of which the research analyst knows of has reason to know at the time of publication of the research report or at the time of the public appearance.
While we would endeavour to update the information herein on a reasonable basis, Centrum, its associated companies, their directors and employees are under no obligation to update or keep the information current. Also, there may be regulatory, compliance or other reasons that may prevent Centrum from doing so.
Non(rated securities indicate that rating on a particular security has been suspended temporarily and such suspension is in compliance with applicable regulations and/or Centrum policies, in circumstances where Centrum is acting in an advisory capacity to this company, or any certain other circumstances.
This report is not directed to, or intended for distribution to or use by, any person or entity who is a citizen or resident of or located in any locality, state, country or other jurisdiction where such distribution, publication, availability or use would be contrary to law or regulation or which would subject Centrum Broking Limited or its group companies to any registration or licensing requirement within such jurisdiction. Specifically, this document does not constitute an offer to or solicitation to any U.S. person for the purchase or sale of any financial instrument or as an official confirmation of any transaction to any U.S. person unless otherwise stated, this message should not be construed as official confirmation of any transaction. No part of this document may be distributed in Canada or used by private customers in United Kingdom.
The information contained herein is not intended for publication or distribution or circulation in any manner whatsoever and any unauthorized reading, dissemination, distribution or copying of this communication is prohibited unless otherwise expressly authorized. Please ensure that you have read “Risk Disclosure Document for Capital Market and Derivatives Segments” as prescribed by Securities and Exchange Board of India before investing in Indian Securities Market.
Ratnamani Metals & Tubes price chart
Source: Bloomberg, Centrum Research
0
200
400
600
800
Mar-12 Sep-12 Mar-13 Sep-13 Mar-14 Sep-14 Mar-15
Ratnamani Metals & Tubes Ltd
Footer Page 26 of 27.
27 Ratnamani Metals & Tubes
Disclosure of Interest Statement
1 Business activities of Centrum Broking Limited (CBL)
Centrum Broking Limited (hereinafter referred to as “CBL”) is a registered member of NSE (Cash, F&O
and Currency Derivatives Segments), MCX-SX (Currency Derivatives Segment) and BSE (Cash
segment), Depository Participant of CDSL and a SEBI registered Portfolio Manager.
2 Details of Disciplinary History of CBL CBL has not been debarred/ suspended by SEBI or any other regulatory authority from accessing /dealing in securities market.
3 Registration status of CBL: CBL is in the process of preparing application for submission to SEBI
Ratnamani Metals
& Tubes
4 Whether Research analyst’s or relatives’ have any financial interest in the subject company and nature of such financial interest No
5 Whether Research analyst or relatives have actual / beneficial ownership of 1% or more in securities of the subject company at
the end of the month immediately preceding the date of publication of the document. No
6 Whether the research analyst or his relatives has any other material conflict of interest
No
7 Whether research analyst has received any compensation from the subject company in the past 12 months and nature of
products / services for which such compensation is received No
8 Whether the Research Analyst has received any compensation or any other benefits from the subject company or third party in
connection with the research report No
9 Whether Research Analysts has served as an officer, director or employee of the subject company No
10 Whether the Research Analyst has been engaged in market making activity of the subject company. No
Rating Criteria
Rating Market cap < Rs20bn Market cap > Rs20bn but < 100bn Market cap > Rs100bn
Buy Upside > 25% Upside > 20% Upside > 15%
Hold Upside between -25% to +25% Upside between -20% to +20% Upside between -15% to +15%
Sell Downside > 25% Downside > 20% Downside > 15%
Member (NSE and BSE)
Regn No.:
CAPITAL MARKET SEBI REGN. NO.: BSE: INB011454239 CAPITAL MARKET SEBI REGN. NO.: NSE: INB231454233
DERIVATIVES SEBI REGN. NO.: NSE: INF231454233 (TRADING & CLEARING MEMBER)