38
Raw material current price trends and impact on the food industry Brian Smith, Data Director Food Matters Live 19 November 2014
Raw material current price trends and impact on the food industry
Brian Smith, Data Director
Food Matters Live
19 November 2014

Content
Setting the scene
Recent trends
Key food raw materials
Key price drivers
Product model price trends – 1, 3, 5 years
Long term food inflation rates
2015 outlook

Volatility and insight
“The price of the commodity may go up, or it may go down,
however,
there is strong potential that the price might stay the same”
Vlad Peksa (1982), Founder of Mintec
“Data and information are not knowledge;
they are like any raw materials,
requiring some intervention and processing to make them useful”
Ron Bennett, St Thomas University Minneapolis

Mintec
Founded in 1982 to “help the supply chain buy better”
Family owned, UK based, global client base.
To provide commodity/raw materials market intelligence, training and support services
Procurement professionals
Retail &
wholesale
Food
manufacturer
Food
service
Core client base

Sample markets and categories covered
Grains and cereals Sugar Meat and livestock Dairy markets
Vegetable oils Oilseeds Meals and proteins Feed materials
Pulses Cocoa Fibres Economic data
Beans Coffee Ingredients Fruit and vegetables
Potatoes Tea Exchange rates Food additives
Solvents Minor metals Electronics Waxes
Industrial Precious metals Engineering Crude drugs
Petrochemicals Foundry ingots Thermosets Essential oils
Crude and fuel Ferrous scrap Recycled resins Fragrances
Gas and coal Non ferrous Plastic Timber
Energy indexes World steel Paper and board Currencies
Fertilisers Noble and bulk Pulp Oleoresins
Gum Metal ores Minerals Freight and shipping
Fibres Textiles Timber Shipping costs
Bulk chemicals Base metals Thermoplastics Rubber
Over 20,000 individual series

Brian Smith Qualifications;
- MBA in Retailing
- BSc (Hons) in Biochemistry
- Diplomas in Health & Safety and Food Hygiene
Experience;
- c25 years commercial and operational experience
- FOOD: producer, manufacturer, wholesale, retail and service industries
- domestic, duty free/travel retail & international markets
- supplier & category management (procurement & trading)
- supply chain and stock management (value chain)
- strategic business development and turnaround (operational excellence)
- brand & trade marketing (vision and value)
- Previously a client of Mintec

Recent headlines
The FAO food price index falls for the sixth consecutive month FAO, 09.10.14
Salmon prices drop as Russian ban hits Grocer 27/9/14

Current rate of UK food inflation
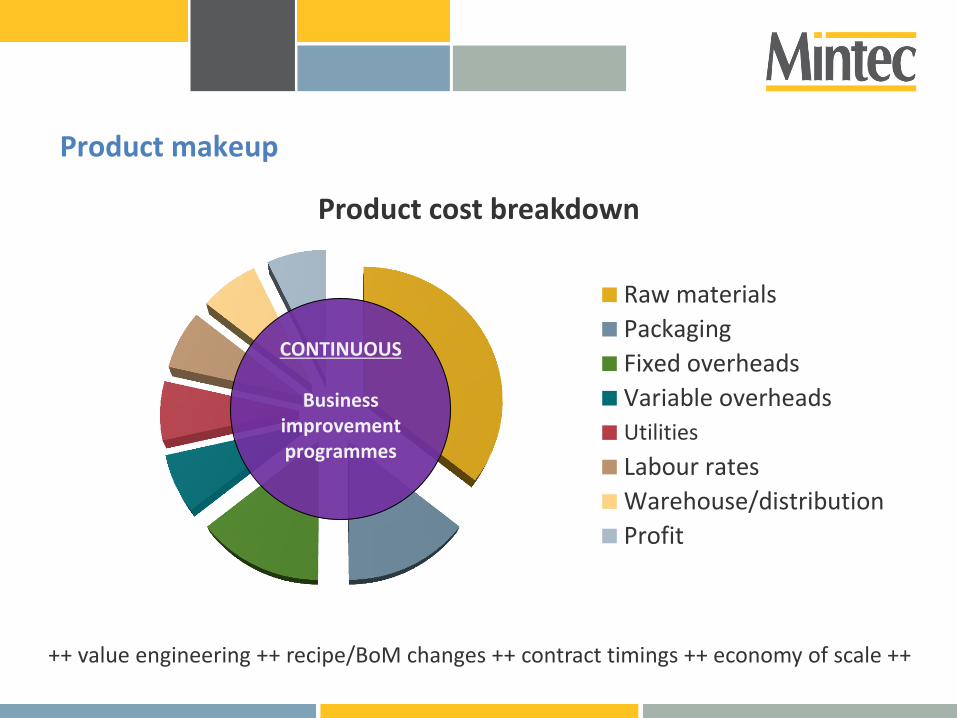
Product makeup
Product cost breakdown
Raw materials
Packaging
Fixed overheads
Variable overheads
Utilities
Labour rates
Warehouse/distribution
Profit
CONTINUOUS
Business improvement programmes
++ value engineering ++ recipe/BoM changes ++ contract timings ++ economy of scale ++

Raw material price changes over the last 12 months Food Non-Food
Pepper IN +74% Sulphur CA +138%
Coffee Arabica ICE NY +58% Nickel LME +30%
Coconut Oil Rotterdam NL +33% Zinc LME +21%
Beef BR +28% LLDPE LME +14%
Cocoa Beans LIFFE +24% Aluminium LME +9%
Cocoa Butter London +21% NBSK Pulp EU +8%
Honey EU +18% PP EU +7%
Eggs NL +16% Tin LME +3%
Wheat Milling LIFFE -7% PVC EU +1%
Durum Wheat IT -10% LDPE EU +1%
Cheddar UK -12% Testliner EU -1%
Sunflower Oil Rotterdam NL -12% Brent Crude Oil London -4%
Beef EU -12% Diesel NW EU -7%
Pigmeat EU -13% Steel Coil EU -8%
Rapeseed Oil Rotterdam NL -14% Kraftliner EU -8%
SMP EU (UK -4%) -17% Natural Gas ICE UK -15%
Butter EU -18% Electricity UK -26%
Whey Powder EU -19% Cotton ICE NY -26%
Cocoa Powder London -36% Electricity EU -30%
Potato Market NL (UK -16%) -69% Natural Gas Bacton -36%
Source: Mintec
September 2014

Key raw materials that make up FAO food price index
Global value of all food raw materials c$5 trillion per annum
Change
%
Change
%
Change
%
Value $'000Production
Metric tonne1 year 5 years 10 years
1 Rice, paddy 186,667,648 722,599,583 -2% -5% N/A
2 Cow's milk, whole, fresh 183,583,111 614,578,723 -27% 42% N/A
3 Cattle, meat 170,272,001 63,031,582 -10% 19% N/A
4 Pig, meat 167,007,794 108,641,257 -25% -4% 17%
5 Chicken, meat 128,199,164 90,001,779 -10% -2% 39%
6 Wheat 84,281,536 701,395,334 -24% 15% 74%
7 Soybeans 65,903,601 262,037,569 -23% 5% 113%
8 Tomatoes 58,223,483 159,347,031 -14% -19% 39%
9 Sugar cane 56,903,836 1,800,377,642 -15% -25% 110%
10 Maize (Corn) 55,478,433 885,289,935 -22% 0% 53%
Top 10 Total 1,156,520,607 5,407,300,435
%age of FAO food price index 64% 68%
2012 FAO Figures
Commodity/raw materialRank
-16% 7% 54%*

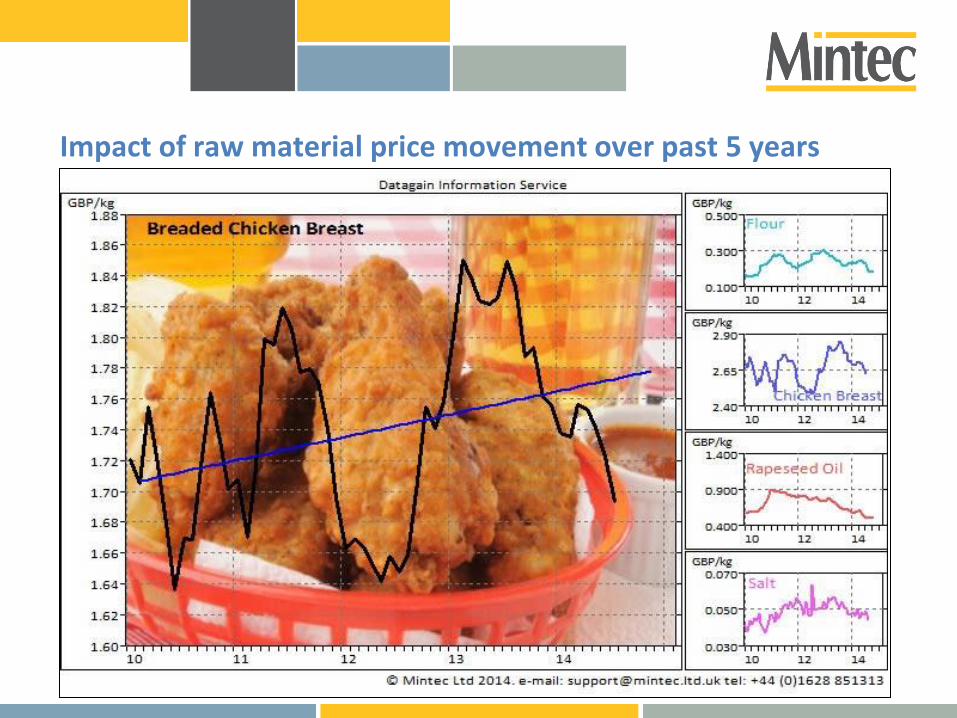
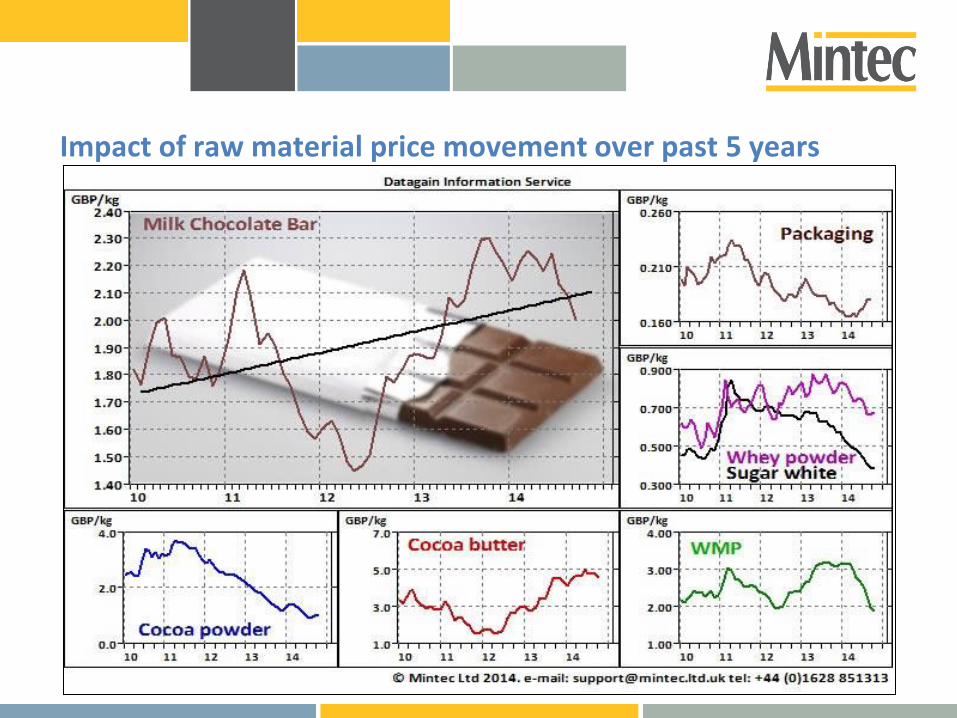
Raw material price trend versus UK food inflation
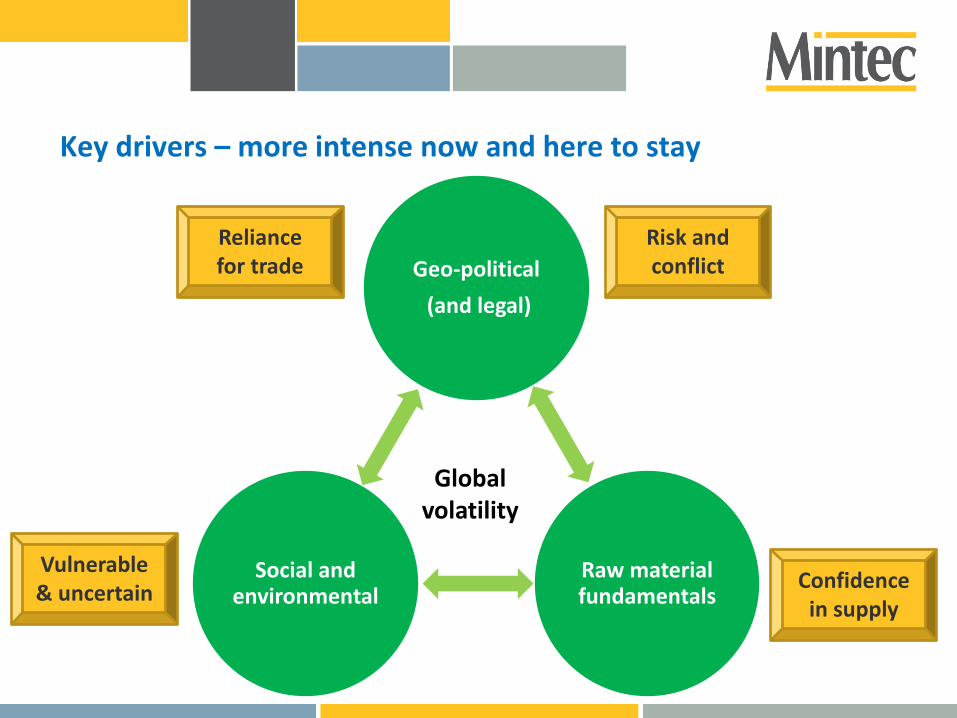
Key drivers – more intense now and here to stay
Geo-political
(and legal)
Raw material fundamentals
Social and environmental
Global volatility
Vulnerable & uncertain
Reliance for trade
Confidence in supply
Risk and conflict

Selected current price drivers impacting food industry
Geo-political/legal
- Growing tensions, sanctions and bans between Russia and EU/US
- Removal of EU milk quota scheme
Environmental/Social
- Favourable and unfavourable climate conditions
- Emerging markets, especially BRIC nations
- Ebola
- Market speculation
Fundamentals
- High ending stocks and consecutive high harvests: grains/oilseeds
- Good stocks and production: crude oil
- Globally tight stock and limited production vs demand: meats
- Demand growing ahead of production: cocoa

Manufacturing PMI
UK: Current PMI = 57.0
Continued growth
Concern that recovery may be losing steam
EU: Current PMI = 52.2
Improvement on recent declining trend
China: Current PMI = 50.4
Improvement on recent declining trend
US: Current PMI = 57.4
Recovery continues, but at slower pace
Unemployment Rate
UK: Down to 6.2%* (below 2m),
30.8m people in work
EU: Rate remains at 11.5%*
China: Stable at 4.1% in September
US: The rate has fallen below 6% for the first time since 2009, reaching 5.9% in September
*August 2014 figures

Key currency movements
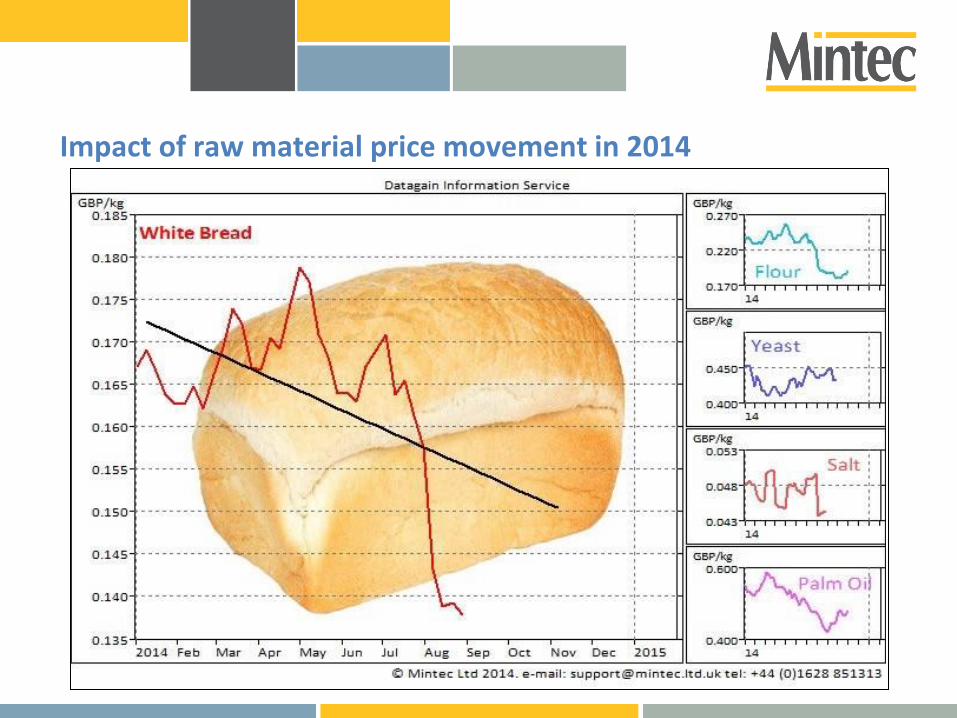
Impact of raw material price movement in 2014

Impact of raw material price movement in 2014

Impact of raw material price movement in 2014

Impact of raw material price movement in 2014
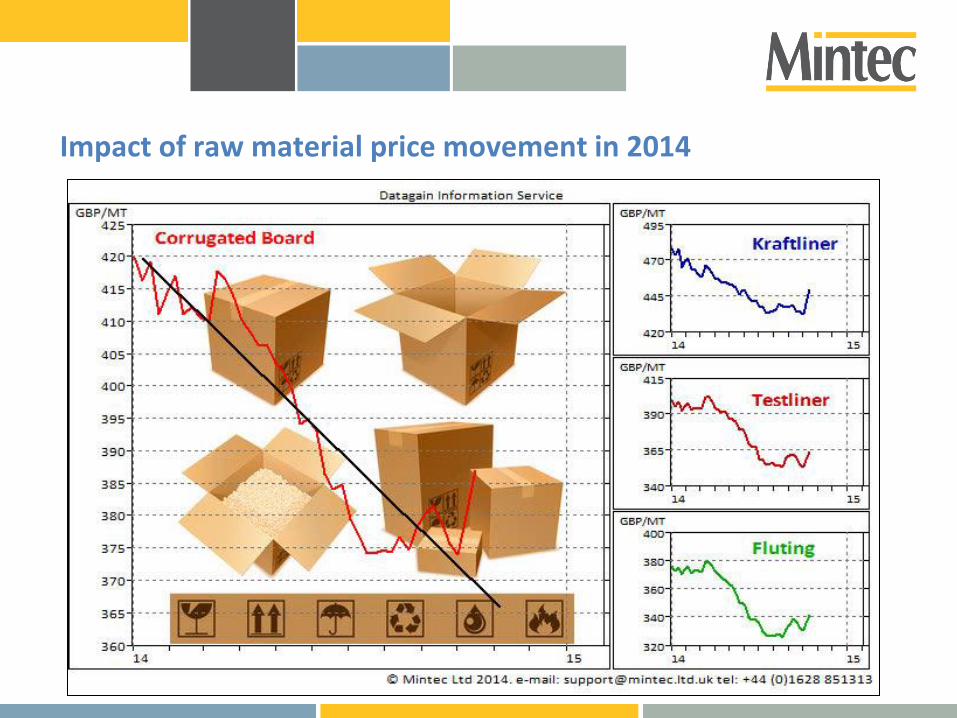
Impact of raw material price movement in 2014

Impact of raw material price movement in 2014

Impact of raw material price movement over past 3 years

Impact of raw material price movement over past 3 years
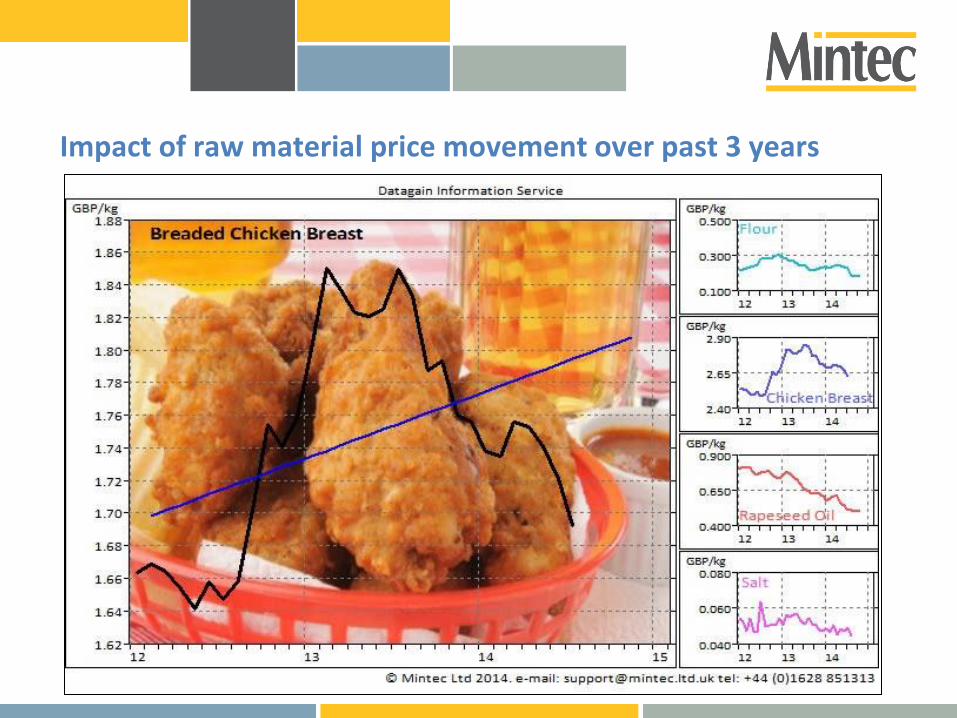
Impact of raw material price movement over past 3 years

Impact of raw material price movement over past 3 years

Impact of raw material price movement over past 3 years

Impact of raw material price movement over past 3 years
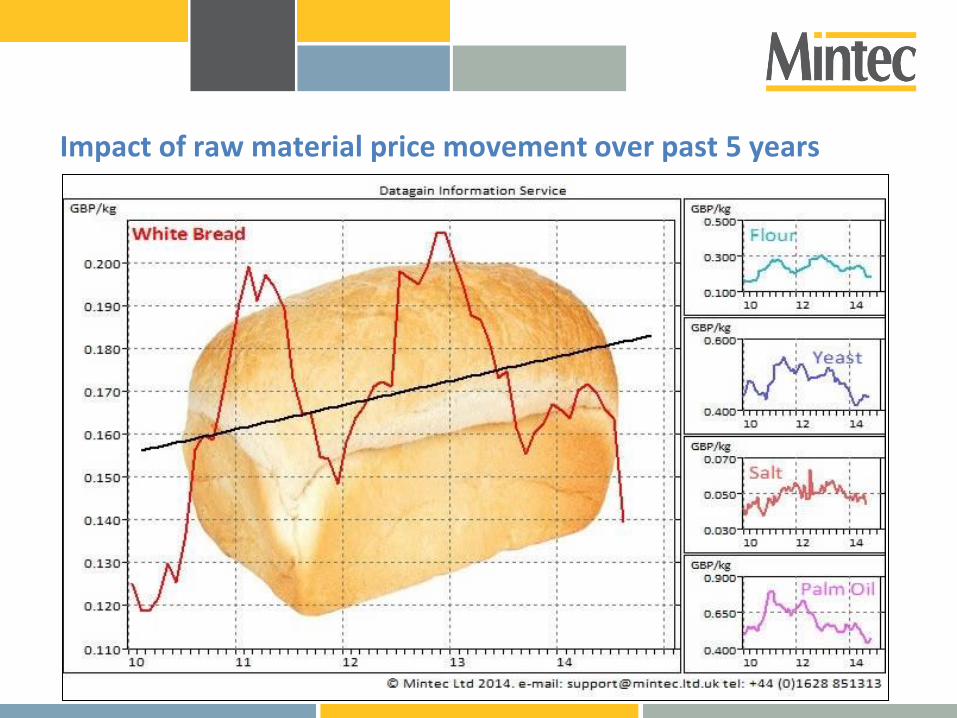
Impact of raw material price movement over past 5 years
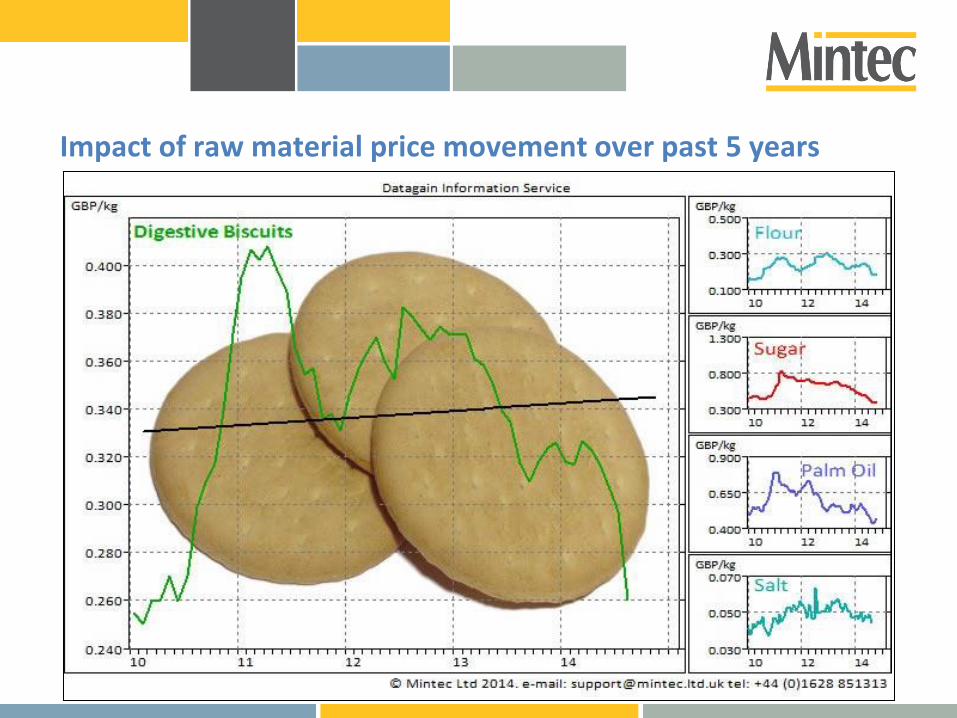
Impact of raw material price movement over past 5 years
Impact of raw material price movement over past 5 years
Impact of raw material price movement over past 5 years

Impact of raw material price movement over past 5 years

Impact of raw material price movement over past 5 years
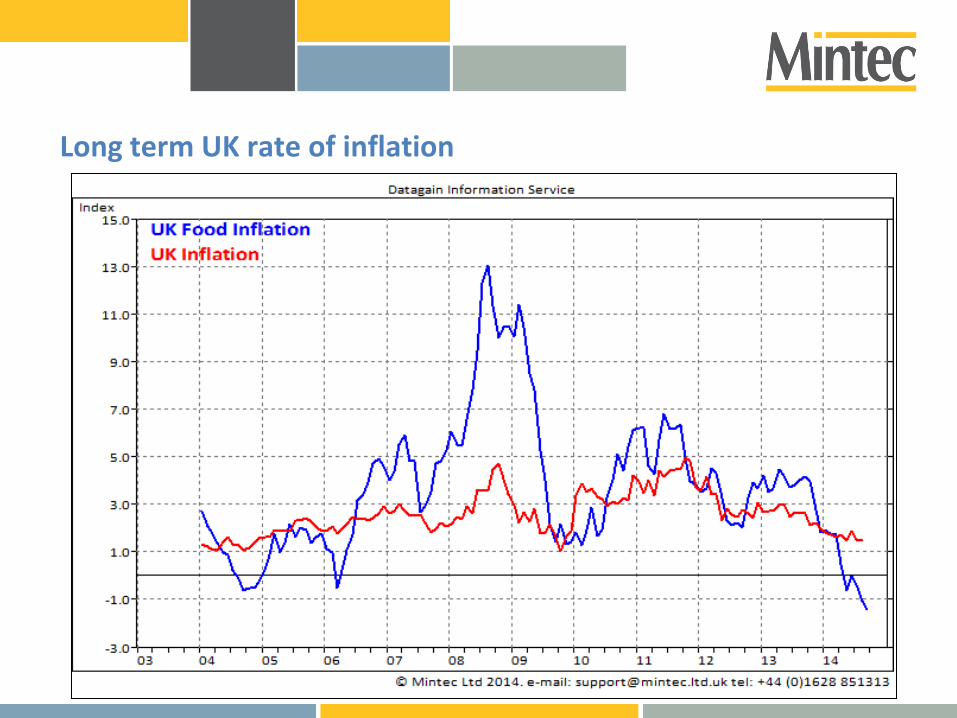
Long term UK rate of inflation

Outlook for 2015
Growth forecasts: EU – 1.5% UK – 2.0% Unemployment: EU – 10.4% UK – 6.5%
Removal of dairy quotas
Low feed costs
Re-distribution of
export markets (due to Russia)
*The Economist

Opportunities
- Crop stocks & size of new harvests
- Russian import ban
- EU legislation changes
Risks
- Speculation and noise in market
- Climate – El-Nino (?)
- Disease – Ebola (?)
Overall an increased volatility due to;
- Climate and disease issues
- Continued rise in global demand
- Russian import ban
Outlook for 2015
Raw material probable price movements
Opportunities in price
- Grains and most edible oils
- Crude oil and energy
- Dairy market
- Potatoes and onions
Marginal movers
- Plastics and paper packaging
- Sugar
Risks to price – requires close monitoring
- Most meats and wild fish
- Cocoa
- Coffee
- Tomatoes and olives (including olive oil)

Mintec-Limited /company/mintec-ltd @MintecLimited
Register on our website for the Mintec Daily News: www.mintecglobal.com/register
Thank you for listening
Come see us on stand 224
www.mintecglobal.com


