14
Tom Hellman, VP Drilling & Completions March 6, 2017 Raymond James Institutional Investors Conference

Tom Hellman, VP Drilling & Completions
March 6, 2017
Raymond James Institutional Investors Conference

(MAY 2014 – MAY 2016)
Bias for Action
WE BUILT A BRAND NEW COMPANY
2
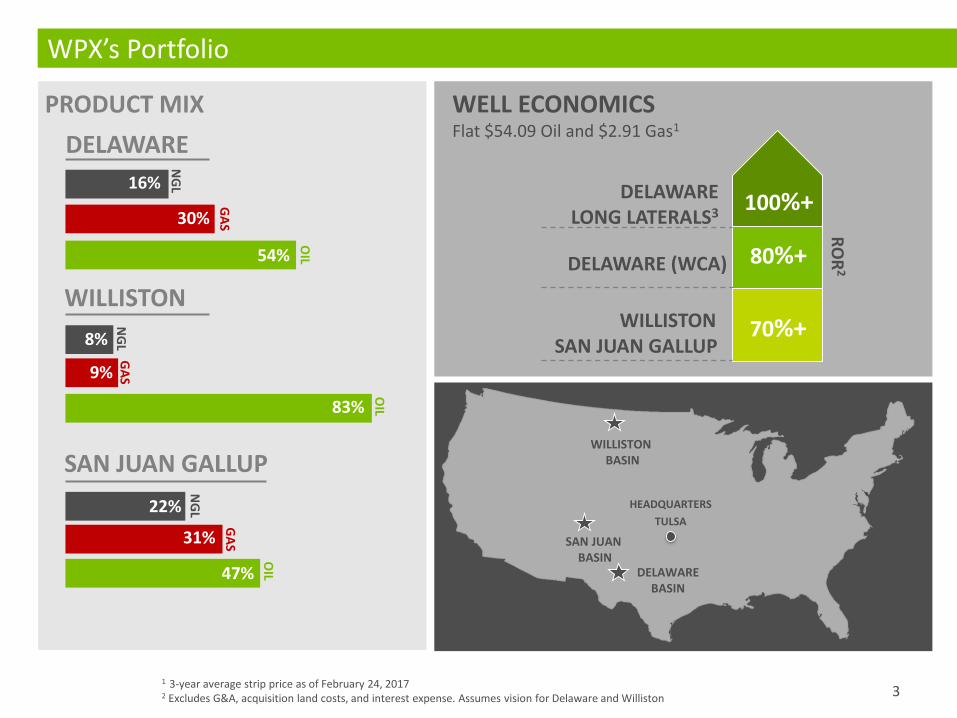
WPX’s Portfolio
DELAWARE
54%
30%
GA
S
OIL 80%+DELAWARE (WCA)
WILLISTONSAN JUAN GALLUP
RO
R2
WELL ECONOMICSFlat $54.09 Oil and $2.91 Gas1
WILLISTON BASIN
DELAWARE BASIN
SAN JUANBASIN
1 3-year average strip price as of February 24, 20172 Excludes G&A, acquisition land costs, and interest expense. Assumes vision for Delaware and Williston
70%+
100%+DELAWARE LONG LATERALS3
HEADQUARTERS
TULSA
NG
L16%
WILLISTON
83%
9%
GA
S
OIL
NG
L8%
SAN JUAN GALLUP
47%
31%
GA
S
NG
L22%
OIL
3
PRODUCT MIX

Panther Acquisition Enhances Sustained Growth Outlook
ASSET QUALITY SUPPORTS RAPID GROWTH ASSET QUALITY SUPPORTS RAPID GROWTH
Assumes 2017 WTI $50Bbl /NYMEX $2.75Mcf and 2018-2020 WTI $55Bbl /NYMEX $3.00Mcf.
OIL
MB
BL/
D
UPDATED PRO FORMA RANGE
► Free cash-flow positive by year-end 2018
► Assumes modest 1-3 rig additions per year
► 30% oil growth in 2017
► 55% oil growth in 2018
4
Panther acquisition enhances growth strategy
0
20
40
60
80
100
120
140
160
2016 2017 2018 2019 2020
$0
$500
$1,000
$1,500
$2,000
$2,500
2016 2017 2018 2019 2020
C A G R : 3 0 % - 4 0 % C A G R : 3 0 % - 4 0 %
MIL
LIO
NS
($)
PREVIOUS FORECAST UPDATED PRO FORMA RANGE PREVIOUS FORECAST

Expanding WPX’s World-Class Delaware Position
5
PANTHER ACQUISITION OVERVIEW
► 18,000+ acres in core of Delaware
► 920 gross locations, including 150+ long lateral locations
► Significant current production of ~6,500 Boe/d (55% oil)
► Maintain Panther’s current 2 rig program
► Valuation primarily supported on 3 zones with upside in 5
additional zones
► Expected to close in late March
N E W M E X I C O
T E X A S
CULBERSON
LEA
EDDY
WARD
REEVES
LOVING
PECOS
WINKLER
WPX OPERATED ACREAGE
PANTHER ACREAGE
SELF-FUNDING DEVELOPMENT
2 rig program funded with operating cashflows
DEEP INVENTORY OF CORE DELAWARE
Resource supports sustained growth
HIGH QUALITY ROCK
Multiple stacked pay intervals with significant upside
ACCRETIVE TO CASHFLOWS AND NAV
Accretive to shareholders 2017 and beyond
BENEFITS

THICK Hydrocarbon Stack Across Entire Acreage Position
A STATE LINE LOG B EAST TYPE LOG C CENTRAL TYPE LOG D SOUTH TYPE LOGN E W M E X I C O
T E X A S
WARD
LEAEDDY
REEVES
LOVING WINKLERA
B
C
D
DE-RISKED
UPSIDE POTENTIAL
De-risked pay section across acreage with
substantial UPSIDE
WPX OPERATED ACREAGE ACQUIRED ACREAGE
6

Delaware Basin: Delineation of the Wolfcamp
N E W M E X I C O
T E X A S
CULBERSON
LEA
EDDY
LOVING
WPX OPERATED ACREAGE
PANTHER ACREAGE
D
D
XY
XY
C-STATE 16-1HIP 30: 1,635 BOE/D (65% OIL)90 DAY CUM: 114,338 BOE
E. PECOS FED COM 22-14HIP 30: 1,736 BOE/D (30% OIL)90 DAY CUM: 139,336 BOE
DELINEATING WOLFCAMP ACROSS POSITION
► WOLFCAMP XY-PECOS STATE 46-6H► Lateral length: ~4,800 ft
► Proppant (#/ft): ~1,750
► Tracking in-line with WCA 1,000 MBOE type curve after 45 days
660’330’
WOLFCAMP B
LOWER WOLFCAMP A
UPPER WOLFCAMP A
WOLFCAMP X/Y
1 MILE
35
0 F
T
CBR SPACING TEST UNDERWAY
► PURPOSE OF TEST
► Validate 16 well U/L Wolfcamp A spacing
► Understand future infrastructure needs
PECOS STATE 46-6HIP 30: 1,780 BOE/D (50% OIL)
D
LINDSAY 16-6HIP 30: 1,434 BOE/D (18% OIL)90 DAY CUM: 119,047 BOE
PECOS STATE 46-5HIP 30: 1,628 BOE/D (22% OIL)
REEVES
7
► Utilized diverter
► Hybrid completion design
► Engineered completions
► WOLFCAMP D-PECOS STATE 46-5H► Lateral length: ~4,850 ft
► Proppant (#/ft): ~2,750
► Currently producing with 3,800 psi flowing tubing pressure (2-17)
► UPDATE ON CBR
► Expected first sales end of March
► 16 day record well spud-to-rig release
► Encouraging DFIT results
► Utilized diverter
► Hybrid completion design
► Engineered completions
Note: Well production data is on a 3-stream basis

Williston Basin: Strong, Consistent Results
1 Spud-to-rig release for a 2-mile lateral2 Public data based on production from wells completed in 2016
Peers include AXA,BURLINGTON RESOURCES,EOG,ERF,HESS,LIBERTY RESOURCE,MRO,NFX,OAS,PETRO-HUNT,QEP,SM,STL,TPLM,WLL,XTO
► 39% oil growth 4Q’16 vs 3Q’16
► 4Q production 28.8 MBOE/d
► Set new drilling record of 11.7 days1
► Completed DUC inventory
► Current total well cost $5.5MM
► 14 wells on 1st sales during 4Q
► 6 Middle Bakken and 8 Three forks wells
8
-
20,000
40,000
60,000
80,000
100,000
120,000
140,000
160,000
180,000
WPX PEER 1 PEER 2 PEER 3 PEER 4 PEER 5 PEER 6 PEER 7 PEER 8 PEER 9
180 DAYS CUM OIL PRODUCTION FOR 2016 NEW WELLS2
-
10,000
20,000
30,000
40,000
50,000
60,000
70,000
80,000
90,000
100,00090 DAYS CUM OIL PRODUCTION FOR 2016 NEW WELLS2
WPX PEER 1 PEER 2 PEER 3 PEER 4 PEER 5 PEER 6 PEER 7 PEER 8 PEER 9
WILLISTON HIGHLIGHTS
#1 PRODUCERON CUMULATIVE OIL BASIS 90 DAYS/180 DAYS2

San Juan Basin: Continued Strong Well Results
12015 well performance based on 1 mile laterals, 2016 based on average of 7,200’ laterals
CONTINUING TO RAISE THE BAR
► 21% oil growth 4Q’16 vs 3Q’16
► Set new basin record
► Drilled 1.5 mile lateral in 5.8 days
► Strong performance on 6-well pad
► Cumulative 180-day production: +1.0 MMBOE
► Average day: ~1,000 BOE/D per well (70% oil)
► Average lateral length: 7,250 ft.
► Average D&C cost: ~$4.1MM
► Focused on West Lybrook in 2017
► New rig spud first well 12/31/20160
50
100
150
200
250
300
0 20 40 60 80 100 120 140 160 180 200C
um
Pro
du
ctio
n M
BO
E
Days of Production
6-WELL
PAD
2016
GALLUP WELLS
CURRENT
650 MBOE65% IN EUR SINCE 20151
2016 SAN JUAN GALLUP WELLS
INCREASE
9Note: Well production data is on a 3-stream basis

10
Contracted Service Cost Mitigates Potential Inflation
Contracts in Place for 2017
Services Exposed to Spot Market
Note: D&C components based on latest blended AFE (Williston, San Juan, Delaware)
2017 D&C COST BREAKDOWN
of D&C costs are contracted through 2017
► Majority of services exposed to inflation are contracted
► Focused on securing services since 2Q 2016 to prepare
for activity ramp
► Some contracts go through 2018, others have options
to extend past 2017
► ~90% of D&C costs go through Supply Chain Mgmt.
• Sand• Stimulation Services• Drilling Rigs• Tubulars/Wellhead• Cementing Material and Services• Water
• Fluids/Cuttings/Solids Control• Directional Equipment & Services• Chemicals• Other (Completions)• Other (Drilling)

Foundation in Place for Enhancing and Accelerating Value
► POSITIONED
► PRUDENT
► FLEXIBLE
► DISCIPL INED
WILLISTON BASIN
DELAWARE BASIN
SAN JUAN BASIN
HEADQUARTERS: TULSA
11

Disclaimer
The information contained in this summary has been prepared to assist you in making your own evaluation of the Company and does not purport to contain all of the information you may consider important in deciding whether to invest in shares of the Company’s common stock. In all cases, it is your obligation to conduct your own due diligence. All information contained herein, including any estimates or projections, is based upon information provided by the Company. Any estimates or projections with respect to future performance have been provided to assist you in your evaluation but should not be relied upon as an accurate representation of future results. No persons have been authorized to make any representations other than those contained in this summary, and if given or made, such representations should not be considered as authorized.
Certain statements, estimates and financial information contained in this summary constitute forward-looking statements or information. Such forward-looking statements or information involve known and unknown risks and uncertainties that could cause actual events or results to differ materially from the results implied or expressed in such forward-looking statements or information. While presented with numerical specificity, certain forward-looking statements or information are based (1) upon assumptions that are inherently subject to significant business, economic, regulatory, environmental, seasonal, competitive uncertainties, contingencies and risks including, without limitation, the ability to obtain debt and equity financings, capital costs, construction costs, well production performance, operating costs, commodity pricing, differentials, royalty structures, field upgrading technology, and other known and unknown risks, all of which are difficult to predict and many of which are beyond the Company's control, and (2) upon assumptions with respect to future business decisions that are subject to change.
There can be no assurance that the results implied or expressed in such forward-looking statements or information or the underlying assumptions will be realized and that actual results of operations or future events will not be materially different from the results implied or expressed in such forward-looking statements or information. Under no circumstances should the inclusion of the forward-looking statements or information be regarded as a representation, undertaking, warranty or prediction by the Company or any other person with respect to the accuracy thereof or the accuracy of the underlying assumptions, or that the Company will achieve or is likely to achieve any particular results. The forward-looking statements or information are made as of the date hereof and the Company disclaims any intent or obligation to update publicly or to revise any of the forward-looking statements or information, whether as a result of new information, future events or otherwise. Recipients are cautioned that forward-looking statements or information are not guarantees of futureperformance and, accordingly, recipients are expressly cautioned not to put undue reliance on forward-looking statements or information due to the inherent uncertainty therein.
12

Reserves Disclaimer
The SEC requires oil and gas companies, in filings made with the SEC, to disclose proved reserves, which are those quantities of oil and gas, which, by analysis of geoscience and engineering data, can be estimated with reasonable certainty to be economically producible – from a given date forward, from known reservoirs, under existing economic conditions, operating methods, and governmental regulations. The SEC permits the optional disclosure of probable and possible reserves. We have elected to use in this presentation “probable” reserves and “possible” reserves, excluding their valuation. The SEC defines “probable” reserves as “those additional reserves that are less certain to be recovered than proved reserves but which, together with proved reserves, are as likely as not to be recovered.” The SEC defines “possible” reserves as “those additional reserves that are less certain to be recovered than probable reserves.” The Company has applied these definitions in estimating probable and possible reserves. Statements of reserves are only estimates and may not correspond to the ultimate quantities of oil and gas recovered. Any reserve estimates provided in this presentation that are not specifically designated as being estimates of proved reserves may include estimated reserves not necessarily calculated in accordance with, or contemplated by, the SEC’s reserves reporting guidelines. Investors are urged to consider closely the disclosure regarding our business that may be accessed through the SEC’s website at www.sec.gov.
The SEC’s rules prohibit us from filing resource estimates. Our resource estimations include estimates of hydrocarbon quantities for (i) new areas for which we do not have sufficient information to date to classify as proved, probable or even possible reserves, (ii) other areas to take into account the low level of certainty of recovery of the resources and (iii) uneconomic proved, probable or possible reserves. Resource estimates do not take into account the certainty of resource recovery and are therefore not indicative of the expected future recovery and should not be relied upon. Resource estimates might never be recovered and are contingent on exploration success, technical improvements in drilling access, commerciality and other factors.
13

WPX Non-GAAP Disclaimer
This presentation may include certain financial measures, including adjusted EBITDAX (earnings before interest, taxes, depreciation, depletion, amortization and exploration expenses), that are non-GAAP financial measures as defined under the rules of the Securities and Exchange Commission.
This presentation is accompanied by a reconciliation of these non-GAAP financial measures to their nearest GAAP financial measures. Management uses these financial measures because they are widely accepted financial indicators used by investors to compare a company’s performance. Management believes that these measures provide investors an enhanced perspective of the operating performance of the company and aid investor understanding. Management also believes that these non-GAAP measures provide useful information regarding our ability to meet future debt service, capital expenditures and working capital requirements. These non-GAAP financial measures should not be considered in isolation or as substitutes for a measure of performance prepared in accordance with United States generally accepted accounting principles.
14


