33
A Practical Guide for Getting your RBM Program Up and Running Thursday 21 st January 11am ET / 4pm GTM
| Date post: | 18-Jan-2017 |
| Category: |
Health & Medicine |
| Upload: | tri-the-risk-based-monitoring-company |
| View: | 171 times |
| Download: | 0 times |

A Practical Guide for
Getting your RBM
Program Up and
Running
Thursday 21st January 11am ET / 4pm GTM

Getting started with risk assessment
Identifying and designing risk
indicators
Quality oversight and management
Risk Mitigation
Practical application of technology to
support all stages of RBM
Illustrate the process of using the
outputs of protocol risk assessment to
identify protocol risk indicators
Illustrate the process of designing
protocol risk indicators
Explore the characteristics of good
indicators of site quality risk
Explore the practical application of
surrogate risk indicators in RBM
Duncan Hall, CEO, Triumph Research Intelligence
Duncan is the founder of both Triumph Consultancy and Triumph Research Intelligence which have been operating for 14 and 3 years respectively. He has over 15 years of industry experience and has run strategic and operational systems implementation and optimization projects for multiple CRO and pharma companies.

The Risk-basedmonitoring company
Founded in 2013
Sister company to Triumph Consultancy
Entirely Quality Oversight and RBM focused
Creators of OPRA RBM platform
One complete solution
Implementation services
Study specific services
Technology
Hosting

General Consultant14%
Interested Party17%
Expecting to be part of team26%
Part of RBM team43%
Audience Breakdown

Presentation Synopsis
• Your RBM goals and aspirations
• Getting started with risk assessment
• Identifying / designing risk indicators
• Quality oversight and management
• Risk mitigation
• Application of technology

Presentation Synopsis
• Your RBM goals and aspirations
• Getting started with risk assessment
• Identifying / designing risk indicators
• Quality oversight and management
• Risk mitigation
• Application of technology

Where do we start and where to
we want to get to?
Risk assessment
Risk reductionRisk
identification/ management
Quality oversight evidence
Informed monitoring
Adaptive monitoring
RBM Maturity
Protocol assessment
and documentation of
risks and risk categories
Mitigating risk through
protocol design and early
risk reduction actions
KRIs and thresholds for
risk identification and
management plans
Centralized evidence of risk
measurement and activity over
time – traceability to risk
assessment
Using information from RBM system to inform
monitor what patients and data to focus on,
and other underlying issues with site
Using data to drive
monitoring patterns
and efficiency
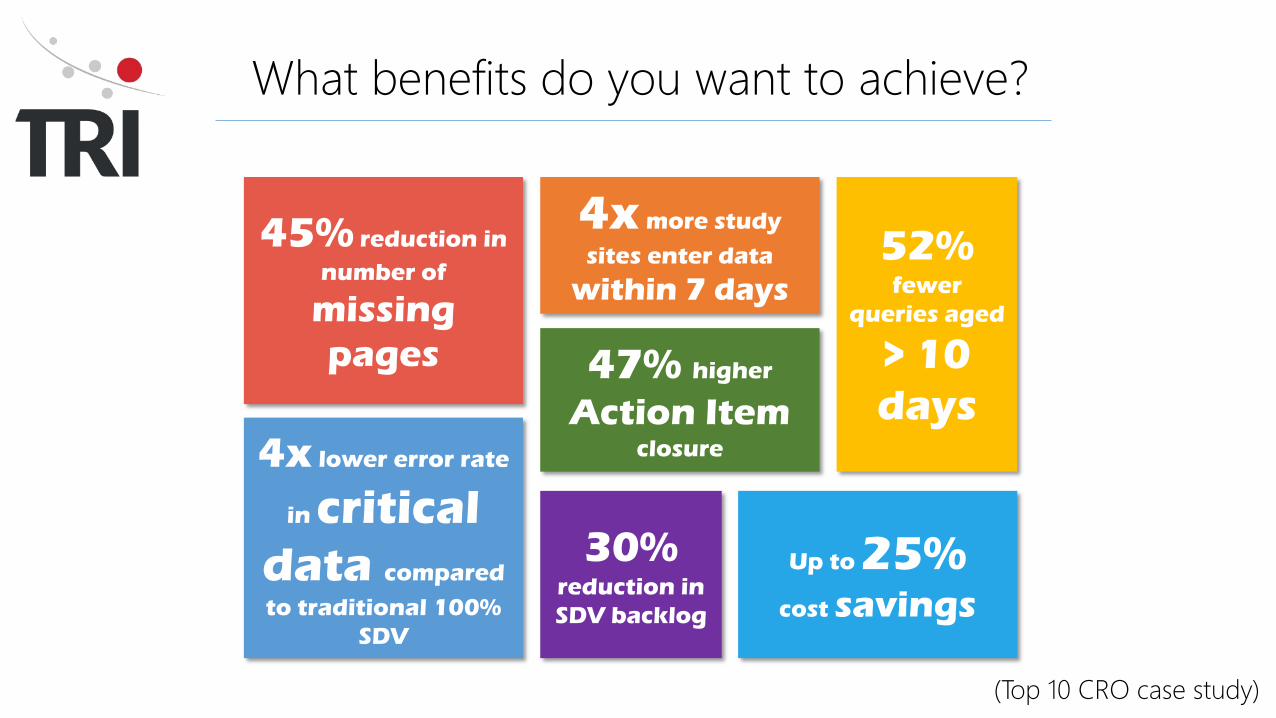
(Top 10 CRO case study)
4x lower error rate
in critical
data compared
to traditional 100%
SDV
45% reduction in
number of
missing
pages 47% higher
Action Item closure
30%reduction in
SDV backlog
4x more study
sites enter data
within 7 days
52% fewer
queries aged
> 10
days
Up to 25%cost savings
What benefits do you want to achieve?

Audience Poll
What are you expecting to get from RBM?
1 - Meet the regulatory requirements for risk
assessment and quality oversight
2 – The above plus improvements in quality
and safety
3 – The above plus efficiency / cost saving

Presentation Synopsis
• Your RBM goals and aspirations
• Getting started with risk assessment
• Identifying / designing risk indicators
• Quality oversight and management
• Risk mitigation
• Application of technology

e.g. procedures driving data related to primary objectives
e.g. assessments which don’t relate to core objectives
Which Risks Do We Manage?
Evaluate Protocol Risks
Structural Risks
Essential Risks
Revise Protocol
Plan to manage and
mitigate

What is the process of risk assessment?
Categorized questions
Core KRIs
Pre-defined relationship
Risk Scores
Individual Risk
Category
Protocol
Critical data / processes
Risk management
Summary
Risk Assessment Tool / Engine
KRIs
Thresholds
Category
Hierarchy
Study plans
Data / process monitoring plan

The ‘Goldilocks’ Test
How many
indicators
should I use?0 10 15 20 30+
Not enough information ‘Just right’ Too much noise

Presentation Synopsis
• Your RBM goals and aspirations
• Getting started with risk assessment
• Identifying / designing risk indicators
• Quality oversight and management
• Risk mitigation
• Application of technology

Something for Nothing! – Top 10 KRIs
CATEGORY – This tells us the indicator category, and allows us to group indicators according to purpose
DESCRIPTION – How is the KRI derived?
DATA REQUIREMENTS – What data is needed for the KRI and how are the calculations performed?
WHAT ARE WE LOOKING FOR? – What is the KRI telling us in real world terms?
ADDITIONAL COMMENTS – Is there anything else we think you should know?
COMPANION KRIs – Are there any other KRIs we recommend using in conjunction with this one?
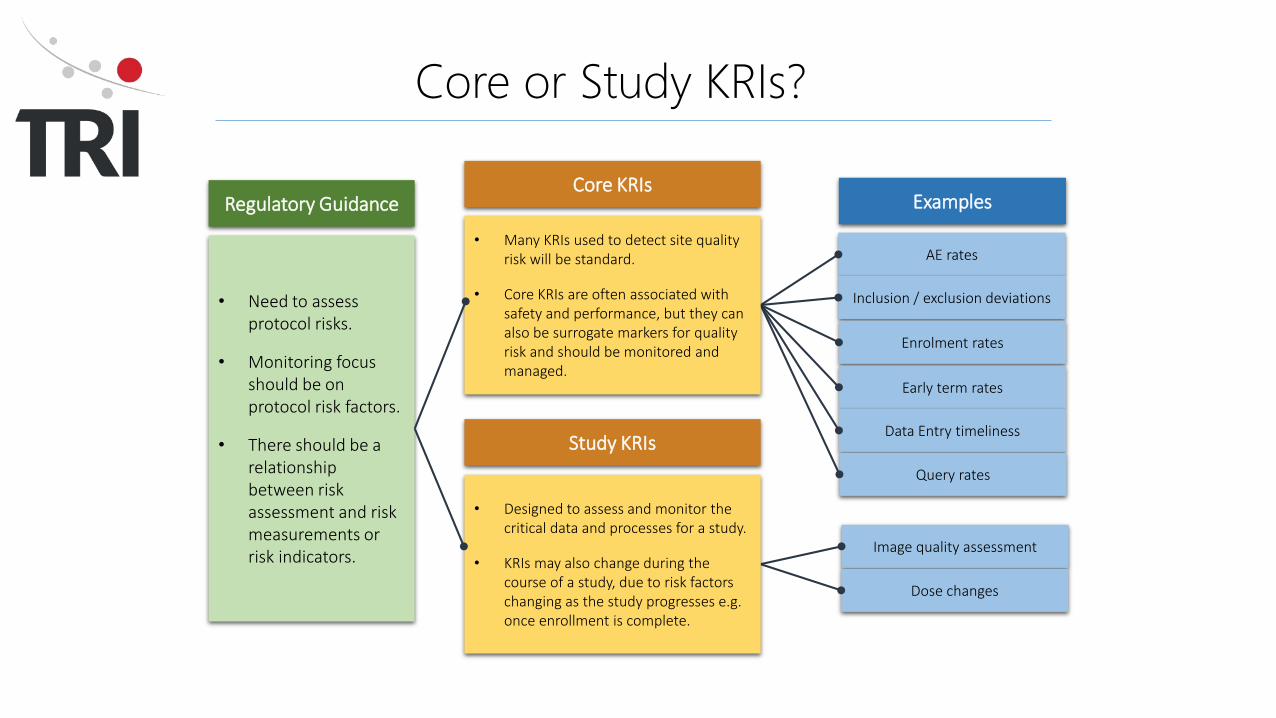
Regulatory Guidance
• Need to assess protocol risks.
• Monitoring focus should be on protocol risk factors.
• There should be a relationship between risk assessment and risk measurements or risk indicators.
Examples
AE rates
Inclusion / exclusion deviations
Enrolment rates
Early term rates
Data Entry timeliness
Query rates
Image quality assessment
Dose changes
Core KRIs
• Many KRIs used to detect site quality risk will be standard.
• Core KRIs are often associated with safety and performance, but they can also be surrogate markers for quality risk and should be monitored and managed.
Study KRIs
• Designed to assess and monitor the critical data and processes for a study.
• KRIs may also change during the course of a study, due to risk factors changing as the study progresses e.g. once enrollment is complete.
Core or Study KRIs?

Let’s work through designing a quality indicator to assess risk around the critical data
Endoscopy images
KRI Definition Example
Site creates test image
Site sends test image to central
reader
Image is received
Image quality is assessed
Test image is accepted
T1 Q1T2 T3
Pre FPI
Site conducts subject
endoscopy
Site sends image to central reader
Image is received
Image is assessed
Image is reported
T4 T5 Q2
Post FPI

Image reporting timeliness
Time to image acceptance plotted as % missing or reported after 10 days of procedure
What Should It Look Like?

What Should It Look Like?

Presentation Synopsis
• Your RBM goals and aspirations
• Getting started with risk assessment
• Identifying / designing risk indicators
• Quality oversight and management
• Risk mitigation
• Application of technology
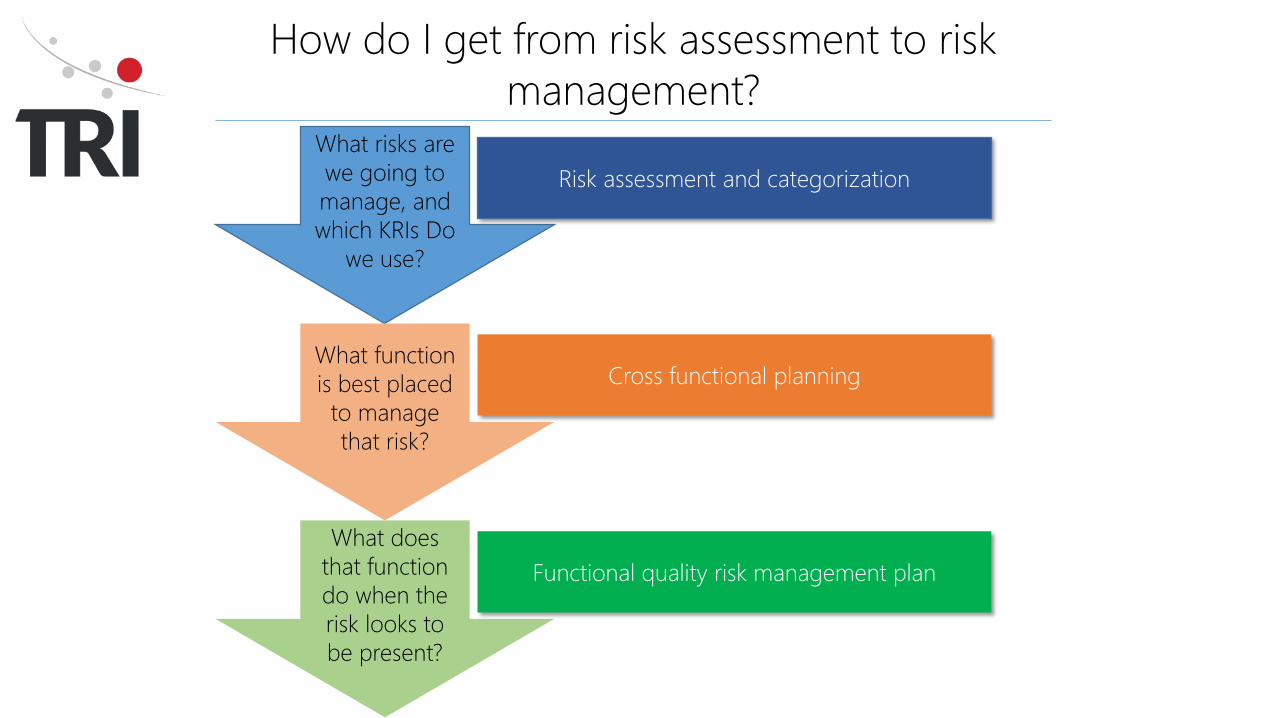
How do I get from risk assessment to risk
management?What risks are
we going to
manage, and
which KRIs Do
we use?
What function
is best placed
to manage
that risk?
What does
that function
do when the
risk looks to
be present?
Risk assessment and categorization
Cross functional planning
Functional quality risk management plan

How do I get from risk assessment to risk
management?
What does
that function
do when the
risk looks to
be present?
Functional quality risk management plan
• Monthly team review of patient withdrawal rates
• If site indicator is orange, add observation and review next month
• If site indicator is red, review companion metrics
• If companion metrics indicate abnormal data pattern, review source data
• If source data shows potential issue, add action to review data with site.
Patient Withdrawal Rates
Wit
hd
raw
al /
10
Su
bje
ct V
isit
s

Presentation Synopsis
• Your RBM goals and aspirations
• Getting started with risk assessment
• Identifying / designing risk indicators
• Quality oversight and management
• Risk mitigation
• Application of technology

How Do We Use KRIs Practically?
KRI• Does the KRI show risk?
• E.g. Higher than study average withdrawal rate
Companion• Review companion metrics
• E.g. Withdrawal type vs.
study norms
Data • Review data
records
Deeper dives
should be
possible at to
refine the risk
signal and
determine actions

Adverse Events Region 2
What are the main
reasons for patient
discontinuation?
What is the
distribution of
reasons across
all sites?
What is the
distribution for this
site?
Companion
Metrics

Drill down to the
KRI data set
What is the
distribution for this
site?
Sort, group and export
multiple data sets for
comparison

Risk Mitigation – What actions?
Actions will be driven by your data monitoring and risk management plans
Should be driven by what you see in the data – reg authorities want to see traceability
Actions may be:
General – an issue across all sites, or a cluster of sites
Site specific – site has breached a KRI threshold or showing a pattern of behaviour we want to
investigate
Patient specific – we think these patients may be at risk from safety or quality perspective
Data specific – we want to SDR a certain subset of a site or patient’s data
Other – depending on protocol and risk assessment
We need to ascertain if the actions have been executed and whether they were effective –
learn and adjust

Risk Mitigation – Is it working?

Risk Mitigation – Is it working?

Summary
Define what RBM means to you and what benefits you want to achieve
Process of starts with Protocol assessment and design
Remove structural risk early
Define KRIs for essential risk and assign appropriate function
Create functional quality risk management plans
Review data and execute risk manage activity as needed
Use companion indicators and data review to perform root cause
Track everything – build your evidence and learn for the next study
If you want help – ask – we’re here to help!
Questions / Contact Details
Duncan Hall
CEO and Founder
By website:
www.tritrials.com
By email:

TRI – Where’s The Risk?
Join the official LinkedIn RBM Group, Risk-Based Monitoring in Clinical Trials and follow our LinkedIn Page, Triumph Research Intelligence!
Follow us on Twitter @TRI_OPRA_RBM
Visit us on www.tritrials.com or email at [email protected]
Thank You
…the risk-based monitoring company


