Date post: | 20-May-2015 |
Category: |
Documents |
Upload: | white-house |
View: | 673 times |
Download: | 19 times |
CLIMAT RESEARCH Published January 31
Vol238-1,20 Clim Ries
Proxy climatic and environmental changes of the
past 1 00 years
Willie Soon'"2 *, Sallie Baliunas1' 2
Ii~arvard..Smithsonian Center for Astrophysics, 60 Garden Street, MS 16, Cambridge, Massachusetts 02138, USA
records is reviewed. As indicators, the proxi s duly represent local climate. Because each is of a
different nature, the results from the proxy nrdicators cannot be combined into a hemispheric or
global quantitative composite. However, con idered as an ensemble of individual expert opinions.
the assemblage of local representations of climate establishes both the Little Ice Age and Medieval
warm Period as climatic anomalies with worl dwide imprints, extending earlier results by Bryson et
al. (1963), Lamb (1965), and numerous intewening research efforts. Furthermore, the individual
proxes an e ued o adres th qustin 3f whether the 20th century is the warmest of the 2nd
millennium locally. Across the world, manyr cords reveal that the2tcnurispoalntth
warmest nor a uniquely extreme climatic per od of the last millennium.
KEY WORDS: Paleoclimate proxies - immte change Environmental change Little Ice Age
Medieval Warm Period
_______________________Resale orrpublication not Per attend without writtefl consent Of the publisher
1. INTRODUCTION be found to support or reject a medieval warming. But
the updated composite tree-ring summer temperature
Are the Little Ice Age and Medieval Warm Pei iod curve in Fig. 1 of Briffa (2000) shows evidence for an
widespread climatic anomalies? Lamb (1965) write, anomalously warm interval from about 950 to 1100 in
'IMlultifarious evidence of a meteorological na ure the northern high-latitude zone, which coincides with
from historical records, as well as archaeological, Lamb's Medieval Warm Period. Also, a similar early
botanical and glaciological evidence in various parts warm period appears prominently in the averaged
of the world from the Arctic to New Zealand . .. has tree ring chronologies carefully selected and processed
been found to suggest a warmer epoch lasting several from 14 sites spreading over 30 to 70 0 N (Esper et al.
centuries between about A.D. 900 or 1000 and a' out 2002).
1200 or 1300. . . . Both the "Little Optinmnm" in the Those results are but a few of many that have be-
early Middle Ages and the cold epochs li~e. "Little Ice come available since Lamb's analysis. Given advance-
Age"], now known to have reached its culminating ments in retrieval of information from and extension of
stages between 1550 and 1700, can today be substanti- surface coverage for the proxies, we review the accu-
ated by enough data to repay meteorological investi- mulated evidence on regional climatic anomalies over
gation. ... .It is high time therefore to marshal the cli- the last 1000 yr. We also recommend Ogilvie & JMnsson
matic evidence and attempt a quantitative evi~d nce' (2001), who recently provided the most authoritative
(p. 14-15). Research on large-scale patterns of cli ate discussion on the historical development of the long-
change continued with vigor, standing debates on the climatic nature of the Medi-
Jones et al. (1998) tentatively concluded that hule eval Warm Penod and Little Ice Age, especially con-
a Little Ice Age cooling existed, little evidence could cerning the North Atlantic, including Iceland.
'Email: wsoon~cfa.harvard.edu © Inter-Research 2003 www.int-res.corn
90 ClimRa~s 3: 89-110, 2003
2. WORKING DEFINITIONS Question (3) differs from Questions (1) and (2). Ques-
tion (3) looks f or a 50 yr anomaly within the 20th cen-
What are the regional patterns of climatic change tury compared to any other anomaly throughout the
ovrte last 1000 yr? Accurate results could serve as period of a proxy record. Questions (1) and (2) look for
bvenchmak o 0hcnuylblaeaewrinj a 50 yr anomaly within the previously suggested 500
seen in the surface thermometer records and as phys - an 00y ineraspfcthvely M oedea Wharmi Pheriodeand
Cal constraints for theories or mechanisms of clina e Little Ice Agwe, trespectively Noef thatio in the cas more
change on timescales of decades to centuries. Question (3), wetettedfntio ofeat50yr nor more
The proxies used to study climatic change over tl e period of sustained anomaly in the 20tceurnod-
lat100 yr are addressed individually and theretor e ferent from that of any prior century. Thus, if a sus-
locally because they differ in nature too greatly to be tamned warm anomlc eeidniidadapndt
quantitatively averaged or compared. To make prog- 'reside in the Medieval Warm Period and appeared
ress, we consider 3 questions of many individua1 warmer than an anomaly found in the 20th century,
then we would assign 'No' to Question (3). Similarly, a
climate proxies: te2t etr
(1) Is there an objectively discernible climatic anom- proxy record may show both that te2t etr
aly dringthe ittl IceAge interval, defined as anomaly is the most extreme (warmest) and that the
1300-1900? This broad peniod in our definition derives Medieval Warm eideit.I nwrn us
from historical sea-ice, glaciological and geomorpl O- tion (3), the existence of the Medieval Warm Period or
logical studies synthesized in Grove (2001a,b) a d Little Ice Age is not considered, because they are
Ogilvie & Munsson (2001). assessed independently, in Questions (1) and (2).
(2) Is there an objectively discernible climatic ano T- We started with the framework of past researchers,
aly duning the Medieval Warm Period, defined as naey h ugse xs ene a of the Meudiea
800-'1300? This definition is motivated by e.g. Pfistei et Warm Period and Little Ice Age. Thre golof clmthe study
al. (1998) and Broecker (2001), and is a slight modifica- is to deduce the geographical naturerioflimatic nd
tion ofLamb's rigina study 1965).environmental conditions during these peros itn
(3) Is there an objectively discernible climatic an i- guihigite a0t centurase af sheparaters peno ise
aly within the 20th century that is the most extreme largely a practicalba eas fth neeti h
(the warmest, if such information is retrievable) period role of human activity on Earth's climate and environ-
in the record? An important consideration in ans er- ment.
ing this question is to distinguish the cases for w icentetmotntcnieaini tatdr temorary
the20t cetur wamig bganeary i th cntur regional cooling (or shift between wetaddycni
versus after the 1970s, as recorded by surface ther- tion) may ocu0 ndcdl u o utdcdf
omter. Tisis ecesay i tepeatue ca s timescales during the Medieval Warm Period, and
are tobe rlTeds to anthssrypgeic fomprcingeinputske similarly, occasional, short-lived regional warming (or
inreasoed reatmdospei cantrbogndioxieconteinpt, shift between wet and dry condition) may occur during
Anomaly is simply defined as a peniod of more t acn the Little Ice Age, as indicated byGoe201b)
50yr of sustained warmth, wetness or dryness. wi hin Thus the terms Medieval Warm Peniod and Little Ice
the stpltditrafte Medieval Warm Period ,or Age should indicate persistent but not necessarily
a 50 yr Or longer period of cold, dryness or wet ess constant wann ormoolng repetiel , oe broad
within the stipulated Little Ice Age. We define anoi aly areas (see also Stine 1998, Lucma20,Grv
in the 20th century within each proxy in the same vay. 2001a,b, Ogilvie & Jdnsson 2001, Esper et al. 2002).
The urfce nstumetalrecrd f te 2th erury Stine (1998) suggests that more appropriate terms may
contains 3 distinct, multidecadal trends: early-cer tury be 'Little ICe-g lmtcAoay n Mdea
warmngmidcenurycooingandlat-cetur w in- Climatic Anomaly'. it is also noteworthy that the defin-
ing. But that knowledge comes from instrumental her- itions of discrilpsstncimeaoaisfr
momery ithitshig tie resolution and other bni ses, the Little Ice Age and Medieval Warm Period may
whichr prelud at directi coprsnt h r xies include not only distinct changes in the mean but also
(whih hae thir on bases). our goal here is to om- changes in the multidecadal variance(gli ~s
parec thae 2thcentry ownbjetvi thmoeexeded son 2001). Through the microscope of daily and re-
past changes than is available from thermo etry. gional spatial scale variability, it is importn orcg
Give th bisesof achproy, uesion(3) was nize that even the relation between multidecadal mean
aivnsw here byiaskin ifwti each proxy rcr, hereiontemperature and its daily vaniability may undergo sig-
was an earlier (pre-2Oth century) 50 yr interval w~ rmer nificant non-stationary changes(egKnpebrert
(or more extreme, in the case of precipitation) tha iany al. 2001, who document those time-dependent changes
50 yr average within the 20th century. in temperature variability across the United States).
Soon & laliunas: Climatic and eni oninental changes of the past 1000 years 91
Also, from a combination of field evidence and model noinena. could be multi-phased events acting under
ing based on the understanding from synoptic cluna- distinct local and regional constraints and Modes.
toloy, rysn &Bryon 199) dmontraed ow Ca Bradley & Jones (1993) and Hughes & Diaz (1994) initi-
and regional factors (for horizontal spatial distances a ated and strongly hedteve httesphenomena.
small as 100 kin) can produce significantly differe t were not global, but Grove (1996; see espeitoally p.tai
precipitation histories for 2 Near East station to 54) disagrees. However, in the tradtoal aa
(Jersale andIcamshli Syra) and for 2 stations i rich areas of Western Europe or the Northern Atlantic
therCascadem Rangaeof Oyreo (mutiosvrsi s including Iceland and Greenland, both the Little ice
teCoastal-lik ngemic olmt sites).monanosv Age and Medieval Warm Period do exist as distinct
courtaclassificatonofat widespra) aoay ae climate anomalies (Pfister et al. 1998, Grove 200ia,
on multidecadal persistence at many locales rests on Ogilvie & JMnsson 2001). No objective profdsrdt
goo prcednt.Forexaple th moerngloall y the existence of those phenomena in other regions.
averaged surface warming inferred from thermc- Thus, hike other resetarcer (Lamb 1965 Poarterit1986,i
meter readings includes large-scale cooling tren s Grove 1996, rEut eta19) e sart w eithpeva-
over oth he Grenlad/Larador Sea area and t e ously indicated periods of Little Ice AgeadM ivl
easern regont o the Urelnitedb Sae(3to4N80 o Warm Period, and ask whether they are widespread,
1100 W; see Hansen et al. 1999, Robinson et al. 2001) teleconnectedevnstanedotecsriylt
or te Atarticconinet (~g.Dorn e. a. 202) throughout the defined periods. The terms Medieval
the last 30 to 50 Yr. Another example is relati e Warm Period antitec g emanpatical axtndio
warmth duning the Little Ice Age and relative ccol viable, especially considening the Poenta xeso
during the Medieval Warm Period seen in t e of the concept to past and future climatic events that
borehole record of reconstructed temperature at Tay- are 'similar or equivalent' in physical scope (e.g. Bond
lor Dome, Antarctica (77.80S, 158,720E, elevati n et al. 1997, 1999).serneolca
2374 in), compared to results from Greenland's bo e- Current knowledge on the divers raned ofeloalWr
hole (see Glow & Waddington 1999). which do lot climatic behavior suggests that the Mxeediea Warme
show those features. These vaniations are of sh rt Period and the Little Ice Age are not epce ob
duration compared to the anomaly, and of limi ed homogeneous and sustained. To define the beginning
regional extent, and end dates of these climate anomalies requires bet-
ter understanding (for the Little ice Age see Porter
1981, 1986, Kaser 1999, Grove 2001a,b, Luckman 2000.
3. APPROACH Schuster et al. 2000, Winkler 2000, Ogilvie & JMnsson
2001, Henrdy et al. 2002). Imprecise data on the begin-
Table 1 and Figs. i to 3 summarize the answers to he ning and end of both events contributes in part to con-
quetions posed here about local climatic anornales. fusion about the phenomena. For example, Ogilvie &
FrQuestos 1 Ind() we answered 'Yes' if the Farmer (1997) have commented that Lamb's sugges-
proxy record showed a period longer than 50 ylof tion of a Medieval Warm Period mayntbsupre
cooling, wetness or dryness duning the Little Ice Age, by documentary data even for England because theft
and similarly for a peniod of 50 yr or longer for wa in- extensive studies based on a historical dataset showed
ing, wetness or dryness during the Medieval W rmn that England suffered relatively cold winters from 1260
Period. A dash indicates that either there is no ex ,ert to 1360. However, as that period is near the transition
opiion ortha te poxyrecrddoe no coerthe between the Medieval Warm Period and Little Ice Age
perid i qustin. A'Ye?' r 'o?'answer means :hat defined in this study, this fact does not srnl ota
theorigdina qexpert. opiniorn wsYsor o bttti dict our results. Evidence based primarily on glacier
doe no machourcriera; or xamle iftheine rval activity points to both a poorly defined beginning and
of warmth duning the Medieval Warm Period werE too end of the Medieval Warm Period, wieteLtl c
shot b or dfiitin o b 'es' i woldmert V s Age interval seems to have had a gradual beginning
In sverl csesin te 2th entrya 'Yes-' designa- but more abrupt end, Althoughthnoinfte
tIon weeas casesignted fortheanswery toQetin ) in Medieval Warm Period or Little Ice Age with sharply
order to highlight the fact that the 20th century warin- defined transitiosmyb conenin onearit iseprob-l
ing first occurred early in the century, ca. 1920-1950, ably a non-physical construct becausoflreegna
when the aft's content of anthropogenic CO 2 was still differences in the timing of both phenomena. As sug-
cumulatively small, gested by Grove (2001a). an inhomogeneous climate
A global association for the Little Ice Age or pattern (though not necessarily an analog) can already
Medieval Warm Period is premature because proxy be identified in the 20th century warm intervals as
data are geographically sparse and either or both phe- defined by instrumental records.
92 Chlin Res 2 :89-110, 2003
Table 1. A full list Of paleoclimatic proxies that have sufficient length of continuous records to entertain the 3 specifc questions:
(1) Is there an objectively discernible climatic anomaly duin n the Little Ice Age interval (A.D. 1300-1900) in this proxy record?
(2)Is her anobjctielydisernblecliati anmal dnn the Medieval Warm Period (A.D. 800-1300) in this proxy record?
(3) Is there an objectively discernible cliMatic anomaly wurithi the 20th century that is the most extreme (the warmest, if such in-
formation is available) period in the record? A question mark after an answer indicatesucranyoideso.Smblfrth
type of climate proxy used include B: borehole; Cl: cultural; E : documentary; 0: glacier advance or retreat; Gm: geomorphology;
In: instrumental; IS: isotopic analysis from lake sedimentary or ice cores, tree or peat celluloses, corals, stalagmite or biological
fossils; Ic: net ice accumulation rate, including dust or che nial counts; iA: lake fossils and sediments; river sediments; NE: melt
layers in ice cores; Mp: multiproxy (any combination of roxies listed here); Pf: phenological and paleontological fossils;
Worldwide - Mp Mann et al. (1999) Yes No Yes0
Arctic wide - MP Overpeck et al. (1997) Yes - Yes8
Worldwide - MP Crowley & Lowery (2000) Yes No Yes8
Worldwide - MP Jones et al. (1998) Yes No Yes8
Worldwide - T Briffa (2000) Yes No Yes8
Worldwide - T Briffa et al. (2001) Yes - Yes'
Worldwide - T Jones et al. (2001) Yes - Yes8
NHj mid-latitude - T Esper et al. (2002) Yes Yes No
Worldwide - MP Lamb (1977, 1982) Yes Yes -
Worldwide - G + Is Porter (1986) Yes Yes -
Worldwide - G Grove & Switsur (1994) - Yes -
Worldwide - T+G+D Hughes & Diaz (1994) Yes No?b No?b
Worldwide - MP Grove (1996) - Yes -
Worldwide - B Huang et al. (1997) Yes Yes No
Worldwide - D Perry & Hsu (2000c) Yes Yes No
Worldwide - D deMenocal (2001) Yes Yes -
Americas - Ts+Gm+Mp Shine (1998) - Yes -
N. Atlantic (Iceland) 63-660 N 14-24- MP Ogilvie et al. (2000)
Ogilvie & Jdnsson (2001) Yes Yes No
N. Atlantic (S. Greenland) 60-700 N 20-550 Mp Ogilvie et al. (2000) Yes Yes No
W. Europe 45-540 N 0-15- MP Pfister et al. (1998) Yes Yes No
N. Atlantic (Europe) 35-700 N 250 W-30 8 E In,-D Luterbacher et al. (2000) Yes - -
Central England 520 N 20 In+D Lamb 65, Manley (1974) Yes Yes No
S. Spain 37 .300 N 4.3g0 In+D Rodrigo et al. (2000) Yes - No
Crete Is. 35.150 N 25.000E D Grove & Conterio (1995) Yes.- No
Mid-RusSIa 50-608 N 30-SO E Ini-D Borisenkov (1995) Yes - -
Czech Republic 48.5-51.20 N 12-19 B lni-B Bodri & Cermdlk (1999) Yes Yes Yes?
S. USA 37-380 N 107.5-10 .50 W Pf+Cl+D Petersen (1994) Yes Yes -
E. China (Guang Dong Prov.) 22-250 N 112-114 30 E D Chan & Shi (2000) Yes - -
E. China-wide 20-400 N 90-12 0E D Song (2000) Yes - No?
Japan 30-400 N 125-14 0'E D Tagarni,(1
9 9 3 , 1996) Yes Yes No
S. Africa 22.20 5 28.38' E ci Huffmnan (1996) Yes Yes -
E. Greenland (Nansen Fjord) 68.30 N 29.70 Is Jennings & Weiner (1996) Yes Yes No
C. Greenland (Cr~te) 71.120 N 37.32 0 W Is Dansgaard et al. (1975) Yes Yes No
C. Greenland (GRIP) 72.60 N 37.60 B Dahl-Jensen et al. (1998) Yes Yes No
S. Greenland (Dye 3) 65.2 0 N 43.80 B Dahi-Jensein et al. (1998) Yes Yes No
C. Greenland (GISP2) 72.580 N 38.50 Ic+Ml Meese et al. (1994) Yes Yes No
C. Greenland (GISP2) 72.580 N 38550W Is Stuiver et al, (1995) Yes Yes No
Svalsbard 79 0 N 15'1 ml Tarussov (1995) Yes Yes No
Devon Island 750 N 870W ml Koerner (1977) Yes - Yes0
Ellesmere Island 80.70 N 73101 NE Koerner & Fisher (1990) Yes Yes No
Ellesmere Island 80.70 N 73.1 0 W B-Us Beltramii & Taylor (1995) Yes Yes No
Gulf of Alaska 60-610 N 1490 G+T Calkin et al. (2001) Yes Yes -
Swiss Alps (Corner Glacier) 45.8-46.50 N 7.75-8. 60 E G+Gm Holzhauser (1997) Yes Yes No
(Grosser Aletsch Glacier) 45.8-46.50 N 7.75-8.16'EB Is+T Holzhauser (1997) Yes Yes No
South Georgia Island 54-55O 5 36-3 0W G+Gm Clapperton et al. (1989) Yes Yes -
Southern Alps (Mueller Glacier) 43,440 S 170.0 0lE CGiGm Winkler (2000) Yes - -
Antarctica (James Ross Island) 64.220 S 57,68,W is Aristarain et al. (1990) Yes? - No
Antarctica (Law Dome) 66.730 S 112.8 0'E Is Morgan (1985) Yes Yes No
Antarctica (Victoria Land) 74.330 S 165.130 B G+Gnvils Baronl& Orombelli (19 9 4 ) Yes Yes -
Soon & Baliunan: Climatic and envi onmental changes of the past 1000 years 93
Table 1(continued)
Location Latitude Longitudc Type Source Answer(1) (2) (3)
Antarctica (Dome C) 74.650 S 124.170 B Is Benoist et al. (1982) Yes Yes No
Prince William Sound, Alaska 60 0 N 149 0 W T+G Barclay et al. (1999) Yes Yes? -
Alberta, CanadaColumbia Icefield 52.20 N 117.8 0 W T+In+C Luckman et al, (1997) Yes Yes Yes0
N. Qu6bec 57,730 N 76.170 W T Arsenedult&Payette(19 97 ) - Yes -
Central US 33-490 N 91-109 I T+Mp Woodhouse & Yes Yes Yes4Overpeck (1998)
E. Idaho 44.1 0 N 1140 W T Biondi et al. (1999) Yes - No
N. Carolina 34,50 N 78.30 W T Stahle et al. (1988) Yes Yes No?
California (SN) 36.5-37.50 N 118.5-120 ow T Graunilich (1993) Yes Yes No
California (SN) 36.5-37.50 N 118.5-120.
0W T Scuderi (1993) Yes Yes No
Califormia (SN) 36-380 N 118-120' I T Swetnamn (1993) Yes Yes No
New Mexico 34.5 0 N 1080 W T Grissino-Mayer (1996) Yes Yes No
Central Eq. Pacific (NINO 3.4) 50 N-50 S 1600 E-150 W T+ln Evans et al. (2000) Yes Yes? No
C. Siberia (Taymiri + Putoran) 72.470 N 1020 E T Naurzbaev & Vaganov (2000)Yes Yes No
Kola Peninsula 67-680 N 33-3401 T+ls 1-iller et al. (2001) - Yes -
N. Fennoscandia 680 N 220 E T Briff a et al. (1992) Yes Yes No
NE, Italy 450 N 100 E T Serre-Bachet (1994) Yes Yes No?
Morocco 28-360 N 2-120A T Till & Cuiot (1990) Yes Yes? No
Mongolia (Tarvagatay Mts.) 48,30N 98.930. T Jacoby et al, (1996) Yes - Yes
Mongolia (Tarvagatay MtS.) 48.31 N 98.930E T+D D'Arrigo et al. (2001) Yes Yes Yes
N. Patagonia (Rio Alerce,
Argentina) 41.170 S 71.770W T Villalba (1990) Yes Yes No
S. Chile (Lenca) 41.55 0 S 72.60W T Lara & Villalba (1993) Yes No No
S. South America 33-5505 60-750W T±G Villalba (1994) Yes Yes No
W. Tasmania 420 S 146.501 T Cook et al. (2000) No Yes Yes?
New Zealand 35-48' S 167-177 B T D'Arrigo et al. (1998) Yes - No
N. Scandinavia 68 0 N 200 E T+G Karl6n (1998) Yes Yes No
California (SN) 38 0 N 1100W TS Stine (1994) -, Yes No
California (SN) 37.50N 119.450V TS Stine (1994) - Yes No
California (SN) 38.380 N 119.450W Ts Stinle (1994) - Yes No
California (SN) 38.850 N 120.470. TS Stine (1994) - Yes' No
Patagonia 48.950 5 71.430W TS Stinle (1994) - Yes -
Patagorna 50.470S 72.970W TS Stine (1994) - Yes -
NW Michigan (L. Marion) 45 0 N 85'W Po Bernabo (1981) Yes Yes Yes?
Qinghai-Tibetan Piat.ad(Dunde Ice Cap) 38.10 N 96.401 Po Liu et al. (1998) Yes Yes Yes?0.
NE China (Maili) 42.870 N 122,870 E Po Ren (1998) - Yes -
NE China (Hangzhou) 30-330 N 105-122 E Pf Zhang (1994) - Yes -
China (Taibai Mt.) 33.97 0 N 107.730 E Pf+PO Tong et al. (1996) Yes Yes No
Himalaya 28,380 N 85.720 Is Thompson et al. (2000) Yes No Yes
Himalaya (Dasuopu Glacier) 28.380 N 85.720 IC Thompson et al. (2000) Yes - Yes
Guliya Ice Cap 35.20 N 81.501 Ic+Is Thompson et al. (1995) Yes Yes No
E. China 30-400 N 100-12(0E lc+D Shi et al. (1999) Yes Yes Yes?
W. China (Guliya Cap) 35.20 N 81.50E Ic+D Shid et al, (1999) Yes Yes Yes?
Quelccaya Ice Cap 13.930 S 70.830 Is+lc Thompson et al. (1986) Yes Yes? No
Antarctica (Siple Station) 75.920 S 84.250 A Ic+Is Mosley-Thompsofl (1995) No - No
Antarctica (Dyer Plateau) 70.67 0 S 64.880 Ic+Is Thompson et al. (1994) Yes? - Yes
Antarctica(Dronning Maud Land) 7605 8.050W Ic+Is Karlbf et al, (2000) Yes Yes? No?
South Pole 900 S IC Mosley-Thompson & Yes Yes? No
Thompson (1982) Ye YsNo
N. Atlantic 54.270 N 16.780 Sd Bond et al, (1997)Ye Ys No
N. Atlantic 44.50 N 46.330 Sdi Bond et al. (1999) Yes Yes No
N. Atlantic 56.370 N 27.810 Sd Bianchi & McCave (1999) Yes Yes NO?
N. Ellesmere Island 810 N 800W Sd+Lf Lamoureux & Bradley (1996)Yes Yes -
SW Baltic Sea
(Bornholm Basin) 55.380 N 15.40 Sd+Is Andrdn et al. (2000) Yes Yes No
N. Fennoscandia(L., Tsuolbmajavri) 68.680 N 22.08'E Lf Korhola et al. (2000) Yes Yes No
94 Clim Res 2 :89-110, 2003
Table I(continued)
Location Latitude Longitud( Type Source Answer(1) (2) (3)
Switzerland (L. Neuchatel) 47 0 N 6.55VW LfI +s Filippi et al. (1999) yes Yes Yes?
NW Scotland (Assynt) 58.110 N 5.060 W Sp Proctor et al. (2000) Yes Yes No
W. Ireland 53.530 N 9.930 W Is Bladdford &Chambers (1
9 9 5 ) Yes Yes -
SW Ireland 52.50 N 9.25 0 W Sp McDermott et al. (2001) Yes Yes -
Bermuda Rise 32.170 N 64.50 W Is IKeigwmn (1996) Yes Yes No
Chesapeake Bay 37-38.40 N 76.I 0 W Sd Verardo et al. (1998) Yes Yes -
NW Alaska (Farewell L.) 62.550 N 153.630 Lf 4Is Hu et al. (2001) Yes Yes No
S. Dakota (Pickerel L.) 45.5 10 N 97.270W If Dean & Schwalb (2000) Yes Yes No
N. Dakota (Moon L.) 46.850 N 98.160W L Laird et al. (1996) Yes Yes No
N. Dakota (Rice L.) 48,010 N 101.530W Lf Yu & Ito (1999) Yes Yes No
Yellowstone P. (Lamar Cave) 44.560 N 110.240W Pf i-s H-adly (1996) Yes Yes No
Colorado Plateau (L. Canyon) 37.420 N 110.67'V Lf4-Gm+Is Pederson (2000) Yes Yes -
NE Colorado 40-411 N 102-1050 Gmv-Is+D Madole (1994) - Yes No
SW US (Colorado + Arizona) 34-37.5O N 105-112' Lf+1s Davis (1994) - Yes No?
SW us 32-390 N 109-1140 Lf+iGm Ely et al. (1993) Yes Yes No
California (White Mts.) 37.43 0 N 118.170 Is Feng & Epstein (1994) Yes Yes -
California (L. Owen) 36 0 N 118.170W Is Liet al. (2000) Yes Yes No
Yucatan Peninsula
(L. Chichanicanab) 200 N 88.40W Lf iIs Hodell et al. (2001) Yes Yes -
Cariaco Basin 11 0 N 650 W Sd Black et al. (1999) Yes Yes No
Caniaco Basin 10.71 0 N 65.170 Sd4-Is Haug et al. (2001) Yes Yes
S. Florida 24.950 N 80osso Is Druffel (1982) Yes - -
SW Puerto Rico 18.12 0 N 67.090W is Winter et al. (2000) Yes - -
NE China (Jinchuan) 42.30 N 126.370 Is IHong et al. (2000) Yes Yes No
S. Japan (Yakcushima Is.) 30.330 N 130.50 Is Kitagawa & Yes Yes NoMatsumoto (1995)
N. India (Pahalgarn) 34.02' N 75.2001 Is Ramesh (1993) Yes - -
S. India (Nilgiris) 10-10.50 N 770 E is Ramesh (1993) - Yes -
E. Africa (L. Malawi) 10 0 S 350 E U Johnson et al. (2001) Yes - No
E. Africa (L. Naivasha) 0.460 S 36.210] 1f Verschuren et al. (2000) Yes Yes No
W. Africa (Cap Blanc) 20.750 N 18.580W Is deMenocal et al. (2000) Yes Yes No
S. Africa 19-35' S 10-33' MP Tyson & Lindesay (1992) Yes Yes No
S, Africa (Nelson Bay Cave) 3403 230 E Is Cohen & Tyson (1995) Yes - No
S. Africa (Makapansgat) 24.540 S 29.250 Sp Tyson et al. (2000) Yes Yes No
N. New Zealand (Waitomo) 38.270 S 1750 Sp Williams et al. (1999) Yes - -
S. New Zealand (Nelson) 40.670 S 172.430 E Sp Wilson et al. (1979) Yes Yes No
S. America (several regions) 33-38'S5 59.3-67 W MP Iniondo (1999) Yes Yes -
C. Argentina 29.5-350 S 61.75-65. 50 W Gm+D Carignano (1999) Yes Yes No
C. Argentina 28-360 S 61-670 G+Mp Cioccale (1999) Yes Yes No
NW Argentina 26.50S 68,090V Sd-iIs Valero-Garc6s et al, (2000) Yes - -
W. Antarctica (Palmer Deep) 64.860 S 64.210M Sd Domack et al. (2001) Yes Yes No
W, Antarctica (Siple Dome) 81.650 5 148.810 W Is Kreutz et al. (1997) Yes - No
0 Warming or extreme excursion peaked around 192 -1950 before any sigmifcant anthropogenic CO, release to air
bHughes & Diaz concluded that tourl review indicates th it for some areas of the globe (for example, Scandinavia, China, the
Sierra Nevada in California, the Canadian Rockies, and Tasmania), temperatures, particularly in summer, appear to have
been higher during some parts of this period than those that were to prevail until the most recent decades of the twentieth
century. These regional episodes were not strongly syn -hronous. Evidence from other regions (for example, the Southeast
United States, southern Europe along the Mediterranean, and parts of South America) indicates that the clnnate duning that
time was little different to that of later times, or that wa rming, if it occurred, was recorded at a later time than has been as-
sumed. ..,. To the extent that glacial retreat is associated with warm summers, the glacial geology evidence would be consis-
tent with a warmer period in A.D. 900-1250 than imnme iately before or for most of the following seven hundred years.' The
main conclusion of Hughes & Diaz (1994) may be in actual agreement with the qualitative Classifcation in our paper
cOnly documentary, histonical and archaeological reseai ch results, rather than the solar-output model results, of this paper
were referred to
dpor the Dounde ice cap, Thompson et al. (1989) noted tha , according to the 8"O climate proxy, the 1940s, 1950s and 1980s are
at least as warm as the H-olocene maximum 6000 to 8000 BP. To confrmn Thompson et al. (1989) cf. Fig. 6 in Thompson (2000),
because the claim that 1930s-1980s are the warmest of the last 6000-8000 yr is not clear from any figure in Thompson et
al. (1989). But the iman warming of the 1940s-1950s occurred before a significant rise of anthropogemc CO, in the air
Soon & Baliunas: Climatic and envi onniental changes of the past 1000 years 95
EYes
~&Yes? or No? *.- *: 7
Fig. 1. Geographical distribution of local answers to the foil wing question: Is there an objectively discermible climatic anomaly
during the Little Ice Age interval (AD. 1300-1900) in this pr sy record? Yes'lis indicated by red filled squares or unfilled boxes,
'No' is indicated by green filled circles and 'Yes! or No?' (undecided) is shown with blue filled triangles
*No.&Yes9 or No?9 .
Fig. 2. Geographical distribution of local answers to the for owing question: Is there an objectively discernible climatic anomaly
during the Medieval Warm Period (A.D. 800 1300) in this p oxy record? Yes' is indicated by red filled squares or unfilled boxes,
'No' is indicated by green filled circles and 'Yes? or NoV (undecided) is shown with blue filled triangles or unfi med boxes
96 Chin Res 2 3:89-110, 2003
* Yes*Yes'
... .
.aYes? or No? -. . -
Fig. 3. Geographical distribution of local answers to the foil rwing question: is there an objectively discernible climatic anomaly
within the 20th century that is the most extreme (the warmest, if such information is available) period in the record? 'Yes' is
indicated by red filled squares, 'No' is indicated by green fi led circles or unfilled boxes and 'Yes? or No?' (undecided) is shown
with blue filledtriangles or unfilled boxes. Answer of Vesa i; indicated by yellow filled diamonds to mark an early to nmddle-20th
century warning rath, r than the post- 19 7O5 warming
The climate indicators considered here include info r- ture changes inferred for the Medieval Warm and
mation from documentary and cultural sources, i e Little Ice Age Chimatic Anomalies are generally
cores, glaciers, boreholes, speleothems, tree-growth accepted to be no more than 1 to 20G when averaged
limits, lake fossils, mammalian fauna, coral and tre - over hemispheric or global spatial scale and over
ring growth, peat cellulose; and pollen, phenological decades to a century. Broecker (2001) deduced that
and seafloor sediments. In a rather inhomogefleous only the results from mountain snowline and borehole
way, each proxy is influenced by both climatic and thermomietry are precise to within 0.50C in revealing
non-climartic factors, We rely on individual research rs changes on a centennial timescale. But the quantifica-
for theft best judgments in interpreting climatic si - tion of errors is complex, and both Bradley et dl. (2001)
nals. The 3 questions are addressed in the context of and Esper et al. (2002) have challenged Broecker's
local or regional sensitivity of the proxies to relevant statement. Earlier, Jones et al. (1998) provided an
climatic vanrables, including air temperature, sea sur- enlightening review of the quantitative and qualitative
face temperature, precipitation, and any combinati n limitations of paleodlimatology. Others like Ingram et
of large-scale patterns of pressure, wind and oceanic al. (1978) and Ogilvie & Farmer (1997) had cautioned
circulation. against the use of quantitative interpretations of
climatic results that are based on historical documenta-
tion.
4. UNCERTAINTIES IN INFERRING CLIMATE In our survey of the literature we have observed 3
FROM PROXIES distinct types of warnings (Bryson 1985, Glow 1992,
Graybill & Idso 1993, Huang et al. 1996, Briffa et al.
The accuracy of climate reconstruction from prod s, 1998, Cowling & Skyes 1999, Schleser et al. 1999,
including the awareness of anthropogenic interven- Evans et al. 2000, Schmuitz et al. 2000, Aykroyd et al.
tions that could pose serious problems for a qualitat ye 2001, Ogilvie & JMnsson 2001):
and quantitative paleoclimatology, has been discus! ed (1) the lack of timescale resolution for the longest-
by Bryson (1985), Idso (1989) and others. The tempera- term component of climate signals, e.g. in tree ring and
Soon & Baliuinas: Climatic and envir rnmental changes of the past 1000 years 9
coral records, or the loss of short-term climate iniforma- records, it requires 'considerable faith' to compare, for
tion in borehole temperature reconstructions; example, the climate of the 12th and 20th centuries
(2) the nonlineanties (related to age, threshold, dis- from tree-ring proxies. To date, the practical goal of
continuous or insufficient sampling, saturated response, combining information from borehole and tree-ring
limited dynamic range of proxy, etc.) of biological, proxies, or even comparing borehole and thermometer
chemical and physical transfer functions necessary for data, to yield an accurate proxy record that suriultane-
temperature reconstruction; ously resolves thimescales of years to centuries, remains
(3) the time dependence or nonstatioriarity of thE unfulfilled.
climate-proxy calibration relations. Despite complicating factors such as the mismatch of
Estimates of ground temperature trends from bore climate sensitivities among proxies, a first step has
hole data can be complicated by non-climatic factor, been taken by Beltrami et al. (1995) and Harris &
associated with changes in pattern of landuse and lanc Chapman (2001). Also, Beltrami & Taylor (1995) suc-
cover over time (Lewis & Wang 1998, Skinner cessfully calibrated a 2000 yr oxygen isotope record
majorowicz 1999). In general, climate proxies froi from an ice core (near Agassiz) with the help of bore-
floral and faunal fossils in lake and bog sediments ar( hole temperature-depth data (near Neil) for the
only sensitive enough to resolve change to within ± 1.' Canadian Arctic region. Such careful research may
to 1.80C (e.g. Lotter et al. 2000). isotope-coral proxie help resolve the difficulty of interpreting climate sig-
lack the climate-sensitivity resolution and the con nals that degrade with borehole depth or time. This
tinuous length of record to address millennial climatic depth-dependent, increasing degradation has led to
change. Jones et al. (1998) showed that both coral- an the false impression that reconstructed temperatures
ice-core-based reconstructions performed more poorl I from geothermal heat flows contained a significantly
than tree-ring records when calibrated again t smaller variability in the distant past than at present.
thermometer data since A.D. 1880. On the other hanc, The approach used here relies on local representa-
tree ring proxies, which usually have annual tim tions of climate change, which is an advantage
resolution, suffer from the loss of information on mnult - because understanding local proxies is the prerequi-
decadal to centennial and longer components f site for constructing regional and global patterns of
climate change. change. Another advantage is that by working with a
The amplitude of large-scale surface temperatu local or regional perspective, we avoid the difficult
change derived from tree-ring proxies can be substar - questions concerning the spatio-teinporal coupling of
tially underestimated-by a factor of 2 to 3 compared observed changes among various regions and any
to results from borehole thermometry (Huang et al. specific large-scale pattern responsible for those
2000, Harris & Chapman 2001). It is surprising that the climatic anomalies. Our study has the disadvantage
amplitude of climate variability broadly resolved ty of being non-quantitative. Thus, our assessment falls
borehole reconstruction on timescales of at least 50 o short of Lamb's (1965) original call for quantitative
100 yr is larger, rather than smaller, than the high tir e answers.
resolution results from tree-ring proxies, becau e An early attempt to study the interlinkage of geo-
short-term climate fluctuations are smoothed out y graphically separated and different proxies, e.g. be-
the geothermal heat-flow that acts as a low-pass filte .l tween marine sediments at Palmer Deep, Antarctica,
The different amplitudes found from borehole a d and atmospheric signals in Greenland ice cores, has
tree-ring climate proxies suggest that longer timesc le been reported by Domack & Mayewski (1999). But
(multi-decades and century) variability is more fait a- many chronologies depend on radiocarbon dating and
fully captured by borehole results, while the sa e are too limited in accuracy to allow for reliable inter-
information can be irretrievably lost from tree-ring pretation of the timing of events from different areas
recrds(se e~. Cllis t a, 202)becuseoft re (e~g. Stine 1998, Domack & Mayewski 1999). The diffi-
standardization procedure (to remove bias due to cult task of areal weighting of different rx eod
aging of trees). This is why Jones et al. (1998) co - has been attempted; for the Arctic region by Over-
merited that although one may be confident of int r- peck et al. (1997), the Northern Hemisphere by Crow-
comparing year-to-year and decade-to-decade (limit ~d ley & Lowery (2000), Northern Hemisphere extratrop-
to periods shorter than 20 to 30 yr) variability, which ics by Esper et al. (2002) and both Northern
should be more sensitively imprinted in tree-riag Hemisphere and global domains by Mann et al. (1998,
1999, 2000). However, Briffa et al. (2001) criticized the
lack of consideration of uncertainties in some of these
'There are exceptions in careful tree-ring results like th )se reosucin Frxapthcmoiesresn
of Esper et al, (20021 that are optimiZed to capture Ion jer Overpeck et al,'s (1997) reconstruction is not even cal-
tiinescale variability ibrated with instrumental data.
98 ClimnRes 23:89-110,2003
5. RESULTS warmest or most extreme climatic anoinahes in the
proxy indicators occurred in the early to mid-2Oth
Table 1 lists the worldwide proxy climate records century (Yesa'), rather 'than sustaining throughout
we have collected and studied. We restnicted the list the century.
to records that contain either direct information 5.1. Glaciers
about the 3 specific questions we posed or at leas
a continuous time series for 400 to 500 yr. F r Broadly, glaciers retreated all over the world during
the majority of cases we followed what individu 1 the Medieval Warm Period, with a notable, but minor,
researchers stated according to their paleoclimati re-advance between 1050 and 1150 (Grove & Switsur
reconstructions. In a few cases we elaborated or 1994). Large portions of the world's glaciers, both in
their results in order to remain consistent to ot r the Northern and Southern Hemispheres, advanced
framework. during the 1300 to 1900s (Grove 2001b, see also Win-
The figures show the results from Table 1 for th kler 2000). The world's small glaciers and tropical glac-
Little Ice Age (Fig. 1), Medieval Warm Period (Fig, 2) iers have simultaneously retreated since the 19th cen-
and the nature of the 20th century's change (Fig. 3). tury, but some glaciers have advanced (Kaser 1999,
The figures graphically emphasize the shortage of Dyurgerov & Meier 2000, D. Evans 2000). Kaser (1999)
climatic information extending back to the Mediev I reemphasized the key role played by atmospheric
Warm Peniod for at least 7 geographical zones: t e humidity in controlling the net accumulation and abla-
Australian and Indian continents, the SE Asian arc i- tion of glaciers by modulating the sublimation and
pelago. large parts of Eastern Europe/Russia, tI e long-wave radiative forcing-feedback budgets in both
Middle Eastern deserts, the tropical African ar d dry and humid areas, So far, the proposition of the
South American lowlands (although the large nur - 20th century warming as a natural recovery since
ber of available borehole-heat flow measurements n the Little Ice Age, together with an amplification by
Australia seems adequate for the reconstruction f anthropogenic CO2. is plausible but not definitive
ground temperatures back to medieval times; S e (Bradley & Jones 1993, Kreutz et al. 1997, Kaser 1999,
Huang et al. 2000). Therefore, our conclusions aie Beltrami et al. 2000, Dyurgerov & Meier 2000). On the
provisional, other hand, D. Evans (2000) discussed the possibility of
Fig. 1 indicates that Little Ice Age exists as a disfin- recent widespread recession of glaciers as a glacio-
guishable climate anomaly from all regions of t e chinatic response to the termination of the Little Ice
world that have been assessed. Only 2 records-tree Age and commented that significant warming phases
ring growth from western Tasmania and isotopic me I- during interglacials, especially those accompanied by
surements from ice cores at Siple Dome, Antarctica - relatively warm winters and cool summers, may lead to
do not exhibit any persistent climatic change over tl is the onset of another global glaciation.
period (although the western Tasmania reconstruction Additional proxy records used here reveal that the
contains an exceptionally cold decade centered aromid climatic anomaly patterns known as the Medieval
1900; Cook et al. 2000). Warm Period (ca. A.D. 800-1300) as well as the Little
Fig. 2 shows the Medieval Warm Period with orly Ice Age interval (A.D. 1300-1900) occurred across the
2 negative results. The Himalayan ice core res lt world. The next 2 subsections describe detailed local
(Thompson et al. 2000) seems unambiguous, but the changes in the Northern and Southern Hemispheres.
tree-ning proxy data from Lenca, southern Chile (Le ra
& Villalba 1993) is countered by nearby evidence oftI e
Medieval Warm Period (Villalba 1990, 1994). 5.2. Northern Hemisphere
Fig. 3 shows that most of the proxy records do iot
suggest the 20th century to be the warmest or t ie A composite reconstruction of summer temperature
most extreme in their local representations. There ere anomaly assuming a simple, uniform weighting of
only 3 unambiguous findings favoring the 20th cE n- proxy records by Bradley & Jones (1993) showed that
tury as the warmest anomaly of the last 1000 Y- the 1530-1730 interval was the coldest period for the
the records from the Dyer Plateau, Antarctica, te Northern Hemisphere, and the 19th century was the
Himalayas and Mongolia (Thompson et al. 1994, second coldest interval in the last 500 yr.
2000, D'Arngo et al. 2001). An important, seemin ly
counter-intuitive, feature of Fig. 3 is the large numn er
of uncertain answers compared to the 2 prior ques- 5.2.1. Western Europe
tions, perhaps partly owing to inaccurate calibration
between proxy and instrumental data. Also, anot er Cold winters and wet summers prevailed during the
feature of the result is the many cases in which he Little Ice Age in Switzerland, a location with detailed
Soon & Baliunas: Climatic and envir )nnental changes of the past 1000 years 99
and reliable information (Pfister 1995). A careful corn- 5.2.2. North Atlantic and other oceans
panson of the Swiss and central England temperaturesieaasron
records (Manley 1974) from 1659-1960 reveals a During the Little Ice Age, extensieaesaon
general correspondence of climatic conditions between Mediterranean Europe and the North Atlantic, includ-
the 2 regions. In the Andalusia region of southern ing Western and Northern Europe, Greenland and Ice-
Spain, rainfall appears to have alternated between dr land, were expeniencing unusually cold and wet con-
and wet century-long spells (wet periods persisted ditions as well as many extreme weather events,
1590-1649 and 1776-1937; dry periods 1501-1589 and including deluges, landslides and avalanches (Grove
1650-1775) throughout the Little Ice Age, and with nc 1996, Ogilvie et al. 2000, A. T. Grove 2001). Climate
significant difference to the modern dry period ol over Iceland was found, based on various proxies, to be
1938-1997 (Rodrigo et al. 2000). Enhanced fluvia mild from 870 to 1 170, with cold periods setting in after
activity was documented in river basins of North 1200. Instead of being a period of unrelenting cold,
Westen an Cenral urop for1250-1550 and Ogilvie (1984) emphasized that the most notable
1750-1900 (A. T, Grove 2001). Over Western Europe, aspect of climate over Iceland duning te1t o1t
Pfister et al. (1998) concluded that severe winters were centuries, with its very cold decades during the 1690s,
less frequent and less extreme during 900-1300 tha 170,1 an Oglvies w assits lageyer-o-eavn
those during 1300-1900. The mild-winter condition ability (see alsogive&Jnsn20)
was hypothesized by Pfister et al. (1998) to haye The viking colonization of Greenland's coastal area
caused the northward migration of Mediterranean starting in 986 is well documented, and the gener-
subtropical plants, where St. Albertus Magnus note ally mild and benign climatic conditions from about
the abundance of pomegranates and fig trees in thn 800 to 1200 that helped to sustain the settlement, are
13th century around Cologne and parts of the Rhine also well supported by ice core and borehole proxy
valey.Olie tees whchlik fi tresareals sns: - information (Dansgaard et al. 1975, Dahl-Jensen et al.
tive to prolonged periods of air temperature belo 19) h osee 'etr Setlemn (bardouned
freezing, must have grown in Italy (Po valley), Franc the Godthab district) was mysterioulabnoe
and Germany because a chronicler documented the sometime between 1341 and 1362, while the 'Eastern
damage to the olive trees by the bitter frost in Janua y Settlement', actually near the southernmost tip of west
1234. Lamb (1965) noted generally wet winters b t Greenland, atound the Narssaq and Julianehab dis-
drier summers for the lowlands in England, Ireland, tricts, died out between 1450 and 1500 (Grove 1996,
the Netherlands, Denmark, Sweden and NWM Germa y Ogilvie et al. 2000). It also seems that both cultural and
from about 1200 to 1400. Those conditions are sup- political factors contributed in making the None
portd b doumenaryrecrds that describe freque it Greenlanders at the Western Settlement more vulner-
flooding and storms around those regions during t e able to the harsh climatic conditions(alwe l
transitional period between Medieval Warm Peri d 1997). The timing for the abandonment of these settle-
and Little Ice Age. ments coincided with the general cooling over Green-
Is the warmth of the 20th century for western Euro e land, a~s established by both ice-core isotopic and bore-
exceptional or unusual? Weather reconstruction resu ts hole thermometry (Dansgaard et al. 1975, Stuiver et
for the Low Countnies, the present-day Benelux regi n, al. 1995, Dahl-Jensen et al. 1998). From sediment
suggest that in order to compare the 20th century to cores near Nansen Fjord. East Greenland, Jennings &
previous centuries, seasonal information in a pro y- Weiner (1996) confirmed ant initial cooling between
cliatereltio wil b reuired (van Engelen et al. 1270 and 1370, together with the most severe and vani-
2001). For example, van Engelen et al. (2001) sho d able climatic COniosarudteEtGenld
that when the historical reconstructed series from region from 1630 to 1900. The results of Ogilvie et al.
abou 80 to 000weie calibrated to the instrumental (2000) and Ogilvie & JMnsson (2001) suggest that the
temperature records at De Bilt, the 20th century winter overall climatic conditions in teNrhAlni
temperatures may have been slightly higher (ab ut (50-80o N, 0-600 W), especially near Iceland during
0.5CC-the quantitative information on the 20th cen- the 20th century, including the 1970s to 1990s, were
tury warmth is certainly within the margin of an- neither unusual nor extreme.
certainties) than the high winter temperatures of In the Mediterranean basin, the island of Crete ex-
1000110 bu tha reentwarming began in the 1 )th perienced many severe winters and prolonged droughts
century. in contrast, the 20th century summer tern er- during the wne n pigsaosbten14
atures are neither unusual nor extraordinarily wc rmn and 1648 (Grove & Conterio 1995). In Morocco, the cli-
when compared to summer temperature variabilfi es mate during the 16th, 17th and 18th centunies was gen-
during other times of the 2nd millennium (see Figs. 1 erally more variable, with frequently drier conditions,
& 2 of van Engelen et al, 2001). than in the early to mid-2Oth century (Till & Guiot
100 Clin Res 23: 89-110, 2003
1990). But no distinctive precipitation anomaly was 5.2.3. Asia and Eastern Europe
observed for Morocco during the Medieval Warm
Period, although just like conditions during the Little From 49 radiocarbon-dated subfossil wood samples,
Ice Age, an episode of notable drought occurred from Hiller et al. (2001) found that the alpine tree-limit on
1186 to 1234. Thus, precipitation anomahies for t e the Khibiny low mountains of the Kola Peninsula was
Little Ice Age and Medieval Warm Period do not diff r located at least 100 to 140 mn above current tree-limit
from each other in this region-both intervals suffere elevation during the relatively warmer time between
from persistent drought conditions. For this reason, Ie 1000 and 1300. The summer temperatures correspond-
gave an uncertain designation for the occurrence of a ing to this tree-line shift during this warm time are esti-
distinct climatic anomaly associated with Medley l mated to have been at least o.80 C warmer than today.
Warm Period for Morocco in Table 1 and Fig. 2. Based mostly on documentary evidence, Borisenkov
Distinctly cooler conditions prevailed over the ocean (1995) noted that Little Ice Age conditions began as
surface-in the Canibbean Sea by about 2 to 30 C(Wint r early as the 13th century in Russia with the character-
et al, 2000) and in the Sargasso Sea by about 1PC (Keig- istic of frequent climate extremes both in terms of
win 1996), especially during the 17th and 18th centuri 5 severe winters, rainy and cool summers, and sustained
as opposed to the present. DeMenocal et al. (200 ) droughts (up to a decade long). Middle Russia (around
showed that the subtropical North Atlantic's sea surfa e 50-600 N and 30-500 E) seems to have experienced the
temperature off Cap Blanc of Mauritania (west Afric i) coolest winters around 1620-1680, the coolest sum-
was also cooler by 3to 40C between 1300 and lOS0 thE n mers-springs around 1B60-1900, as well as distinc-
at present. During the Medieval Warm Peniod, the Sar- tively warm conditions during the first half of the 16th
gasso sea surface temperature was about 1 0C warm ~r century, similar to conditions for Western Europe
than the present-day value (Keigwin 1996), while the s a described above, The ground surface temperature his-
surface temperature off the coast of Maunitania was only tones deduced from boreholes around the Czech
marginally wanner than at present (DeMenocal et I. Republic suggest that winters duning 1600 and 1700
2000). H-igh-resolution coral skeletal 818 and Sr/Ca r a- were the most severe compared to any other winters
tio records from Bermuda indicate sea-surface tempera- since at least 1100 (Bodri & Cermdk 1999). The temn-
ture standard deviations of about ± 0.50 C on interannual perature-depth borehole records also yield a clear
and ±0,30C on dlecadal timescales during the 16th signature of an anomalously warm period for central
century, and those ranges of vaniability are comparable Bohemia, especially around 1100-1300.
to estimates from modern 20th century's instrumen al Bradley and Jones (1993) showed that the mnid-l7th
data (Kuhnert et al. 2002). But those sub-annually century was the coldest in China. In NE China, fre-
resolved coral proxy data also show that although the e quent occurrences of extremely dry conditions pre-
may be large-scale climate signals like the No th vailed during the 16th and 17th centuries (Song 2000).
Atlantic Oscillation detectable at Bermuda, no cone- The dry conditions returned again in the 20th century,
lation can be found with other northern-hemnispher c- and now cover a wider area (with indications including
wide proxy reconstructions because of large spat al the increasing number of days with no discharge from
differences in climate variability, the Yellow River; but these 20th-century events are
From sedimentary concentrations of titanium a id likely to be confused with other man-made factors).
iron, Haug et al. (200 1) inferred a very dry climate Jor Chan & Shi (2000) further documented the notably
the Cariaco Basin during the Little Ice Age and re a- larger number of land-falling typhoons over Guandong
tively wetter conditions in the Medieval Warm Penod. Province in the early-to-mid-l9th century based on a
Over the equatorial Central Pacific, around the homogeneous set of typhoon records from 1470 to
NINO3.4 (50 N-5 0 S, 1600 E-1500 W) region, Evans et 1931. Using a 8180 proxy record from peat cellulose
al. (2000), in thenr skillful reconstruction of the ENSD- with 20 yr resolution and various Chinese historical
like decadal variability of the NINO3.4 sea surface records, Hong et al. (2000) showed the general cooling
temperature (SST), showed that there appeared to be a trend in the surface air temperature during the Little
sustained cool phase of the proxy NINO3.4 SST vi- Ice Age interval in NE China, Hong et al. found 3 of
ability from about 1550 to about 1895, hence extend' ng the coolest minima in the record centered around
the geographical area covered by the Little Ice Age 1550, 1650 and 1750. An obvious warm period peaked
Climate Anomaly. Evans et al. (2000) also added t at around 1100-1200, coinciding with the Medieval
the reconstructed NINO3 .4 decadal-scale SST vdri- Warm Peniod. The study of documented cultivation of
ability prior to the 17th centr ssiia othat of ihe Citrus reticulata Blanco (a citrus tree) and Boehmnera
20th century, thus suggesting that the recent 20th c n- nivea (a perennial herb), both subtropical and temper-
tury decadal-scale changes in the equato lal Pactic ature-sensitive plants, duning the last 1300 yr showed
Ocean are neither unusual nor unpreceden ed. that northern boundaries for these plants had
Soon & Baliunas: Cilmati( and env onmental changes of the past 1000 years 101
shifted and expanded; their northernmost loc tion was 1930s-1950s drought, Additionally, both Yu & Ito
reached around 1264 (Zhang 1994). Zhang thea (1999) and Dean & Schwalb (2000) pointed to the
deduced that temperature conditions in the 13th cer- cycles of aridity lasting about 400 yr from lake records
tury around central China must have been about l'C of the Northern Great Plains, where the last dry con-
warmer than present. Ren (1998) found further ev.- dition peaked around 1550-1700.
dence from a fossil pollen record at Maihi Bog, N2 From an extensive collection of multiproxy evi-
China, that summer monsoon rainfall from 950 to 1270 dence, Stine (1998) concluded that duning the Medi-
must have been generally more vigorous in order eval Warm Peniod prolonged intervals of extreme
explain the high deposition of several pollen taxa drought visited California, the NW Great Basin,
which are otherwise unexplainable by human activit the northern Rocky Mountains/Great Plains, while
at those times, markedly wetter regimes persisted in the upper Mid-
Based on the less precise climate proxies like west/sub-Arctic Canada and Southern Alaska./Bntish
cherry blossom viewing dates, lake freezing datE s Columbia areas. There was also a significant but
and histonical documentation of climate hazards an brief interval around 1110-1140 when moisture con-
unusual weather, Tagami (1993, 1996) found that a ditions switched from dry to wet in California, the
warm period prevailed between the 10th and 14t NW Great Basin, the northern Rocky Mountains/
centuries, and a cold period between the late 15t Great Plains, and from wet to dry in the upper Mid-
and 19th centuries over large parts of souther west/sub-Arctic Canada and southern Alaska/British
Japan. From the study of number of days with sno - Columbia, The most likely explanation for this rapid
fall relative to days with rainfall, Tagamni (1996) and dramatic switch from wet to dry conditions in
concluded that the 11th and 12th centuries we e the upper Midwestern U.S. around 1100 is the con-
unusually warm in Japan. During the Little Ice Ag , traction and subsequent expansion of the circumpo-
summers were relatively cool from the 1730s to lar vortex. Summer polar fronts shifted significantly
1750s, in the 1780s, from the iSS0s to the 1840s a d southward, and stopped the penetration of moisture-
in the i1fi0s, and winters were cold through t e laden air from the Gull of Mexico (Bryson et al.
1680s to 1690s, and in the 1730s and 1810s. From t e 1965). Stinle (1998) added the requirement of a con-
tree-cellulose 8'3C record of a giant Japanese cedar comitant jet-stream -change, from zonal to azonal, in
Cryptomneha japonica grown on Yakushima Island f order to explain the distinct observed differences of
southern Japan, Kitagawa & Matsumoto (1995) the moisture patterns between the upper Midwest
inferred a cool temperature of 20C below avera e and southern Alaska/British Columbia. Graumlich
from 1600 to 1700 and a warm period of about 1 C (1993)'s reconstruction of summer temperature and
above average between 800 and 1200. winter precipitation from trees in the Sierra Nevadaconfirmed the overall warm and dry conditions
for California during medieval times, when the 2
5.2.4. North America warmest and the 2 dniest 50 yr intervals occurred,
at 1118-1167, 1245-1294 and 1250-1299, 1315-1364,
Overall, the composite summer temperature anlo - respectively.
aly from Bradley & Jones (1993) showed that over H-u et al, (2001), based on their high-resolution (mul-
North America the temperature during the 15th to 17 ~h tidecadal) geochemnical analysis of sediments from
centuries was 1PC cooler than the average of the rf f- Farewell Lake by the NW foothills of the Alaska
erence period 1860-1959. over the southern Sierra Range, also found pronounced signatures of the
Nevada, California, Graumlich (1993) found that t e Medieval Warm Period around 850-1200. Duning the
coolest 50 yr interval in the 1000 yr tree-ring procy Little Ice Age the surface water temperature of
record was around 1595-1644, while the wettest 50 yr Farewell Lake suffered a low in 1700 calibrated to be
period was 1712-1761. These periods are consistent about 1.750 C cooler than present. They also noted
with our definition of a discernible climatic anomaly es- that colder periods were in general wetter (in contrast
sociated with the Little Ice Age interval of 1300-19 0. to drier conditions duning Little Ice Age in the Central
Ely et al. (1993) noted from river records in Arizoia U.S. region described above) than the warm peniods
and Utah that the most extreme flooding events in this part of NW Alaska. On the Yucatan Penin-
occurred during transitions from cool to warm dlim te sula, prolonged drought episodes recur approximately
conditions, especially during the late 1800s to ea l1y every 208 yr. with the 2 most significant recent peaks
1900s, For the Central U.S.A. (33-49O N, 91-1090 ), centered around 800 and 1020 (Hodell et al. 2001). The
drought episodes were noted for the 13th to 16th CE n- timing df severe droughts also seems to fit several
tunies (Woodhouse & Overpeck 1998). These droug ts known discontinuities in the evolution of the Mayan
were of longer duration and greater extent than te culture.
102 Clim Res 2 3:89-110, 2003
5.3. Southern Hemisphere about 3-4 0C warmer than present around 1200-1300
(Tyson et al. 2000). The multiproxy review by Tyson &
Figs. 1-3 highlight the sparse coverage of the South- Lindesay (1992) showed evidence for a wetter South
ern Hemisphere by proxy climatic information through Afnica after 1000, when forest and wetland become
the 2nd millennium, more extensive, including the development of a river-
ime forest in the northern Namib desert along the
Hoanib river during the 1 lth-l3th centuries.
5.3.1I. New Zealand
In New Zealand, the 8180 concentration in a stalag 5.3.3. South America
mite record from a cave in NW Nelson showed thE
coldest times during the Little Ice Age to be arounc over southern South America's Patagonia, the Little
1600-1700, while exceptionally warm temperature! Ice Age's climatic anomalies, as deduced from tree ring
occurred around 1200-1400, in association with th( records, were manifest as cold and moist summers with
general phenomenology of the Medieval Warm Perio( the most notable, persistent century-long wet intervals
(Wilson et al. 1979). The cooling anomaly aroun( centered around 1340 and 1610 (Villalba 1994). From
1600-1700 apparent in the 58'0 stalagmite recor, a multiproxy study of lacustrine sediments at Lake
coincides with the smallest growth ring (i.e. coole t Aculeo (about 340S; 50 kin southeast of Santiago,
period) for the silver pine Lagarostro bus colensoi fror Chile), Jenny et al. (2002) found a period of greatly
Mangawhero of the North Island. However, at Ahauri increased flood events centered around 1400-1600
in the South island, the smallest ring width index of th 2 (and in 3 other intervals: 200-400, 500-700 and
600 yr record occurred about 1500-1550 (DArngo et 1850-1998), which could be interpreted as increased
al. 1998). Williams et al. (1999) advise caution in intei - winter rains from enhanced mid-latitude westerhies
preting stable isotope data from New Zealand, espe- that ushered in more frontal system activities. In con-
cially the correctional functional relations amon trast, during the Medieval Warm Period, the southern
temperature, precipitation and 8180 data (which a e Patagonia region at latitudes between 47 and 5105 be-
strongly influenced by oceans surrounding New came abnormally dry for several centuries before 1130
Zealand) from Waitomo, North Island's speleothems. when water levels in several lakes (Lake Argentino,
The mean annual temperatures at Waitomno from Lake Cardiel and Lake Ghio) dropped significantly.
1430-1670 were deduced, based on the analysis Of Also, trees like the southern beech Nothofagus sP.
8180 data from Max's cave stalagmite, to be abo it grew as old as 100 yr in the basin of these lakes before
0.8 0C cooler than today. being killed by reflooding of the lakes (Stine 1994).
Slightly north toward the central region of Argentina
(around C6rdoba Province), Carignano (1999), Cioccale
5.3.2. South Africa (1999) and Iriondo (1999) noted the prevailing conditions
for the advancement of the Andean glaciers during the
Tyson et al. (2000) showed through isotopic measu . Little Ice Age, with 2 distinct cold and dry intervals
ments in speleothem that the interior region of South around the 15th to 16th, and the 18th to the early 19th
Africa, near the Makapansgat Valley (eastern part of centuries. The significant climate aridification and de-
South Africa), had a maximum cooling Of about 1 IC terioration in central Argentina (in contrast to the more
around 1700 compared to the present. This cooling fE a- humid conditions and increased flood frequency in cen-
ture corresponds well with the maximum cooling sig Lai tral Chile near Lake Aculeo) during the Little Ice Age in-
contained in a coral record from SW Madagas ar terval is supported by the formation of large, parabolic
(Tyson et al. 2000). Tyson & Lindesay (1992) show d sand dunes 150-200 in long, 60-80 mn wide, and 2-3mi
that the Little Ice Age in South Africa had 2 major coDI- high in the Salinas Grandes basin (Carignano 1999).
ing phases, around 1300-1500 and 1675-1850, with a Menhl h a hqia aewstasomdit
sudden warming interval between 1500 and 1675. In a swamp surrounded by dunes in the 18th century. Today
addition, Tyson & Lindesay suggested a weakening of Mar Chiquita is the largest lake in Argentina, covering a
the tropical easterlies that increased the incidence of surface area of 6000 km2 and with a depth of 13 mn (Iri-
drought during the Little Ice Age in South Africa-'V ith ondo 1999). The climatic conditions during the Medieval
a relatively drier condition for the summer rainfall re- Warm Peniod around Central Argentina were generally
gion in the northeast, but a wetter condition for he warmer and more humid than at other times in the 2nd
winter rainfall region near the coastal Mediterran an millennium, when the dune fields were conquered by
zone in the southwest, At Makapansgat Valley, hfe lakes and the Mar Chiquita. Lake expanded beyond its
Medieval Warm Period peaked with a teinperat ire present dimensions. Precipitation exceeded current vatl-
Soon & Ballunas: Climatic and environmental changes of the past 1000 years 103
uies, and the mean local temperature may have bee a sea-ice conditions, coinciding with the Medieval Warm
about 2.50C warmer, perhaps because of the southiward Period. In the same record, Domnack and colleagues
shift of the tropical climate belt into this area (Iriond found a decrease in bio-productivity, hence an mn-
1999). The northern part of C6rdoba Province was in- crease mn magnetic susceptibility owing to less dilution
vaded by the eastern boundary of the Chaco Forest, of the magnetic minerals by biogenic materials, from
which is located hundreds of krns to the northwest toda y about 700 to 100 yr BP. This time period corresponds to
(Carignano 1999). Cioccale (1999) noted evidence of hu- the Little Ice Age of ca. l4th-l9th centunies and is
man cultivation of hillside areas in Central Andes, Per , likely to have been accompanied by cool and windy
at places as high as 4300 mn above sea level around 100 ., conditions. Abundance analyses of Na± sea salt in the
ice core from Siple Dome (81.650 S, 148.810 W) also
confirm the Little Ice Age anomaly charactenized by
5.3.4. Antarctica substantial variability in the strength of mneridional cir-
culation that extended between 1400 and 1900 (Kreutz
The last important source of geographical informa- et al. 1997).
tion for conditions during the Medieval Warm Peric d But there are also indications for significant regional
and the Little Ice Age in the southern hemisphere s differences in climatic anomalies associated with the 2
obtained from glaciers, ice cores and sea sedimems phenomena at Antarctica. The temperature at Siple
studies on and around Antarctica. Although mai y Station (75.92'S, 84.250 W, elevation 1054 mn) was
notable physical, biological and environmental chang !s relatively warm from the 15th to early 19th centunies
have recently occurred there, especially around t e (although there were also noticeable decade-long
Antarctic Peninsula durnug the last 50 yr (Mercer 197 3, cooling dips centered around 1525, 1600 and 1750;
Thomas et al. 1979, Rott et al. 1996, Vaughan & Doal e Mosley-Thompson 1995). The 400 yr isotopic tern-
1996, Smith et al. 1999, Doran et al. 2002, Marshall t perature inferred from a core at the Dalinger Dome
al. 2002), most of the 20th-century changes contain d (64,220 S, 57.680 W, elevation. 1640 mn) on James Ross -
in the proxy records discussed here cannot be consil- Island, off the Antarctic Peninsula, also showed
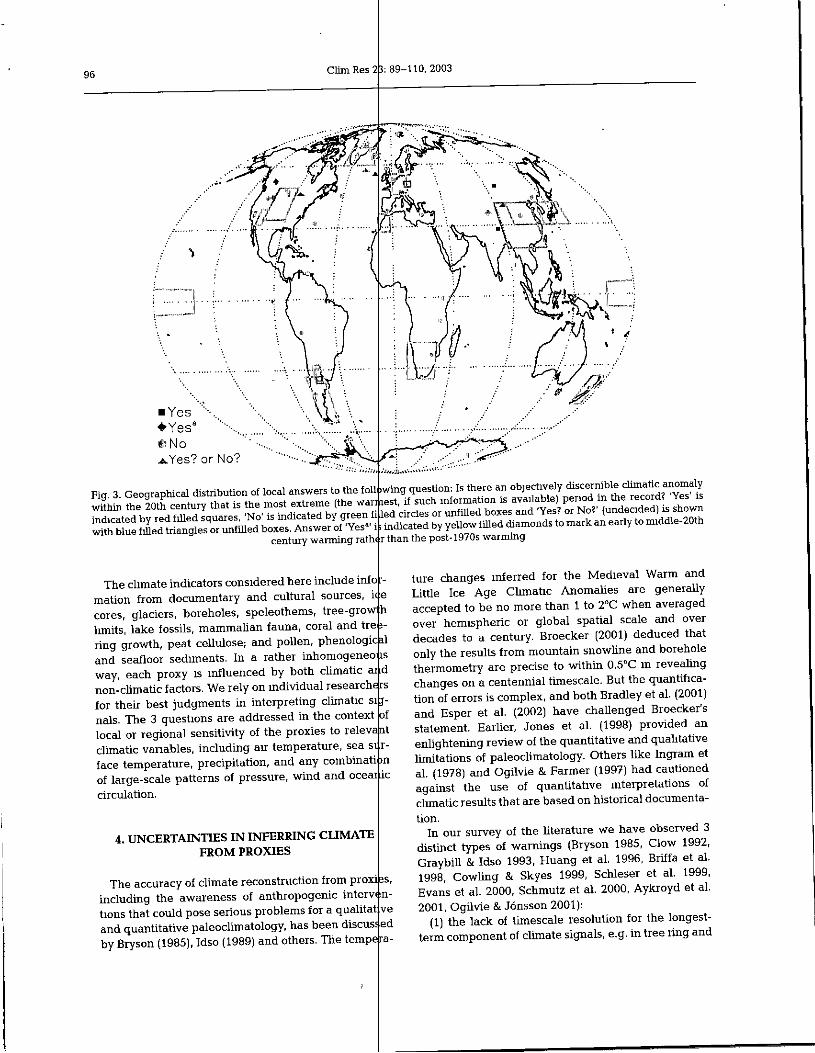
ered extreme or unusual (see Fig. 3, also Vaughan & 1750-1850 to be the warmest interval, followed by a
Doake 1996, D. Evans 2000). cooling of about 20C since 1850 and continuing to 1980
For the Little Ice Age, advances of glaciers in South (Aristarain et al. 1990). A recent borehole tempera-
Georgia Island, which is currently hall-covered )y lure reconstruction from Taylor Dome, east Antarctica
glaciers, began after the late 13th century, with a Pe ik (77.80 S, 158.720 E, elevation 2374 in), also reported the
advancement around the l8th-2Oth centuries (Clap- same inverted temperature anomalies, during which
perton et al. 1989). Glacier retreats occurred afe the Little Ice Age interval was about 20C warmer, while
about 1000, which corresponds to the tuning for t ie the coldest temperature of the past 4000 yr was reached
Medieval Warm Period. Baroni & Orombelli (19! 4) around 1000 (Clow & Waddington 1999); note that we
described a similar sequence for glacier advances a id have omitted these discussions in our Table 1 or Figs. 1
retreats during the Little Ice Age and Medieval Wa mn to 3 because the results are claimed as preliminary and
Period for the Edmonson Point glacier at the Te ra they were only presented in a conference abstract.
Nova Bay area of Victoria Land on the Antarctic con ti-
nent (East Antarctica). The Edmonson Point glac er
retreated in 2 distinct phases, around 920-1020 ad 6. DISCUSSION
1270-1400, and then advanced at least 150 mn after hedecasmbd
15th century. isotopic thermometry from ice cores at The widespread geographical evidec sebe
Dome C (74.650 S, 124.170EF, elevation 3240 in) ad here supports the existence of both the Little Ice Age
Law Dome (66.73' S, 112.830 E, elevation 1390 mn) both and the Medieval Warm Period, and should serve as
indicate cooler and warmer anomalies for the Little ce useful validation targets for any reconstruction of
Age and Medieval Warm Period respectively (Ben ist global climate history of the last 1000 yr. our results
et al. 1982, Morgan 1985). High-resolution records of suggest a different interpretation of the multiproxy cli-
magnetic susceptibility from deep sea cores (Domack mates compared to recent conclusions of Mann et al.
& Mayewski 1999, Domack et al. 2001) drilied n ar (1998, 1999, 2000). Because the calibration of proxy
Palmer Deep site (64.860 S, 64.210 W) off the At- indicators to instrumental data is stiil a matter of open-
arctic Peninsula also show a marked increased, in io- ended research (with differing sensitivities not only for
productivity, hence a decrease in magnetic suscepti- the same proxy at different locations but also for differ-
bility because of dilution of the magnetite, with a p ak ent proxies at the same location), it is premature to
centered around 1000-1100 yr HP. This observation select a year or decade as the warmest or coldest in a
probably implied warm temperatures and minmal multiproxy-based record.
104 Chin Res 23: 89-110, 2003
Barnett et al. (1999) has pointed out that it is impo, - An important aspect of both the Briffa et al. (2001)
sible to use available instrumental records to provid and Esper et al. (2002) studies is the new derivation of
estimates for the multi-decadal and century-long typ formal, time-dependent standard errors for their tern-
of natural climatic variations, owing to the specifi perature reconstructions, amounting to about ± 0.1I to
period and short duration of instrumental records. 0.3 0C from 1000 through 1960 (see also Jones et al.
Thus, paleo-proxies remain the only hope for assessin 1999, 2001). This assignment of standard errors con-
the amplitude and pattern of climatic and environmer - trasts with those assigned in Mann et al.'s (1999) an-
tal change in the pre-anthropogenic era. We agre nually-resolved series, where the uncertainties were
with Barnett et al. (1999) that each proxy should be assigned only for pre-instrumental data points in their
studied first in terms of local change before sever I original publication (that assumption of 'error-free' in-
records can be combined for regional and larger Spa- strumental thermometer data is incorrect-see Jones
tial-scale analyses and interpretations. The conclusio et al. 1999, Folland et al. 2001). over the full 2nd mill-
derives mainly from the real possibility of non-station- lennium, Esper et al. (2002) deduced a slightly larger
arity in the proxy-climate calibration to instrumenta1 range in their confidence limits after 1950 (compared
records, the lack of adequate superposition rules given to the pre-1950 interval extending back to 800) and
vaniability in each type of proxy, as well as the lack f attributed those higher uncertainties to the accounting
clear physical understanding on the multidlecadal c i- for the anomalous modern ring-growth problem (Gray-
mate variability from theoretical or empinical studiE . bill & Idso 1993, Jacoby & DArrigo 1995, Briff a et al.
AlU current calibration of proxies to large-scale instr r- 1998, Feng 1999, Barber et al. 2000, Jacoby et al. 2000,
mental measurements have been mainly valid ov ~r Kniapp et al. 2001).
phases of rising temperature (Ogilvie & JMnsson 200 ).
The concern is that a different calibration response aris ~swhen the procedure is extended to an untested china 7. CONCLUSION
regime associated with a persistent cooling phase. Evai istegorpia
et al. (2002) worried about the reality of spuriois Many interesting questions on tegorpia
frequency evolution that may contaminate a multiproly nature and physical factors of surface temperature
reconstruction, in which the type of proxy data chang ~s or precipitation changes over the last 1000 yr cannot
over time and no sufficient overlap of proxy data exif ts be quantitatively and conclusively answered by cur-
for a proper inter-proxy calibration/validation proce- rent knowledge. The adopted period of 1000 yr is
dure. In other words, each proxy may have its distic ct strictly a convenience that merits little scientific
frequency response function, which could confuse t ie weight.
interpretation of climate variability. Finally, anot er Climate proxy research provides an aggregate, broad
concern is the lack of understanding of the air-s a perspective on questions regarding the reality of Little
relationship at the multidecadal timescale, even in t re Ice Age, Medieval Warm Period and the 20th century
reasonably well observed region of the North Atlan ic surface thermometer global warming. The picture
(H-akkinen 2000, Seager et al. 2000, Marshall et al. 2001, emerges from many localities that both the Little Ice
Slonosky &Yiou 2001,von Storch et al. 2001). Age and Medieval Warm epoch are widespread and
Briffa (2000) concluded that dendroclilnatological near-synchronous phenomena, as conceived by Bryson
records may support 'the notion that the last 100 ye rs et al. (1963), Lamb (1965) and numerous researchers
have been unusually warm, at least within the cont xt since. Overall, the 20th century does not contain the
of the last two millennia' Slightly later, Briff a et al. warmest anomaly of the past millennium in most of the
(2001), by adopting a new analysis procedure t at proxy records, which have been sampled world-wide.
seeks to preserve greater, long timescale variability Past researchers implied that unusual 20th century
(which shows a notable increase in variance at the warming means a global human impact. However, the
24-37 yr timescale compared with a previous Stan- proxies show that the 20th century is not unusually
dlardlization procedure) in their tree-ring density d ta warm or extreme.
than previously possible, stated that the 20th centurv is The lack of unusual warmth in the 20th century does
the globally warmest century of the last 600 yr. Tis not argue against human impacts on local and regional
conclusion is consistent with the borehole reconstr Ic- scales (perhaps on scales as small as 10 to 1000 kin 2 for
tion results of Huang et al. (2000). However, Ion er precipitation and io4 to io5 kmn2 for temperature).
and more carefully reconstructed tree-ring chronclo- Recently, Lawton et al. (2001) demonstrated how the
gies from Esper et al. (2002) showed that the Medieval deforested areas of tropical lowlands can, in coin-
Warm Period was as warm as the 20th century foi at bination with favorable topographical conditions and
least a region covering the Northern Hemisphere altered atmospheric air flow across the landscape, sig-
extratropics from about 30 to 700 N. nificantly raise the bases of convective and orographic
Soon & BaliunaS: Climatic and eny; onnientall changes of the past 1000 years 105
clouds around the Monteverde mnontane cloud forest; change: a status report. Bull Am Meteor Soc 80:2631-2659
of Costa Rica during the dry season, and thus drasti Baron C, Orombelli G (1994) Holocene glacier vaniations inthe Terra Nova Bay area (Victoria Land, Antarctica).
cally impact local ecosystems. It is thus clear tha Antarctic Sci 6:497-505
humtan activity affects local environment and climat . Beltrann H, Taylor AEl (1995) Records of climatic change in
On the other hand, A. T. Grove (2001) advised caution the Canadian Arctic: towards calibrating oxygen iso-
when interpreting dubious claims about the dominat tope data with geothermal data. Glob Planet Change 11:
role played by human activity such as in deforestation, 127-138BeltranM H, Chapman DS, ArchambaUlt 5, Bergeron Y (1995)
agricultural expansion and population growth on goc - Reconstruction of high resolution ground temperature
morphological changes in Mediterranean Europe. la histonies combining dendrochronological and geothermal
particular, A. T. Grove (2001) showed that the wide data. Earth Planet Sci Left 136:437-445
spread occurrence of the medieval fluvial terrac Beltraim It Wang J, Bras RL (2000) Energy balance at the
calle the'youner fll' roundMedierranan Erope Earth's surface: heat flux history mn eastern Canada. Ceo-
calle the'youger fll' roun Medierraean uropphys Res Lett 27:3385-3388
was more powerfully influenced by increased fre- Benoist .JP, Jouzel J, Lorius C, Merlivat L, Pourchet M (1982)
quency of deluges during Alpine glacier advancE s Isotope climatic record over the last 2.5 ka from Dome C,
associated with the Little Ice Age than by soil erosio Antarctica, ice cores. Ann Claciology 3:17-22
and rapid sedimentation caused by deforestation. Bernabo JC (1981) Quantitative estimates of temperaturechanges over the last 2700 years in Michigan based on
pollen data. Quit Res 15:143-159
Acknowledgements. This work was supported by funds fro Bianchi CC, McCave IN (1999) Holocene periodicity in North
the American Petroleum Institute (01-0000-4579). the Ar Atlantic climate and deep-ocean flow south of Iceland.
Force Office of Scientific Research (Grant AF49620-02-1- Nature 397: 515-517
0194) and the National Aeronautics and Space Admninistrati n Biondli F, Perkins DL, Cayan DR, Hughes MK (1999) July tem-
(Grant NACS-7635). The niews expressed herein are those f perature during the second millennium reconstructed
the authors and are independent of the sponsoring agencic S. from Idaho tree nings. Geophys Res Lett 26: 1445-1448
We have benefitted greatly from the true and kind spirit 3f Black DE, Peterson LC, Overpeck JT, Kaplan A, Evans MN,
research communications (including a preview of th ir Kashgarian M (1999) Eight centunies of North Atlantic
thoughts) with the late Jean Grove (who passed away on Ja a- Ocean atmosphere variability. Science 286: 1709-1713
uary 18, 2001), Dave Evans, Shaopeng Huang, Jim Kenne , Blackford JJ, Chambers FM (1995) Proxy climate record for
Yoshio Tagami and Referee #3. We thank John Daly, Dia e the last 1000 years from Irish blanket peat and a possible
Douglas-Dalziel, Craig and Keith Idso for their unselfish co link to solar variability. Earth Planet Sdt Left 133:145-150
tributions to the references. We also thank the Editor, Ch is Bor L~, CermAk (1999) Climate change of the last millennium
de Freitas, for very helpful editorial changes that improv d inferred from borehole temperatures: regional pafterns of
the manuscript. We are very grateful to Maria McEachemn, climatic changes in the Czech Republic. Part mI. Glob
Melissa Hilbert, Barbara Palmer and Will Craves for invalu- Planet Change 21:225-235
able library help, and both Philip Gonzalez and Lisa Linai te Bond C, Showers W, Cheseby M, Lotti R and 6 others (1997) A
for crucial all-around help. pervasive millernnial-scale cycle mn North Atlanticholocene and glacial clunates. Science 278:1257-1266
Bond C, Showers W, Elliot M, Evans M, Lotti R, Hajdas I,
LITERATURE CITED Bonani G, Johnson S (1999) The North Atlantic's 1-2 kyrclimate rhythm: relation to Heinrinch events, Dansgaardl
Andr6n E, Andrdn T, Sohlenius G (2000) The Holocene I s- Oeschger cycles and the little ice age. In Clark PU, Webb
tory of the southwestern Baltic Sea as reflected in se ]- RS, Reigwin LD (eds) Mechanisms of global climate
ment core from the Bornholm Basin. Boreas 29:233-25( change at millennial tune scales, Vol 112. American Geo-
Aristarain AJ, Jouzel J, Lonus C (1990) A 400 years isotc pe physical Union Press, Washington DC, p 3 5 -58
record of the Antarctic Peninsula climate. Ceophys Res Borisenkov YeP (1995) Documentary evidence from the
Left 17:2369-2372 U.S.S.R. In: Bradley RS, Jones PD, (eds) Climate since A.D.
Arseneault D, Payette S (1997) Reconstruction of mllena fat 1500. Routledge, New York, pl17 1-18 3 e'sm rtmpr
forest dynamics from tree remains in a subarctic tree I e Bradley RS, Jones PD) (1993) 'Little Ice Agel umrfepr
peatland. Ecology 78:1873-1883 ature variations: their nature and relevance to recent
Aykroyd RG, Lucy D, Pollard AM, Carter AHC, Roberts I global warmning trends. Holocene 3:367-376
(2001) Temporal variability in the strength of the pro y- Bradley RS, Briff a KR, Crowley TJ, Hughes MR. Jones PD,
climate correlations. Geophys Res Lett 28:1559-1562 Mann ME (2001) The scope of Medieval Warming. Sci-
Barber VA, Juday GP, Finney BP (2000) Reduced growth of ence 292:2011-2012
Alaskan white spruce in the twentieth century from tc m- Briffa KR (2000) Annual climate variability in the Holocene:
perature-induced drought stress. Nature 405:668-673 interpreting the message of ancient trees, Quat Sci Rev 19:
Barclay DJ, Wiles CC, Calkin PE (1999) A 1119-year tree- 87-105
ring-width chronology from western Prince Willam Briffa KR, Jones PD, Bartholin TS, Eckstein D, Schweingruber
Sound, southern Alaska. Holocene 9:79-84 FH, Karlen W, Zetterberg P, Eronen M (1992) Fennoscan-
Barlow LK, Sadler JP, Ogilvie AEJ, Buckland PC and 5 otl ers dian summers from AD 500: temperature changes on short
(1997) Interdisciplinary investigations of the end of the and long timescales. Chin Dyn 7:111-119
Norse Western Settlement in Greenland. Holoc ne Briff a KR, Schweingruber FE, Jones PD, Osborn TJ, Harris
7:489-499 IC, Shiyatov SC, Vaganov EA, Grudd H (1998) Trees tell of
Barnett T, Hasselmann K, Chelliah M, Delworth T and 76th- past climates: but are they speaking less clearly today?
ers (1999) Detection and attribution of recent ch ate Phil Trans R Soc Lond B 353:65-73
106 Cilun Res 23: 89-110, 2003
Briff a KR, Osborn TJ, Schweingruber FH, Harris IC, Jon s Dansgaard W, Johnsen SJ, Reeh N, Gundestrup N, Clausen
PD, Shiyatov SG, Vaganov BA (2001) Low-frequency tem- HE, Hammer CU (1975) Climatic changes, Horsemen and
perature variations from a northern tree-ring density ne:- modern man. Nature 255:24-28
work. J Geophys Res 106:2929-2941 DArrigo RD, Cook ER, Salinger J, Palmer J1, Buckley BM,
Broecker WS (2001) Was the medieval warm period globas Krusic PJ, Villalba R (1998) Tree-ning records from New
Science 291:1497-1499 Zealand: long-term context for recent warming trend.
Bryson RA (1985) On climatic analogs in paleoclimatic recoi - Chin Dyn 14:191-199
struction. Quat Res 23:275-286 DArrigo RD. Jacoby G, Frank D, Pederson N and 5 others
Bryson RA, Bryson RU (1997) High resolution simulations )f (2001) 1738 years of Mongolian temperature variability
regional holocene climate: North Africa and the Near Ba t. inferred from a tree-ring width chronology of Sibenian
In: Dalies I-N, Kukla G, Weiss H (eds) Third milleniunm BC Pine, Geophys Res Lett 28:543-546
climate change and the Old World collapse. NATO AI Davis OK (1994) The correlation of summer precipitation in
Series, Vol. 149. Springer-Verlag, Heidelberg, p 565-593 the southwestern USA with isotopic records of solar activ-
Bryson RA, Arakawa H, Aschmandn HH, Baerris DA and 16 ity during the Medieval Warm Period. Chin Change 26:
others (1963) NCAR Technical Note In: Bryson RA, Julian IP 27 1-287
(eds) Proc Coaf Climate of the I11th and 16th Centuries, A- Dean WE, Schwalb A (2000) H-olocene environmental and cli-
pen CO, June 16-24 1962, National Center for Atmosphe ic matic change in the Northern Great Plains as recorded in
Research Technical Notes 63-1, Boulder CO the geochemnistry of sediments in Pickerel Lake, South
Bryson RA, Irving WN, Larsen JA (1965) Radiocarbon and s II Dakota. Quat Int 67:5-20
evidence of former forest in the Southern Canadian Tum- deMenocal p (2001) Cultural responses to climate change
dria. Science 147:46-48 during the late Hzolocene. Science 292:667-673
Calkin PB, Wiles GC, Barclay DJ (2001) Holocene coas al deMenocal P, Ortiz J1, Guilderson T, Sarnthein M (2000)
glaciation of Alaska. Quat Sci Rev 20:449-461 Coherent high- and low-latitude climate variability during
Cangnano CA (1999) Late Pleistocene to recent chimatic the H-olocene warm period. Science 288:2198-2202
chance in C<5rdoba Province, Argentina: geomorphologi- Domack EW, Mayewski PA (1999) Bi-polar ocean linkages:
cal evidence. Quat Int 57-58:117-134 evidence from late-holocene Antarctic marine and Green-
Chan JCL, Slu JE (2000) Frequency of typhoon landf 1 land ice-core records. Holocene 9:247-251
over Cuangdong province of China during the Pei d Domack E, Leventer A, Dunbar R, Taylor F, Brackfeld 5, Sjun-
1470-1931. mInJ Chin 20:183-190 neskog C plus ODP Leg 178 Team (2001) Chronology of
Croccale MA (1999) Climatic fluctuations in the central regi n the Palmer Deep site, Antarctic Peninsula: a holocene
of Argentina in the last 1000 years. Quat Int 62:35-47 palaeoenvironflental reference for the circum-Antarctic,
Clapperton CM, Sugden DE, Birnie J, Wilson MS (1989) La e- Holocene 11:1-9
glacial and holocene glacier fluctuations and environum n- Doran PT, Priscu JC, Lyons WB, Walsh JE and 9 others (2002)
tal change on South Georgia, Southern Ocean. QuatI es Antarctic climate cooling and terrestrial ecosystem
31:210-228 response. Nature 415:517-520 (see also exchanges
Clow GD (1992) The extent of temporal smearing mn surfa e- between Turner et al. and Walsh, Doran et al. (2002) in
temperature histories derived from borehole temperat re Recent temperature trends in the Antarctic. Nature
measurements. Palaeogeogr Palaeoclim Palaeoecol )8: 418:291-292)
81-86 Druffel EM (1982) Banded corals: Changes in Oceanic car-
Clow CD, Waddington ED (1999) Quantification of natural :I- bon-14 during the Little Ice Age. Science 218:13-19
mate variability in Central Greenland and East Antarct ica Dyurgerov MB, Meier MF (2000) Twentieth century climate
using borehole paleothermoinetry (abstract). Internatio ial change: evidence from small glaciers. Proc Natl Acad Sci
Union of Geodesy and Geophysics XXII General AssE i- USA 97:1406-1411
bly Abstract Book: B249, Birmingham UK Ely LL, Enzel Y', Baker VRZ, Cayan DR (1993) A 5000-year
Cohen AL, Tyson P'D (1995) Sea-surface temperature fluct la- record of extreme floods and climate change in the south-
tions during the Holocene off the south coast of Africa: - western United states. Science 262:410-412
plications for terrestrial climate and rainfall. Holocenc 5: Esper 5, Cook ER, Schweingruber FH (2002) Low-frequency
304-312 signals in long tree-ring chronologies for reconstructing
Collins M, Osborn Ti, Tett SFB, Briff a KR, Schweingruber FH past temperature variability. Science 295:2250-2253
(2002) A comparison of the variability of a climate model Evans DJA (2000) Ice in a greenhouse: the impacts of global
with paleotemperature estimates from a network of tree- warming on world glacier cover. Trans Inst Engineers and
ring indices. J Chun 15:1497-1515 Shipbuilders in Scotland 143:11-19
Cook ER, Buckley EM, DArrigo RD, Peterson MS (2 00) Evans MN, Kaplan A, Cane MA, Villalba R (2000) Globality
Warm-season temperatures since 1600 BC reconstructed and optrimalaty in climate field reconstructions from proxy
from Tasmanian tree rings and theft relationship to la e- data. In: Markgraf V (ed) Inter-hemispheric climate link-
scale sea surface temperature anomalies. Chin Dyn 16: ages. Academic Press, San Diego, CA p 53- 7 2
79-91 Evans MN, Kaplan A, Cane MA (2002) Pacific sea surface
Cowling SA, Skyes MT (1999) Physiological sigoificance of temperature field reconstruction from coral 518O data using
low atmospheric CO, for plant-climaite interactions. Cuat reduced space objective analysis. Paleocean 17:10.1029/
Res 52:237-242 (See additional research exchanges in 2000PA000590
Quat Res 53:402-404 and Quat Res 53:405-406) Feng X (1999) Trends in intrinsic water-use efficiency of
Crowley TJ, Lowery TS (2000) How warm was the medi val natural trees for the past 100-200 years. Geochimica et
warm period? Amabio 29:51-54 Cosmochim Acta 63:1891-1903
Dahli-Jensen D, Mosegaard K, Gundestrup N, Glow 3), Peng X, Epstein 5 (1994) Climatic implications of an 8000-
Sohnsen SJ, Hansen AW, Balling N (1998) Past temp ara- year hydrogen isotope time series from Bristlecone Pine
tures directly from the Greenland ice sheet. Sci nce trees. Science 265:1079-1081
282:268-271 Filippi ML, Lambert P, Hunziker J, Kulbjer B, Bernasconi S
Soon & Badtiunas: Climatic and env ronmental changes of the past 1000 years 107
(1999) Climatic and anthropogenic influence on the stabl year 180~ time-series of Chinese peat cellulose. Holocene
isotope record from bulkc carbonates and ostracodes to 10:1-7
Lake Neuchaltel, Switzerland, during the last two millenlia. Hu PS, Ito E, Brown TA, Curry BB, Engstrom DR (2001) Pro-
J Paleolim 21:19-34 nounced climatic variations in Alaska during the last two
Folland CK, Rayner NA, Brown SJ, Smith TM and 7 othe s mallenia. Proc Nall Acad Sa USA 98:10552-10556
(2001) Global temperature change and its uncertaintiE s Huang 5, Shen PY, Pollack HN (1996) Deriving century-long
since 1861. Geophys Res Lett 28:2621-2624 trends of surface temperature change from borehole temn-
Granllnlich UJ (1993) A 1000-year record of temperature and peratures. Geophys Res Left 23:257-260
precipitation in the Sierra Nevada. Quat Res 39:249-2 5 Huang 5, Pollack HN, Shen PY (1997) Late Quaternary tem-
Graybill DA, Idso SB (1993) Detecting the aerial fertilizatid perature changes seen in the world-wide continental heat
effect of atmospheric CO, enrichment in tree-ring chrono- flow measurements. Geophys Res Lett 24:1947-1950
logies. Glob BioGeoChem Cyc 7:81-95 Huang 5, Pollack HN, Shen PY (2000) Temperature trends
Grissino-MayerHMD (1996) A2129-year reconstruction of pr - over the past five centuries reconstructed from borehole
cipitation for northwestern New Mexico, USA. In Dean temperatures. Nature 403:756-758
JS, Meko DM, Swetnam TW (eds) Tree rings, environ- Huffman TN (1996) Archaeological evidence for climatic
ment and hurnaraty , Radiocarbon (U Arizona Press), Tu - change during the last 2000 years in Southern Africa. Quat
son, p 191- 2 0 4 Int 33:55-60
Grove AT (2001) The'Little Ice Age'and its geomorphologicl Hughes MK, Diaz HF (1994) Was there a 'Medieval Warm
consequences in Mediterranean Europe. Chin Change 4: Period', if so, where and when? Chim Change 26:109-142
121-136 Idso SB (1989) Letter to the editor-a problem for paleo-
Grove JM (1996) The century time-scale. In: Driver TS, Cha - clumatology? Quat Res 31:433- 4 3 4
man GP (eds) Time-scales and environmental change. Ingram MJ, Underhill DJ, Wigley TML (1978) Historical cli-
Routledge, London p 3 9 -8 7 matology. Nature 276:329-334 eSuhAeia
Grove JM (2001a) The initiation of the Little Ice Age *n Iriondo M (1999) Climatic changes in theSuhA ria
regions round the North Atlantic. Chin Change 48:53- 32 plains: records of a continent-scale oscillation. Quat Int
Grove JM (2001b) The onset of the Little Ice Age. In: Jones 57-58:93-112
PD, Ogilvie AEJ, Davies TD, Briffa KR (eds) History a d Jacoby GC, DArrigo RD (1995) Tree-ring width and density
climnate-memories of the future? Kluwer Acadec evidence for climatic and potential forest change in
Publishers, New York p 153-185 Alaska. Glob Biogeochem Cyc 9:227-234
Grove JM, Conterio A (1995) The climate of Crete in tie Jacoby GC, D'Arngo RD, Davaaiarms T (1996) Mongolian
sixteenth and seventeenth centuries. Cdin Change 0: tree rings and 20th-century warming. Science 273:
223-247 771-773
Grove JM, Switsur R (1994) Glacial geological evidence or Jacoby GC, Lovelius NV, Shumnilov 01, Raspopov OM, Kar-
the medieval warm period. Clim Change 26:143-169 bainov JM, Frank DC (2000) Long-term temperature
Madly EA (1996) Influence of late-Holocene climate on Nor h- trends and tree growth in the Taymirt region of northern
emn Rocky Mountain mammals. Quat Res 46:289-310 Siberia, Quat Res 53:312-318
H~kknen5 (000 Deada ai-sea interaction in the No th Jennings AL, Weiner NJ (1996) Environmental change in
Atlantic based on observations and modeling resu ts. eastern Greenlandurnthlat10yes:vinc
S Chin 13:1195-1219 from foraminifera and lithofacies in Nansen Fjord, 680 N.
Hansen J, Ruedy R, Glascoe J, Sato M (1999) GISS anall sis Holocene 6:171-191
of surface temperature change, J Geophys Res 1 4: Jenny B, Valero-Garces B, Urrutia R, Kelts K, Veit H, Appleby
30997-31022 PG, Geyh M (2002) Moisture changes and fluctuations of
Harris RN, Chapman DS (2001) Mid-latitude (30'to 600 N) :- the Westerlies in Mediterranean Central Chile duringithe
matic warmiing inferred by combining borehole tempe ad- last 2000 years: the Laguna Aculeo record (33o-50O 5).
tures with surface air temperatures. Geophys Res Iett Quat Tnt 87:3-18
28:747-750 Johnson TC, Barry 5, Chan Y, Wilkinson P (2001) Decadal
Haug GH, Hughen KA, Sigman DM, Peterson LC, Rohl U record of climate variability spanning the past 700 yr in
(2001) Southward migration of the intertropical conver- the Southern tropics of East Africa. Geology 29:83-86
gence zone through the holocene, Science 293:1304-1308 Jones PD, Briffa KR, Barnett TP, Tett SFB (1998) High-
Hendy EJ, Gagan MX, Alibert CA, McCulloch MT, Lough resolution palaeocliuatic records for tels ilnim
JM, lsactae PJ (2002) Abrupt decrease in tropical Paciic interpretation, integration and comparison with General
sea surface salinity at end of Little Ice Age. Scie ice Circulation Model control-run temperatures. Holocene 8:
295:1511-1514 455-471
Hiller A, Boettger T, Kremenetski C (2001) Mediaeval cli- Jones PD, New M, Parker DE, Martin S. Rigor IG (1999) Sur-
mnatic warming recorded by radiocarbon date alpine tee- face alr temperatures and its changes over the past 150
line shift on the Kola Peninsula, Russia. Holocene 11: years. Rev Geophys 37:173-199
491-497 Jones PD, Osborn TJ, Briff a KR (2001) The evolution of cli-
Hodell DA, Brenner M. Curtis JH, Guilderson, T (2001) 5 a mate over the last millennium. Science 292:662-667
forcing of drought frequency in the Maya lowla ds, Karldn W (1998) Climate variations and the enhanced green-
Science 292:1367-1370 house effect. Anibio 27: 270--274
Holzhauser H (1997) Fluctuations of the Grosser Ale sch Karl6f L, Winther JG, Isaksson E, Kohler JF and 10 others
Glacier and the Groner Glacier during the last 3200 yi ars: (2000) A 1500 year record of accumulation at Amund-
New results. In Frenzel B, Boulton GS, GIser B, Muckr ede senmsen western Dronning Maud Land, Antarctica,
U (eds) Glacier fluctuations during the Holoc ne, derived from electrical and radioactive measurements on
Akadernile der Wissenschaften und der Literatur, p 35 -58 a 120 mnice core. S Geophys Res 105: 12471-12483
Hong YT, Jiang HB, inu TS, Zhoul LP and S others (2 00) Kaser C (1999) A review of the modern fluctuations of tropical
Response of climate to solar forcing recorded in a 6 00- glaciers. Glob Planet Change 22:93-103
108 Chrin Res 23: 89-110, 2003
Keigwin LD (1996) The Uitile ice age and medieval war Er Luterbacher J, Rickli R, Tinguely C, Xoplaki E and 30 others
peniod in the Sargasso Sea. Science 274:1504-1508 (2000) Monthly mean pressure reconstruction for the late
Kitagdwafl, Matsufloto E(1995) Chinattcimplications of s'3 Maunder Minimum peniod (AD 1675-1715). Tnt J Clim
variations in a Japanese cedar cryptomeria japonica dudr g 20:1049-1066
the last two millenia. Geophys Res Lett 22:2155-2158 Madole RF (1994) Stratigraphic evidence of desertification mn
Knapp PA, Soulh PT, Grissino-Mayer HD (2001) Post-droug it the west-central Great Plains within the past 1000 yr.
growth responses of western juniper (Juniperus occide i- Geology 22:483-486
tails var. occident alis) in central Oregon. Geophys Res LE tt Manley G (1974) Central England temperatures: monthly
28:2657-2660 means 1659 to 1973. Quart J1 Roy Meteorol Soc 100:
Knappenberger PC, Michaels PJ, Davis RE (2001) Nature Df 389-405Glb-saetm
observed temperature changes across the United Stat s Mann ME, Bradley RS, Hughes MIK (1998) Goa-cl en
during the 20th century. Clim Res 17:45-53 perature patterns and climate forcing over the past six
Koerner RM (1977) Devon Island ice cap: core stratigraphy centuries. Nature 392:779-787
and paleodiliriate. Science 196:15-18 Mann ME, Bradley RS, Hughes MK (1999) Northern Hemi-
KoernerRPM, Fisher DA (1990) Arecord of Holocenresurnnr sphere temperatures during the past millennium: infer-
climate from a Canadian high-Arctic ice core. Nature 34 3: ences, uncertainties, and limitations. Geophys Res Lett
630-631 26:759-762
Korhola A, Weckstrbm, J, Holmstrimr L, Eristi5 P (2000) A Mann ME, Grille E, Bradley RS, Hughes MK, Overpeck J,
quantitative Holocene dclinatic record from diatoms mn Keimig FT, Gross W (2000) Global temperature patterns in
Northern Fennoscandia. Quat Res 54:284-294 past centuries: an interactive presentaion. Earth Interact
Kreutz KJ, Mayewski PA, Meeker LD, Twickler MS, Whitli w 4:1-29 [available online http:/IEarthinteraction.Org)
Si, Pittalwala II (1997) Bipolar changes in atmosphe- Marshall GJ, Lagun V, Lachlan-Cope TA (2002) Changes in
ric circulation during the Little Ice Age. Science 25 7: Antarctic Peninsula tropospheric temperatmres from 1956
1294-1296 to 1999: a synthesis of observations and reanalysis data.
Kuhnert H, Plitzold J, Schnetger B, Wefer G (2002) SE a- Int J Clim 22:291-310
surface temperature variability in the 16th century at Marshall J, Johnson H, Goodman J (2001) A study of the inter-
Bermuda inferred from coral records, Palaeogeogr Palm o- action of the North Atlantic oscillation with ocean circula-
dim Palaeoecol 179:159-171 tion. S Clim 14:1399-1421
Laird KR, Fritz SC, Maasch KA, Cumnming BF (1996) Greiner McDermott F, Mattey DP, Hawkesworth C (2001) Centen-
drought intensity and frequency before AD 1200 in I e nial-scale Holocene climate variability revealed by a high-
Northern Great Plains, USA. Nature 384:552-554 resolution speleothemn 6'"O record from SW Ireland. Sci-
Lamb HH (1965) The early medieval warm. epoch and its ence 294:1328-1331
sequel. Palaeogeogr PalaeochimlPalaeoecOl 1: 13-37 Meese DA, Cow AJ, Grootes P, Mayewski PA and 5 others
Lamb HH4 (1977) Climate-Past, Present and Future Vol. 2 (1994) The accumulation record from the GISP2 core as an
Climatic History and Future, Methuen indicator of the climate change throughout the Holocene,
Lamb HH (1982) Climate history and the modern wofld, Science 266: 1680-1682
Methuen Mercer .JH (1978) West Antarctic ice sheet and CO2 green-
Lamoureux SF, Bradley RS (1996) A late Holocene van ed house effect: a threat of disaster. Nature 271:321-325
sediment record of environmental change from north ~rn Morgan VI (1985) An oxygen isotope climate record from the
Ellesmere Island, Canada. J Paleolim 16:239-255 Law Dome, Antarctica. Chin, Change 7:415-426
Lara A, Villalba P (1993) A 3260-year temperature rec rd Mosley-Thompson B (1995) Paleoenvironmental conditions in
from Fltzroya cupressordes tree rings in southern So ith Antarctica since A.D. 1500: ice core evidence. In: Bradley
America. Science 260:1104-1106 RS, Jones PD (eds) Climate since A.D. 1500, Routledge,
Lawton ROD, Nair US, Pielke RA Sr, Welch RM (2001) Chim Itic New York, p 57 2 -5 9 1
impact of tropical lowland deforestation on nearby nm- Mosley-Thompson E, Thompson LEG (1982) Nine centuries of
tane cloud forests. Science 294:584-587 mnicroparticles deposition at the South Pole. Quat Res
Lewis TJ, Wang K (1998) Geothermal evidence for defore ta- 17:1-13 aino al un
tion induced warming: implications for the climatic impact Naurzbaev MM, Vaganov EA (2000) Variatol ferysm
Of land development. Geophys Res Left 25:535-538 mer and annual temperature in east Taymnir and Putorian
Li HC, Bischoff JL, Ku TL, Lund SP, StotWD(2 000) Clim~ate v ai- (Siberia) over the last two millernia. J Geophys Res 105:
-ability in East- Central Calif ornia during the past 1000 Y. ars 7317-7326anse-crcodfm
reflected by high-resolution geochemnical and isot pic Ogilvie AEJ (1984) The past climateanse-crcodfm
records from Owens Lake sedimnents. QuatRes 54: 189 197 Iceland. Part 1. Data to A.D. 1780. Chin Change 6:131-152
Liu K, Yao Z, Thompson LET (1998) A pollen record of Ogilvie A, Farmer G (1997) Documentinig the medieval cli-
Holocene climatic changes from Duinde ice cap, Qing iai- mate, In: Hulme M, Barrow E (eds) Climate of the British
Tibetan Plateau. Geology 26:135-138 Isles-present, past and future. Routledge, London,
Lotter AF, Birks HJB, Eicher V. Hofmann W, Schwandcr J, p 112-133
Wick L (2000) Younger Dryas Allerod sunimer tempera- Ogilvie ABS. JMnsson T (2001) 'Little Ice Age'research: a per-
tunes at Gerzensee (Swftzerland) inferred from f ssll spective from Iceland. Clim Change 48:9-52
pollen and cladoceran assemblages. Palaeogeogr Pali eo- Ogilvie AES. Barlow LK, Jennings AE (2000) North Atlantic
dlim, Palaeoecol 159:349-361 climate c. A.D. 1000: milflennial reflections on the Viking
Luckiman BH (2000) The Little Ice Age in the Canadian Rick- discoveries of Iceland, Greenland and North America.
res. Geornorph 32:357-384 Weather 55:34-45
Lucknman BH1, Briffa KR, Jones PD, Schweingruber FR (1)97) Overpeck J, Hughen K, Hardy D, Bradley P 14 others (1997)
Tree-ring based reconstruction of summer temperatur s at Arctic environmental change of the last four centuries.
Columbia Icefield, Alberta, Canada, AD 1073-1983. Science 278:1251-1256
Holocene 7:375-389 Pederson JL (2000) Holocene paleolakes of Lake Canyon,
Soon & Baliunas: Climatic and env onmental changes of the past 1000 years 109
Colorado Plateau: Paleodilmate and landscape response torical documentary data from East China during the last
from sedimentology and adlostratigraphy. Geol Soc Am r 2000 years. Sci in China Ser D (suppl) 42:91-100
Bull 112:147-158 Skinner WR, Majorowicz JA (1999) Regional climatic warm-
Perry CA, Hsu KJ (2000) Geophysical, archaeological, and ing and associated twentieth century land-cover changes
historical evidence support a solar-output model for cli- in north-western North America. Clim Res 12:39-52
mate change. Proc Nall Acad Sci USA 97:12433-12438 Slonosky VC, Yiour P (2001) The North Atlantic Oscillation
Petersen KL (1994) A warm and wet little climatic optimu and its relationship with near surface temperature. Geo-
and a cold and dry little ice age in the Southern Roc y phys Res Left 28:807-810
Mountains, USA. Clinm Change 26:243-269 Smith RC, Ainley D, Baker K, Domnack B and 7 others (1999)
Pfister C (1995) Monthly temperature and precipitation in ce i- Marine ecosystem sensitivity to climate change. Bio-
tral Europe 1525-1979: quantifying documentary evident e science 49:393-404
on weather and its effects. In: Bradley RS, Jones PD) (eds) Song J1 (2000) Changes in dryness/wetness in China during
Climate since A.D. 1500. Routledge, New York, p 118-142 the last 529 years. Int J Chin 20,1003-1015
Pfister C, Luterbacher J, Schwarz-Zanetti G, Weginann M Stahle DW, Cleaveland MK, Hehr J1G (1988) North Carolina
(1998) Winter air temperature variations in western climate changes reconstructed from tree rings: A.D. 372 to
Europe during the early and high Middle ages (A 1985. Science 240: 1517-1519rihinClfna
750-1300). 1-lolocene 8:535-552Stine 5 (1994) Extreme and persistent drouhinCifra
Pisas O 1978). paloceanogaph of5he5ant Barbra and Patagonia during medieval time. Nature 369:546-549
Basin during the last 8000 years. Quat Res 10:366-384 Stine S (1998) Medea lmtcaoayi h mrcs n
Portr SC(191) Gacioogial eidece o holcen chia c Issar AS, Brown N (eds) Water, environment and society in
change. In: Wigley TML, Ingram MI. Farmer G (eds) l i- times of clnnatic change. Kiuwer AcademicPesDo-
mate nd hitorystudis inpast climates and thlir recht, p 43- 6 7
imact on man. Cambridge Umiversity Press, Cainbrid e, Stuiver M, Groote M rzua F(95 h IP ~MP8- 1 climate record of the past 16,500 years and the role of the
Porter SC (1986) Pattern and forcing of the Northern He uoenadvlaos utRs4:4-5
sphere glacier variations during the last millennium. Qi at Swetnam TW (1993) Fire history and climate change in Giant
Res 26:27-48 Sequoia groves. Science 262:885-889
Proctor CJ, Baker A, Barnes WL, Gl~mour MA (2000) A th u- Tagaini Y (1993) Climate change reconstructed from histori-
sand year speleothem proxy record of North Atlantic .Ii- cal data in Japan. In: Proc hIt Syinp Global Change by
mate from Scotland. Clim Dyn 16:815-820 IGBP March 27-29 1992, Tokyo. International Geosphere-
Ramesh R (1993) First evidence for Little Ice Age and Biospher trogaieimate okyonp7 the2
Medieval Warming in India (abstract). EOS Trans A 3U Tagamii Y (1996) Some remarks on teciaei h
suppi 74: 118 Medieval Warm Period of Japan. In: Mikaini T,
Ren 6 (1998) Pollen evidence for increased summer rain all Matsumoto B, Ohta 5, Sweda T (eds) Paleoclimate and
in he ediva Wam Prid a MaiNorheat hi ra. environmental variability in Austral-Asian tranisect
Geophys Res Lett 25:1931-1934 during the pas 200yas(gBProceedIGs. INtra-oa
Robinson WA, Hansen J, Ruedy R (2001) Where's the hn at? tional Geosphere-Biosphere Proga e-BPNgo,
Insights from GCM experiments into the lack of East arn p 115-11995ThArtcfo SvladoSerny
U.S. warming. American Meteor Soc 81st Annual M et- Tarussov A (1995 h rtcfo vladt eeny
ing, lbuqerqu NMJanury 1-19 2001 (abstr Ct) Zemily: climatic reconstructions from ice cores. In Bradley
American Meteorological Society, Washington DC RS, Jones PD(esClmtSicA..10,Ruede
Rodrigo FS, Esteban-Parra MJ, Pozo-Vdzquez D, Castro-Dfez New York, p 505- 5 16
Y (2000) Rainfall variability in southern Spain on deci dal Thomas RH, Sanderson TJO, Rose KE (1979) Effect of climatic
to centennial ti~me scales. Int J Chim 20:721-732 warming on the West Antarctic ice sheet. Nature 277:
Rott H, Skvarca P, Nagler T (1996) Rapid collapse of nort ern 355-358 frcmt hnei
Larsen ice shell, Antarctica. Science 271:788-792 Thompson LG (2000) ice core evidence for climat changev in
Schleser CH, Helle G, Lulcke A, Vos H (1999) Isotope Sig als the Tropics: implications for our future.Qa c e 9
as cllimate proxies: the role of transfer functions in the 19-35
study of terrestrial archives. Quat Sci Rev 18:927-943 Thompson LG, Mosley-Thompson E, Dansgaard W, Grootes
schmutz C, Luterbacher J1, Gyalistras D, Xoplaki E, Wann r H PM (1986) The littie ice age as recorded in the stratigraphy
(2000) Can we trust proxy-based NAC index reconst ruc- of the tropical Quelccaya ice cap. Science 234:361-364
lions? Geophys Res Lett 27,1135-1138 Thompson LG, Mosley-Thompson E, Davis ME, Bolzan JF
Schuster PP. White DE, Nafti DL, Cecil LD (2000) Chron log- and 6 others (1989) Holocene-Late Pleistocene clunatic
ical refinement of an ice core record at Upper Fremont ice core records from Qinghai-Tibetan plateau. Science
Glacier in south central North America. J Geophys Res 246:474-477
105:7317-7326 Thompson LG, Peel DA, Mosley-Thompson E, Mulvaney R.
Scuderi LA (1993) A 2000-year tree ring record of annual em- Dar J, i~n PN, Davis ME, Raymond CF (1994) Climate
peraure intheSiera Nvad montans.Science 259: since AD 1510 on Dyer Plateau, Antarctic Peninsula: evi-
1433:1436 h SeraNead outan dence for recent climate change. Ann Glaciol 20:420-426
14eager4R, Kuhi VsekM, Naik N, MillerSJ, ]rah n Thompson LG, Mosley.Thompson E. Davis ME, Lin PN, DaiSJ,
Sege0, Cusleni H , (20)iasbes oAtaiccencImaea Boizan iF. Yao T (1995) A 1000 year climate ice-core
ability between 1958 and 1998. J Chin 13:2845-2862 rcr rmteGly c aCia t eainhpt
Serre-Bachet F (1994) Middle ages temperature recons ruc- global climate variability. Ann Glaciol 21:175-181
tions; in Europe, a focus on Northeastern Italy. hlim Thompson LG, Yao T, Mosley-Thompsonl E, Davis ME, Hen-
Change 26:213-240 derson KA, Lin PN (2000) A high-resolution millennial
Shi Y. Yao T. Yang B (1999) Decadal climatic variatons record of the South Asian Monsoon from Himalayan ice
recorded in GUliya ice core and comparison with the his- cores. Science 289:1916-1919
A ~~~110 ChinmRe, 23: 89-110, 2003
Till , Guot J(1990) Reconstruction of precipitation n Villalba R (1990) Climatic fluctuations in northern Patagonia
Morocco since 1100 AD. based on Cedrus atlantica ftre- during the last100yassinerdfo te-ig
ring widths. Quat Res 33:337-351 records. Quat Res 34:346-360
Tong G, Zhang J1, Fan 5, Zhao 3, Wang G, Wang Y, Wang L, Villalba R (1994) Tree-rngq and glacial evidence for the
Gui J (1996) Environmental changes at the top of Tail al medieval warm epoch and the little ice age in southern
Mountain, Qinling since lka ago. Mar Geolf Quat Geol 16: South America. Gim. Change 26:183-197
95-104 von Storch JS, Muiller P. Bauer E (2001) Climate vaniability in
Tyson PD, Lindesay JA (1992) The climate of the last 2000 mun~imnulm integrations with coupled atmnosphere-Ocean
yeas i sothen Aric. Hlocne :27-278 GCMs: a spectral view. Ghim Dyn 17:375-389
TyeasoinPD KathrlnWHorn Krca HeisseGA (:200)Te1i Williams PW, Marshall A, Ford DC, Jernkinson AV (1999)
Ice Age and medieval warming in South Africa. So th Paaolatciereainofsbeioopdtarm
African J Sci 96:121-12 6 holocene speleotheims of the Waitomo, district, North
Valero-Garc(5s BL, DelgadoHuertas A, Ratto N, Navas A, Island, New Zealand. H-olocene 9:649-657
Edwards L (2000) Paleohydrology of Andean saline takes Wilson AT, H-endy CH, Reynolds CF (1979) Short-term cli-
fromsedmenologcalandisotopic records, Northwest rn mate change and New Zealand temperatures during the
Argentina. J Paleolimfololgy 24:343-359 lastmilennim.tatue 27:31-31
van Engelen AFV, Buisman 3, Ijnsen F (2001) A mnilenniU Of Winkler 5 (2000) The 'Little Ice Age' maiuintesth
weather, winds and water in the low countries, In: Jo es ern Alps, New Zealand: prelimlinary results at Mueller
PD, Ogilvie AEJ, Davies TD), Briffa KCR (eds) History u d Glacier. Holocefle 10:643-647
climate-memories of the future? IKluwer Academic P lb- Winter A, Ishioroshi H-, Watanabe T, Oba T, Christy J (2000)
lishers, New York, p 101-124 Carribean sea surface temperatures: two-to-three degrees
Vaughan DG, Doake CSM (1996) Recent atmospheric wa m- cooler than present during the Little Ice Age. Geophys Res
ingandreteatof ce heles on the Antarctic Penins ila. Lett 27 :3365-3368
iNgatu rtre39:2833 WoodhouselCA, Overpeck JT (1998) 2000 years of drought
Verardo 5, Gronin T, Willard D, Kerhin R (1998) Climate ind vanability in the central United states. Bull Am Meteor
environmental changes recorded by Chesapeake 3ay Soc 79:2693-2714
Dinoflagellate cysts in the last millennium. Geol Soc er Yu Z, Ito E (1999) Possible solar forcing of century-scale
Abs 74: 284 drought frequency in the northern Great Plains. Geology
Verschuren D, Laird KR, Cumniing BF (2000) Rainfall nd. 27:262-266 secoftemdvl
drought in equatonial east Africa'during the past 1 100 Zhang D (1994) Evidence for the exisene2o8te mdiva
years. Nature 403:410-414 warm period in China. Chin Change 26:8-9
Editorial responsibility: Chris de Freitas, Submitted: Apfil Ii, 2002; AcceptFed: August 29, 2002
Auckland, Now Zealand Proofs received from author(s): Januvary 3, 2003